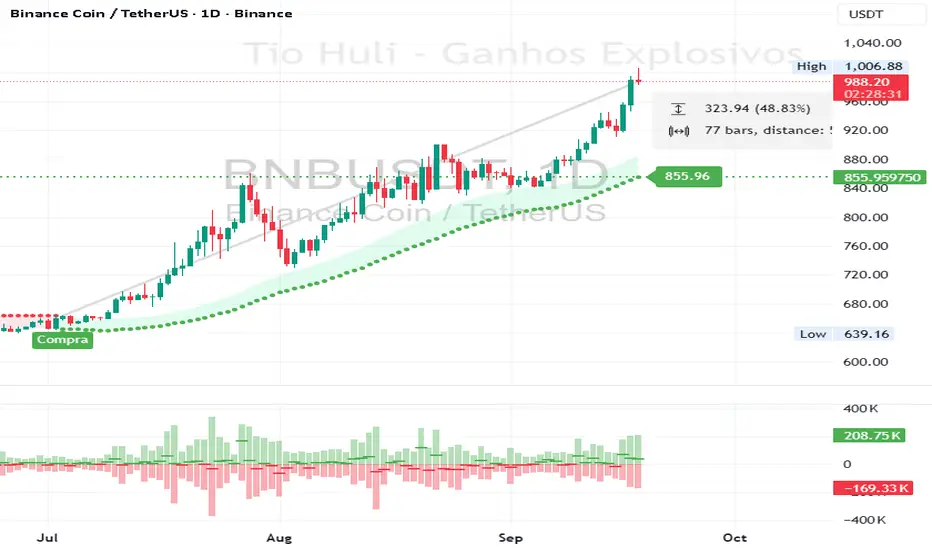
CHiLo — Custom HiLo (SMA/EMA, Activator, Shading, Auto-Decimals)CHiLo is a clean Hi/Lo trend read with SMA/EMA options, a HiLo vs. HiLo Activator mode, optional band shading , and a right-side HiLo marker with automatic decimals based on the symbol. Optional Buy/Sell labels mark state flips. Inspired by the broader trend-following literature and practitioners; in Brazil, educator Hulisses “Tio Huli” Dias is a notable voice popularizing trend following.
What it does
CHiLo plots a Hi/Lo state with two modes:
HiLo (classic high/low bands)
HiLo Activator (activator-style behavior)
It includes:
SMA/EMA selection
Optional shading between Hi/Lo bands
Optional Buy/Sell labels on state flips
HiLo marker (auto-decimals from the symbol’s tick size)
Goal: deliver a fast, visual trend context that you can pair with your own risk rules and confirmations.
How to use
Add the indicator and choose Mode (HiLo / Activator) and MA type (SMA/EMA).
Tune Period (and Offset if needed). Higher = smoother (fewer flips); lower = more responsive.
Toggle Shading to emphasize the envelope.
Toggle Buy/Sell labels if you want flip markers.
Use the HiLo marker on the right to read the current level (auto-formatted).
Inputs (quick reference)
Period / Offset — sensitivity vs. delay.
Type — HiLo or HiLo Activator.
MA Type — SMA (steadier) or EMA (snappier).
HiLo Style — Points or Line.
Shading & Transparency — highlight the band area.
Buy/Sell Labels — on/off.
HiLo Marker — size and horizontal offset (decimals automatic).
Notes & credits
Educational use only; not financial advice.
For best results, combine with position sizing, stops, and regime filters.
Search in scripts for "band"
PCV (Darren.L-V2)Description:
This indicator combines Bollinger Bands, CCI, and RVI to help identify high-probability zones on M15 charts.
Features:
Bollinger Bands (BB) – displayed on the main chart in light gray. Helps visualize overbought and oversold price levels.
CCI ±100 levels + RVI – displayed in a separate sub-window:
CCI only shows the ±100 reference lines.
RVI displays a cyan main line and a red signal line.
Valid Zone Detection:
Candle closes outside the Bollinger Bands.
RVI crosses above +100 or below -100 (CCI level reference).
Candle closes back inside the BB, confirming a price rebound.
Requires two touches in the same direction to confirm the zone.
Only zones within 20–30 pips range are considered valid.
Usage:
Helps traders spot reversal or bounce zones with clear visual signals.
Suitable for all indices, Forex, and crypto on M15 timeframe.

RSI Crossover AlertRSI Crossover Alert Indicator - User Guide
The RSI Crossover Alert Indicator is a comprehensive technical analysis tool that detects multiple types of RSI crossovers and generates real-time alerts. It combines traditional RSI analysis with signal lines, divergence detection, and multi-level crossing alerts.
1. Multiple Crossover Detection
- RSI/Signal Line Cross: Signals a primary trend change.
- RSI/Second Signal Cross: Confirmation signals for stronger trends.
- Level Crossings: Crosses of Overbought 70, Oversold 30, and Midline 50.
- Divergence Detection: Hidden and regular divergences for reversal signals.
2. Alert Types
- Alert: RSI > Signal
Description: Bullish momentum is building.
Signal: Consider long positions.
- Alert: RSI < Signal
Description: Bearish momentum is building.
Signal: Consider short positions.
- Alert: RSI > 70
Description: Entering the overbought zone.
Signal: Prepare for a potential reversal.
- Alert: RSI < 30
Description: Entering the oversold zone.
Signal: Watch for a bounce opportunity.
- Alert: RSI crosses 50
Description: A shift in momentum.
Signal: Trend confirmation.
3. Visual Components
- Lines: RSI blue, Signal orange, Second Signal purple
- Histogram: Visualizes momentum by showing the difference between RSI and the Signal line.
- Background Zones: Red overbought, Green oversold
- Markers: Up/down triangles to indicate crossovers.
- Info Table: Real-time RSI values and status.
Strategy 1: Classic Crossover
- Entry Long: RSI crosses above the Signal Line AND RSI is below 50.
- Entry Short: RSI crosses below the Signal Line AND RSI is above 50.
- Take Profit: On the opposite signal.
- Stop Loss: At the recent swing high/low.
Strategy 2: Extreme Zone Reversal
- Entry Long: RSI is below 30 and crosses above the Signal Line.
- Entry Short: RSI is above 70 and crosses below the Signal Line.
- Risk Management: Higher win rate but fewer signals. Use a minimum 2:1 risk-reward ratio.
Strategy 3: Divergence Trading
- Setup: Enable divergence alerts and look for price/RSI divergence. Wait for an RSI crossover for confirmation.
- Entry: Enter on the crossover after the divergence appears. Place the stop loss beyond the starting point of the divergence.
Strategy 4: Multi-Timeframe Confirmation
1. Check the higher timeframe e.g. Daily to identify the main trend.
2. Use the current timeframe e.g. 4H/1H for your entry.
3. Only enter in the direction of the main trend.
4. Use the RSI crossover as the entry trigger.
Optimal Settings by Market
- Forex Major Pairs
RSI Length: 14, Signal Length: 9, Overbought/Oversold: 70/30
- Crypto High Volatility
RSI Length: 10-12, Signal Length: 6-8, Overbought/Oversold: 75/25
- Stocks Trending
RSI Length: 14-21, Signal Length: 9-12, Overbought/Oversold: 70/30
- Commodities
RSI Length: 14, Signal Length: 9, Overbought/Oversold: 80/20
Risk Management Rules
1. Position Sizing: Never risk more than 1-2% on a single trade. Reduce size in ranging markets.
2. Stop Loss Placement: Place stops beyond the recent swing high/low for crossovers. Using an ATR-based stop is also effective.
3. Profit Taking: Take partial profits at a 1:1 risk-reward ratio. Switch to a trailing stop after reaching 2:1.
1. Filtering Signals
- Combine with volume indicators.
- Confirm the trend on a higher timeframe.
- Wait for candlestick pattern confirmation.
2. Avoid Common Mistakes
- Don't trade every single crossover.
- Avoid taking signals against a strong trend.
- Do not ignore risk management.
3. Market Conditions
- Trending Market: Focus on midline 50 crosses.
- Ranging Market: Look for reversals from overbought/oversold levels.
- Volatile Market: Widen the overbought/oversold levels.
- If you get too many false signals:
Increase the signal line period, add other confirmation indicators, or use a higher timeframe.
- If you are missing major moves:
Decrease the RSI length, shorten the signal line period, or check your alert settings.
Recommended Combinations
1. RSI + MACD: For dual momentum confirmation.
2. RSI + Bollinger Bands: For volatility-adjusted signals.
3. RSI + Volume: To confirm the strength of a signal.
4. RSI + Moving Averages: To use as a trend filter.
This indicator provides a comprehensive RSI analysis. Success depends on proper configuration, risk management, and combining signals with the overall market context. Start with the default settings, then optimize based on your trading style and market conditions.

BTC 1m Chop Top/Bottom Reversal (Stable Entries)Strategy Description: BTC 5m Chop Top/Bottom Reversal (Stable Entries)
This strategy is engineered to capture precise reversal points during Bitcoin’s choppy or sideways price action on the 5-minute timeframe. It identifies short-term tops and bottoms using a confluence of volatility bands, momentum indicators, and price structure, optimized for high-probability scalping and intraday reversals.
Core Logic:
Volatility Filter: Uses an EMA with ATR bands to define overextended price zones.
Momentum Divergence: Confirms reversals using RSI and MACD histogram shifts.
Price Action Filter: Requires candle confirmation in the direction of the trade.
Locked Signal Logic: Prevents repaints and disappearing trades by confirming signals only once per bar.
Trade Parameters:
Short Entry: Above upper band + overbought RSI + weakening MACD + bearish candle
Long Entry: Below lower band + oversold RSI + strengthening MACD + bullish candle
Take Profit: ±0.75%
Stop Loss: ±0.4%
This setup is tuned for traders using tight risk control and leverage, where execution precision and minimal drawdown tolerance are critical.

WRAMA Channel (Weighted RSI ATR MA)OVERVIEW
The WRAMA Channel (Weighted RSI ATR MA) is an advanced technical analysis tool designed to react more quickly to price movements compared to indicators using conventional moving averages. It combines the Relative Strength Index (RSI), Average True Range (ATR), and a weighted moving average, resulting in the WRAMA. This indicator forms a dynamic price channel based on a weighted average that incorporates both trend strength (via RSI) and market volatility (via ATR). It helps traders identify trends, potential reversals, and breakout signals, while offering broad customization options.
Key Features
WRAMA Price Channel:
Generates a dynamic channel around the weighted moving average (WRAMA), adapting to market volatility and momentum, similar to Bollinger Bands. Users are encouraged to adjust channel width and length according to their strategy.
The upper and lower channel bands are calculated based on a percentage deviation from the baseline line.
The channel fill color changes depending on the price's position relative to the baseline (green above, red below), with an optional gradient for better visualization.
Weighted Moving Average (WRAMA):
WRAMA is a custom weighted moving average (MA1), where closing prices are weighted based on RSI and ATR, allowing it to dynamically adapt to market conditions.
Baseline: The WRAMA line calculated over a user-defined period.
WRAMA Calculation:
RSI Weight: Based on RSI value. When RSI is in extreme zones (below the lower threshold or above the upper threshold), an extreme weight is applied. Otherwise, the weight is based on the squared RSI value divided by 100, raised to a power defined by the rsi_weight_factor.
ATR Weight: Based on the ATR-to-average-ATR ratio. If ATR exceeds a threshold (atr_threshold × avg_atr), an extreme weight is applied. Otherwise, the weight is based on the squared ratio of ATR to average ATR, raised to the power of the atr_weight_factor.
Combined Weight: RSI and ATR weights are combined using a rsi_atr_balance parameter. Final weight = RSI weight × balance + ATR weight × (1 - balance).
WRAMA Calculation: The closing price is multiplied by the combined weight. The result is averaged over the ma_length period and divided by the average of the weights, forming the WRAMA line. For current WRAMA (ma_length = 1), the calculation simplifies to a single weighted price.
Additional Moving Averages:
For additional confirmations, the indicator supports up to five moving averages (MA1–MA5) with various types (SMA, EMA, WMA, HMA, ALMA) and customizable periods.
All additional MAs are calculated based on WRAMA or its baseline, ensuring consistency and enabling deeper analysis within a unified methodology. MA trend directions can be tracked in a built-in signal table.
Trading Signals:
Breakout Signals: Breakouts above/below the channel are optionally marked with triangle shapes (green for bullish, red for bearish).
MA Signals: Price position relative to MAs or their slope generates bullish/bearish signals. These are optionally visualized with default triangles (green up, red down).
A signal table in the top-right corner summarizes the status of each moving average – bullish, bearish, or neutral.
Customization Options
Channel Settings:
MA Period: Length of the WRAMA baseline (default: 100).
Channel Deviation : Percentage offset from the baseline for upper/lower bands (default: 1.5%).
RSI Settings:
RSI Period: Length of the RSI calculation (default: 14).
RSI Upper/Lower Threshold: Overbought/oversold levels (default: 70/30).
RSI Weight Factor: Influence of RSI on weighting (default: 2.0).
ATR Settings:
ATR Period: ATR calculation length (default: 14).
ATR Threshold: Volatility threshold as a multiple of average ATR (default: 1.5).
ATR Weight Factor: Influence of ATR on weighting (default: 2.0).
RSI & ATR Combined:
Extreme Weight: Weight applied in extreme RSI/ATR conditions (default: 3.0).
RSI/ATR Balance: Balance between RSI and ATR influence (default: 0.5).
Signal Settings:
Show Breakout Signals: Enable/disable breakout triangles.
Show MA Signals: Enable/disable MA-based signals.
MA Signal Source: Choose between current WRAMA or baseline.
MA Signal Analysis: Based on price position or slope.
Neutral Threshold : Minimum distance from MA for signal neutrality (default: 0.5%).
Minimum MA Slope : Minimum slope for trend direction signals (default: 0.01%).
Moving Averages (MA1–MA5):
Options to enable/disable, select type (SMA, EMA, WMA, HMA, ALMA), set period length, and choose color.
Style Settings:
Gradient Fill: Enable/disable gradient coloring within the channel.
Show Baseline: Enable/disable WRAMA baseline visibility.
Colors: Customize line, fill, and signal colors.
Use Cases
Trend Identification: The WRAMA channel highlights trend direction and potential reversal zones when price contacts the channel edges.
Breakout Signals: Channel breakouts may indicate trend shifts or momentum surges.
MA Analysis: The signal table provides a clear summary of market direction (bullish, bearish, or neutral) based on selected moving averages.
Trading Strategies: Suitable for trend-following, mean-reversion, and scalping strategies, depending on user preferences and settings.
Notes
The indicator offers a high degree of flexibility, making it adaptable to various trading styles, instruments, and timeframes.
It is recommended to adjust channel length and width to fit your trading strategy.
Backtesting settings on historical data is advised to optimize parameters for a specific strategy and market.

Volatility-Adjusted Momentum Score (VAMS) [QuantAlgo]🟢 Overview
The Volatility-Adjusted Momentum Score (VAMS) measures price momentum relative to current volatility conditions, creating a normalized indicator that identifies significant directional moves while filtering out market noise. It divides annualized momentum by annualized volatility to produce scores that remain comparable across different market environments and asset classes.
The indicator displays a smoothed VAMS Z-Score line with adaptive standard deviation bands and an information table showing real-time metrics. This dual-purpose design enables traders and investors to identify strong trend continuation signals when momentum persistently exceeds normal levels, while also spotting potential mean reversion opportunities when readings reach statistical extremes.
🟢 How It Works
The indicator calculates annualized momentum using a simple moving average of logarithmic returns over a specified period, then measures annualized volatility through the standard deviation of those same returns over a longer timeframe. The raw VAMS score divides momentum by volatility, creating a risk-adjusted measure where high volatility reduces scores and low volatility amplifies them.
This raw VAMS value undergoes Z-Score normalization using rolling statistical parameters, converting absolute readings into standardized deviations that show how current conditions compare to recent history. The normalized Z-Score receives exponential moving average smoothing to create the final VAMS line, reducing false signals while preserving sensitivity to meaningful momentum changes.
The visualization includes dynamically calculated standard deviation bands that adjust to recent VAMS behavior, creating statistical reference zones. The information table provides real-time numerical values for VAMS Z-Score, underlying momentum percentages, and current volatility readings with trend indicators.
🟢 How to Use
1. VAMS Z-Score Bands and Signal Interpretation
Above Mean Line: Momentum exceeds historical averages adjusted for volatility, indicating bullish conditions suitable for trend following
Below Mean Line: Momentum falls below statistical norms, suggesting bearish conditions or downward pressure
Mean Line Crossovers: Primary transition signals between bullish and bearish momentum regimes
1 Standard Deviation Breaks: Strong momentum conditions indicating statistically significant directional moves worth following
2 Standard Deviation Extremes: Rare momentum readings that often signal either powerful breakouts or exhaustion points
2. Information Table and Market Context
Z-Score Values: Current VAMS reading displayed in standard deviations (σ), showing how far momentum deviates from its statistical norm
Momentum Percentage: Underlying annualized momentum displayed as percentage return, quantifying the directional strength
Volatility Context: Current annualized volatility levels help interpret whether VAMS readings occur in high or low volatility environments
Trend Indicators: Directional arrows and change values provide immediate feedback on momentum shifts and market transitions
3. Strategy Applications and Alert System
Trend Following: Use sustained readings beyond the mean line and 1σ band penetrations for directional trades, especially when VAMS maintains position in upper or lower statistical zones
Mean Reversion: Focus on 2σ extreme readings for contrarian opportunities, particularly effective in sideways markets where momentum tends to revert to statistical norms
Alert Notifications: Built-in alerts for mean crossovers (regime changes), 1σ breaks (strong signals), and 2σ touches (extreme conditions) help monitor multiple instruments for both continuation and reversal setups

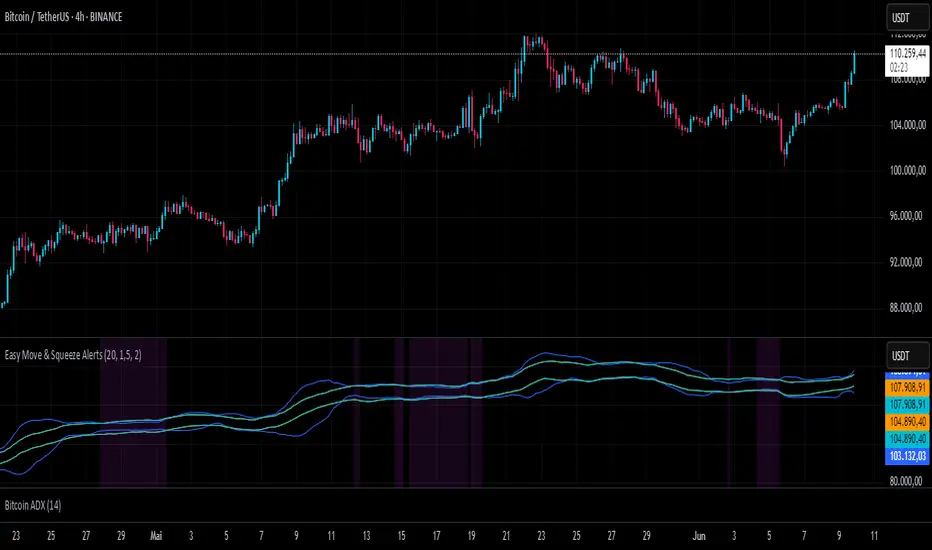
Easy Move & Squeeze Alerts1. Overview
The Easy Move & Squeeze Alerts indicator combines two proven techniques to help you anticipate major price swings and spot volatility compressions (long/short squeezes) early on. It offers:
Automated Alerts via TradingView’s alert engine
On-chart Visual Cues for immediate context
Flexible Inputs to fine-tune sensitivity, lookback length, and display options
2. TTM Squeeze (Volatility Compression)
Core Concept: Compares Bollinger Bands (standard deviation channels) with Keltner Channels (ATR-based channels).
Squeeze On: BBs lie completely inside Keltner Channels → volatility is compressed, signaling a potential buildup.
Squeeze Off: BBs break outside Keltner Channels → typically the start of a strong directional move.
Alert: When the squeeze releases, the indicator fires an alert:
💥 Squeeze Release – Volatility incoming!
Chart Label: A small, purple “🔒 Squeeze” label appears above the high of each bar while compression persists, giving you a real-time visual flag.
3. ATR Breakouts (Detecting Large Moves)
Core Concept: Builds a dynamic price channel around an EMA using ATR (Average True Range) multiplied by your chosen factor.
Cross Events:
Price crosses above the upper ATR band → potential bullish breakout.
Price crosses below the lower ATR band → potential bearish breakdown.
Alert Conditions: Separate alert triggers for “🚀 Move Up” and “📉 Move Down” fire the moment the close breaches the ATR-based bounds.
4. Visualization & Usage
Channel Plots:
Bollinger Bands in blue
Keltner Channels in orange
ATR Channels in aqua (optional)
Toggle all channel plots on or off with the showZones input.
Background Highlight: During a squeeze, the chart background lightly tints purple for quick visual confirmation.
Alerts Setup:
Simply click Create Alert in TradingView, select this indicator, and choose the event(s) you want (squeeze release, ATR breakouts).
You can route notifications via email, webhook, SMS, or platform pop-ups.
5. Deployment & Customization
Timeframes: Effective across all timeframes; most popular for day- and swing-trading.
Parameter Tuning:
Increase the len value to smooth channels and focus on only the most significant compressions/moves.
Adjust the ATR or BB multipliers to make alerts more or less sensitive.
With this indicator, you gain a clear, actionable framework for spotting both volatility squeezes and breakouts before they unfold—empowering you to enter trades ahead of the crowd. Enjoy customizing and putting it to work!
Vix_Fix Enhanced MTF [Cometreon]The VIX Fix Enhanced is designed to detect market bottoms and spikes in volatility, helping traders anticipate major reversals with precision. Unlike standard VIX Fix tools, this version allows you to control the standard deviation logic, switch between chart styles, customize visual outputs, and set up advanced alerts — all with no repainting.
🧠 Logic and Calculation
This indicator is based on Larry Williams' VIX Fix and integrates features derived from community requests/advice, such as inverse VIX logic.
It calculates volatility spikes using a customizable standard deviation of the lows and compares it to a moving high to identify potential reversal points.
All moving average logic is based on Cometreon's proprietary library, ensuring accurate and optimized calculations on all 15 moving average types.
🔷 New Features and Improvements
🟩 Custom Visual Styles
Choose how you want your VIX data displayed:
Line
Step Line
Histogram
Area
Column
You can also flip the orientation (bottom-up or top-down), change the source ticker, and tailor the display to match your charting preferences.
🟩 Multi-MA Standard Deviation Calculation
Customize the standard deviation formula by selecting from 15 different moving averages:
SMA (Simple Moving Average)
EMA (Exponential Moving Average)
WMA (Weighted Moving Average)
RMA (Smoothed Moving Average)
HMA (Hull Moving Average)
JMA (Jurik Moving Average)
DEMA (Double Exponential Moving Average)
TEMA (Triple Exponential Moving Average)
LSMA (Least Squares Moving Average)
VWMA (Volume-Weighted Moving Average)
SMMA (Smoothed Moving Average)
KAMA (Kaufman’s Adaptive Moving Average)
ALMA (Arnaud Legoux Moving Average)
FRAMA (Fractal Adaptive Moving Average)
VIDYA (Variable Index Dynamic Average)
This gives you fine control over how volatility is measured and allows tuning the sensitivity for different market conditions.
🟩 Full Control Over Percentile and Deviation Conditions
You can enable or disable lines for standard deviation and percentile conditions, and define whether you want to trigger on over or under levels — adapting the indicator to your exact logic and style.
🟩 Chart Type Selection
You're no longer limited to candlestick charts! Now you can use Vix_Fix with different chart formats, including:
Candlestick
Heikin Ashi
Renko
Kagi
Line Break
Point & Figure
🟩 Multi-Timeframe Compatibility Without Repainting
Use a different timeframe from your chart with confidence. Signals remain stable and do not repaint. Perfect for spotting long-term reversal setups on lower timeframes.
🟩 Alert System Ready
Configure alerts directly from the indicator’s panel when conditions for over/under signals are met. Stay informed without needing to monitor the chart constantly.
🔷 Technical Details and Customizable Inputs
This indicator includes full control over the logic and appearance:
1️⃣ Length Deviation High - Adjusts the lookback period used to calculate the high deviation level of the VIX logic. Shorter values make it more reactive; longer values smooth out the signal.
2️⃣ Ticker - Choose a different chart type for the calculation, including Heikin Ashi, Renko, Kagi, Line Break, and Point & Figure.
3️⃣ Style VIX - Change the visual style (Line, Histogram, Column, etc.), adjust line width, and optionally invert the display (bottom-to-top).
📌 Fill zones for deviation and percentile are active only in Line and Step Line modes
4️⃣ Use Standard Deviation Up / Down - Enable the overbought and oversold zone logic based on upper and lower standard deviation bands.
5️⃣ Different Type MA (for StdDev) - Choose from 15 different moving averages to define the calculation method for standard deviation (SMA, EMA, HMA, JMA, etc.), with dedicated parameters like Phase, Sigma, and Offset for optimized responsiveness.
6️⃣ BB Length & Multiplier - Adjust the period and multiplier for the standard deviation bands, similar to how Bollinger Bands work.
7️⃣ Show StdDev Up / Down Line - Enable or disable the visibility of upper and lower standard deviation boundaries.
8️⃣ Use Percentile & Length High - Activate the percentile-based logic to detect extreme values in historical volatility using a customizable lookback length.
9️⃣ Highest % / Lowest % - Set the high and low percentile thresholds (e.g., 85 for high, 99 for low) that will be used to trigger over/under signals.
🔟 Show High / Low Percentile Line - Toggle the visual display of the percentile boundaries directly on the chart for clearer signal reference.
1️⃣1️⃣ Ticker Settings – Customize parameters for special chart types such as Renko, Heikin Ashi, Kagi, Line Break, and Point & Figure, adjusting reversal, number of lines, ATR length, etc.
1️⃣2️⃣ Timeframe – Enables using SuperTrend on a higher timeframe.
1️⃣3️⃣ Wait for Timeframe Closes -
✅ Enabled – Displays Vix_Fix smoothly with interruptions.
❌ Disabled – Displays Vix_Fix smoothly without interruptions.
☄️ If you find this indicator useful, leave a Boost to support its development!
Every feedback helps to continuously improve the tool, offering an even more effective trading experience. Share your thoughts in the comments! 🚀🔥

2-Day Volume Weighted Average Price (VWAP)This indicator extends TradingView’s built-in VWAP by calculating a volume-weighted average price over a continuous two-day window (yesterday + today), anchoring VWAP at the start of yesterday’s session and carrying it through to today’s close, but only plotting the segment that falls within the current trading session—yesterday’s data feeds into the calculation to ensure today’s VWAP reflects the prior session’s volume and price action, while the line drawn on your chart always begins at today’s session open.
Standard Deviation Bands: Optional ±1σ, ±2σ, and ±3σ envelopes, exactly as in the default VWAP, but based on the rolling two-day data.

SD Median MVRV-Z🧠 Overview
SD Median MVRV-Z is a trend-following indicator that uses on-chain valuation signals as a supportive filter. It blends the momentum of the MVRV Z-score with a dynamic median-based price structure to provide cleaner, more reliable directional signals. This tool is designed to identify when price and trend align with favorable broader context — not to pinpoint overbought or oversold extremes.
🧩 Key Features
Trend-Following Core: Signals are built around directional strength, not reversion.
MVRV Z-Score Momentum: Utilizes the statistical momentum of Market Cap vs Realized Cap as a macro trend driver.
Rolling Median Filter: Applies a price-based condition to ensure trend signals are not triggered during short-term counter-moves or noise.
Threshold Customization: Input controls allow traders to define the strength required to trigger long or short signals.
Dynamic Visualization: Candle coloring and filled zones provide instant feedback on current market regime.
🔍 How It Works
Trend Signal: The MVRV ratio is normalized via Z-scoring to produce a momentum-like signal based on how far current valuation deviates from its rolling average.
Price Filter: A rolling median and standard deviation of price define an upper and lower band. These serve to filter out MVRV-Z signals that occur when price is moving against the perceived direction.
Signal Logic:
Long signal = MVRV-Z above threshold and price is not in the lower volatility band.
Short signal = MVRV-Z below threshold, regardless of price band (more aggressive condition).
Directional Engine (CD): Encodes the market regime state (1 for long, -1 for short, 0 for neutral), and drives all visual outputs.
🔁 Use Cases & Applications
Momentum Confirmation: Identify when on-chain momentum and price structure both confirm a trend direction.
Reduced Whipsawing: Filter out weak or conflicting trend signals that would otherwise lead to false entries.
Best Suited for BTC: This indicator is specifically tailored for Bitcoin, using BTC’s Market Cap and Realized Cap data from on-chain sources.
✅ Conclusion
SD Median MVRV-Z is a trend-centric tool that ensures directional conviction by requiring agreement between price structure and underlying market momentum. It is not meant to detect tops or bottoms, but instead to help traders participate in sustainable moves with greater confidence.
⚠️ Disclaimer
The content provided by this indicator is for educational and informational purposes only. Nothing herein constitutes financial or investment advice. Trading and investing involve risk, including the potential loss of capital. Always backtest and apply risk management suited to your strategy.

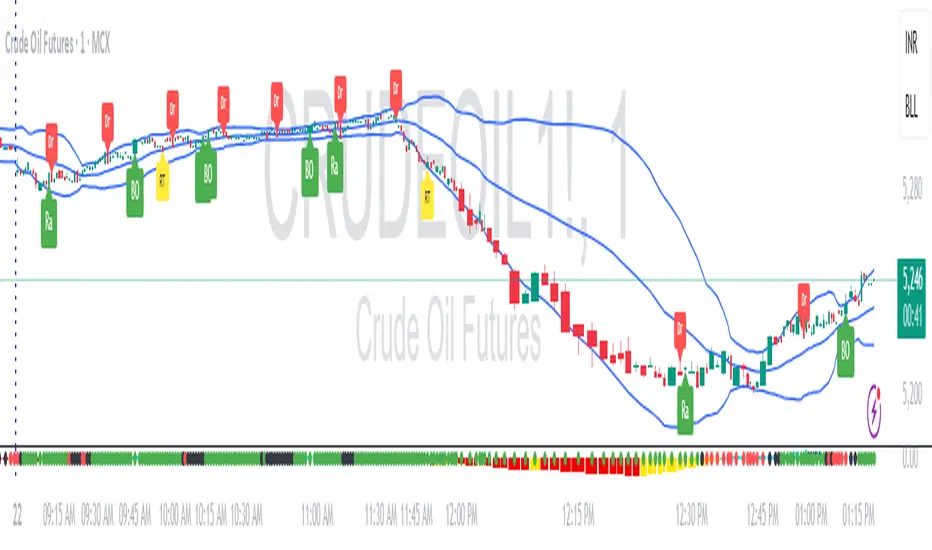
RDBRB Strategy with Filters + Cooldowns + LabelsRDBRB Strategy with Filters + Cooldowns
This script implements the RDBRB (Rally-Drop-Base-Retest-Breakout) strategy, a classic price action setup designed to identify structured trade opportunities using volume, volatility bands, and trend alignment. It’s ideal for traders looking for clean, rule-based entries across any timeframe.
🧠 Core Components
Rally & Drop Detection
Identifies short-term momentum shifts using moving average crossovers:
✅ Ra = Rally (bullish crossover)
🔻 Dr = Drop (bearish crossunder)
Base Formation
A statistical base is defined using a moving average with a standard deviation envelope (Upper/Lower BB). This forms the foundation for breakout or retest setups.
Retest Zone (RT)
When price returns to the lower band (but stays below the base), it suggests a potential re-accumulation or reaction zone before a breakout.
Breakout Confirmation (BO)
A breakout is validated when:
Price crosses above the upper band
Volume exceeds the 20-bar average by a threshold multiplier
RSI is above a bullish momentum level
Price is trending above the longer-term EMA
⏱️ Smart Cooldown Logic
Each signal (Rally, Drop, Retest, Breakout) has an independent cooldown timer to prevent multiple triggers within a short range, filtering out noise and duplicate signals:
Customizable cooldown periods via input settings
Ensures signals are meaningful and not clustered
💡 Visual Markers
All signals are shown as small, color-coded labels:
Ra : Green label below bar
Dr : Red label above bar
RT : Yellow label below bar
BO : Green breakout label below bar
Bands and base are plotted for structure reference.
🛠️ Customizable Settings
Cooldown periods for each signal type
MA lengths, volume and RSI thresholds
Trend filter and base calculation inputs
This script is ideal for price action traders who want a clean, structured method to trade consolidations and trend continuations while avoiding over-signaling. Use it on any timeframe and combine with higher-timeframe confirmation for best results.
Volumetric Entropy IndexVolumetric Entropy Index (VEI)
A volume-based drift analyzer that captures directional pressure, trend agreement, and entropy structure using smoothed volume flows.
---
🧠 What It Does:
• Volume Drift EMAs : Shows buy/sell pressure momentum with adaptive smoothing.
• Dynamic Bands : Bollinger-style volatility wrappers react to expanding/contracting drift.
• Baseline Envelope : Clean structural white rails for mean-reversion zones or trend momentum.
• Background Shading : Highlights when both sides (up & down drift) are in agreement — green for bullish, red for bearish.
• Alerts Included : Drift alignment, crossover events, net drift shifts, and strength spikes.
---
🔍 What Makes It Different:
• Most volume indicators rely on bars, oscillators, or OBV-style accumulation — this doesn’t.
• It compares directional EMAs of raw volume to isolate real-time bias and acceleration.
• It visualizes the twisting tension between volume forces — not just price reaction.
• Designed to show when volatility is building inside the volume mechanics before price follows.
• Modular — every element is optional, so you can run it lean or fully loaded.
---
📊 How to Use It:
• Drift EMAs : Watch for one side consistently dominating — sharp spikes often precede breakouts.
• Bands : When they tighten and start expanding, it often signals directional momentum forming.
• Envelope Lines : Use as high-probability reversal or continuation zones. Bands crossing envelopes = potential thrust.
• Background Color : Green/red backgrounds confirm volume agreement. Can be used as a filter for other signals.
• Net Drift : Optional smoothed oscillator showing the difference between bullish and bearish volume pressure. Crosses above or below zero signal directional bias shifts.
• Drift Strength : Measures pressure buildup — spikes often correlate with large moves.
---
⚙️ Full Customization:
• Turn every layer on/off independently
• Modify all colors, transparencies, and line widths
• Adjust band width multiplier and envelope offset (%)
• Toggle bonus plots like drift strength and net baseline
---
🧪 Experimental Tools:
• Smoothed Net Drift trace
• Drift Strength signal
• Envelope lines and dynamic entropy bands with adjustable math
---
Built for signal refinement. Made to expose directional imbalance before the herd sees it.
Created by @Sherlock_Macgyver

ReadyFor401ks Just Tell Me When!ReadyFor401ks Just Tell Me When!
LET ME START BY SAYING. NO INDICATOR WILL HELP YOU NAIL THE PERFECT ENTRY/EXIT ON A TRADE. YOU SHOULD ALWAYS EDUCATE YOURSELF AND HAVE A BASIC UNDERSTANDING OF INVESTING, TRADING, CHART ANALYSIS, AND THE RISKS INVOLVED WITH. THAT BEING SAID, WITH THE RIGHT ADJUSTMENTS, IT'S PRETTY D*$N CLOSE TO PERFECTION!
This indicator is designed to help traders identify t rend direction, continuation signals, and potential exits based on a dynamic blend of moving averages, ATR bands, and price action filters. Whether you’re an intraday trader scalping the 5-minute chart or a swing trader analyzing the weekly timeframe for LEAPS , this tool provides a clear, rule-based system to help guide your trading decisions.
⸻
Key Features & Benefits
🔹 Customizable Trend Power (Baseline) Calculation
• Choose from JMA, EMA, HMA, TEMA, DEMA, SMA, VAMA, and WMA for defining your baseline trend direction.
• The baseline helps confirm whether the market is in a bullish or bearish phase.
🔹 ATR-Based Trend Continuation & Volatility Measurement
• ATR bands dynamically adjust to market conditions, helping you spot breakouts and fakeouts.
• The indicator detects when price violates ATR range , which often signals impulse moves.
🔹 Clear Entry & Exit Signals
• Uses a Continuation MA (SSL2) to confirm trends.
• Includes a separate Exit MA (SSL3) that provides crossover signals to indicate when to exit trades or reverse positions .
• Plots trend continuation circles when ATR conditions align with trend signals.
🔹 Keltner Channel Baseline for Market Structure
• A modified Keltner Channel is integrated into the baseline to help filter out choppy conditions .
• If price remains inside the baseline, the market is in consolidation , while breakouts beyond the bands indicate strong trends .
🔹 Adaptive Color Coding for Market Conditions
• Bars change color based on momentum, making trend direction easy to read.
• Green = Bullish Trend, Red = Bearish Trend, Gray = Neutral/Chop.
🔹 Flexible Alerts for Trade Management
• Get real-time alerts when the Exit MA crosses price , helping you l ock in profits or switch directions .
⸻
How to Use This Indicator for Different Trading Styles
🟢 For Intraday Trading (5-Minute Chart Setup)
• Faster MA settings help react quickly to momentum shifts.
• Ideal for scalping breakouts, trend continuation setups, and intraday reversals.
• Watch for ATR violations and price interacting with the baseline/Keltner Channel for entries.
--------------------------------
My Settings for Intraday Trading on 5min Chart
ATR Period: 15
ATR Multi: 1
ATR Smoothing: WMA
Trend Power based off of: JMA
Trend Power Period: 30
Continuation Type: JMA
Continuation Length: 20
Calculate Exit of what MA?: HMA
Calculate Exit off what Period? 30
Source of Exit Calculation: close
JMA Phase *APPLIES TO JMA ONLY: 3
JMA Power *APPLIES TO JMA ONLY: 3
Volatility Lookback Period *APPLIES TO VAMA ONLY 30
Use True Range for Channel? Checked
Base Channel Multiplier: 0.4
ATR Continuation Criteria: 1.1
----------------------------------
🔵 For Swing Trading & LEAPS (Weekly Chart Setup - Default Settings)
• Slower MAs provide a broader view of trend structure.
• Helps capture multi-week trend shifts and confirm entry points for longer-term trades.
• Weekly ATR bands highlight when stocks are entering overextended conditions.
💡 Example:
Let’s say you’re looking at TSLA on a Weekly Chart using the default settings. You notice that price crosses above the continuation MA (SSL2) while remaining above the baseline (trend power MA). The bar turns green, and price breaks above ATR resistance, signaling a strong bullish continuation. This could be a great opportunity to enter a long-term swing trade or LEAPS options position.
On the flip side, if price reverses below the Exit MA (SSL3) and turns red while breaking the lower ATR band, it might signal a good time to exit longs or enter a short trade.
⸻
Final Thoughts
The ReadyFor401ks Just Tell Me When! indicator is an all-in-one trading system that simplifies trend-following, volatility measurement, and trade management. By integrating multiple moving average types, ATR filters, and clear visual cues, it allows traders to stay disciplined and remove emotions from their trading decisions.
✅ Perfect for scalpers, day traders, and swing traders alike!
🔔 Set up alerts for automated trade signals and never miss a key move!
💬 If you find this indicator useful, leave a comment and share how you use it in your trading! 🚀

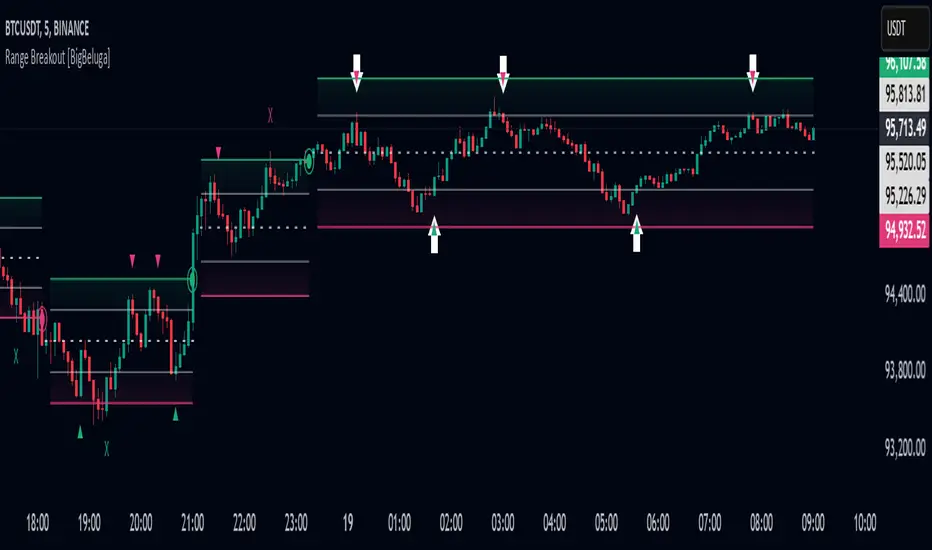
Range Breakout [BigBeluga]Range Breakout is a dynamic channel-based indicator designed to identify breakout opportunities and price reactions within defined ranges. It automatically creates upper and lower bands with a midline, helping traders spot breakout zones, retests, and potential fakeouts.
🔵 Key Features:
Dynamic Channel Formation:
Automatically plots upper and lower channel bands with a midline based on ATR calculations.
Channels adjust upon breakout events or after a predefined number of bars to reflect new price ranges.
Breakout Detection:
Green circles appear when price breaks above the upper channel edge.
Red circles appear when price breaks below the lower channel edge.
A new channel is formed after each breakout, allowing traders to monitor evolving price ranges.
Retest Signals:
Upward-pointing green triangles signal a retest of the lower band, indicating potential support.
Downward-pointing red triangles indicate a retest of the upper band, suggesting possible resistance.
Filter Signals by Trends (New Feature):
Optional toggle to filter ▲ and ▼ signals based on channel breakout conditions.
When enabled:
In a bullish channel (confirmed by a green circle breakout), only ▲ signals are displayed.
In a bearish channel (confirmed by a red circle breakout), only ▼ signals are displayed.
Helps traders align retest signals with the prevailing trend for higher-quality trade setups.
Fakeout Identification:
'X' symbols appear when price breaks the upper or lower edge of the channel and quickly returns back inside.
Helps traders identify and avoid false breakouts.
🔵 Usage:
Breakout Trading: Use the green and red circle signals to identify potential breakout trades.
Retest Confirmation: Look for triangle markers to confirm retests of key levels, aiding in entry or exit decisions.
Fakeout Alerts: Utilize the 'X' signals to spot and avoid potential trap moves.
Dynamic Range Monitoring: Stay aware of changing market conditions with automatically updating channels.
Range Breakout is an essential tool for traders seeking to capitalize on range breakouts, retests, and fakeout scenarios. Its dynamic channels and clear visual signals provide a comprehensive view of market structure and potential trade setups.
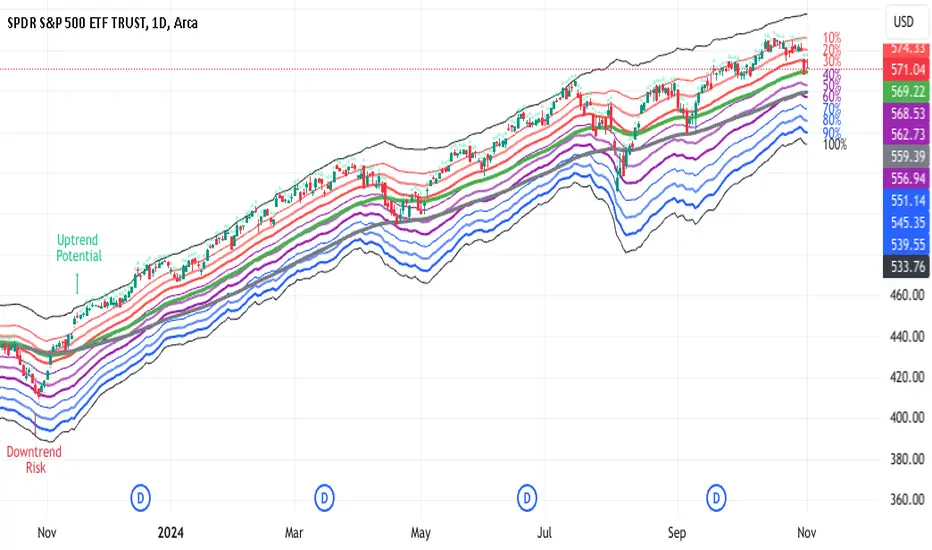
UM-Optimized Linear Regression ChannelDESCRIPTION
This indicator was inspired by Dr. Stoxx at drstoxx.com. Shout out to him and his services for introducing me to this idea. This indicator is a slightly different take on the standard linear regression indicator.
It uses two standard deviations to draw bands and dynamically attempts to best-fit the data lookback period using an R-squared statistical measure. The R-squared value ranges between zero and one with zero being no fit to the data at all and 1 being a 100% match of the data to linear regression line. The R-squared calculation is weighted exponentially to give more weight to the most recent data.
The label provides the number of periods identified as the optimal best-fit period, the type of loopback period determination (Manual or Auto) and the R-squared value (0-100, 100% being a perfect fit). >=90% is a great fit of the data to the regression line. <50% is a difficult fit and more or less considered random data.
The lookback mode can also be set manually and defaults to a value of 100 periods.
DEFAULTS
The defaults are 1.5 and 2.0 for standard deviation. This creates 2 bands above and below the regression line. The default mode for best-fit determination with "Auto" selected in the dropdown. When manual mode is selected, the default is 100. The modes, manual lookback periods, colors, and standard deviations are user-configurable.
HOW TO USE
Overlay this indicator on any chart of any timeframe. Look for turning points at extremes in the upper and lower bands. Look for crossovers of the centerline. Look at the Auto-determination for best fit. Compare this to your favorite Manual mode setting (Manual Mode is set to 100 by default lookback periods.)
When price is at an extreme, look for turnarounds or reversals. Use your favorite indicators, in addition to this indicator, to determine reversals. Try this indicator against your favorite securities and timeframes.
CHART EXAMPLE
The chart I used for an example is the daily chart of IWM. I illustrated the extremes with white text. This is where I consider proactively exiting an existing position and/or begin looking for a reversal.

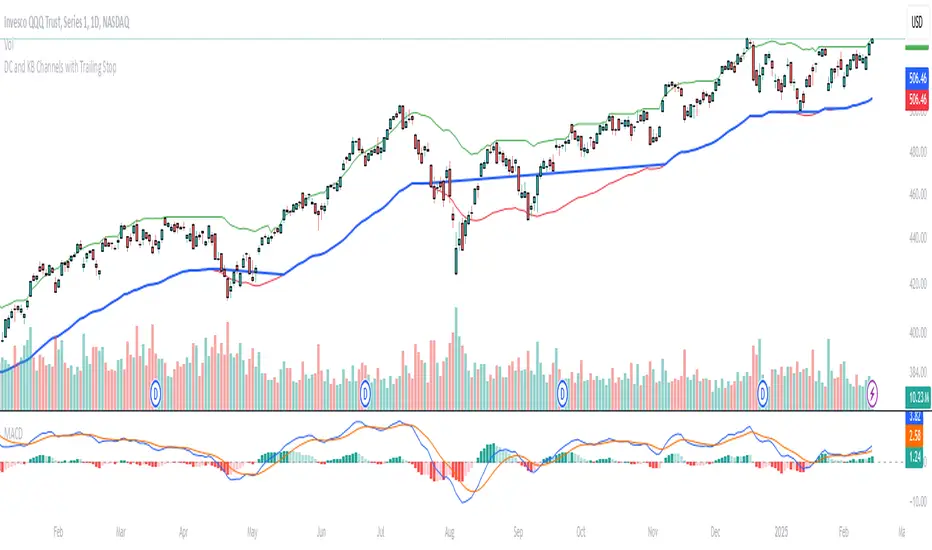
Donchian and Keltner Channels Trend Following with Trailing StopLong Only Trend-following model based on Keltner Channels and Donchian Channels.
These indicators include a noise region, which allows prices to oscillate without requiring position adjustments.
When price trades above the upper band, it signals strength; when it trades below the lower band, it signals weakness.
Keltner Channels
Keltner Channels are volatility-based envelopes set above and below an exponential moving average. Keltner Channels use the Average True Range (ATR), which measures daily volatility, to set channel distance.
Donchian Channel
Donchian Channels are are used to identify market trends and volatility. The upper and lower bands are based on the highest high and lowest low of a specified period. When the price moves above the upper band, it indicates a bullish breakout, while a
move below the lower band indicates a bearish breakout. The distance between the upper and lower channel of the Donchian Channel indicates the asset’s volatility.
Trend Following Model
The default settings are:
Upper Keltner and Upper Donchian Channel Length : 20
Lower Keltner and Lower Donchian Channel Length : 40
Keltner ATR Multiplier: 2
Entries, Exits and Trailing Stop
Entry : When price exceeds the upper band of at least one of these indicators.
Exit : When price undercuts the lower band of at least one of these indicators.
Trailing Stop : See below.
Trailing Stop
This is a stop-loss order that moves with the price of the underlying. It is designed to “trail” the price up (in the case of a long position) or down (for a short position), locking in profits as the price moves in a favorable direction.
At the end of day t, there was a Trailing Stop level in place. For the next day (day t + 1), the Trailing Stop will be adjusted. The new Trailing Stop will be the higher of two values:
The Trailing Stop from the previous day (day t).
The Lower Band computed at the end of day t + 1.
Institutional Moves DetectorIndicator Name: Institutional Pattern Detector
What It Does:
Trend Following: It uses a Moving Average (MA) to understand the general direction of the price. The MA is like a smoothed-out line of the price over time, showing if the price trend is going up or down.
Volatility Measurement: The script employs Bollinger Bands (BB) to see how much the price is fluctuating. Bollinger Bands create an upper and lower "channel" around the price, which gets wider or narrower based on how volatile the price is.
Volume Check: It looks at trading volume to find times when there's unusually high activity, which could mean big players (institutions like banks or funds) are trading. It flags this when the volume is 1.5 times more than the average volume of the last 100 bars.
Pattern Detection for Trading Signals:
Entry Signal ("IN"): When there's high volume and the price is above the upper Bollinger Band, it suggests there might be strong buying from big institutions. This could mean the price might keep going up.
EXIT Signal ("OUT"): If there's high volume and the price falls below the lower Bollinger Band, it indicates possible strong selling pressure from institutions, suggesting the price might go down.
Visual Cues:
An orange label "IN" appears below the price bar for entry signals.
A red label "OUT" appears above the price bar for exit signals.
The moving average line is plotted on the chart in orange to help you see the trend.
Alerts: The script can alert you when these entry or exit signals occur, so you can get notifications without needing to stare at the chart all day.
For New Traders:
This indicator helps you spot when big traders might be influencing the market, potentially giving you a clue about when to enter or exit.
Remember, this is one tool among many. You should not base your trading solely on this; combine it with other analysis methods.
It's always wise to practice with a demo account before using real money to get a feel for how these signals work in actual market conditions.
[LeonidasCrypto]Volume Force IndexVolume Force Index (VFI)
Overview
The Volume Force Index (VFI) is a technical indicator that measures the balance between buying and selling pressure in the market by analyzing volume patterns. It helps traders identify potential trend reversals and confirm trend strength.
What It Measures
Buying vs. selling volume pressure
Market momentum
Potential overbought/oversold conditions
Volume trend strength
How to Read the Indicator
Main Components:
Main Line (Green/Red)
Green: Buying pressure is dominant
Red: Selling pressure is dominant
The steeper the slope, the stronger the pressure
Signal Line (Yellow)
Fast EMA that helps identify trend changes
Acts as an early warning system for potential reversals
Dynamic Bands (Red/Green lines)
Adapt to market volatility
Help identify extreme conditions
Based on actual market volatility rather than fixed levels
Signals to Watch
Trend Direction:
Rising oscillator = Increasing buying pressure
Falling oscillator = Increasing selling pressure
Signal Line Crossovers:
Main line crosses above signal line = Potential bullish signal
Main line crosses below signal line = Potential bearish signal
Band Touches:
Touching upper band = Possible buying exhaustion
Touching lower band = Possible selling exhaustion
Color Changes:
Green to Red = Shift to selling pressure
Red to Green = Shift to buying pressure
Best Practices
When to Use:
Trend confirmation
Identifying potential reversals
Volume analysis
Market strength assessment
Tips:
Use in conjunction with price action
Look for divergences with price
More reliable on higher timeframes
Consider market context
Default Settings:
MA Period: 14 (volume calculation)
Smooth Length: 3 (noise reduction)
EMA Period: 4 (signal line)
Volatility Period: 20 (band calculation)
Volatility Multiplier: 1.5 (band width)
Best Markets to Apply
Any market with reliable volume data
Summary
The VFI is a powerful tool that combines volume analysis with trend identification. Its adaptive nature makes it suitable for various market conditions, but it should be used as part of a complete trading strategy, not in isolation.

FON60DK by leventsahThe strategy generates buy and sell signals using the Tillson T3 and TOTT (Twin Optimized Trend Tracker) indicators. Additionally, the Williams %R indicator is used to filter the signals. Below is an explanation of the main components of the code:
1. Input Parameters:
Tillson T3 and TOTT parameters: Separate parameters are defined for both buy (AL) and sell (SAT) conditions. These parameters control the sensitivity and behavior of the indicators.
Williams %R period: The period for the Williams %R indicator is set to determine overbought and oversold levels.
2. Tillson T3 Calculation:
The Tillson T3 indicator is a smoothed moving average that uses an exponential moving average (EMA) with additional smoothing. The formula calculates a weighted average of multiple EMAs to produce a smoother line.
The t3 function computes the Tillson T3 value based on the close price and the input parameters.
3. TOTT Calculation (Twin Optimized Trend Tracker):
The TOTT indicator is a trend-following tool that adjusts its sensitivity based on market conditions. It uses a combination of price action and a volatility coefficient to determine trend direction.
The Var_Func function calculates the TOTT value, which is then used to derive the OTT (Optimized Trend Tracker) levels for both buy and sell conditions.
4. Williams %R Calculation:
Williams %R is a momentum oscillator that measures overbought and oversold levels. It is calculated using the highest high and lowest low over a specified period.
5. Buy and Sell Conditions:
Buy Condition: A buy signal is generated when the Tillson T3 value crosses above the TOTT upper band (OTTup) and the Williams %R is above -20 (indicating an oversold condition).
Sell Condition: A sell signal is generated when the Tillson T3 value crosses below the TOTT lower band (OTTdnS) and the Williams %R is above -70 (used to close long positions).
6. Strategy Execution:
The strategy.entry function is used to open a long position when the buy condition is met.
The strategy.close function is used to close the long position when the sell condition is met.
7. Visualization:
The bars on the chart are colored green when a long position is open.
The Tillson T3, TOTT upper band (OTTup), and TOTT lower band (OTTdn) are plotted on the chart for both buy and sell conditions.
8. Plots:
The Tillson T3 values for buy and sell conditions are plotted in blue.
The TOTT upper and lower bands are plotted in green and red, respectively, for both buy and sell conditions.
Summary:
This strategy combines trend-following indicators (Tillson T3 and TOTT) with a momentum oscillator (Williams %R) to generate buy and sell signals. The use of separate parameters for buy and sell conditions allows for fine-tuning the strategy based on market behavior. The visual elements, such as colored bars and plotted indicators, help traders quickly identify signals and trends on the chart.

Range Channel by Atilla YurtsevenThis script creates a dynamic channel around a user-selected moving average (MA). It calculates the relative difference between price and the MA, then finds the average of the positive differences and the negative differences separately. Using these averages, it plots upper and lower bands around the MA as well as a histogram-like oscillator to show when price moves above or below the average thresholds.
How It Works
Moving Average Selection
The indicator allows you to choose among multiple MA types (SMA, EMA, WMA, Linear Regression, etc.). Depending on your preference, it calculates the chosen MA for the selected lookback period.
Relative Difference Calculation
It then computes the percentage difference between the source (typically the closing price) and the MA. (diff = (src / ma - 1) * 100)
Positive & Negative Averages
- Positive differences are averaged and represent how far the price typically moves above the MA.
- Negative differences are similarly averaged for when price moves below the MA.
Range Channel & Oscillator
- The channel is plotted around the MA using the average positive and negative differences (Upper Edge and Lower Edge).
- The “Untrended” histogram plots the difference (diff). Green bars occur when price is above the MA on average, and red bars when below. Two additional lines mark the upper and lower average thresholds on this histogram.
How to Use
Identify Overbought/Oversold Zones: The upper edge can serve as a dynamic overbought level, while the lower edge can suggest potential oversold conditions. When the histogram approaches or crosses these levels, it may signal price extremes relative to its average movement.
Trend Confirmation: Compare price action relative to the channel. If price and the histogram consistently remain above the MA and upper threshold, it could indicate a stronger bullish trend. If they remain below, it might signal a prolonged bearish trend.
Entry/Exit Timings:
- Entry: Traders can look for moments when price breaks back inside the channel from an extreme, anticipating a mean reversion.
- Exit: Watching how price interacts with these dynamic edges can help define stop-loss or take-profit points.
Because these thresholds adapt over time based on actual price behavior, they can be more responsive than fixed-percentage bands. However, like all indicators, it’s most effective when used in conjunction with other technical and fundamental tools.
Disclaimer
This script is provided for educational and informational purposes only. It does not guarantee any specific outcome or profit. Use it at your own discretion and risk.
Trade smart, stay safe.
Atilla Yurtseven

Daily BreadWhat it does:
This script uses specific multiple true ranges from a 30 EMA baseline to plot lines that represent 10% buying increments. Although the common period for ATR is 14, this script employs a period of 20 for smoothing that I have determined is more effective when used with a daily candle chart. It includes onscreen trend signals to identify an uptrend or downtrend when the 50 EMA crosses the 90 EMA and will also display a coloured directional signal at each candle beyond an EMA cross to identify the current trend.
The script plots a scale of percentage labels at the end of each line to identify the percent of an account intended to be in short or longer term trades.
How it does it:
The script uses a 30 EMA baseline and then multiplies ATR increments of +1, +2, +4 and -1 through -7. These ATR multiples and the EMA are plotted as 11 lines, 10 of which make up the range of 10% increments from 10% to 100% with the 11th line being the High Band representing the extreme high or expected sale of any holdings. The percentage label scale uses variable declarations to position and colour match a percentage label to each line.
Intended use:
It is intended to be used for short term trading or long term investing with a daily market index chart such as SPY and multiple exchange traded funds that track said market index. A different ETF is purchased when a daily SPY candle reaches a lower buy band using 10% of a total account value. The sale of any ETFs is at the discretion of the trader and dependent on investment strategy (short term trading or long term inventing) and the trend. When short term trading in a downtrend or when daily candles are below the 50 EMA, selling would be done every 2 to 3 bands above a buy to mitigate the risk of a significant portion of an account getting caught in a downtrend. In an uptrend the High Band would be used to sell any holdings.
Double Donchian Channels [CrossTrade]Dual Channel System
The indicator incorporates two Donchian Channels - the Inner Channel and the Outer Channel. These channels are adjustable, allowing users to define their lengths according to their trading strategy.
Inner Channel: With a default length of 100 periods, the Inner Channel provides a closer view of market trends and potential support and resistance areas. It includes an upper, lower, and middle line (average of the upper and lower), offering detailed insights into shorter-term price movements.
Outer Channel: Set with a default length of 300 periods, the Outer Channel offers a broader perspective, ideal for identifying long-term trends and stronger levels of support and resistance.
Dynamic Color Coding: The middle lines of both channels change color based on the relationship between the previous close and the channel's basis. This feature provides an immediate visual cue regarding market sentiment.
Touching Bars Highlighting: The indicator highlights bars that touch the upper or lower bands of either channel. This is particularly useful for identifying potential reversals or continuation patterns.
Pullback Identification: By differentiating between bars that touch the Inner Channel only and those that touch the Outer Channel, the indicator helps in identifying pullbacks within a broader trend.
Customizable Alert System: Users can set up alerts for specific conditions - a bar touching the bottom band of the Inner Channel (green), the bottom band of the Outer Channel (blue), the upper band of the Inner Channel (red), and the upper band of the Outer Channel (orange). These alerts assist in timely decision-making and can be tailored to individual trading styles.
The indicator is a versatile tool designed to adapt to various trading styles and timeframes. Its features make it suitable for trend analysis, identifying potential reversal points, and understanding market volatility.
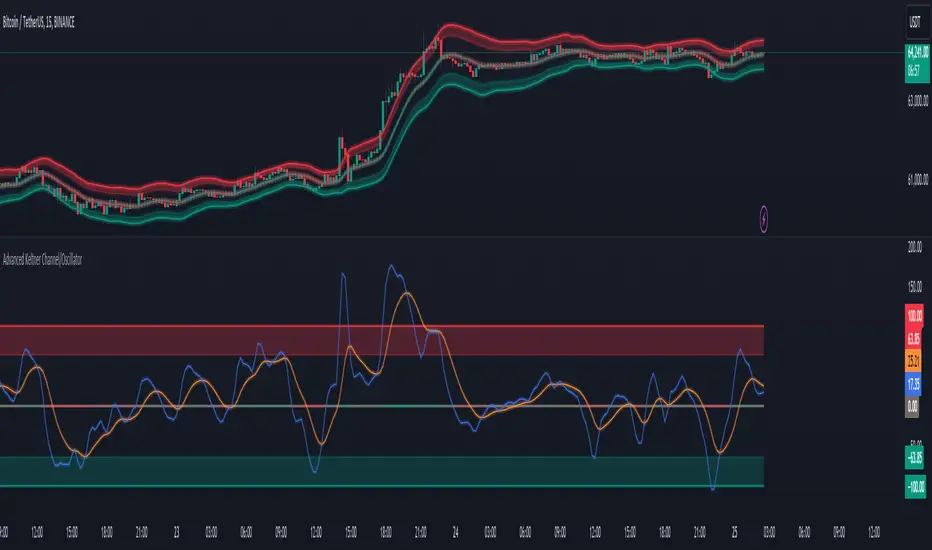
Advanced Keltner Channel/Oscillator [MyTradingCoder]This indicator combines a traditional Keltner Channel overlay with an oscillator, providing a comprehensive view of price action, trend, and momentum. The core of this indicator is its advanced ATR calculation, which uses statistical methods to provide a more robust measure of volatility.
Starting with the overlay component, the center line is created using a biquad low-pass filter applied to the chosen price source. This provides a smoother representation of price than a simple moving average. The upper and lower channel lines are then calculated using the statistically derived ATR, with an additional set of mid-lines between the center and outer lines. This creates a more nuanced view of price action within the channel.
The color coding of the center line provides an immediate visual cue of the current price momentum. As the price moves up relative to the ATR, the line shifts towards the bullish color, and vice versa for downward moves. This color gradient allows for quick assessment of the current market sentiment.
The oscillator component transforms the channel into a different perspective. It takes the price's position within the channel and maps it to either a normalized -100 to +100 scale or displays it in price units, depending on your settings. This oscillator essentially shows where the current price is in relation to the channel boundaries.
The oscillator includes two key lines: the main oscillator line and a signal line. The main line represents the current position within the channel, smoothed by an exponential moving average (EMA). The signal line is a further smoothed version of the oscillator line. The interaction between these two lines can provide trading signals, similar to how MACD is often used.
When the oscillator line crosses above the signal line, it might indicate bullish momentum, especially if this occurs in the lower half of the oscillator range. Conversely, the oscillator line crossing below the signal line could signal bearish momentum, particularly if it happens in the upper half of the range.
The oscillator's position relative to its own range is also informative. Values near the top of the range (close to 100 if normalized) suggest that price is near the upper Keltner Channel band, indicating potential overbought conditions. Values near the bottom of the range (close to -100 if normalized) suggest proximity to the lower band, potentially indicating oversold conditions.
One of the strengths of this indicator is how the overlay and oscillator work together. For example, if the price is touching the upper band on the overlay, you'd see the oscillator at or near its maximum value. This confluence of signals can provide stronger evidence of overbought conditions. Similarly, the oscillator hitting extremes can draw your attention to price action at the channel boundaries on the overlay.
The mid-lines on both the overlay and oscillator provide additional nuance. On the overlay, price action between the mid-line and outer line might suggest strong but not extreme momentum. On the oscillator, this would correspond to readings in the outer quartiles of the range.
The customizable visual settings allow you to adjust the indicator to your preferences. The glow effects and color coding can make it easier to quickly interpret the current market conditions at a glance.
Overlay Component:
The overlay displays Keltner Channel bands dynamically adapting to market conditions, providing clear visual cues for potential trend reversals, breakouts, and overbought/oversold zones.
The center line is a biquad low-pass filter applied to the chosen price source.
Upper and lower channel lines are calculated using a statistically derived ATR.
Includes mid-lines between the center and outer channel lines.
Color-coded based on price movement relative to the ATR.
Oscillator Component:
The oscillator component complements the overlay, highlighting momentum and potential turning points.
Normalized values make it easy to compare across different assets and timeframes.
Signal line crossovers generate potential buy/sell signals.
Advanced ATR Calculation:
Uses a unique method to compute ATR, incorporating concepts like root mean square (RMS) and z-score clamping.
Provides both an average and mode-based ATR value.
Customizable Visual Settings:
Adjustable colors for bullish and bearish moves, oscillator lines, and channel components.
Options for line width, transparency, and glow effects.
Ability to display overlay, oscillator, or both simultaneously.
Flexible Parameters:
Customizable inputs for channel width multiplier, ATR period, smoothing factors, and oscillator settings.
Adjustable Q factor for the biquad filter.
Key Advantages:
Advanced ATR Calculation: Utilizes a statistical method to generate ATR, ensuring greater responsiveness and accuracy in volatile markets.
Overlay and Oscillator: Provides a comprehensive view of price action, combining trend and momentum analysis.
Customizable: Adjust settings to fine-tune the indicator to your specific needs and trading style.
Visually Appealing: Clear and concise design for easy interpretation.
The ATR (Average True Range) in this indicator is derived using a sophisticated statistical method that differs from the traditional ATR calculation. It begins by calculating the True Range (TR) as the difference between the high and low of each bar. Instead of a simple moving average, it computes the Root Mean Square (RMS) of the TR over the specified period, giving more weight to larger price movements. The indicator then calculates a Z-score by dividing the TR by the RMS, which standardizes the TR relative to recent volatility. This Z-score is clamped to a maximum value (10 in this case) to prevent extreme outliers from skewing the results, and then rounded to a specified number of decimal places (2 in this script).
These rounded Z-scores are collected in an array, keeping track of how many times each value occurs. From this array, two key values are derived: the mode, which is the most frequently occurring Z-score, and the average, which is the weighted average of all Z-scores. These values are then scaled back to price units by multiplying by the RMS.
Now, let's examine how these values are used in the indicator. For the Keltner Channel lines, the mid lines (top and bottom) use the mode of the ATR, representing the most common volatility state. The max lines (top and bottom) use the average of the ATR, incorporating all volatility states, including less common but larger moves. By using the mode for the mid lines and the average for the max lines, the indicator provides a nuanced view of volatility. The mid lines represent the "typical" market state, while the max lines account for less frequent but significant price movements.
For the color coding of the center line, the mode of the ATR is used to normalize the price movement. The script calculates the difference between the current price and the price 'degree' bars ago (default is 2), and then divides this difference by the mode of the ATR. The resulting value is passed through an arctangent function and scaled to a 0-1 range. This scaled value is used to create a color gradient between the bearish and bullish colors.
Using the mode of the ATR for this color coding ensures that the color changes are based on the most typical volatility state of the market. This means that the color will change more quickly in low volatility environments and more slowly in high volatility environments, providing a consistent visual representation of price momentum relative to current market conditions.
Using a good IIR (Infinite Impulse Response) low-pass filter, such as the biquad filter implemented in this indicator, offers significant advantages over simpler moving averages like the EMA (Exponential Moving Average) or other basic moving averages.
At its core, an EMA is indeed a simple, single-pole IIR filter, but it has limitations in terms of its frequency response and phase delay characteristics. The biquad filter, on the other hand, is a two-pole, two-zero filter that provides superior control over the frequency response curve. This allows for a much sharper cutoff between the passband and stopband, meaning it can more effectively separate the signal (in this case, the underlying price trend) from the noise (short-term price fluctuations).
The improved frequency response of a well-designed biquad filter means it can achieve a better balance between smoothness and responsiveness. While an EMA might need a longer period to sufficiently smooth out price noise, potentially leading to more lag, a biquad filter can achieve similar or better smoothing with less lag. This is crucial in financial markets where timely information is vital for making trading decisions.
Moreover, the biquad filter allows for independent control of the cutoff frequency and the Q factor. The Q factor, in particular, is a powerful parameter that affects the filter's resonance at the cutoff frequency. By adjusting the Q factor, users can fine-tune the filter's behavior to suit different market conditions or trading styles. This level of control is simply not available with basic moving averages.
Another advantage of the biquad filter is its superior phase response. In the context of financial data, this translates to more consistent lag across different frequency components of the price action. This can lead to more reliable signals, especially when it comes to identifying trend changes or price reversals.
The computational efficiency of biquad filters is also worth noting. Despite their more complex mathematical foundation, biquad filters can be implemented very efficiently, often requiring only a few operations per sample. This makes them suitable for real-time applications and high-frequency trading scenarios.
Furthermore, the use of a more sophisticated filter like the biquad can help in reducing false signals. The improved noise rejection capabilities mean that minor price fluctuations are less likely to cause unnecessary crossovers or indicator movements, potentially leading to fewer false breakouts or reversal signals.
In the specific context of a Keltner Channel, using a biquad filter for the center line can provide a more stable and reliable basis for the entire indicator. It can help in better defining the overall trend, which is crucial since the Keltner Channel is often used for trend-following strategies. The smoother, yet more responsive center line can lead to more accurate channel boundaries, potentially improving the reliability of overbought/oversold signals and breakout indications.
In conclusion, this advanced Keltner Channel indicator represents a significant evolution in technical analysis tools, combining the power of traditional Keltner Channels with modern statistical methods and signal processing techniques. By integrating a sophisticated ATR calculation, a biquad low-pass filter, and a complementary oscillator component, this indicator offers traders a comprehensive and nuanced view of market dynamics.
The indicator's strength lies in its ability to adapt to varying market conditions, providing clear visual cues for trend identification, momentum assessment, and potential reversal points. The use of statistically derived ATR values for channel construction and the implementation of a biquad filter for the center line result in a more responsive and accurate representation of price action compared to traditional methods.
Furthermore, the dual nature of this indicator – functioning as both an overlay and an oscillator – allows traders to simultaneously analyze price trends and momentum from different perspectives. This multifaceted approach can lead to more informed decision-making and potentially more reliable trading signals.
The high degree of customization available in the indicator's settings enables traders to fine-tune its performance to suit their specific trading styles and market preferences. From adjustable visual elements to flexible parameter inputs, users can optimize the indicator for various trading scenarios and time frames.
Ultimately, while no indicator can predict market movements with certainty, this advanced Keltner Channel provides traders with a powerful tool for market analysis. By offering a more sophisticated approach to measuring volatility, trend, and momentum, it equips traders with valuable insights to navigate the complex world of financial markets. As with any trading tool, it should be used in conjunction with other forms of analysis and within a well-defined risk management framework to maximize its potential benefits.