Bands-Trailing Stop UtilityIntroduction
Bands and trailing stops are important indicators in technical analysis, while we could think that both are different they can be in fact closely related, at least in the way they are made. Bands and trailing stops can be made from a simple central tendency estimator, like a moving average, and from a volatility estimator like standard deviation, atr...etc.
This is why i propose this utility that allow you to make bands and trailing stops from any indicator in the price chart.
How To Use
All you have to do is select the indicator you want to make bands from in the settings, so just open the Bands-Trailing Stop Utility indicator settings and select your indicator in "Source". Make sure your source indicator is not in "hide" mode.
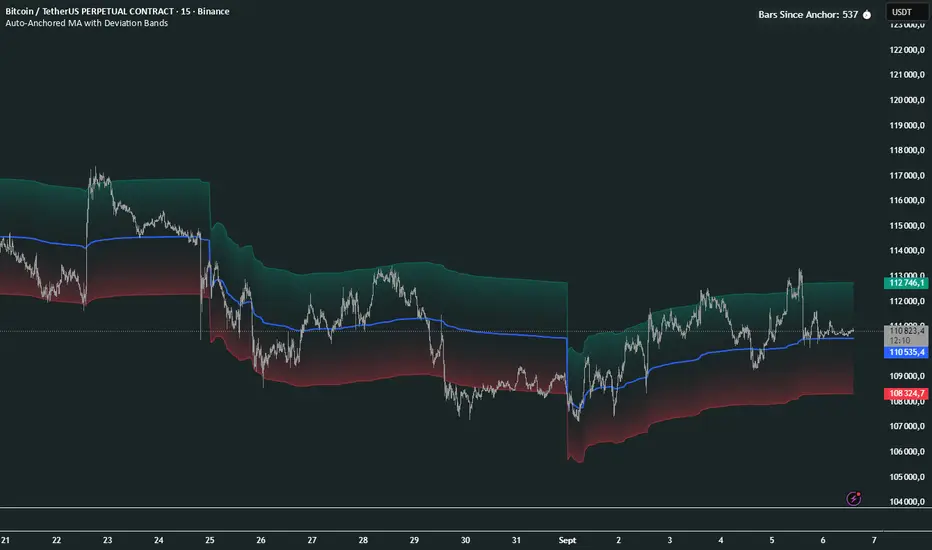
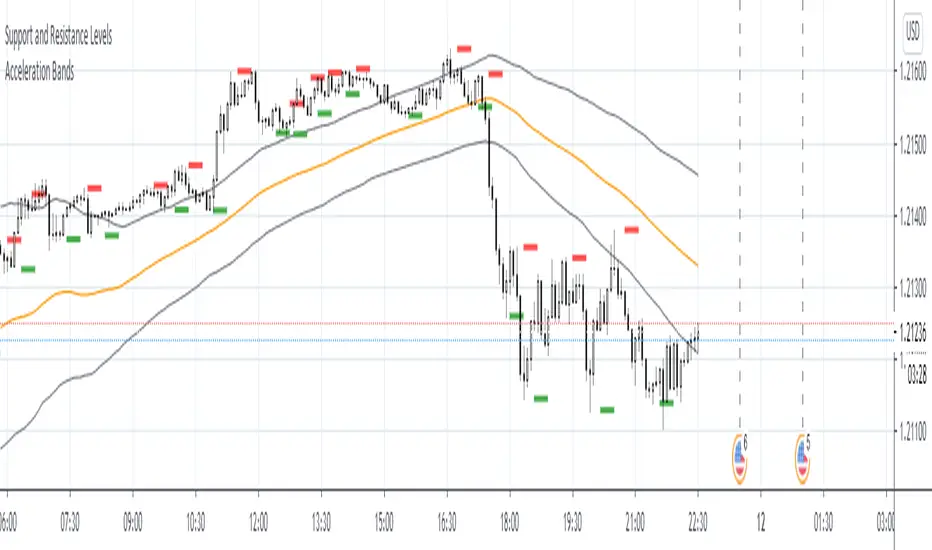
For example here i'am using a moving average as source for the indicator. Mult control how spread the bands are from each others, by default mult = 1, if we use mult = 2 we get :
Mult can be non-integer as well as lower than 1 (when lower than 1 the bands would be closer to each others)
Error/Volatility Estimators
You can choose from a wide variety of volatility estimators, select the estimator from the "Method" scrolling parameter in settings, by default the indicator will use the running mean absolute error (MAE) which don't use length. Other estimators use length, making length = to the period of the source indicator can help get better results.
The root moving averaged squared error (RMASE) is just the square root of the simple moving average of the squared difference between the closing price and the source indicator. length control the period of the moving average of RMASE.
You can also use the average true range with period length. It might work better with low lagging moving averages.
The range is simply the difference between the highest and lowest over length periods of the source indicator.
Stdev is simply the price running standard deviation.
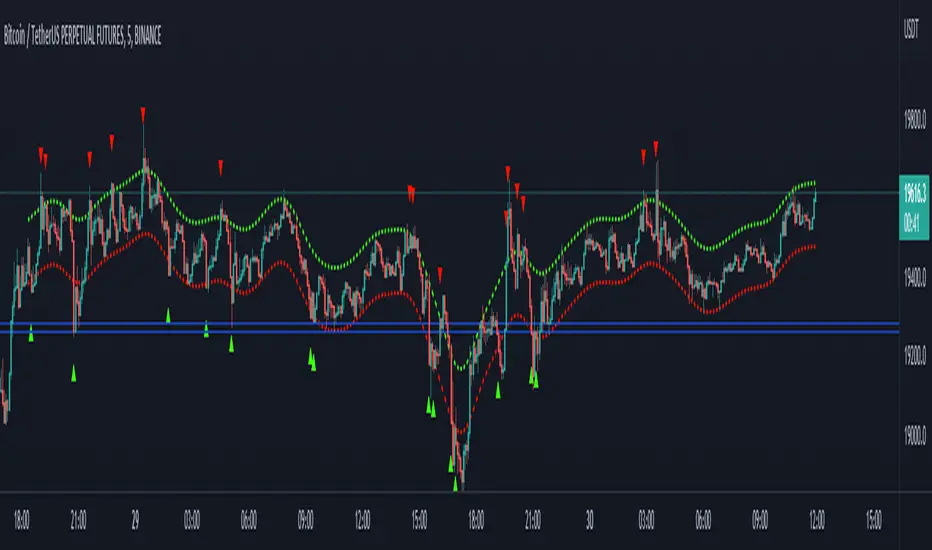
Trailing Stop
When the trailing stop mode is checked the bands will be replaced by a trailing stop, the trailing stop will still depend on every settings of the indicator like mult/volatility estimator...etc.
Conclusion
You might find an use to this tool if you want to make bands/trailing stops from pretty much everything. The indicator used as source for the examples is a smooth exponential averager that i could share if i see interest from peoples.
Thanks for reading !
Pine Script® indicator