Trend Tracker ProTrend Tracker Pro - Advanced Trend Following Indicator
Overview
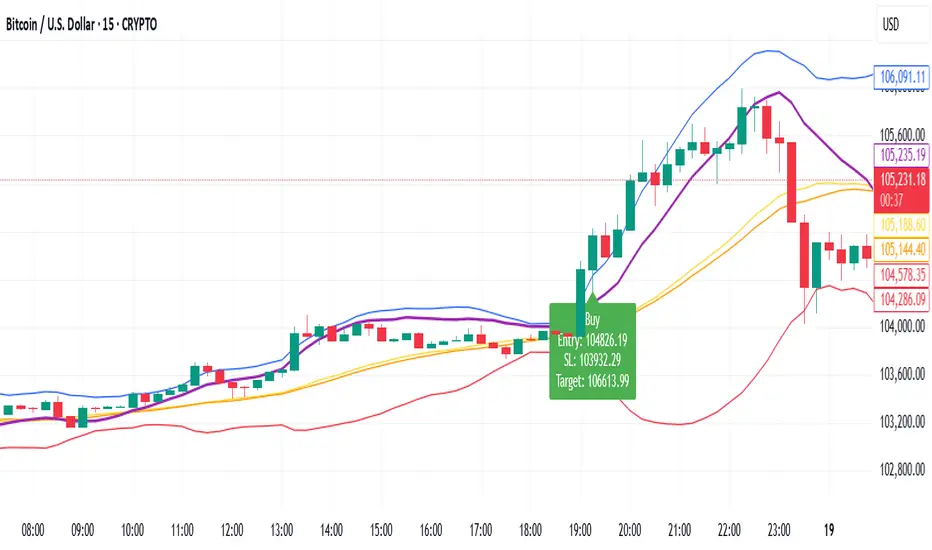
Trend Tracker Pro is a sophisticated trend-following indicator that combines the power of Exponential Moving Average (EMA) and Average True Range (ATR) to identify market trends and generate precise buy/sell signals. This indicator is designed to help traders capture trending moves while filtering out market noise.
🎯 Key Features
✅ Dynamic Trend Detection
Uses EMA and ATR-based bands to identify trend direction
Automatically adjusts to market volatility
Clear visual trend line that changes color based on market direction
✅ Precise Signal Generation
Buy signals when trend changes to bullish
Sell signals when trend changes to bearish
Reduces false signals by requiring actual trend changes
✅ Visual Clarity
Green trend line: Bullish trend
Red trend line: Bearish trend
Gray trend line: Sideways/neutral trend
Triangle arrows for buy/sell signals
Clear BUY/SELL text labels
✅ Customizable Settings
Trend Length: Adjustable period for EMA and ATR calculation (default: 14)
ATR Multiplier: Controls sensitivity of trend bands (default: 2.0)
Show/Hide Signals: Toggle signal arrows on/off
Show/Hide Labels: Toggle text labels on/off
✅ Built-in Information Panel
Real-time trend direction display
Current trend level value
ATR value for volatility reference
Last signal information
✅ TradingView Alerts
Buy signal alerts
Sell signal alerts
Customizable alert messages
🔧 How It Works
Algorithm Logic:
1.
Calculate EMA: Uses exponential moving average for trend baseline
2.
Calculate ATR: Measures market volatility
3.
Create Bands: Upper band = EMA + (ATR × Multiplier), Lower band = EMA - (ATR × Multiplier)
4.
Determine Trend:
Price above upper band → Bullish trend (trend line = lower band)
Price below lower band → Bearish trend (trend line = upper band)
Price between bands → Continue previous trend
5.
Generate Signals: Signal occurs when trend direction changes
📊 Best Use Cases
✅ Trending Markets
Excellent for capturing strong directional moves
Works well in both bull and bear markets
Ideal for swing trading and position trading
✅ Multiple Timeframes
Effective on all timeframes from 15 minutes to daily
Higher timeframes provide more reliable signals
Can be used for both scalping and long-term investing
✅ Various Asset Classes
Stocks, Forex, Cryptocurrencies, Commodities
Particularly effective in volatile markets
Adapts automatically to different volatility levels
⚙️ Recommended Settings
Conservative Trading (Lower Risk)
Trend Length: 20
ATR Multiplier: 2.5
Best for: Long-term positions, lower frequency signals
Balanced Trading (Default)
Trend Length: 14
ATR Multiplier: 2.0
Best for: Swing trading, moderate frequency signals
Aggressive Trading (Higher Risk)
Trend Length: 10
ATR Multiplier: 1.5
Best for: Day trading, higher frequency signals
🎨 Visual Elements
Trend Line: Main indicator line that follows the trend
Signal Arrows: Triangle shapes indicating buy/sell points
Text Labels: Clear "BUY" and "SELL" text markers
Information Table: Real-time status panel in top-right corner
Color Coding: Intuitive green/red color scheme
⚠️ Important Notes
Risk Management
Always use proper position sizing
Set stop-losses based on ATR values
Consider market conditions and volatility
Not recommended for ranging/sideways markets
Signal Confirmation
Consider using with other indicators for confirmation
Pay attention to volume and market structure
Be aware of major news events and market sessions
Backtesting Recommended
Test the indicator on historical data
Optimize parameters for your specific trading style
Consider transaction costs in your analysis
Pine Script® indicator