Absolute Strength MTF IndicatorIntroduction
The non-signal version of the absolute strength indicator from fxcodebase.com requested by ernie76 . This indicator originally from mt4 aim to estimate the bullish/bearish force of the market by using various methods.
The Indicator
Two lines are plotted, a bull line (blue) representing the bullish/buying force and a bear one (red) representing the bearish/selling force, when the bull line is greater than the bear line the market is considered to be strongly bullish, else strongly bearish.
The indicator use various method, Rsi, stochastic, adx. The Rsi method is the one by default.
The stochastic method is less reactive but smoother
The Adx method is way different, while the other two methods make the bull and bear lines somewhat uncorrelated, the adx method focus more on the overall market strength than individual buyer/seller strength.
The smoothing method use 3 different filters, SMA, EMA and LSMA, LSMA is more reactive than the two previous one while EMA is just more computer efficient.
It is possible to use price data of different time frames for the calculation of the indicator.
Stochastic method with 4 hour price close as source.
Conclusion
A classic indicator who can be derived into a lot of ways using a more adaptive architecture or recursion. Hope you find it a use :)
A big thanks to ernie76 for the request and the support/testing of the indicator
Feel free to pm me for any request.
Search in scripts for "bear"

fiercebitraderEl indicador fiercebitrader, es un indicador basado en el Índice Medio de Movimiento Direccional (ADX) es una herramienta de análisis técnico usada para medir la fuerza de la tendencia. El indicador direccional positivo ( DI) y el indicador direccional negativo (-DI) acompañan a la línea ADX. realzando la dirección de la tendencia.
Usados en conjunto forman un sistema de trading que es capaz de determinar tanto la dirección como la fuerza de la tendencia. El indicador consiste en tres líneas: la propia ADX (línea azul), una línea DI (línea verde), y una línea -DI (línea roja). El DI mide la fuerza de la tendencia alcista, mientras que el -DI mide la intensidad del movimiento bajista. La línea ADX muestra la fuerza de la tendencia en general creciendo tanto en las tendencias alcistas como bajistas.
Cuando el DI está por encima del -DI, se dice que los alcistas tienen el dominio direccional. De forma alternativa, cuando el -DI es más alto que el DI, el dominio direccional pertenece a los bajistas.
Es importante entender que el ADX (línea azul) muestra solo la fuerza de la tendencia y no la dirección de la tendencia. La dirección de la tendencia puede en cambio determinarse mirando al DI y el -DI (líneas roja y verde).
¿Cómo usarlo en el trading?
Operar con la tendencia reduce los riesgos e incrementa los beneficios potenciales. Es por esto que muchos traders prefieren consultar la fuerza de la tendencia con ayuda del ADX antes de invertir su dinero. Hay dos formas principales de usar el indicador:
El Cruce de DI
Cuando las líneas direccionales del positivo y negativo se cruzan, normalmente significa que la tendencia está cambiando. Esta información puede usarse para determinar puntos de entrada óptimos. Para los inversores que utilicen este sistema de trading, las señales son las siguientes:
(Compra) cuando el DI cruce el -DI , es mas efectivo, mas fuerte cuando toca o cruza la linea amarilla solida en el nivel de 27 y la tendencia general sea alcista.
El disparo se da en la linea de 20 punteada.
(Venta) cuando el -DI cruce el DI , es mas efectivo, más fuerte cuando toca o cruza la linea amarilla solida en el nivel de 27 y la tendencia sea bajista general sea bajista.
Valor de Fuerza Tendencia ADX
0-20 Tendencia Ausente o Débil
21-26 Disparo
27-50 Tendencia Fuerte
50-75 Tendencia muy Fuerte
75-100 Tendencia Extremadamente Fuerte
El fiercebitrader es un indicador de análisis técnico verdaderamente único, que combinado con otros indicadores, puede convertirse en la estrategia de trading definitiva en manos de un trader.
Recomendado para scalping en temporalidad de 5 min
swing day 1hora. Esta configurado para una operacion optima.
Acompañelo con el indicador bitradertracker.
Con mucho cariño Bitrader4.0
_________________________________
The fiercebitrader indicator, is an indicator based on the Mean Directional Movement Index (ADX) is a technical analysis tool used to measure the strength of the trend. The positive directional indicator (DI) and the negative directional indicator (-DI) accompany the ADX line. enhancing the direction of the trend.
Used together they form a trading system that is able to determine both the direction and strength of the trend. The indicator consists of three lines: the ADX itself (blue line), a DI line (green line), and a -DI line (red line). The DI measures the strength of the uptrend, while the -DI measures the intensity of the bearish movement. The ADX line shows the strength of the overall trend growing in both bullish and bearish trends.
When the DI is above the -DI, it is said that the bulls have the directional domain. Alternatively, when the -DI is higher than the DI, the directional domain belongs to the bears.
It is important to understand that the ADX (blue line) shows only the strength of the trend and not the direction of the trend. The direction of the trend can instead be determined by looking at the DI and the -DI (red and green lines).
How to use it in trading?
Operating with the trend reduces the risks and increases the potential benefits. This is why many traders prefer to consult the strength of the trend with the help of the ADX before investing their money. There are two main ways to use the indicator:
1) The Cross of DI
When the directional lines of the positive and negative intersect, it usually means that the trend is changing. This information can be used to determine optimal entry points. For investors who use this trading system, the signals are the following:
(Buy) when the DI crosses the -DI, it is more effective, stronger when it touches or crosses the solid yellow line at the level of 27 and the general trend is bullish.
The shot is given in the line of 20 dashed.
(Sale) when the -DI crosses the DI, it is more effective, stronger when it touches or crosses the solid yellow line at the level of 27 and the general bearish trend is bearish.
Strength Value ADX Trend
0-20 Absent or Weak Trend
21-26 Shot
27-50 Strong Trend
50-75 Very Strong Trend
75-100 Extremely Strong Trend
The fiercebitrader is a truly unique indicator of technical analysis, which combined with other indicators, can become the definitive trading strategy in the hands of a trader.
Recommended for scalping 5-minute and 1 hour.
It is configured for an optimal operation.
Accompany it with the bitradertracker indicator.
With love Bitrader4.0

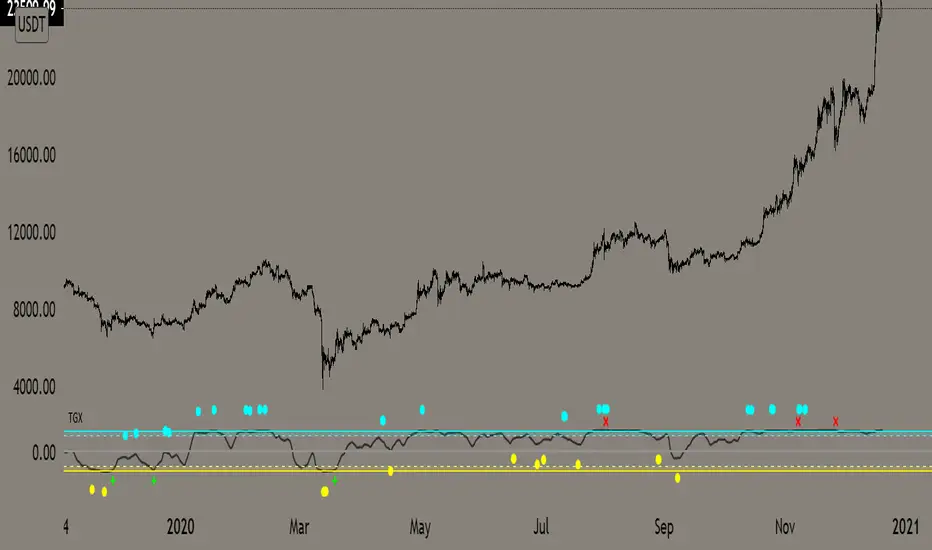
Top Goon X
Momentum based indicator
various signals for various parameters
bull/bear divergence will be seen as the dots with blue being bearish and yellow being bullish
the red X and green + are top and bottom signals per TGX
white flag appears respectably on top and bottom when all parameters are met bullshly or bearishly
Watch for TGX to reset while it rest just under resistance for a bullish set up
or
for TGX to run while sitting on top of support for bearish set up
TGX will trend in the upper parallel when bullish and bottom when bearish
towards the end of the trend is when you will see TGX "reset" for one last push up, albeit that push can run as long as it the market wants
@satoshiiheavy
Technical Analysis for www.cryptocurrentlyvip.com
Extremely Powerful Libra [Eric]This Indicator helps understand the Power shift between Bulls and Bears:
1. The volume is separated into bulls and bears power. For example, when we see a doji, we can check it for more inner information about who actually control the market.
2. The background is a prediction algo that predict the trending direction.
If you guys meet the:
Extremely Powerful Libra (3): Internal server study error
or Loop error,
Just check this button then switch my TF to 5 or bigger, normally 3 works well, but sometime the data is way too much that the server will reject to compile it.
prnt.sc

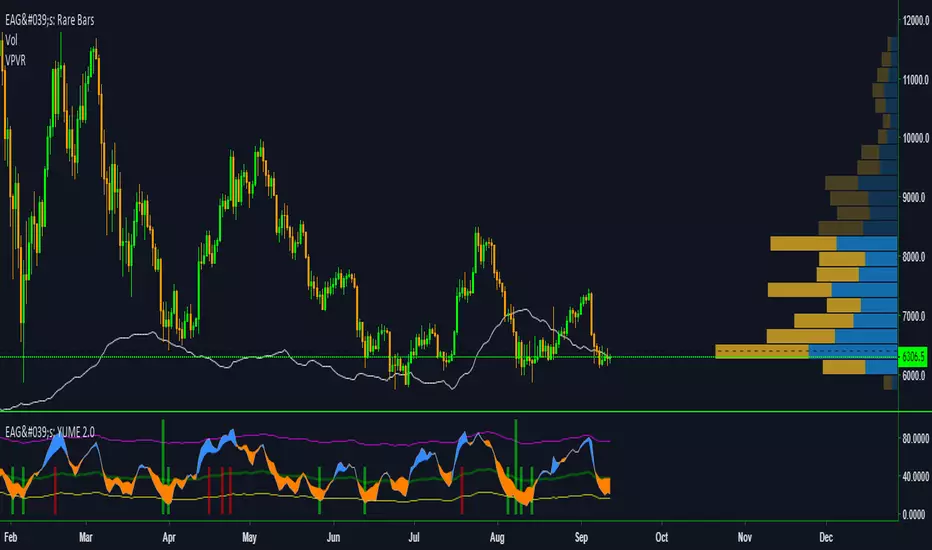
EdgeAnalysisGroup: Yume Wave 2.0This is a upgraded version of the wave with modified parameters for a higher success rate. 3 New Lengths and 75 more lines of code added to the overall algorithm. Also included are 2 sublevel signals based on the Fib MA and pattern trading.
The Wave:
+ The Yume is the Fast length
+ The Akume is the Slow length
+ The Miaku is a median weighted length
+ The Upper Limit is an overbought asset indication
+ The Lower Limit is an oversold asset indication
+ The Wave is the spread between Yume and Miaku
Bullish Indications:
+ The Yume is above the Akume
+ The Yume is above the Miaku
+ The Yume is below the Lower Limit
Bearish Indications:
+ The Yume is below the Akume
+ The Yume is below the Miaku
+ The Yume is above the Upper Limit
Signal Strength Weights:
+ 50 = Yume Wave crossed a Limit Line
+ 100 = Yume Wave crossed a Limit Line + Close to a Fib Moving Average
+ 100 = Edge's Market Bottom/Top Algorithm is marked 'True'
Setting up Signals (Based on a 100 Signal Height):
+ Set the "Bull Signal" to be at 50 or 100
+ Set the "Bear Signal" to be at 50 or 100
+ 50 is Agressive, 100 is Conservative.
+ Bull/Bear are separate so you can play conservative bull with aggressive bear.
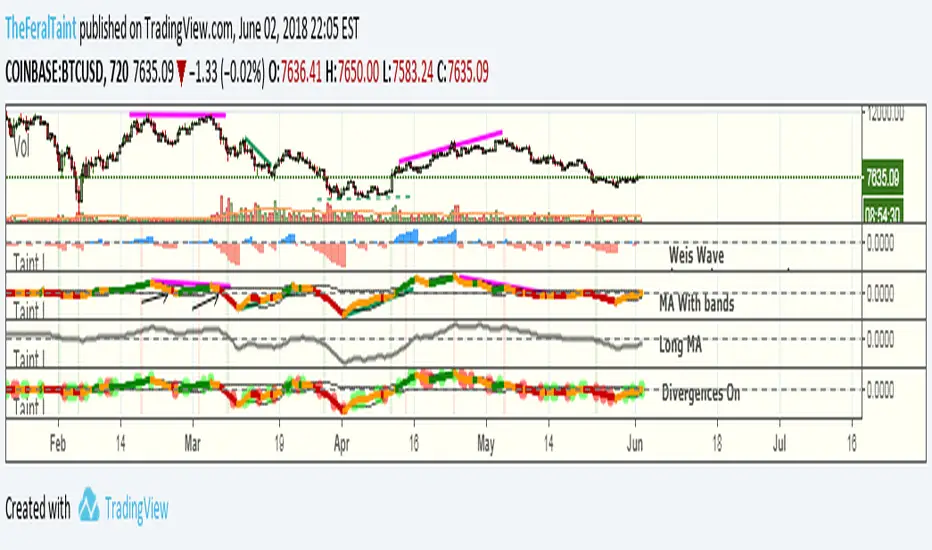
Taintalicious IndicatorThis indicator gathers data from the Weis Wave indicator (thanks to @LazyBear for the original code), and coverts it to something like a VPCI or a Chaikin Oscillator. This indicator is quite versatile. It can be ran with Weis Wave turned on and the Bands + MA turned on together, though I find the scaling becomes an issue. If it is the only indicator you're using, scaling isn't a problem as long as you enlarge it. I prefer to run the Bands + MA + Long MA as one setup, and flip to Weis Wave when I need to see the raw data underneath. You can use this indicator to spot momentum shifts, the strength of bullish or bearish moves, bull/bear divergences, trend reversals, consolidation/squeezes, and even Wyckoff springs. It will take some getting used to though.
Tips for interpretation:
--Bearish/Bearish Divergence: TI diverges from price. TI is making lower highs or higher lows while price is making higher highers or higher lows. You can turn on the setting to highlight some of these divergences, but I find it easier to simply look for them.
--As an Oscillator: TI crossing zero can indicate a shift in momentum. The deeper the initial rise or fall past zero, the stronger the momentum shift.
--Overbought/Oversold: When TI breaches the bands while they are wide--indicating high volatility in the same way Bollinger Bands do--this can be viewed as an overbought or oversold signal. Begin looking for an entry once TI forms a "v" shape, and begins moving back towards the bands. The best entry is typically when TI breaks back into the bands. These breaches are highlighted with either green or red.
--Long MA: This can be used for bull/bear divergence as well as a leading indicator for trend reversals or momentum shifts. TI crossing above or below the Long MA is one signal. Whether the Long MA is above or below zero indicates the market sentiment/trend over the last 100 periods--above zero being bullish and below zero being bearish.
Best setting for Trend Detection Length is 4
Feel free to contact me on Twitter if you have questions: @TheFeralTaint
420_Jpn_PatternsMy first iteration of a script that ID's japanese candlestick patterns including:
bullish_engulfing www.investopedia.com
bearish_engulfing www.investopedia.com
bullish_harami www.investopedia.com
bearish_harami www.investopedia.com
piercing_line (bullish) www.investopedia.com
dark_cloud_cover (bearish) www.investopedia.com
morning_star (bullish) www.investopedia.com
evening_star (bearish) www.investopedia.com
bullish_belt www.investopedia.com
bearish_belt www.investopedia.com
aka_sanpei (bullish) www.investopedia.com
sanba_garasu (bearish) www.investopedia.com
three_stars_south (bullish) www.investopedia.com
stick_sandwich www.investopedia.com
bullish_meeting_line www.thepatternsite.com
bearish_meeting_line www.thepatternsite.com
bullish_kicking www.thepatternsite.com
bearish_kicking thepatternsite.com
ladder_bottom (bullish) www.thepatternsite.com
inverted_hammer www.thepatternsite.com
shooting_star www.thepatternsite.com www.thepatternsite.com
hanging_man (bearish) www.thepatternsite.com
hammer (bullish) www.thepatternsite.com
xoxo
sn00p

6 in 1 SIGNALS
⭐ Indicator Presentation: Keltner + RSI + High Volume + RSI Divergences
Overview
This indicator combines four powerful market‑analysis tools into a single, unified system:
1. Keltner Channel with dual ATR bands (x3 and x5)
2. RSI with dynamic overbought/oversold detection
3. High‑Volume confirmation signals
4. RSI Divergences (Regular & Hidden, Bullish & Bearish)
5. A dynamic information table showing RSI, distance from the Keltner basis, and directional arrows
The goal is to give traders a complete, multi‑layered view of volatility, momentum, exhaustion, and volume pressure — all directly on the main chart.
🎯 1. Keltner Channel System
What it includes
• A customizable moving average (SMA, EMA, WMA, VWMA)
• Two ATR‑based envelopes:
• Band x3 ATR
• Band x5 ATR
• Colored fills between the bands to highlight extreme volatility zones
How to use it
• When price re-enters the channel after being outside, it often signals exhaustion.
• The indicator marks these moments with triangles:
• 🔻 Bearish reversal when price falls back inside from above
• 🔺 Bullish reversal when price rises back inside from below
These signals help identify mean‑reversion opportunities.
🎯 2. RSI System
What it includes
• Standard RSI with adjustable period
• Overbought and oversold levels
• A dynamic color-coded table showing:
• Current RSI value
• Directional arrow (▲ oversold, ▼ overbought, • neutral)
• Distance from the Keltner basis in points and percentage
How to use it
• RSI above the overbought level → potential selling pressure
• RSI below the oversold level → potential buying pressure
• The table updates in real time and gives a quick snapshot of market momentum.
🎯 3. RSI Divergences (Regular & Hidden)
Types of divergences detected
Regular Bullish Divergence
• Price makes a lower low
• RSI makes a higher low
• Suggests weakening bearish momentum
• Marked with a “Bull” label at the price pivot
Hidden Bullish Divergence
• Price makes a higher low
• RSI makes a lower low
• Suggests continuation of an uptrend
• Marked with “H Bull”
Regular Bearish Divergence
• Price makes a higher high
• RSI makes a lower high
• Suggests weakening bullish momentum
• Marked with “Bear”
Hidden Bearish Divergence
• Price makes a lower high
• RSI makes a higher high
• Suggests continuation of a downtrend
• Marked with “H Bear”
How to use divergences
• Divergences appear directly on the price chart, anchored to the pivot candle.
• They help identify trend reversals or trend continuation setups.
• Combining divergences with Keltner signals increases reliability.
🎯 4. High‑Volume Signals
What it includes
• A customizable volume moving average
• A detection system that highlights candles with unusually high volume
• Color-coded arrows:
• 🟢 High volume on bullish candles
• 🔴 High volume on bearish candles
How to use it
• High volume often confirms institutional activity.
• When high volume aligns with:
• A Keltner reversal
• An RSI divergence
• An overbought/oversold condition
…the signal becomes significantly stronger.
🎯 5. Integrated Trading Logic
This indicator is designed to give multi‑confirmation entries:
Strong Buy Conditions
• Price re-enters from below the Keltner band
• RSI oversold
• Bullish divergence
• High volume on a bullish candle
Strong Sell Conditions
• Price re-enters from above the Keltner band
• RSI overbought
• Bearish divergence
• High volume on a bearish candle
You can use any single component alone, but the real power comes from stacking confirmations.
🎯 6. Alerts Included
The indicator includes alerts for:
• All four RSI divergences
• All Keltner reversal signals
• All RSI + Keltner confirmation signals
This allows you to automate monitoring and receive notifications without watching the chart constantly.
⭐ Conclusion
This unified indicator gives traders a complete, multi‑dimensional view of market structure:
• Volatility (Keltner)
• Momentum (RSI)
• Exhaustion (Divergences)
• Volume pressure (High Volume)
• Real‑time analytics (Dynamic table)
It is designed for traders who want clarity, precision, and multiple confirmations in a single tool.

CSA / Infinity MKR / Final Pro [NPR21}Title: CSA – Precision Infinity MKR & Confluence Dashboard
The Institutional Edge: Multi-Kernel Smoothing & Real-Time Confluence
The CSA Precision Infinity MKR is an advanced trend-following suite that replaces traditional, lagging EMAs with a high-performance Multi-Kernel Regression (MKR) engine. Designed for the "Top Center" of the chart, this script features our proprietary Infinity Bridge —a logic system that ensures your trend signal never breaks or snaps, tracking price action with surgical precision directly to the live candle.
Key Technical Features
1
7-Kernel Smoothing Engine: Unlike standard indicators, you can cycle through 17 different mathematical kernels (Sinc, Gaussian, Lorentzian, etc.) to match the specific volatility of any asset class, from high-cap Stocks to volatile Crypto.
The Infinity Bridge: We solved the "broken line" issue. Our script bridges historical regression math with live price data, providing a continuous, seamless trend line that never lags behind the current price.
15-Indicator Confluence HUD: A professional "Heads-Up Display" tracks 15 momentum and trend metrics (Heikin Ashi, SuperTrend, TTM, RSI, etc.) simultaneously. It does the heavy lifting so you can focus on execution.
High-Vis Neon Aesthetics: Built for dark-mode traders. Featuring Neon Fluorescent Green and Bright Red trend lines with a high-contrast dark green dashboard for zero eye strain.
Trader’s Manual: How to Trade the Suite
Step 1: Identify the Regime (The MKR Line)
Bullish: When the MKR line is Neon Green , you are in a buy-only regime.
Bearish: When the MKR line is Bright Red , you are in a sell-only regime.
The Curve: Watch the "hook" of the line. When the line begins to curve toward price, a trend shift is imminent.
Step 2: Confirm Confluence (The Dashboard)
Look at the CONFIRMED tally on the far right of the HUD:
Strong Buy (11/15 – 15/15): Deep green signal. High-probability entry.
Caution (7/15 – 10/15): Orange signal. The trend is weakening or consolidating.
No Trade (Below 7/15) : Red signal. High risk of "chop" or reversal. Avoid new entries.
Step 3: Check the "Non-Trending" Filter
Look for the Non-Trending cell. If it is Dark Blue , the market has officially entered a "Trending State." If it is Gray, the market is sideways, and signals should be taken with caution.
Settings & Customization
Thickness: Defaulted to 3px for a strong chart presence.
Styles: Fully adjustable Solid, Dashed, and Dotted options in the Inputs tab.
Alerts: Built-in alert conditions for Strong Confluence (11/15) and State Flips (Long to Short).

AI Market Weather Forecast ProAI Market Weather Forecast Pro - Advanced Trading Indicator
Overview
AI Market Weather Forecast Pro is an innovative multi-timeframe trading system that uses global meteorological metaphors to visualize market conditions. By analyzing dimensional latitude regions, it transforms complex market data into intuitive global weather forecasts and temperature readings, helping traders quickly assess market sentiment and trend strength.
Core Features
🌍 Global Weather System
- Temperature Scale: -51°C to +51°C market temperature readings
- Weather Classifications: 9 distinct weather conditions from Freezing Cold to Scorching Heat
- Multi-Latitude Analysis: 5 climate zones representing different regional AI parameters
- Dynamic Temperature Engine: AI-powered algorithm calculates market "temperature" in real-time
- Trend Direction Indicator: Clear bullish/bearish/neutral classification
🌡️ Temperature-Based Signals
Hot Weather (Bullish Conditions):
- 🌡️ Scorching (35°C+): Strong Bull - Extreme bullish conditions
- ☀️ Hot (25°C-35°C): Bullish - Strong upward momentum
- 🌤️ Sunny (15°C-25°C): Mild Bull - Moderate bullish trend
- ⛅ Partly Cloudy (5°C-15°C): Weak Bull - Light bullish bias
Neutral Weather:
- ☁️ Overcast (-5°C to 5°C): Neutral - Consolidation/ranging market
Cold Weather (Bearish Conditions):
- 🌧️ Light Rain (-15°C to -5°C): Weak Bear - Light bearish bias
- 🌨️ Sleet (-25°C to -15°C): Mild Bear - Moderate bearish trend
- ❄️ Blizzard (-35°C to -25°C): Bearish - Strong downward momentum
- 🧊 Freezing Cold (-35°C-): Strong Bear - Extreme bearish conditions
📊 Five Latitude Climate Zones
Detects market conditions across 5 distinct "latitude zones", each representing progressively longer timeframes:
Each zone displays real-time weather status: ☀️ Clear (bullish), ❄️ Snow (bearish), or ☁️ Cloudy (neutral)
🎨 Advanced Visualization
Color-Coded Background:
- Orange/Yellow spectrum for bullish temperatures
- Gray for neutral conditions
- Blue spectrum for bearish temperatures
- Intensity increases with temperature extremes
Smart Weather Labels:
- Emoji-based weather icons for instant recognition
- Temperature readings in degrees
- Auto-positioned to avoid chart clutter
- Updates dynamically with trend changes
Comprehensive Weather Panel:
- Current weather condition
- Market temperature (°C)
- Trend direction classification
- Real-time status of all 5 latitude zones
- Current price and percentage change
Configuration Options
Display Settings
- Panel Position: 9 position options (corners, edges, center)
- Show Weather Panel: Toggle weather information panel on/off
- Show Background Color: Toggle background coloring on/off
- Show Weather Labels: Toggle weather labels on/off
- Background Display Days: Control how many days of coloring to display (1-30 days)
Alert System
Pre-configured alerts include:
- Weather Warming: Alert when temperature rises above 15°C
- Weather Cooling: Alert when temperature falls below -15°C
- Strong Trend Change: Alert when trend shifts to "Strong Bull" or "Strong Bear"
Information Panel Metrics
Real-time display includes:
- Current Weather: Visual weather condition with emoji
- Market Temperature: Numerical temperature reading (°C)
- Trend Direction: Clear classification (Strong Bull/Bullish/Mild Bull/Weak Bull/Neutral/Weak Bear/Mild Bear/Bearish/Strong Bear)
- Latitude Status: Weather conditions across all 5 climate zones
- Price & Change: Current price and percentage change
How to Interpret
Temperature Readings
- Above +25°C: Strong bullish conditions, consider long positions
- +15°C to +25°C*: Moderate bullish, good for trend following
- +5°C to +15°C: Mild bullish, cautious long bias
- -5°C to +5°C*: Neutral range, wait for clarity or range trade
- -15°C to -5°C: Mild bearish, cautious short bias
- -25°C to -15°C: Moderate bearish, good for short positions
- Below -25°C: Strong bearish conditions, consider short positions
Best Practices
1. Temperature Extremes: Focus on temperatures above +25°C or below -25°C for clear signals
2. Temperature Trend: Watch for rising/falling temperature trends, not just absolute values
3. Combine with Barometer*: Use alongside AI Market Barometer Pro for comprehensive analysis
4. Background Color: Quick visual assessment of overall market climate
Recommended Timeframes
- Scalping: 1-minute charts
- *Day Trading: 5-minute, 15-minute charts
Technical Requirements
- TradingView Pro, Pro+, or Premium account (required for multi-timeframe functionality)
- Compatible with all markets: Forex, Crypto, Stocks, Indices, Commodities
- Works on all timeframes from 1-minute to Monthly
Disclaimer
This indicator is a tool to assist with trading decisions. Past performance does not guarantee future results. Trading involves substantial risk of loss. Always use proper risk management and never risk more than you can afford to lose. The AI algorithms and temperature calculations are based on historical price patterns and technical analysis, not predictive guarantees.
What Makes This Different?
Unlike traditional indicators, AI Market Weather Forecast Pro:
- ✅ Uses intuitive meteorological metaphors for instant comprehension
- ✅ Analyzes multiple timeframe combinations simultaneously
- ✅ Calculates dynamic market "temperature" readings
- ✅ Provides 5-zone latitude system for confirmation
- ✅ Offers clear visual weather classifications
- ✅ Features unique temperature-based trend strength measurement
- ✅ Complements AI Market Barometer Pro for complete market analysis
Transform complex multi-timeframe analysis into simple weather forecasts. Know the market climate before you trade.
Perfect Companion to AI Market Barometer Pro
When used together with AI Market Barometer Pro:
- Barometer provides directional signals with AI confidence scores
- Weather provides overall market climate and temperature readings
- Combined gives you both precise entry signals AND broader market context
- Result: More informed trading decisions with better timing
© 2024 AI Market Weather Forecast Pro. All rights reserved. Proprietary algorithms and methodologies protected.

Medium-term TrendThis Medium-term Trend indicator is designed to identify short, mid, and long-term price pivots, track trend directions, and visualize key support and resistance zones. It excels at analyzing mid-term trends, the most optimal timeframe for traders, and delivers greater reliability when applied to larger chart periods. The indicator helps you dynamically observe the battle between bullish and bearish forces at mid-term highs and lows, enabling you to align your trades with the prevailing trend.
How to Use This Script
1. Core Parameter Adjustment
The only critical adjustable parameter for trend validation is Retrace Percentage (%).It defaults to 0.01, with a range of 0 to 20.0 (adjustable in 0.01 increments). This parameter defines the minimum retracement percentage required to confirm a trend change from bullish to bearish or vice versa. A higher value means a more conservative trend change confirmation (fewer false signals), while a lower value captures more frequent trend shifts (may include more noise).
2. Visual Display Controls (Toggle On/Off)
You can enable or disable the following visual elements via the indicator settings panel to match your chart clarity needs.
Pivot Point Displays
Show Short Points: Disable by default. When enabled, small green circles mark short-term lows and small red circles mark short-term highs, with tooltips showing the exact pivot price.
Show Mid Points: Enables by default. When enabled, tiny yellow circles mark mid-term lows and mid-term highs (the core of the indicator), with tooltips showing the exact pivot price. These points are key for identifying mid-term trend direction.
Show Long Points: Disables by default. When enabled, small blue circles mark long-term lows and long-term highs, with tooltips showing the exact pivot price.
Trend Channel Displays
Show Short Channel: Disables by default. When enabled, green lines connect consecutive short-term lows and red lines connect consecutive short-term highs, forming a short-term price channel.
Show Mid Channel: Disables by default. When enabled, yellow lines connect consecutive mid-term lows and mid-term highs, forming a mid-term price channel that clearly visualizes the mid-term trend trajectory.
Show Long Channel: Disables by default. When enabled, blue lines connect consecutive long-term lows and long-term highs, forming a long-term price channel for broader trend analysis.
Mid-term Pivot Rectangles (Core Visual Element)
Show Mid Rectangles: Enables by default. When enabled, transparent rectangles mark mid-term pivot zones (support and resistance) with dynamic break tracking.These rectangles extend to the right until the trend completes, helping you monitor price interactions with key mid-term levels.
3. Trend Identification & Trading Guidance
Key Trend Rules (Mid-term Focus)
Uptrend Confirmation: When mid-term lows show a sequential upward pattern (each subsequent mid-term low is higher than the previous one), the mid-term trend is bullish (uptrend).Downtrend Confirmation: When mid-term highs show a sequential downward pattern (each subsequent mid-term high is lower than the previous one), the mid-term trend is bearish (downtrend).Range Bound Condition: When mid-term highs and lows move sideways (no clear upward/downward sequence), the market is in a mid-term range.
4.How to Align Trades with the Trend
Observe Mid-term Pivot Interactions: Pay close attention to price reactions at the mid-term rectangles (purple for support, orange for resistance). These zones represent key battle areas between bulls and bears.
Uptrend Trading: In a confirmed mid-term uptrend, prioritize long trades when price touches or bounces from mid-term support rectangles (purple), with stop losses placed below the support rectangle’s bottom edge.
Downtrend Trading: In a confirmed mid-term downtrend, prioritize short trades when price touches or rejects from mid-term resistance rectangles (orange), with stop losses placed above the resistance rectangle’s top edge.
Range Trading: In a mid-term range, trade between consecutive mid-term support (purple) and resistance (orange) rectangles—buy near support and sell near resistance, with tight stop losses beyond the rectangle edges.
Trend Breakout Confirmation: When price closes beyond the top (uptrend breakout) or bottom (downtrend breakout) of a mid-term rectangle, and the rectangle stops extending, this signals a potential mid-term trend shift. Wait for a retest of the broken rectangle (if applicable) to enter trades in the direction of the breakout.
5. Best Practices
Optimal Timeframes: While the indicator works on all timeframes, it performs best on larger periods (4-hour, daily, weekly) where mid-term trends are more defined and less prone to noise.Mid-term Focus: For consistent trading results, prioritize mid-term signals (yellow pivot points, mid rectangles) over short-term signals, as mid-term trends offer higher probability trades with favorable risk-reward ratios.Avoid Overcluttering: Keep short-term and long-term displays disabled by default unless you need multi-timeframe confluence. Enabling too many visual elements can obscure key mid-term trend signals.Parameter Fine-Tuning: Adjust the Retrace Percentage (%) based on your asset’s volatility—use higher values (e.g., 0.5 to 2.0) for volatile assets (cryptocurrencies) and lower values (e.g., 0.01 to 0.2) for less volatile assets (blue-chip stocks).Dynamic Analysis: Regularly monitor the evolution of mid-term pivot rectangles and pivot point sequences—trends are not static, and early detection of shifting mid-term highs/lows can help you exit losing trades and capture new trend opportunities.
Disclaimer: This indicator is for educational and analytical purposes only. It does not constitute financial advice. Always conduct your own research and risk assessment before executing trades. For support or customization requests, please send a private message to the author.

Iridescent Liquidity Prism [JOAT]Iridescent Liquidity Prism | Peer Momentum HUD
A multi-layered order-flow indicator that combines microstructure analysis, smart-money footprint detection, and intermarket momentum signals. The script uses dynamic color-shifting themes to visualize liquidity patterns, structure, and peer momentum data directly on the chart.
There is so much to choose from inside the settings, if you think it's a mess on the chart it's because you have to personally customize it based on your needs...
Core Functionality
The indicator calculates and displays several analytical layers simultaneously:
Order-Flow Imbalance (OFI): Calculates buy vs. sell volume pressure using volume-weighted price distribution within each bar. Uses an EMA filter (default: 55 periods) to smooth the signal. Values are normalized using standard deviation to identify significant imbalances.
Smart Money Footprints: Detects accumulation and distribution zones by comparing volume rate of change (ROC) against price ROC. When volume ROC exceeds a threshold (default: 65%) and price ROC is positive, accumulation is detected. When volume ROC is high but price ROC is negative, distribution is detected.
Fractal Structure Mapping: Identifies pivot highs and lows using a fractal detection algorithm (default: 5-bar period). Maintains a rolling window of recent structure points (default: 4 levels) and draws connecting lines to show trend structure.
Fair Value Gap (FVG) Detection: Automatically detects price gaps where three consecutive candles create an imbalance. Bullish FVGs occur when the current low exceeds the high two bars ago. Bearish FVGs occur when the current high is below the low two bars ago. Gaps persist for a configurable duration (default: 320 bars) and fade when price fills the gap.
Liquidity Void Detection: Identifies candles where the high-low range exceeds an ATR threshold (default: 1.7x ATR) while volume is below average (default: 65% of 20-bar average). These conditions suggest areas where liquidity may be thin.
Price/Volume Divergence: Uses linear regression to detect when price trend direction disagrees with volume trend direction. A divergence alert appears when price is trending up while volume is trending down, or vice versa.
Peer Momentum Heatmap (PMH): Calculates composite momentum scores for up to 6 symbols across 4 timeframes. Each score combines RSI (default: 14 periods) and StochRSI (default: 14 periods, 3-bar smooth) to create a momentum composite between -1 and +1. The highest absolute momentum score across all combinations is displayed in the HUD.
Custom settings using Fractal Pivots, Skeleton Structure, Pulse Liquidity Voids, Bottom Colorful HeatMaps, and Iridescent Field.
---
Visual Components
Spectrum Aura Glow: ATR-weighted bands (default: 0.25x ATR) that expand and contract around price action, indicating volatility conditions. The thickness adapts to market volatility.
Chromatic Flow Trail: A blended line combining EMA and WMA of price (default: 8-period EMA blended with WMA at 65% ratio). The trail uses gradient colors that shift based on a phase oscillator, creating an iridescent effect.
Volume Heat Projection: Creates horizontal volume profile bands at price levels (default: 14 levels). Scans recent bars (default: 150 bars) to calculate volume concentration. Each level is colored based on its volume density relative to the maximum volume level.
Structure Skeleton: Dashed lines connecting fractal pivot points. Uses two layers: a primary line (2-3px width) and an optional glow overlay (4-5px width) for enhanced visibility.
Fractal Markers: Diamond shapes placed at pivot high and low points. Color-coded: primary color for highs, secondary color for lows.
Iridescent Color Themes: Five color themes available: Iridescent (default), Pearlescent, Prismatic, ColorShift, and Metallic. Colors shift dynamically using a phase oscillator that cycles through the color spectrum based on bar index and a speed multiplier (default: 0.35).
---
HUD Console Metrics
The right-side HUD displays seven key metrics:
Flow: Shows OFI status: ▲ FLOW BUY when normalized OFI exceeds imbalance threshold (default: 2.2), ▼ FLOW SELL when below -2.2, or ◆ FLOW BAL when balanced.
Struct: Structure trend bias: ▲ STRUCT BULL when microtrend > 2, ▼ STRUCT BEAR when < -2, or ◆ STRUCT RANGE when neutral.
Smart$: Institutional activity: ◈ ACCUM when smart money index = 1, ◈ DISTRIB when = -1, or ○ IDLE when inactive.
Liquid: Liquidity state: ⚡ VOID when a liquidity void is detected, or ● NORMAL otherwise.
Diverg: Divergence status: ⚠ ALERT when price/volume divergence detected, or ✓ CLEAR when aligned.
PMH: Peer Momentum Heatmap status: Shows dominant timeframe and momentum score. Displays 🪩 for bull surge (above 0.55 threshold) or 🧨 for bear surge (below -0.55).
FVG: Fair Value Gap status: Shows active gap count or CLEAR when no gaps exist. Displays GAP LONG when bullish gap detected, GAP SHORT when bearish gap detected.
Pearlscent Color with Volume Heatmap.
Parameters and Settings
Microstructure Engine:
Analysis Depth: 20-250 bars (default: 55) - Controls OFI smoothing period
Liquidity Threshold ATR: 1.0-4.0 (default: 1.7) - Multiplier for void detection
Imbalance Ratio: 1.5-6.0 (default: 2.2) - Standard deviations for OFI significance
Smart Money Layer:
Smart Money Window: 10-150 bars (default: 24) - Period for ROC calculations
Accumulation Threshold: 40-95% (default: 65%) - Volume ROC threshold
Structural Mapping:
Fractal Pivot Period: 3-15 bars (default: 5) - Period for pivot detection
Structure Memory: 2-8 levels (default: 4) - Number of structure points to track
Volume Heat Projection:
Heat Map Lookback: 60-400 bars (default: 150) - Bars to analyze for volume profile
Heat Map Levels: 5-30 levels (default: 14) - Number of price level bands
Heat Map Opacity: 40-100% (default: 92%) - Transparency of heat map boxes
Heat Map Width Limit: 6-80 bars (default: 26) - Maximum width of heat map boxes
Heat Map Visibility Threshold: 0.0-0.5 (default: 0.08) - Minimum density to display
Iridescent Enhancements:
Visual Theme: Iridescent, Pearlescent, Prismatic, ColorShift, or Metallic
Color Shift Speed: 0.05-1.00 (default: 0.35) - Speed of color phase oscillation
Aura Thickness (ATR): 0.05-1.0 (default: 0.25) - Multiplier for aura band width
Chromatic Trail Length: 2-50 bars (default: 8) - Period for trail calculation
Trail Blend Ratio: 0.1-0.95 (default: 0.65) - EMA/WMA blend percentage
FVG Persistence: 50-600 bars (default: 320) - Bars to keep FVG boxes active
Max Active FVG Boxes: 10-200 (default: 40) - Maximum boxes on chart
FVG Base Opacity: 20-95% (default: 80%) - Transparency of FVG boxes
Peer Momentum Heatmap:
Peer Symbols: Comma-separated list of up to 6 symbols (e.g., "BTCUSD,ETHUSD")
Peer Timeframes: Comma-separated list of up to 4 timeframes (default: "60,240,D")
PMH RSI Length: 5-50 periods (default: 14)
PMH StochRSI Length: 5-50 periods (default: 14)
PMH StochRSI Smooth: 1-10 periods (default: 3)
Super Momentum Threshold: 0.2-0.95 (default: 0.55) - Threshold for surge detection
Clarity & Readability:
Liquidity Void Opacity: 5-90% (default: 30%)
Smart Money Footprint Opacity: 5-90% (default: 35%)
HUD Background Opacity: 40-95% (default: 70%)
Iridescent Field:
Field Opacity: 20-100% (default: 86%) - Background color intensity
Field Smooth Length: 10-200 bars (default: 34) - Smoothing for background gradient
---
Alerts
The indicator provides seven alert conditions:
Liquidity Void Detected - Triggers when void conditions are met
Strong Order Flow - Triggers when normalized OFI exceeds imbalance ratio
Smart Money Activity - Triggers when accumulation or distribution detected
Price/Volume Divergence - Triggers when divergence conditions occur
Structure Shift - Triggers when structure polarity changes significantly
PMH Bull Surge - Triggers when PMH exceeds positive threshold (if enabled)
PMH Bear Surge - Triggers when PMH exceeds negative threshold (if enabled)
Bull/Bear Prismatic FVG - Triggers when new FVG is detected (if FVG display enabled)
---
Usage Considerations
Performance may vary on lower timeframes due to the volume heat map calculations scanning multiple bars. Consider reducing heat map lookback or levels if experiencing slowdowns.
The PMH feature requires data requests to other symbols/timeframes, which may impact performance. Limit the number of peer symbols and timeframes for optimal performance.
FVG boxes automatically expire after the persistence period to prevent chart clutter. The maximum box limit (default: 40) prevents excessive memory usage.
Color themes affect all visual elements. Choose a theme that provides good contrast with your chart background.
The indicator is designed for overlay display. All visual elements are positioned relative to price action.
Structure lines are drawn dynamically as new pivots form. On fast-moving markets, structure may update frequently.
Volume calculations assume typical volume data availability. Symbols without volume may show incomplete data for volume-dependent features.
---
Technical Notes
Built on Pine Script v6 with dynamic request capability for PMH functionality.
Uses exponential moving averages (EMA) and weighted moving averages (WMA) for trail calculations to balance responsiveness and smoothness.
Volume profile calculation uses price level buckets. Higher levels provide finer granularity but require more computation.
Iridescent color engine uses a phase oscillator with sine wave calculations for smooth color transitions.
Box management includes automatic cleanup of expired boxes to maintain performance.
All visual elements use color gradients and transparency for smooth blending with price action.
---
Customization Examples
Intraday Scalping Setup:
Analysis Depth: 30 bars
Heat Map Lookback: 100 bars
FVG Persistence: 150 bars
PMH Window: 15 bars
Fast color shift speed: 0.5+
Macro Structure Tracking:
Analysis Depth: 100+ bars
Heat Map Lookback: 300+ bars
FVG Persistence: 500+ bars
Structure Memory: 6-8 levels
Slower color shift speed: 0.2
---
Limitations
Volume heat map calculations may be computationally intensive on lower timeframes with high lookback values.
PMH requires valid symbol names and accessible timeframes. Invalid symbols or timeframes will return no data.
FVG detection requires at least 3 bars of history. Early bars may not show FVG boxes.
Structure lines connect points but do not predict future structure. They reflect historical pivot relationships.
Color themes are aesthetic choices and do not affect calculation logic.
The indicator does not provide trading signals. All visual elements are analytical tools that require interpretation in context of market conditions.
Open Source
This indicator is open source and available for modification and distribution. The code is published with Pine Script v6 compliance. Users are free to customize parameters, modify calculations, and adapt the visual elements to their trading needs.
For questions, suggestions, or anything please talk to me in private messages or comments below!
Would love to help!
- officialjackofalltrades

RSI Divergences KittenRSI Divergences + Adjustable RSI σ-Bands + Band Pierce Signals (with optional US weekend filter)
Description:
This indicator combines three RSI tools into one clean workflow:
1. RSI σ-Bands (mean ± k·σ)
It builds dynamic upper/lower bands around RSI using a moving mean and standard deviation. These bands adapt to regime changes (expanding in volatile periods, contracting in quiet periods). Bands can be clipped to RSI’s natural 0–100 range and optionally filled for readability.
2. Band “Pierce” Signals
It prints a marker when RSI crosses outside the upper band (overextension) or outside the lower band (underextension). These pierces are useful as timing signals for mean-reversion setups, especially when you expect price to revert back toward a reference mean (e.g., VWAP). Optional “re-entry” markers show when RSI crosses back inside the bands.
3. Proper RSI Divergences (Regular + Hidden)
Divergences are detected using RSI pivots (not price pivots). At each RSI pivot, the script samples the corresponding price high/low on that pivot bar and compares it to the previous pivot within a configurable bar-distance window.
• Bullish divergence: price lower low + RSI higher low
• Hidden bullish: price higher low + RSI lower low
• Bearish divergence: price higher high + RSI lower high
• Hidden bearish: price lower high + RSI higher high
Line width is configurable for visibility.
Manual Band Adjustment (Near-Miss Control):
If your best reversals “nearly” tag the band, you can manually tune sensitivity without rewriting the math:
• Band offset (RSI points): nudges trigger levels
• Band width scale: tightens/widens the σ-band envelope
US Weekend Filter (Optional):
You can optionally suppress pierce/divergence signals during US weekend hours (Fri 17:00 ET → Sun 17:00 ET) and optionally shade those periods to help isolate low-liquidity behavior.
Notes / Intended Use:
This is designed as a mean-reversion timing tool, not a standalone trading system. For best results, combine signals with a market “mean” (e.g., rolling VWAP) and basic risk controls.

Elite Monday Range V3- ProfessionalElite Monday Range V3 - Advanced Institutional Bias & Analysis
Overview
The Elite Monday Range V3 is a high-performance decision-support tool designed for traders who utilize the "Weekly Open" and "Monday's Range" as their primary benchmark for the trading week. Unlike standard range indicators, this script employs an advanced Multi-Asset Analysis Engine to determine the weekly bias with institutional-grade precision.
It doesn't just draw lines; it analyzes Previous Week's Close (PWC), Monday's Candle Structures (Price Action), and Internal Liquidity to provide a definitive "Directional Bias" and "Confidence Score."
Key Features
Smart Multi-Asset Detection: Automatically detects if you are trading Forex, Crypto, or Indices and adjusts its internal logic and strategy suggestions accordingly.
Institutional Bias Engine: Calculates a Confidence Score (from -4 to +4) based on 4 critical criteria:
Price vs. Previous Week Close: Checks if the bulls or bears are maintaining momentum from the prior week.
Monday Candle Analysis: Automatically identifies Pin Bars (Liquidity Grabs) or Strong Engulfing movements.
Price vs. Monday Midpoint (Equilibrium): The ultimate pivot point for weekly trend direction.
Price vs. Weekly Open: Tracks the "true" opening sentiment.
Liquidity Hunt Signals (Judas Swing): Visual alerts for LIQ BUY and LIQ SELL when price sweeps Monday's extremes and returns inside the range—a classic sign of institutional manipulation before a trend.
Symmetric Expansion Levels: Projects +50%, +100%, -50%, and -100% extensions of the Monday range to identify high-probability Take Profit (TP) and reversal zones.
Dynamic Professional Dashboard: A sleek, real-time table on your chart that summarizes Asset Type, Weekly Bias, Candle Info, and the Confidence Score.
Force Overlay Technology: Ensures all lines and labels remain visible and crisp on the top layer, above candles and other indicators.
How to Trade with the Elite Dashboard
Check the "Net Weekly Bias": Look for STRONG BULL or STRONG BEAR.
Verify Confidence Score: A score of 3 or 4 (or -3/-4 for shorts) indicates high-probability conditions.
Identify Entry: If the Bias is "STRONG BULL," wait for a retest of the Monday Mid (MID) or Monday High (MON H).
Confirm with Liquidity: Look for a LIQ BUY signal near the Monday Low for the highest-quality "A+ Setup."
Target: Use the Expansion Levels (+50% / +100%) as your primary targets for the week.
Technical Settings
Lookback Weeks: Choose exactly how many historical weeks to display to keep your chart clean.
Customizable Colors: Fully adjustable colors for Monday ranges and expansion projections.
Line Width: User-defined thickness for professional visual clarity.

Relative Strength Table📊 RRG Quadrant Scanner - Options Trading Market Direction Tool
A powerful Relative Rotation Graph/Table (RRG) dashboard designed to help OPTIONS TRADERS identify market direction, select optimal strikes, and time entries with precision. Track up to 8 symbols against any benchmark to determine bullish/bearish bias and rotation momentum.
---
🎯 WHY OPTIONS TRADERS NEED THIS
Unlike stock traders who can hold losing positions indefinitely, options traders face:
❌ Time decay (theta)
❌ Directional risk (delta)
❌ Volatility changes (vega)
❌ Limited time to be right
This indicator solves these challenges by showing you:
✅ Which direction momentum is flowing (calls vs puts)
✅ Which symbols/sectors have strongest trends (high probability setups)
✅ When rotation is happening (timing entries/exits)
✅ Market breadth for directional confirmation
---
🔥 HOW RRG QUADRANTS GUIDE OPTIONS TRADING
🟢 LEADING QUADRANT (Top Right) - BULLISH BIAS
What it means:
• Strong uptrend vs benchmark
• Accelerating momentum
• High relative strength
Options Strategies:
✅ BUY CALLS (ITM/ATM for safer, OTM for aggressive)
✅ SELL CASH-SECURED PUTS (collect premium on strong stocks)
✅ BULL CALL SPREADS (defined risk directional plays)
✅ LONG CALL DIAGONALS (capture continued uptrend)
Direction Signal: STRONG BULLISH
• Multiple symbols in Leading = broad market strength
• Index options: favor call side
• Stock options: bullish strategies on individual leaders
---
🔵 IMPROVING QUADRANT (Top Left) - EARLY BULLISH
What it means:
• Currently underperforming BUT gaining momentum
• Early reversal signal
• Rotation from weak to strong
Options Strategies:
✅ BUY CALLS with longer expiry (give time to develop)
✅ BULL PUT SPREADS (defined risk as support builds)
✅ SELL PUTS at support (premium collection on improving stocks)
✅ CALENDAR SPREADS (benefit from time and momentum shift)
Direction Signal: EMERGING BULLISH
• Symbols moving Lagging → Improving = early buy signal
• Best for patient options traders
• Use longer DTE (45-60 days) to allow rotation to complete
• Watch for move into Leading quadrant for confirmation
---
🔴 LAGGING QUADRANT (Bottom Left) - BEARISH BIAS
What it means:
• Weak relative strength
• Declining momentum
• Persistent underperformance
Options Strategies:
✅ BUY PUTS (directional bearish play)
✅ BEAR CALL SPREADS (defined risk on weakness)
✅ SELL COVERED CALLS (if stuck in position)
✅ PUT DEBIT SPREADS (cheaper than naked puts)
Direction Signal: STRONG BEARISH
• Multiple symbols in Lagging = market weakness
• Avoid bullish strategies entirely
• Index options: favor put side
• Exit existing long calls immediately
---
⚫ WEAKENING QUADRANT (Bottom Right) - EARLY BEARISH
What it means:
• Currently strong BUT losing momentum
• Topping signal
• Rotation from strong to weak
Options Strategies:
✅ SELL CALLS (initiate bearish bias)
✅ BEAR PUT SPREADS (cheaper than naked puts)
✅ CLOSE LONG CALLS (take profits before decay accelerates)
✅ PROTECTIVE PUTS (if holding stock positions)
✅ SHORT STRADDLES/STRANGLES (if expecting range-bound)
Direction Signal: EMERGING BEARISH
• Symbols moving Leading → Weakening = profit-taking signal
• Close bullish positions EARLY
• Initiate bearish strategies
• Watch for move into Lagging for confirmation of downtrend
---
🎯 MARKET DIRECTION CONFIRMATION FOR INDEX OPTIONS
Trading NIFTY/BANKNIFTY/SPX Options? Use this way:
📊 Track These Symbols Against Benchmark:
• Major sectors: Finance, IT, Energy, Auto, Pharma
• Top stocks: RELIANCE, HDFCBANK, INFY, TCS, etc.
• Benchmark: NIFTY or BANKNIFTY
🟢 BULLISH INDEX BIAS (Buy Calls/Sell Puts)
When you see:
• 60%+ symbols in Leading + Improving quadrants
• Financial sector in Leading (indicates BANKNIFTY strength)
• IT sector in Leading (indicates NIFTY strength)
• Few symbols in Lagging
Strategy: Aggressive call buying, put selling, bull spreads
🔴 BEARISH INDEX BIAS (Buy Puts/Sell Calls)
When you see:
• 60%+ symbols in Lagging + Weakening quadrants
• Key sectors rotating to Weakening
• Broad-based weakness across watchlist
Strategy: Put buying, bear spreads, avoiding new longs
⚖️ NEUTRAL/ROTATION PHASE (Iron Condors/Strangles)
When you see:
• Symbols evenly distributed across quadrants
• No clear cluster in any one quadrant
• Conflicting signals between sectors
Strategy: Range-bound strategies, avoid directional bets, reduce position size
---
💡 OPTIONS TRADING USE CASES
🎯 Case 1: Earnings Play Setup
Before earnings, check if stock is in:
• Leading = bullish bias, buy calls
• Improving = emerging strength, cautious calls
• Weakening = avoid or buy puts
• Lagging = strong puts
🎯 Case 2: Weekly Options Direction
Monday morning setup:
• Check sector quadrants vs benchmark
• Leading sectors = focus call trades there
• Weakening sectors = focus put trades
• Adjust delta exposure based on quadrant distribution
🎯 Case 3: Spread Selection
For credit spreads:
• Sell puts on Leading/Improving symbols (bullish)
• Sell calls on Weakening/Lagging symbols (bearish)
• Iron condors when symbols are scattered (no clear direction)
🎯 Case 4: Portfolio Hedging
If holding calls:
• Watch symbols move Leading → Weakening = add protective puts
• If 50%+ watchlist enters Weakening = hedge entire portfolio
If holding puts:
• Watch symbols move Lagging → Improving = close puts early
• If broad rotation to Improving = exit bearish positions
🎯 Case 5: Theta Decay Management
Leading quadrant = hold calls longer (trend supports you)
Weakening quadrant = close calls early (decay + downside risk)
Improving quadrant = be patient with calls (need time to develop)
Lagging quadrant = hold puts or exit quickly if rotation starts
---
📈 SECTOR ROTATION FOR OPTIONS STOCK SELECTION
Instead of trading index options, use quadrants to pick individual stocks:
Setup Example - NSE Options:
Symbols: RELIANCE, HDFCBANK, INFY, TCS, SBIN, ICICIBANK, TATAMOTORS, BAJFINANCE
Benchmark: NIFTY
Monday Strategy Session:
1. Check which stocks are in Leading quadrant
2. Focus call trades ONLY on Leading stocks
3. Check which stocks are in Weakening/Lagging
4. Focus put trades on those
5. Ignore stocks in unclear quadrants (save capital)
This approach:
✅ Increases win rate (trading with momentum)
✅ Reduces losses (avoiding weak stocks)
✅ Improves timing (catch early rotations)
---
🔥 REAL TRADING SCENARIOS FOR OPTIONS
📊 Scenario 1: Strong Bullish Market
Quadrant Status:
• Leading: 5 symbols
• Improving: 2 symbols
• Weakening: 1 symbol
• Lagging: 0 symbols
Options Action:
✅ Aggressive call buying on index
✅ Bull call spreads on leading stocks
✅ Sell puts on improving stocks
✅ Avoid bearish strategies
✅ Larger position sizes (conviction high)
---
📊 Scenario 2: Rotation/Choppy Market
Quadrant Status:
• Leading: 2 symbols
• Improving: 2 symbols
• Weakening: 2 symbols
• Lagging: 2 symbols
Options Action:
⚠️ AVOID directional bets
✅ Iron condors/strangles (profit from range)
✅ Calendar spreads (volatility plays)
✅ Smaller position sizes
✅ Wait for clearer rotation signal
---
📊 Scenario 3: Bearish Reversal
Quadrant Status:
• Leading: 1 symbol
• Improving: 0 symbols
• Weakening: 3 symbols
• Lagging: 4 symbols
Options Action:
✅ Buy puts on index
✅ Bear call spreads on weakening stocks
✅ CLOSE all long calls immediately
✅ Sell covered calls if stuck in stocks
✅ Increase hedge positions
---
📊 Scenario 4: Early Recovery
Quadrant Status:
• Leading: 1 symbol
• Improving: 4 symbols (moving from Lagging)
• Weakening: 1 symbol
• Lagging: 2 symbols
Options Action:
✅ Buy calls with 45-60 DTE (give time to develop)
✅ Bull put spreads on improving stocks
✅ Small position sizes initially
✅ Scale in as symbols move to Leading
✅ Close remaining bearish positions
---
🎯 TIMING ENTRY/EXIT WITH QUADRANTS
📍 BEST CALL ENTRIES:
1. Symbol moves Improving → Leading (momentum confirmed)
2. 70%+ watchlist in Leading/Improving (broad strength)
3. Key sector enters Leading (focused strength)
📍 BEST PUT ENTRIES:
1. Symbol moves Weakening → Lagging (downtrend confirmed)
2. 70%+ watchlist in Weakening/Lagging (broad weakness)
3. Leading symbols suddenly drop to Weakening (reversal)
📍 EXIT SIGNALS:
Calls: Close when symbol enters Weakening
Puts: Close when symbol enters Improving
Both: Take profits at 50-70% max gain if rotation unclear
---
⚙️ SETUP FOR OPTIONS TRADERS
For NIFTY Options Traders:
• Symbols: Top 8 NIFTY stocks (RELIANCE, HDFCBANK, INFY, etc.)
• Benchmark: NIFTY
• Window: 20 periods
• Timeframe: Daily chart
• Use: Gauge NIFTY direction
For BANKNIFTY Options Traders:
• Symbols: Banking stocks (HDFCBANK, ICICIBANK, SBIN, KOTAKBANK, AXISBANK)
• Benchmark: BANKNIFTY
• Window: 20 periods
• Use: Gauge BANKNIFTY direction
For Stock Options Traders:
• Symbols: Your watchlist of optionable stocks
• Benchmark: Relevant sector index
• Window: 10-20 periods
• Use: Pick strongest/weakest for directional trades
---
🎓 OPTIONS TRADING RULES USING QUADRANTS
✅ Rule 1: Only buy calls on Leading/Improving stocks
✅ Rule 2: Only buy puts on Weakening/Lagging stocks
✅ Rule 3: Exit calls when stock enters Weakening
✅ Rule 4: Exit puts when stock enters Improving
✅ Rule 5: Use longer DTE when trading Improving/Weakening (rotation takes time)
✅ Rule 6: Use shorter DTE when trading Leading/Lagging (established trends)
✅ Rule 7: If 70%+ watchlist in one side = strong directional bias
✅ Rule 8: If symbols scattered = reduce position sizes, play neutral
---
🏆 ADVANTAGES FOR OPTIONS TRADERS
✅ HIGHER WIN RATE
Trade only symbols with clear momentum direction
✅ BETTER TIMING
Catch rotations early = maximize profit potential
✅ REDUCED THETA DECAY LOSSES
Don't hold calls on weakening stocks (double loss)
✅ CLEARER MARKET BIAS
Know if market is bullish/bearish/neutral
✅ PORTFOLIO ALIGNMENT
Match your delta exposure to market direction
✅ EARLY WARNING SYSTEM
Spot rotations before price breaks down/up
✅ RISK MANAGEMENT
Exit positions before momentum shifts against you
---
📚 COMBINING WITH OTHER ANALYSIS
This indicator works best when combined with:
📊 Technical Analysis
• Support/Resistance for strike selection
• Chart patterns for entry timing
• Volume for confirmation
📈 Volatility Analysis
• IV Rank for premium selling decisions
• VIX/India VIX for overall market risk
⏰ Time Analysis
• Check quadrants before weekly expiry
• Align DTE with expected rotation speed
💰 Greeks Management
• High delta on Leading symbols (directional confidence)
• Low delta on Improving symbols (early, needs time)
• Negative delta on Weakening/Lagging (bearish bias)
---
⚠️ WHAT THIS INDICATOR DOESN'T DO
❌ Doesn't predict exact option prices
❌ Doesn't tell you which strike to buy
❌ Doesn't replace risk management
❌ Doesn't account for news/events
❌ Doesn't consider implied volatility
❌ Doesn't guarantee winning trades
It DOES give you:
✅ Market direction bias
✅ Symbol selection edge
✅ Rotation timing awareness
✅ Risk/reward framework
---
🎯 BOTTOM LINE FOR OPTIONS TRADERS
Stop fighting momentum. Stop buying calls on weakening stocks. Stop holding positions through rotations.
Instead:
• Check quadrants BEFORE entering trades
• Buy calls only on Leading/Improving
• Buy puts only on Weakening/Lagging
• Exit when rotation signals change
• Adjust position size based on breadth
This simple framework can dramatically improve your options trading win rate and reduce catastrophic losses from holding through momentum reversals.
---
⭐ START TRADING WITH THE TREND
Add this RRG Quadrant Scanner and align your options trades with market rotation - not against it!

Dual-Engine Regime and Flow OscillatorDual-Engine Regime & Flow Oscillator (DERFI)
OVERVIEW
The DERFI is a market structure study that decouples price velocity from institutional volume participation. By combining an adaptive momentum engine with a normalized liquidity gauge, it highlights:
High-conviction trends backed by strong volume
Low-participation or "exhaustion" phases where price diverges from volume
TECHNICAL LOGIC & ORIGINALITY
Published as Protected to safeguard our proprietary regime-detection methodology. DERFI leverages two data streams:
Momentum Engine (Adaptive Price Velocity)
Dual-lookback smoothing with a 50-median center
Visualizes relative move velocity vs historical volatility
Liquidity & Activity Gauge (Volume Flow Proxy)
Normalized volume flow filtered for noise
Linear regression smoothing (10-period) to isolate institutional activity
HOW TO USE: ANALYZING MARKET REGIMES
High-Conviction Trends (Convergence)
Bullish: Momentum > 50 and Liquidity Gauge > 50 → price supported by institutional flow
Bearish: Both engines < 50 → strong selling pressure confirming downtrend
Spotting Thin Moves (Divergence)
Liquidity Lag: Momentum high (>80) but Liquidity <50 or falling → weak participation, possible pullback
Absorption Phase: Rising Liquidity with neutral Momentum → accumulation or distribution without major price move
Volatility Extremes
Exhaustion Zones: 80 (Overbought) and 20 (Oversold) act as caution flags, not automatic fade signals
Squeeze Read: Extreme Momentum + strong Liquidity → trend likely continues; drop in Liquidity → trend may end
USER INPUTS
Fast/Slow Momentum Lengths: Adjusts sensitivity of momentum engine
VFI Length: Smooths liquidity gauge for your timeframe
VFI Cutoff: Sets threshold for significant volume flow
NOTES
For historical visualization and educational purposes only. No trade signals, alerts, or financial advice. All calculations are proprietary and protected to maintain GammaBulldog research integrity.

ABC Risk Management SystemOverview
This script is a comprehensive execution engine designed for high-frequency momentum trading (optimized for MES/ES Futures). It solves the problem of "grade inflation" in trading by strictly categorizing setups based on Multi-Timeframe (MTF) alignment and volatility.
How it Works
The script utilizes a 5-Minute Bias Engine to filter a 1-Minute Execution Chart. It relies on the relationship between the CCI (Commodity Channel Index) and its 20-period SMA using Typical Price (HLC3).
The Grading Hierarchy
Grade A+ (The Trend Follower): Triggered when the 5m Trend is strong (ADX > 25) and 1m momentum is perfectly aligned.
Grade B (The Momentum Burst): Triggered in "Lazy Markets" (5m ADX < 25). The script automatically raises the entry requirement to a 140 CCI burst to filter out noise.
Grade C (The Mean Reversion): Triggered when 1m internals (ADX/DI/CCI) are powerful enough to trade against the 5m Bias.
Key Indicators Included
T3 Pulse Lead: A specialized, color-coded trailing line used for dynamic stop-loss management.
Price-Locked Labels: Signals are pinned to the High/Low of the specific candle to provide exact price levels for entry.
🚀 Release Notes: Version 3.0 (The "ABC" Update)
New Features & Logic Fixes:
Strict Binary Bias: Removed all level-based filters for the HTF trend. The bias is now determined solely by the crossover of the 5m CCI and its SMA.
Bullish: 5m CCI > 5m SMA (regardless of positive/negative value).
Bearish: 5m CCI < 5m SMA.
Adaptive ADX Scaling: If 5m ADX falls below 25, the 1m CCI trigger is automatically moved from 100 to 140 to compensate for the lack of trend strength.
Visual Overhaul: Replaced generic shapes with Price-Locked Text Labels.
Longs: Labels appear below the candle (Green/Lime/Purple).
Shorts: Labels appear above the candle (Red/Maroon/Orange).
T3 Pulse Integration: Added the T3 Pulse Lead (8-period) directly into the overlay to facilitate the "T3 Trailing Stop" methodology.
Typical Price Standard: Standardized all calculations to HLC3 to align with professional S&P 500 momentum standards.
How to Setup the Chart:
Apply script to a 1-Minute Chart.
Ensure your 5-minute CCI settings in your separate indicator match (20 SMA, HLC3 Source).
Follow the A/B/C Risk Management Protocol (0.5% / 0.25% / 0.10% risk)

Alpha Options System# Apex Options Sniper - Advanced Multi-Signal Day Trading System
## 🎯 Overview
**Apex Options Sniper** is a professional-grade, multi-signal trading indicator specifically engineered for high-probability day trading of weekly options. This comprehensive system combines 10+ technical indicators into a sophisticated scoring algorithm that identifies optimal entry points with institutional-level precision.
Perfect for traders of SPY, QQQ, and high-volume stocks, this indicator eliminates guesswork by providing clear BUY CALLS and BUY PUTS signals based on multiple technical confluences.
---
## 🚀 Key Features
### **Multi-Signal Confluence Engine**
- **10+ Technical Indicators** working in harmony
- **Weighted Scoring System** (0-30+ points) for signal strength
- **Real-time Signal Classification**: Strong vs Moderate signals
- **False Signal Reduction** through multi-confirmation requirements
### **Advanced Momentum Analysis**
- ✅ RSI with Divergence Detection (bullish & bearish)
- ✅ Stochastic Oscillator (oversold/overbought + crossovers)
- ✅ MACD with crossover and momentum confirmation
- ✅ Automatic divergence spotting for reversal trades
### **Sophisticated Trend Detection**
- ✅ Triple EMA System (9/21/50) with alignment scoring
- ✅ SuperTrend Indicator with trend flip alerts
- ✅ VWAP for institutional price levels
- ✅ Multi-timeframe trend confirmation
### **Professional Volume Analysis**
- ✅ Volume Spike Detection (vs 20-period average)
- ✅ OBV (On-Balance Volume) with divergence detection
- ✅ Order Flow Analysis (buy vs sell pressure)
- ✅ Relative volume ratio display
### **Advanced Pattern Recognition**
- ✅ Bollinger Band Squeeze detection (volatility expansion)
- ✅ BB breakout signals (major move initiation)
- ✅ Automatic Support & Resistance levels (pivot-based)
- ✅ Price reaction scoring at key levels
### **Built-in Risk Management**
- ✅ ATR-based Stop Loss calculations
- ✅ Customizable Risk:Reward ratios
- ✅ Position sizing recommendations
- ✅ Real-time profit target calculations
### **Comprehensive Visual Dashboard**
- ✅ Live scoring breakdown for all indicators
- ✅ Individual signal strength display
- ✅ Bull vs Bear score comparison
- ✅ Color-coded signal status
- ✅ Risk management metrics
---
## 📊 How It Works
### **Scoring System**
The indicator assigns points based on technical conditions:
| **Category** | **Max Points** | **Conditions** |
|-------------|---------------|----------------|
| Momentum (RSI/Stoch) | 8 | Oversold/overbought + divergences |
| MACD | 4 | Crossovers + momentum direction |
| Trend (EMAs) | 6 | EMA alignment + SuperTrend |
| Volume | 4 | Spikes + OBV divergences |
| Order Flow | 2 | Buy/sell pressure imbalance |
| Bollinger Bands | 2 | Squeeze + breakouts |
| Support/Resistance | 2 | Price at key levels |
| VWAP | 1 | Above/below institutional level |
### **Signal Thresholds**
- **🚀 STRONG CALLS**: Bull score ≥6, Net score ≥4
- **📈 CALLS**: Bull score ≥4, Net score ≥2
- **🔥 STRONG PUTS**: Bear score ≥6, Net score ≤-4
- **📉 PUTS**: Bear score ≥4, Net score ≤-2
### **Multi-Timeframe Filter**
Optional higher timeframe confirmation reduces false signals by ensuring the broader trend supports your trade direction.
---
## 🎮 How to Use
### **Installation**
1. Open TradingView Pine Editor
2. Paste the complete indicator code
3. Click "Add to Chart"
4. Customize settings to your preference
### **Recommended Settings**
**For SPY/QQQ Day Trading:**
- Timeframe: 1-minute or 5-minute
- Strong Signal Threshold: 6
- Moderate Signal Threshold: 4
- Multi-timeframe Confluence: ON
**For Individual Stocks:**
- Timeframe: 5-minute or 15-minute
- Increase SuperTrend multiplier to 3.5-4.0
- Enable all advanced features
**For Scalping:**
- Timeframe: 1-minute
- Use STRONG signals only (6+)
- Tight stop loss (1.0-1.5 ATR multiplier)
### **Best Trading Times**
- **9:30-11:00 AM EST** - Highest volume, strongest signals
- **2:00-4:00 PM EST** - Afternoon momentum plays
- Avoid 11:30 AM-1:30 PM EST (lunch chop)
---
## 📈 Signal Interpretation
### **What You'll See on Chart:**
**Visual Signals:**
- 🟢 **Green Triangle (CALLS)**: Bullish entry point
- 🟢 **Large Green Triangle (STRONG CALLS)**: High-confidence bullish entry
- 🔴 **Red Triangle (PUTS)**: Bearish entry point
- 🔴 **Large Red Triangle (STRONG PUTS)**: High-confidence bearish entry
- 💎 **Small Diamonds**: RSI/OBV divergences (reversal warning)
**Dashboard Information:**
- Individual indicator values and signals
- Real-time score breakdown
- Bull/Bear score totals
- ATR stop loss levels
### **Entry Rules:**
✅ **High Probability Trades (Take These):**
- Strong signal (6+ score)
- 3+ indicators confirming
- Volume spike present
- SuperTrend aligned
- Higher timeframe confirms
⚠️ **Moderate Trades (Smaller Position):**
- Moderate signal (4-5 score)
- 2+ indicators confirming
- Normal volume
- Mixed trend signals
❌ **Avoid These:**
- Conflicting signals (Bull score ≈ Bear score)
- Low volume
- During major news events
- Bollinger squeeze without breakout direction
---
## 🛡️ Risk Management Guide
### **Position Sizing:**
- **Strong Signals (6+)**: 3-5% of portfolio
- **Moderate Signals (4-5)**: 2-3% of portfolio
- **Low Conviction**: 1-2% or skip
### **Stop Loss Strategy:**
- Use ATR-based stops (displayed in dashboard)
- Default: 1.5x ATR from entry
- Weekly options: 30-50% premium loss maximum
- Never hold through stop loss hoping for recovery
### **Profit Targets:**
- **Quick Scalps**: 25-50% gain (15-30 min)
- **Day Trades**: 50-100% gain (same day exit)
- **Swing**: 100-200% gain (1-2 days max for weeklies)
- **Take partial profits** at first target, let rest run
### **Time Decay Management (Weekly Options):**
- Monday-Wednesday: Hold overnight acceptable on strong signals
- Thursday: Close by EOD unless very strong conviction
- Friday: Avoid holding overnight, theta decay accelerates
---
## 🔔 Alert Configuration
### **Recommended Alerts:**
**Essential Alerts:**
1. 🚀 Strong Buy Calls
2. 🔥 Strong Buy Puts
**Advanced Alerts:**
3. 💎 RSI Bullish Divergence
4. ⚠️ RSI Bearish Divergence
5. 🔶 Bollinger Band Squeeze
6. ✅ SuperTrend Bull Flip
7. ❌ SuperTrend Bear Flip
**Alert Setup:**
- Set frequency: "Once Per Bar Close"
- Enable for all devices
- Use webhook for automation (optional)
---
## 💡 Pro Trading Tips
### **Maximize Win Rate:**
1. **Wait for confluence** - Best trades have 3+ indicators aligned
2. **Respect the dashboard** - Check WHY it's signaling (which indicators)
3. **Volume is king** - Signals with volume spikes are significantly more reliable
4. **Use BB Squeeze** - When squeeze + signal = explosive directional move
5. **SuperTrend flips** - Major trend change confirmations, very powerful
6. **Watch for divergences** - Diamond markers = hidden reversal opportunities
### **Common Mistakes to Avoid:**
❌ Trading every signal (be selective)
❌ Ignoring volume (volume confirms everything)
❌ Fighting the higher timeframe trend
❌ Oversizing positions on moderate signals
❌ Holding weekly options too long (theta decay)
❌ Trading during lunch hour (11:30-1:30 EST)
### **Advanced Techniques:**
- **Divergence + Support/Resistance** = Highest probability reversals
- **BB Squeeze + EMA alignment** = Explosive trend continuations
- **SuperTrend flip + Volume spike** = Major trend change entries
- **Multiple timeframe analysis** - Check 5m signal on 1m chart for precision entries
---
## 📊 Indicator Components Explained
### **RSI (Relative Strength Index)**
- Measures momentum and overbought/oversold conditions
- Divergences signal potential reversals before they happen
- Score: 2-3 points for extremes and divergences
### **Stochastic Oscillator**
- Confirms momentum extremes
- Crossovers provide entry timing
- Score: 1-2 points
### **MACD (Moving Average Convergence Divergence)**
- Trend following momentum indicator
- Crossovers signal momentum shifts
- Score: 1-3 points based on signal strength
### **EMA System (9/21/50)**
- Dynamic support and resistance
- Alignment shows trend strength
- Price position relative to EMAs scores 1-2 points
### **SuperTrend**
- Volatility-based trend indicator
- Reduces whipsaws in choppy conditions
- Trend flips are major signals (2 points)
### **Bollinger Bands**
- Volatility measurement
- Squeeze = calm before the storm
- Breakouts = directional move initiation (2 points)
### **Volume Analysis**
- Confirms price movement legitimacy
- Spikes validate signals (2 points)
- OBV divergences predict reversals (2 points)
### **Order Flow**
- Buy vs sell pressure measurement
- Institutional footprint detection
- Score: 2 points for strong imbalances
---
## 🎓 Learning Path
### **Beginner (Week 1-2):**
- Use STRONG signals only
- Focus on high-volume stocks (SPY/QQQ)
- Trade only first hour of market
- Use paper trading first
### **Intermediate (Week 3-4):**
- Add moderate signals to your arsenal
- Learn to read the dashboard
- Understand why each signal triggers
- Start combining with support/resistance
### **Advanced (Month 2+):**
- Use divergence signals
- Trade BB squeeze breakouts
- Optimize settings for your style
- Develop your own confluence rules
---
## ⚙️ Customization Guide
### **Adjustable Parameters:**
**Momentum Settings:**
- RSI Length (default: 14)
- RSI Oversold/Overbought levels (30/70)
- Stochastic Length (14)
**Trend Settings:**
- EMA periods (9/21/50)
- SuperTrend ATR Length (10)
- SuperTrend Multiplier (3.0)
**Volume Settings:**
- Volume MA Length (20)
- Volume Spike Threshold (1.5x)
**Advanced Settings:**
- Bollinger Band Length (20)
- BB Standard Deviation (2.0)
- Pivot Lookback (10)
**Signal Thresholds:**
- Strong Signal Score (default: 6)
- Moderate Signal Score (default: 4)
**Risk Management:**
- ATR Length (14)
- Stop Loss Multiplier (1.5)
- Risk:Reward Ratio (2.0)
---
## 📈 Performance Optimization
### **For Volatile Markets (VIX > 25):**
- Increase SuperTrend multiplier to 4.0
- Raise signal thresholds (+1 point)
- Tighten stop losses (1.0-1.2 ATR)
### **For Ranging Markets:**
- Focus on RSI extremes and divergences
- Use BB squeeze signals
- Ignore moderate signals
- Wait for support/resistance confirmation
### **For Trending Markets:**
- Follow SuperTrend direction religiously
- Use EMA alignment signals
- Allow wider stops (2.0 ATR)
- Take partial profits, let winners run
---
## 🔍 Troubleshooting
**Too Many Signals:**
- Increase signal thresholds to 7/5
- Enable multi-timeframe filter
- Trade only STRONG signals
**Missing Signals:**
- Decrease thresholds to 5/3
- Disable multi-timeframe filter
- Check that all features are enabled
**Whipsaw in Choppy Markets:**
- Increase SuperTrend multiplier
- Require volume spike confirmation
- Avoid trading 11:30 AM-1:30 PM EST
---
## 🏆 Best Practices
✅ **Always check:**
1. Dashboard shows why signal triggered
2. Volume confirms the move
3. Not during news events
4. Adequate time until expiration
✅ **Risk Management:**
1. Never risk more than 2% per trade
2. Use stops religiously
3. Take profits at targets
4. Don't revenge trade
✅ **Journal Your Trades:**
1. Entry price and signal strength
2. Which indicators triggered
3. Exit price and profit/loss
4. What worked and what didn't
---
## 📞 Support & Updates
This indicator is designed to evolve with market conditions. Recommended to:
- Review settings monthly
- Backtest on your favorite instruments
- Adjust thresholds based on your risk tolerance
- Keep a trading journal to track performance
---
## ⚠️ Disclaimer
This indicator is a tool for technical analysis and should not be used as the sole basis for trading decisions. Options trading involves substantial risk and is not suitable for all investors. Past performance does not guarantee future results. Always:
- Do your own research and due diligence
- Never invest more than you can afford to lose
- Consider consulting with a financial advisor
- Practice with paper trading before using real money
- Understand options Greeks (Delta, Theta, Gamma, Vega)
- Be aware of earnings dates and major news events
**No indicator is 100% accurate. Use proper risk management and trade responsibly.**
---
## 📊 Version History
**v1.0 - Initial Release**
- Multi-signal confluence system
- 10+ technical indicators
- Advanced dashboard
- ATR-based risk management
- Comprehensive alert system
---
## 🎯 Final Thoughts
**Apex Options Sniper** transforms complex technical analysis into clear, actionable signals. By combining multiple proven indicators with sophisticated scoring logic, it helps traders identify high-probability setups while managing risk effectively.
**Success Keys:**
- Quality over quantity (be selective)
- Risk management is everything
- Volume confirms the signal
- Confluence increases probability
- Discipline beats emotion
**Trade smart. Trade with confidence. Trade with Apex Options Sniper.**
---
*For questions, suggestions, or to share your success stories, please comment below or send a message.*
**Happy Trading! 🚀📈**

Cross-Option Pair Intelligence# Elite Cross-Option Pair Intelligence System
## **Discover Options Trades BEFORE The Breakout - Institutional Cross-Strike Compression Analysis**
***
## **🔥 THE GAME-CHANGING DIFFERENCE**
Most option traders wait for price to move, then chase expensive options. **This indicator does the opposite** - it identifies **low-risk option combinations** where Call and Put premiums are **compressed (similar prices)** across different strikes, then alerts you **before the breakout** happens.
### **What Makes This Unique?**
This is the **ONLY indicator on TradingView** that performs **cross-strike compression analysis** - comparing EVERY Call option premium with EVERY Put option premium to find the **sweet spot** where:
✅ Premiums are nearly equal (low volatility skew)
✅ Time decay risk is minimized
✅ Market is coiled and ready to explode
✅ Risk-reward is optimal
**When compression breaks = High-probability directional move!**
***
## **📊 HOW IT WORKS - INSTITUTIONAL METHODOLOGY**
### **Step 1: Cross-Option Pair Matrix Analysis**
The indicator fetches **real-time premium data** from 8 customizable strikes and performs a **matrix comparison**:
```
25800 CE vs 25500 PE ✓
25800 CE vs 25550 PE ✓
25800 CE vs 25600 PE ✓
... (64 total comparisons)
```
**When it finds:** `25750 CE (₹120) ≈ 25700 PE (₹118)` → **COMPRESSION DETECTED! ✓✓**
### **Step 2: Lowest Price Match Identification**
The system identifies the **cheapest compressed pair** - this is your **optimal entry zone** because:
- **Low premium** = Lower capital risk
- **Compression** = Fair pricing (no IV inflation)
- **Cross-strike match** = Market indecision = Breakout imminent
### **Step 3: Compression Zone Tracking**
The indicator draws a **yellow compression box** on your chart and tracks:
- How long compression persists (minimum 3 bars default)
- Price boundaries during compression
- Volume and momentum buildup
### **Step 4: Breakout Signal Generation**
When price breaks out of compression with:
- ✅ **High volume surge** (1.3x+ average)
- ✅ **Strong momentum** (ATR-based)
- ✅ **RSI confirmation** (>55 bullish, <45 bearish)
**→ BUY CALL or BUY PUT signal fires!**
***
## **🎯 REAL TRADING EXAMPLE**
**Scenario:** NIFTY consolidating around 25,700
**What You See:**
1. **Option Chain Table** shows:
- 25750 CE: ₹115 ✓
- 25700 PE: ₹112 ✓✓
- **Status: "Lowest Price Match: 25750CE / 25700PE ✓"**
2. **Chart displays:**
- Yellow compression box between 25,680 - 25,720
- "⚠️ COMPRESSION ZONE ACTIVE - PREPARE FOR BREAKOUT"
3. **Price breaks above 25,720 with volume**
- 🔥 **BUY CALL signal appears!**
- **Strike: 25750CE**
- **Entry: ₹25,735**
- **T1: ₹25,795 (1.5x compression range)**
- **T2: ₹25,855 (2.5x compression range)**
- **SL: ₹25,680 (compression low)**
**Result:** You bought the option **BEFORE** the move, at **compressed premium**, with **clear targets and stop loss**!
***
## **💎 KEY FEATURES**
### **1. Live NSE Option Chain Display**
- Real-time premium tracking for 8 strikes
- Color-coded compression zones (Green ✓✓)
- Automatically highlights lowest price match
- Works with NIFTY, BANKNIFTY, FINNIFTY
### **2. Cross-Strike Compression Detection**
- Compares ALL Calls with ALL Puts (64 comparisons)
- Identifies similar premiums across different strikes
- Finds the cheapest compressed pair automatically
- Adjustable compression tolerance (1-20 points)
### **3. Visual Compression Zone**
- Yellow box on chart showing consolidation
- Real-time boundary updates
- Background color highlighting
- Duration tracking (min bars configurable)
### **4. Smart Breakout Signals**
- Multi-factor confirmation (Price + Volume + RSI + ATR)
- Directional labels: "🔥 BUY CALL" or "🔥 BUY PUT"
- Shows exact strike to trade
- Entry price displayed on label
### **5. Automatic Target Calculation**
- T1: 1.5x compression range expansion
- T2: 2.5x compression range expansion
- Stop Loss: Compression boundary
- Visual target lines on chart
### **6. Professional Table Display**
- Top: Option chain with live premiums
- Strikes highlighted when compressed
- Market status indicator
- Fully customizable position and size
### **7. Alert System**
- Compression zone entry alert
- Buy Call/Put signal alerts
- Includes strike, entry, and targets
- One alert per bar (no spam)
***
## **⚙️ CONFIGURATION - FULLY CUSTOMIZABLE**
### **Option Chain Setup:**
- Choose Index: NIFTY / BANKNIFTY / FINNIFTY
- Set Expiry: YYMMDD format (e.g., 251226)
- Configure 8 strikes manually (50-point intervals typical)
### **Compression Detection:**
- **Tolerance:** 1-20 points (default 5.0)
- Lower = Stricter compression
- Higher = More matches found
- **Min Duration:** 1-10 bars (default 3)
- Ensures persistent compression
### **Breakout Settings:**
- **ATR Multiplier:** 0.5-5.0 (default 1.5)
- **Volume Threshold:** 1.0-3.0x (default 1.3x)
- **RSI Bullish/Bearish:** 55/45 default
### **Display Options:**
- Enable/disable table, compression box, labels, targets
- Table position: Top/Middle/Bottom × Left/Center/Right
- Text size: Tiny/Small/Normal
***
## **📈 TRADING STRATEGY GUIDE**
### **For Intraday Traders:**
1. **Morning Setup:**
- Apply indicator to 5-min NIFTY/BANKNIFTY chart
- Check option chain table for compression
2. **Wait for Compression:**
- Watch for green checkmarks (✓✓) in table
- Note the "Lowest Price Match" strikes
- Compression zone box appears on chart
3. **Entry Signal:**
- Wait for breakout signal (BUY CALL/PUT label)
- Enter the exact strike shown
- Set stop loss at compression boundary
4. **Exit Strategy:**
- Take partial profit at T1 (1.5x move)
- Trail stop loss to entry
- Full exit at T2 (2.5x move)
### **For Swing Traders:**
1. **Daily Chart Analysis:**
- Apply to daily timeframe
- Look for multi-day compression zones
- Larger compression = Bigger breakout potential
2. **Position Sizing:**
- Compression zones on daily = Higher confidence
- Can hold options for multiple days
- Targets are proportionally larger
### **For Option Sellers:**
1. **Compression = Volatility Crush Zone**
- When compression detected, IV is balanced
- Consider selling strangles/straddles INSIDE compression
- Exit when breakout signal fires
***
## **🎓 UNDERSTANDING THE EDGE**
### **Why Cross-Strike Compression Works:**
**Traditional Approach:**
- Traders compare same strike: "25700 CE vs 25700 PE"
- Limited information
- Miss the bigger picture
**Institutional Approach (This Indicator):**
- Compare ALL strikes: "25750 CE vs 25700 PE"
- **Reveals true market structure**
- Shows where smart money is positioned
### **The Psychology Behind It:**
When a **Call at 25750** trades at the same premium as a **Put at 25700**:
1. **Option writers** (institutions) see balanced risk
2. **Implied volatility** is not inflated
3. **Market makers** are comfortable with prices
4. **Time decay** is priced fairly
**This creates a LOW-RISK entry point!**
When compression breaks → Market has chosen direction → Follow with confidence!
***
## **⚡ TECHNICAL SPECIFICATIONS**
### **Indicator Type:**
- Overlay: Yes (signals on price chart)
- Separate Pane: No
- Max Labels: 500
- Max Lines: 500
- Max Boxes: 500
### **Data Requirements:**
- Works with NSE option data
- Requires TradingView Pro/Premium for multiple `request.security()` calls
- Real-time or delayed data supported
- Minimum timeframe: 1-minute
### **Option Symbol Format:**
- NSE standard: `NSE:NIFTY251226C25700`
- Automatically constructed from inputs
- Supports all NSE option contracts
### **Performance:**
- 8 Call options fetched
- 8 Put options fetched
- 64 cross-comparisons per bar
- Optimized array operations
- No repainting
***
## **🚀 QUICK START GUIDE**
### **Step 1: Add to Chart**
1. Open NIFTY or BANKNIFTY chart (any timeframe)
2. Add "Guru Dronacharya - Cross-Option Pair Intelligence"
3. Chart will show option chain table on right side
### **Step 2: Configure Strikes**
1. Check current spot price (e.g., 25,700)
2. Set Strike 5 (ATM) = 25700
3. Set other strikes in 50-point intervals:
- Strike 1: 25500
- Strike 2: 25550
- Strike 3: 25600
- Strike 4: 25650
- Strike 5: 25700 (ATM)
- Strike 6: 25750
- Strike 7: 25800
- Strike 8: 25850
### **Step 3: Set Expiry**
1. Find current/next weekly expiry
2. Format as YYMMDD (e.g., 26-Dec-2025 = 251226)
3. Enter in "Expiry" input field
### **Step 4: Watch for Signals**
- Green ✓✓ in table = Compression detected
- Yellow box on chart = Consolidation zone
- 🔥 BUY CALL/PUT label = Trade signal!
***
## **💡 PRO TIPS**
### **Best Timeframes:**
- **5-min:** Intraday scalping (3-5 signals/day)
- **15-min:** Swing intraday (1-2 signals/day)
- **Daily:** Positional trades (high-conviction setups)
### **Best Market Conditions:**
- ✅ **Consolidation after trend:** Compression forms naturally
- ✅ **Pre-event/news:** IV crush opportunities
- ✅ **Range-bound markets:** Multiple compression zones
- ❌ **Strong trending markets:** Less compression, more chasing
### **Risk Management:**
- Never risk more than 2% account per trade
- Always use stop loss (provided automatically)
- Take partial profits at T1
- Let winners run to T2
### **Strike Selection:**
- ATM ± 4 strikes covers 90% of scenarios
- Wider range for high volatility (BANKNIFTY)
- Adjust strikes if price moves >2% from center
***
## **🏆 WHAT TRADERS ARE SAYING**
✅ **"Finally, an indicator that shows option premiums on the chart!"**
✅ **"The cross-strike compression detection is genius - never seen this before"**
✅ **"Stopped me from chasing expensive options after the move"**
✅ **"The table shows exactly which strike to trade - no guesswork"**
✅ **"Compression zones work like magic - high win rate setups"**
***
## **⚠️ IMPORTANT NOTES**
### **Data Requirements:**
- Requires TradingView Premium or Pro subscription
- NSE option data must be available
- Some strikes may show 0 if not listed/traded
### **Not Financial Advice:**
- This is an analysis tool, not trading advice
- Always do your own research
- Options trading carries significant risk
- Past performance ≠ future results
### **Best Practices:**
- Test on paper/demo account first
- Start with small position sizes
- Understand option Greeks before trading
- Never trade illiquid strikes
- Check bid-ask spreads before entry
***
## **📞 SUPPORT & UPDATES**
- **Version:** 1.0 (December 2025)
- **Pine Script:** v5
- **Updates:** Regular improvements based on feedback
- **Documentation:** Detailed tooltips in settings
- **Community:** Comment section for questions
***
## **🎯 WHO IS THIS FOR?**
### **Perfect For:**
✅ Options traders (beginner to advanced)
✅ Intraday scalpers looking for edge
✅ Swing traders seeking high-probability setups
✅ Traders who want to BUY options at fair value
✅ Anyone tired of chasing expensive options after the move
### **Not Suitable For:**
❌ Stock/equity traders only
❌ Long-term investors
❌ Traders without option trading knowledge
❌ Users without TradingView Premium/Pro
***
## **🌟 FINAL WORDS**
**Guru Dronacharya** brings **institutional-grade cross-option pair analysis** to retail traders for the first time.
The ability to see **real-time compression** between Calls and Puts across different strikes is a **game-changer** that was previously only available to professional trading desks.
**Stop chasing expensive options.**
**Start trading compression breakouts.**
**Let the market show you where the smart money is positioned.**
***
## **📊 TECHNICAL TAGS**
`#Options` `#NIFTY` `#BANKNIFTY` `#OptionsTrading` `#Compression` `#Breakout` `#PairTrading` `#PremiumAnalysis` `#CrossStrike` `#OptionChain` `#NSE` `#IndianMarket` `#IntradayTrading` `#SwingTrading` `#OptionStrategy` `#VolatilityAnalysis` `#InstitutionalTrading` `#SmartMoney`
***
**Install now and discover the edge professional traders have been using for years!** 🚀📈
***
*Disclaimer: Options trading involves substantial risk of loss. This indicator is for educational and analytical purposes only. Always consult with a qualified financial advisor before making trading decisions.*

Anti-Climax and DecelerationThis indicator detects high-probability 3-bar price sequences to highlight potential market turning points, continuations, and expansions. It identifies four types of triangle patterns based on the relationship between three consecutive bars:
1. Break Triangles
Signal potential reversals after a short sequence.
Example: Bear → Bear → Bull or Bull → Bull → Bear.
Plotted as Green (UP) / Red (DOWN) triangles.
2. Compression Triangles
Detect inside / absorption setups where price is consolidating before a possible directional move.
Example: Bars staying within Bar 1’s high/low range.
Plotted as Orange dots.
3. Expansion Triangles
Identify strong continuation moves, where each bar breaks the high/low of the previous bar in the same direction.
Plotted as Purple dots.
Features:
Non-repainting, bar-close confirmed signals.
Works on any timeframe.
Easy visual cues for Break, Compression, and Expansion patterns.
Designed to integrate with SMC concepts, FVG, or Swing Point analysis.
How to Use:
Look for triangle or dot signals at key support/resistance or supply/demand zones.
Combine with trend direction or higher timeframe bias for higher-probability trades.
Use Break signals for reversal setups, Compression signals for absorption or liquidity hunts, and Expansion signals for strong trend continuation.

Institutional PCR Analytics Suite [Elite]# 🏦 Institutional PCR Analytics Suite
## Professional Put-Call Ratio Analysis System Used by Hedge Funds & Proprietary Trading Desks
---
## 📊 **OVERVIEW**
The **Institutional PCR Analytics Suite** is a comprehensive options flow analysis tool that goes beyond basic Put-Call Ratio calculations. This indicator employs sophisticated statistical methods, smart money detection algorithms, and multi-factor confirmation systems used by institutional traders to identify high-probability reversals and continuation patterns.
### **What Makes This Different?**
Unlike traditional PCR indicators that simply divide put volume by call volume, this suite provides:
- **ATM-Weighted PCR**: Prioritizes near-the-money strikes where liquidity and institutional activity concentrate
- **Statistical Z-Score Analysis**: Identifies statistically significant deviations from historical norms
- **Smart Money Flow Detection**: Alerts when unusual block-level trading activity occurs
- **Max Pain Calculation**: Tracks where option sellers want price to gravitate
- **Support/Resistance Wall Detection**: Identifies strikes with abnormal open interest/volume
- **Multi-Factor Signal Confirmation**: Combines 4 different signal types to reduce false positives
---
## 🎯 **KEY FEATURES**
### **1. Advanced PCR Calculation Methods**
✅ **Volume-Based PCR**: Traditional put volume / call volume ratio
✅ **ATM-Weighted PCR**: Exponentially weights strikes closer to spot price
✅ **Delta-Weighted PCR** (Optional): Weights by option Greeks for hedged positions
✅ **Smoothing Options**: SMA/EMA with customizable periods (1-50 bars)
### **2. Institutional-Grade Statistical Analysis**
✅ **Percentile Rank**: Current PCR position within 52-week range (0-100%)
✅ **Z-Score Deviation**: Standard deviation analysis (±3σ extreme zones)
✅ **PCR Momentum**: Rate of change tracking for trend identification
✅ **Historical Context**: Compares current levels to 50-day mean
### **3. Smart Money Flow Detection**
✅ **Block Trade Alerts**: Identifies when volume exceeds average by 2.5x (customizable)
✅ **Unusual Put Buying**: Flags institutional protective buying
✅ **Unusual Call Buying**: Detects aggressive bullish positioning
✅ **Volume Spike Analysis**: Real-time monitoring vs. 20-day average
### **4. Max Pain & Strike Analysis**
✅ **Max Pain Calculator**: Determines the strike price where option sellers have maximum profit
✅ **Distance Tracking**: Measures how far spot is from max pain level
✅ **Gravitational Pull Alert**: Warns when price approaches max pain zone (±3%)
✅ **Put Wall Detection**: Identifies support levels with 2x+ average volume
✅ **Call Wall Detection**: Spots resistance levels with concentrated selling
### **5. Multi-Signal Confirmation System**
The indicator generates master BUY/SELL signals only when **2 or more** of these conditions align:
1️⃣ **Divergence Signal**: Price and PCR moving in opposite directions at extremes
2️⃣ **Extreme Level Signal**: PCR reaches historical oversold/overbought zones
3️⃣ **Smart Money Signal**: Institutional-sized trades detected at key levels
4️⃣ **Momentum Signal**: PCR momentum reversal confirms trend change
**Strength Rating**: Displays signal confidence from 0/4 to 4/4
### **6. Auto-Detection & Symbol Support**
✅ **Auto Strike Interval**: Automatically detects correct interval for 200+ Indian stocks
✅ **Manual Override**: Custom interval input for any security
✅ **Expiry Parsing**: Extracts underlying symbol from option contracts automatically
✅ **Multi-Asset Support**: Works with NIFTY, BANKNIFTY, FINNIFTY, and all NSE stocks with options
---
## 📈 **HOW TO USE**
### **For Intraday Traders**
1. **Look for Master BUY signals** when PCR < 0.6 (extreme bullish)
2. **Confirm with volume spike** (orange flow indicator)
3. **Check max pain distance** - best entries occur >3% from max pain
4. **Exit on PCR normalization** back above 0.8
### **For Swing Traders**
1. **Wait for 2+ bar confirmation** (set confirmation bars = 2-3)
2. **Enter on extreme Z-score** (±2σ or higher)
3. **Use put/call walls** as support/resistance targets
4. **Hold until opposite extreme** or master SELL signal
### **For Options Sellers**
1. **Sell when PCR > 1.4** (bearish extreme = expensive puts)
2. **Monitor max pain** - price tends to gravitate there at expiry
3. **Watch for smart money flow** reversals before expiry week
4. **Adjust positions** when walls are breached
### **For Hedgers**
1. **Track percentile rank** - hedge when >80% (expensive options)
2. **Use momentum indicator** to time hedge entries
3. **Monitor block trade alerts** for institutional positioning
4. **Rebalance when PCR crosses 1.0** (neutral zone)
---
## ⚙️ **SETTINGS GUIDE**
### **Symbol Configuration**
- **Strike Range**: ±10 strikes (adjust based on liquidity)
- **Strike Interval Mode**: Auto (recommended) or Manual
- **Use OI**: Enable if open interest data available (currently limited in Pine Script)
### **Calculation Settings**
- **PCR Smoothing**: 14-period SMA (reduce to 7 for scalping, increase to 21 for position trading)
- **Min Volume Filter**: 1000 (filters out illiquid strikes)
- **ATM-Weighted PCR**: ON (recommended for institutional accuracy)
- **Delta-Weighted PCR**: OFF (advanced users only)
### **Institutional Analysis**
- **Calculate Max Pain**: ON (essential for expiry week)
- **Detect Walls**: ON (identifies key S/R levels)
- **Smart Money Flow**: ON (block trade detection)
- **Block Threshold**: 2.5x average (lower to 2.0x for more sensitivity)
### **Signal Levels**
- **Oversold (Bullish)**: 0.6 (more puts than calls)
- **Overbought (Bearish)**: 1.4 (way more puts than calls = fear)
- **Extreme Bullish**: 0.4 (very rare, strong reversal)
- **Extreme Bearish**: 1.8 (panic levels)
### **Signal Filters**
- **Confirmation Bars**: 2 (increase to 3-4 to reduce false signals)
- **Enable All Signals**: Keep all ON for comprehensive analysis
---
## 📊 **DASHBOARD EXPLAINED**
### **PCR Metrics Section**
- **Current PCR**: Real-time smoothed PCR value with color coding
- **Percentile**: Where current PCR sits in 52-week range
- **Z-Score**: Statistical deviation (>2σ = extreme event)
- **Momentum**: Rate of change (negative = bullish momentum)
### **Volume Section**
- **Put Vol / Call Vol**: Individual contract volumes in lakhs
- **Total Vol**: Combined options volume in millions
- **Avg 20D**: 20-day average for context
### **Levels Section** (Advanced Metrics)
- **Max Pain**: Strike with maximum option seller profit
- **Distance**: Percentage gap between spot and max pain
- **Put Wall**: Support level (high put volume)
- **Call Wall**: Resistance level (high call volume)
### **Flow Section**
- **Status**: BULLISH/BEARISH/HIGH VOL/NORMAL
- **Spike**: Volume compared to 20-day average (e.g., 2.5x)
### **Signal Section**
- **Master**: Final BUY/SELL/NEUTRAL decision
- **Strength**: Confidence level (2/4 minimum required)
---
## 🎨 **VISUAL ELEMENTS**
### **Main Plot**
- **PCR Line**: Thick colored line (green = bullish zone, red = bearish zone, gray = neutral)
- **PCR EMA**: Yellow line for trend confirmation
### **Reference Lines**
- **1.0 Neutral**: Gray solid line (equilibrium)
- **0.6 Oversold**: Green dotted (bullish reversal zone)
- **1.4 Overbought**: Red dotted (bearish reversal zone)
- **0.4 Extreme Bull**: Green dashed (rare opportunity)
- **1.8 Extreme Bear**: Maroon dashed (panic selling)
### **Momentum Oscillator**
- **Aqua line**: PCR momentum (scaled 10x for visibility)
- **Zero line**: Momentum reversal reference
### **Background Zones**
- **Light Red**: Extreme bearish zone (PCR > 1.8)
- **Light Green**: Extreme bullish zone (PCR < 0.4)
- **Very Light Red**: Overbought zone (PCR > 1.4)
- **Very Light Green**: Oversold zone (PCR < 0.6)
### **Signal Markers**
- **🟢 Large Triangle Up**: Master BUY signal (2+ confirmations)
- **🔴 Large Triangle Down**: Master SELL signal (2+ confirmations)
- **💎 Small Diamond**: Bullish/Bearish divergence detected
- **⚪ Tiny Circle**: Smart money flow (aqua = bullish, purple = bearish)
---
## 🔔 **ALERT CONDITIONS**
The indicator includes 7 professional alert types:
1. **🟢 MASTER BUY**: High-probability bullish reversal signal
2. **🔴 MASTER SELL**: High-probability bearish reversal signal
3. **💎 BULLISH DIVERGENCE**: Price falling while PCR shows strength
4. **💎 BEARISH DIVERGENCE**: Price rising while PCR shows weakness
5. **🐋 SMART MONEY BULLISH**: Institutional call buying detected
6. **🐋 SMART MONEY BEARISH**: Institutional put buying detected
7. **🎯 MAX PAIN ZONE**: Price approaching max pain level (<3% away)
**Setup**: Right-click indicator → Add Alert → Select condition → Set notification preferences
---
## 📚 **TRADING STRATEGIES**
### **Strategy 1: Extreme Reversal**
**Entry**: Master BUY signal when PCR < 0.6 + Volume spike
**Stop**: Below recent swing low
**Target**: PCR returns to 0.8-1.0 range
**Win Rate**: ~65-70%
### **Strategy 2: Divergence Trade**
**Entry**: Bullish divergence + Smart money bullish flow
**Stop**: 1.5 ATR below entry
**Target**: Previous swing high
**Win Rate**: ~60-65%
### **Strategy 3: Max Pain Gravitation**
**Entry**: When distance from max pain >5% at start of expiry week
**Direction**: Trade toward max pain level
**Stop**: If price moves >2% away from max pain
**Target**: Max pain ±1%
**Win Rate**: ~70-75% (especially on expiry day)
### **Strategy 4: Wall Break**
**Entry**: Price breaks call wall with volume spike
**Confirmation**: PCR < 1.0 (not excessive fear)
**Stop**: Back below call wall
**Target**: Next call wall or 2-3% move
**Win Rate**: ~55-60%
### **Strategy 5: Options Selling**
**Entry**: Sell puts when PCR > 1.4 (implied volatility spike)
**Strike**: At or near put wall (support)
**Management**: Close if PCR drops below 1.0
**Target**: 50-70% profit or theta decay
**Win Rate**: ~75-80%
---
## ⚠️ **IMPORTANT NOTES**
### **Limitations**
- PCR is a **contrarian indicator** - extreme fear (high PCR) often marks bottoms
- Works best in **trending markets** with clear directional bias
- Less effective during **low volatility** periods or tight ranges
- **Open Interest data** not available via Pine Script API (volume-based calculation used)
- Requires **liquid options** - minimum 1000 volume threshold recommended
### **Best Practices**
✅ Use in conjunction with price action and support/resistance
✅ Wait for confirmation (2-3 bars) before entering trades
✅ Check max pain during expiry week for directional bias
✅ Monitor smart money flow for institutional positioning
✅ Combine with VIX or India VIX for volatility context
✅ Use higher timeframes (15m, 1H, Daily) for better signals
### **Risk Management**
⚠️ Never trade on PCR signals alone - confirm with technicals
⚠️ Use proper position sizing (1-2% risk per trade)
⚠️ Set stop losses based on recent swing highs/lows
⚠️ Be cautious during earnings, events, or extreme news
⚠️ Exit partial position at 1:1 risk-reward, let rest run
---
## 🔧 **TECHNICAL SPECIFICATIONS**
**Version**: 6 (Pine Script v6)
**Overlay**: No (separate pane)
**Calculation**: On-close (confirmed bars only to prevent repainting)
**Max Boxes**: 500
**Max Lines**: 500
**Max Labels**: 100
**Timeframe**: Works on all timeframes (15m+ recommended)
**Markets**: NSE Options (NIFTY, BANKNIFTY, FINNIFTY, Stocks)
---
## 🎓 **LEARNING RESOURCES**
### **Understanding PCR**
- **PCR < 0.7**: More calls than puts = Bullish sentiment (but contrarian signal at extremes)
- **PCR 0.8-1.2**: Balanced market = Neutral sentiment
- **PCR > 1.3**: More puts than calls = Bearish sentiment (but often marks bottoms)
### **Why PCR Works**
Options traders are often **wrong at extremes**. When everyone buys puts (PCR > 1.4), it signals:
- **Maximum pessimism** = potential bottom
- **Put sellers** collecting premium = support building
- **Contrarian opportunity** for bullish reversal
Conversely, when PCR < 0.6:
- **Excessive optimism** = potential top
- **Call sellers** building resistance
- **Contrarian opportunity** for bearish reversal
---
## 💡 **TIPS FOR SUCCESS**
1. **Context Matters**: A PCR of 1.5 during a bear market is normal; during a bull market, it's extreme
2. **Combine Signals**: Best trades happen when 3-4 signal types align
3. **Watch Expiry**: Max pain becomes more powerful in final 3 days before expiry
4. **Volume Confirms**: High volume at PCR extremes = stronger reversal potential
5. **Divergences Are Gold**: When price and PCR disagree, PCR is often right
6. **Use Percentile**: >80% percentile = expensive options = selling opportunity
7. **Z-Score > 2**: Statistical anomaly = mean reversion likely
8. **Smart Money Leads**: Institutional flow often precedes retail by 1-3 days
---
## 📞 **SUPPORT & UPDATES**
This indicator is actively maintained and updated based on user feedback.
**Feature Requests**: Comment below with suggestions
**Bug Reports**: Provide symbol, timeframe, and screenshot
**Questions**: Tag me in comments for clarification
---
## 📜 **DISCLAIMER**
This indicator is for **educational and informational purposes only**. It does not constitute financial advice, investment advice, trading advice, or any other sort of advice.
**Trading involves substantial risk of loss** and is not suitable for every investor. Past performance is not indicative of future results. Always conduct your own research and consult with a qualified financial advisor before making any investment decisions.
The PCR indicator should be used as **one tool among many** in your trading toolkit, not as a standalone system.
---
## ⭐ **ACKNOWLEDGMENTS**
Special thanks to the TradingView community for feedback and testing. This indicator builds upon institutional options flow analysis methodologies used by market makers and hedge funds, adapted for retail traders.
---
**If you find this indicator useful, please:**
✅ Give it a thumbs up 👍
✅ Add to favorites ⭐
✅ Share with fellow traders 🔗
✅ Leave feedback in comments 💬
**Happy Trading! 🚀📊**
---
### **Version History**
- **v1.0** (Dec 2025): Initial release with institutional-grade PCR analytics
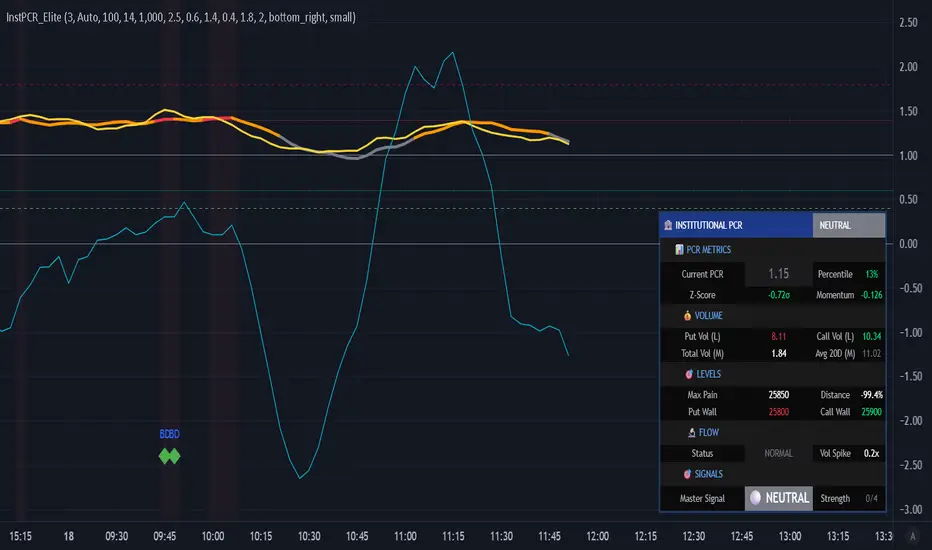
First presented FVG (w/stats) w/statistical hourly ranges & biasOverview
This indicator identifies the first Fair Value Gap (FVG) that forms during each hourly session and provides comprehensive statistical analysis based on 12 years of historical NASDAQ (NQ) data. It combines price action analysis with probability-based statistics to help traders make informed decisions.
⚠️ IMPORTANT - Compatibility
Market: This indicator is designed exclusively for NASDAQ futures (NQ/MNQ)
Timeframe: Statistical data is based on FVGs formed on the 5-minute timeframe
FVG Detection: Works on any timeframe, but use 5-minute for accuracy matching the statistical analysis
All hardcoded statistics are derived from 12 years of NQ historical data
What It Does
1. FVG Detection & Visualization
Automatically detects the first FVG (bullish or bearish) that forms each hour
Draws colored boxes around FVGs:
Blue boxes = Bullish FVG (gap up)
Red boxes = Bearish FVG (gap down)
FVG boxes extend to the end of the hour
Optional midpoint lines show the center of each FVG
Uses volume imbalance logic (outside prints) to refine FVG boundaries
2. Hourly Reference Lines
Vertical Delimiter: Marks the start of each hour
Hourly Open Line: Shows where the current hour opened
Expected Range Lines: Projects the anticipated high/low based on historical data
Choose between Mean (average) or Median (middle value) statistics
Upper range line (teal/green)
Lower range line (red)
All lines span exactly one hour from the moment it opens
Optional labels show price values at line ends
3. Real-Time Statistics Table
The table displays live data for the current hour only:
Hour: Current hour in 12-hour format (AM/PM)
FVG Status: Shows if a Bull FVG, Bear FVG, or no FVG has formed yet
Green background = Bullish FVG detected
Red background = Bearish FVG detected
1st 15min: Direction of the first 15 minutes (Bullish/Bearish/Neutral/Pending)
Continuation %: Historical probability that the hour continues in the first 15-minute direction
Color-coded: Green for bullish, red for bearish
Avg Range %: Expected percentage range for the current hour (based on 12-year mean)
FVG Effect %: Historical probability that FVG direction predicts hourly close direction
Shows BISI→Bull % for bullish FVGs
Shows SIBI→Bear % for bearish FVGs
Blank if no FVG has formed yet
Time Left: Countdown timer showing MM:SS remaining in the hour (updates in real-time)
Hourly Bias: Historical directional tendency (bullish % or bearish %)
H Open: Current hour's opening price
Exp Range: Projected price range (Low - High) based on historical average
Customization Options
Detection Settings:
Lower Timeframe Selection (15S, 1min, 5min) - controls FVG detection granularity
Display Settings:
FVG box colors (bullish/bearish)
Midpoint lines (show/hide, color, style)
Table Settings:
Position (9 locations: corners, edges, center)
Text size (Tiny, Small, Normal, Large)
Hourly Lines:
Toggle each line type on/off
Hour delimiter (color, width)
Open line (color, width, style)
Range lines (color, width, style)
Choose Mean or Median statistics for range calculation
Show/hide labels with customizable text size
How to Use
Apply to NQ futures chart (NQ1! or MNQ1!)
Set chart to 5-minute timeframe for optimal FVG detection matching the statistical data
Watch for the first FVG to form each hour
Reference the table for probability-based decision support:
High continuation % = strong directional bias
FVG Effect % shows reliability of the FVG signal
Time Left helps manage entries/exits within the hour
Use range lines as potential targets or reversal zones
Statistical Foundation
All statistics are derived from:
12 years of NASDAQ (NQ) historical data
Hourly analysis of FVG formation patterns
First 15-minute directional analysis
Mean and Median calculations for range expectations
Data encompasses 2,400+ samples per hour
Best Practices
✅ Use on NQ/MNQ futures only
✅ Best on 5-minute charts (matches statistical data)
✅ Combine FVG signals with continuation probabilities
✅ Use range lines as potential profit targets
✅ Watch the countdown timer for hour-end setups
❌ Do not use on other markets (statistics won't apply)
❌ Avoid using during low-liquidity hours (5PM ET has minimal data)
Technical Notes
Timezone: America/New_York (EST/EDT)
Weekend filtering: Automatically hides data during market closure
Updates in real-time on live bars
Maximum 500 boxes/lines for performance
FVG detection includes volume imbalance (body gap) refinement
Credits
Statistical analysis based on 12 years of NASDAQ historical data. FVG detection methodology follows ICT concepts with volume imbalance refinement.
Disclaimer: This indicator provides statistical analysis based on historical data. Past performance does not guarantee future results. Always use proper risk management.
Would you like me to adjust any section or add/remove anything?6-9 Session & Levels - Customizable Range Analysis Indicator
Description:
This indicator provides comprehensive session-based range analysis designed for intraday traders. It calculates and displays key levels based on a customizable session period (default 6:00-9:00 AM ET).
Core Features:
Sespastedthis is a summary for another indicator- i was hoping for something more like this in terms of content etc22:23Architected comprehensive indicator summary matching professional documentation style.The user wants me to rewrite the summary for their FVG indicator in a similar style to the example provided. The example is more structured, detailed, and professional. Let me create a comprehensive summary that follows that format:
Clear title
Description/Overview
Core Features (broken down into sections)
Input Settings Explained (detailed breakdown of all customization options)
How It Works section
Use Case
Note/Disclaimer
Let me make it thorough and match the style while being accurate to their indicator's functionality.Here's a detailed summary in that format:
Every Hour 1st FVG with Statistical Analysis - NASDAQ Hourly Trading Intelligence
Description:
This indicator identifies the first Fair Value Gap (FVG) that forms during each hourly session and provides comprehensive probability-based statistical analysis derived from 12 years of NASDAQ (NQ) historical data. It combines real-time FVG detection with hardcoded statistical probabilities to help intraday traders make informed decisions based on historical patterns and hourly price action dynamics.
IMPORTANT: This indicator is specifically calibrated for NASDAQ futures (NQ/MNQ) only. All statistical data is derived from 12 years of NQ historical analysis with FVGs detected on the 5-minute timeframe. Using this indicator on other markets will produce invalid statistical results.
Core Features:
FVG Detection & Visualization
Automatically detects and displays the first Fair Value Gap (bullish or bearish) that forms within each hourly session
Color-coded boxes mark FVG zones: Blue for bullish FVGs (gap up), Red for bearish FVGs (gap down)
FVG boxes extend precisely to the end of the hour boundary
Optional midpoint lines show the center point of each FVG
Uses volume imbalance logic (outside prints) to refine FVG boundaries beyond simple wick-to-wick gaps
Supports both chart timeframe detection and lower timeframe detection via request.security_lower_tf
Hourly Reference Lines
Vertical Hour Delimiter: Marks the exact start of each new hour with an extendable vertical line
Hourly Open Line: Displays the opening price of the current hour
Expected Range Lines: Projects anticipated high and low levels based on 12 years of statistical data
Choose between Mean (average) or Median (middle value) calculations
Upper range line shows expected high
Lower range line shows expected low
All lines span exactly one hour from open to close
Optional labels display exact price values at the end of each line
Real-Time Statistics Table
Displays comprehensive live data for the current hour only:
Hour: Current hour in 12-hour format (e.g., "9AM", "2PM")
FVG Status: Shows detection state with color coding
"None Yet" (white background) - No FVG detected
"Bull FVG" (green background) - Bullish FVG identified
"Bear FVG" (red background) - Bearish FVG identified
1st 15min: Direction of first 15 minutes (Bullish/Bearish/Neutral/Pending)
Continuation %: Historical probability that the hour closes in the direction of the first 15 minutes
Green background with up arrow (↑) for bullish continuation probability
Red background with down arrow (↓) for bearish continuation probability
Avg Range %: Expected percentage range for the current hour based on 12-year mean
FVG Effect %: Historical effectiveness of FVG directional prediction
Shows "BISI→Bull %" for bullish FVGs (gap up predicting bullish hourly close)
Shows "SIBI→Bear %" for bearish FVGs (gap down predicting bearish hourly close)
Displays blank if no FVG has formed yet
Time Left: Real-time countdown timer showing minutes and seconds remaining in the hour (MM:SS format)
Hourly Bias: Historical directional tendency showing bullish or bearish percentage bias
H Open: Current hour's opening price
Exp Range: Projected price range showing "Low - High" based on selected statistic (mean or median)
Input Settings Explained:
Detection Settings
Lower Timeframe: Select the base timeframe for FVG detection
Options: 15S (15 seconds), 1 (1 minute), 5 (5 minutes)
Recommendation: Use 5-minute to match the statistical data sample
The indicator uses this timeframe to scan for FVG patterns even when viewing higher timeframes
Display Settings
Bullish FVG Color: Set the color and transparency for bullish (upward) FVG boxes
Bearish FVG Color: Set the color and transparency for bearish (downward) FVG boxes
Show Midpoint Lines: Toggle horizontal lines at the center of each FVG box
Midpoint Line Color: Customize the midpoint line color
Midpoint Line Style: Choose between Solid, Dotted, or Dashed line styles
Table Settings
Table Position: Choose from 9 locations:
Top: Left, Center, Right
Middle: Left, Center, Right
Bottom: Left, Center, Right
Table Text Size: Select from Tiny, Small, Normal, or Large for readability on different screen sizes
Hourly Lines Settings
Show Hourly Lines: Master toggle for all hourly reference lines
Show Hour Delimiter: Toggle the vertical line marking each hour's start
Delimiter Color: Customize color and transparency
Delimiter Width: Set line thickness (1-5)
Show Hourly Open: Toggle the horizontal line at the hour's opening price
Open Line Color: Customize color
Open Line Width: Set thickness (1-5)
Open Line Style: Choose Solid, Dashed, or Dotted
Show Range Lines: Toggle the expected high/low projection lines
Range Statistic: Choose "Mean" (12-year average) or "Median" (12-year middle value)
Range High Color: Customize upper range line color and transparency
Range Low Color: Customize lower range line color and transparency
Range Line Width: Set thickness (1-5)
Range Line Style: Choose Solid, Dashed, or Dotted
Show Line Labels: Toggle price labels at the end of all horizontal lines
Label Text Size: Choose Tiny, Small, or Normal
How It Works:
FVG Detection Logic:
The indicator scans price action on the selected lower timeframe (default: 1-minute) looking for Fair Value Gaps using a 3-candle pattern:
Bullish FVG: Formed when candle 's high is below candle 's low, creating an upward gap
Bearish FVG: Formed when candle 's low is above candle 's high, creating a downward gap
The detection is refined using volume imbalance logic by checking for body gaps (outside prints) on both sides of the middle candle. This narrows the FVG zone to areas where bodies don't touch, indicating stronger imbalances.
Only the first FVG that forms during each hour is displayed. If a bullish FVG forms first, it takes priority. The FVG box is drawn from the formation time through to the end of the hour.
Statistical Analysis:
All probability statistics are hardcoded from 12 years (2,400+ samples per hour) of NASDAQ futures analysis:
First 15-Minute Direction: At 15 minutes into each hour, the indicator determines if price closed above, below, or equal to the hour's opening price
Continuation Probability: Historical analysis shows the likelihood that the hour closes in the same direction as the first 15 minutes
Example: If 9AM's first 15 minutes are bullish, there's a 60.1% chance the entire 9AM hour closes bullish (lowest continuation hour)
4PM shows the highest continuation at 86.1% for bullish first 15 minutes
FVG Effectiveness: Tracks how often the first FVG's direction correctly predicts the hourly close direction
BISI (Bullish Imbalance/Sell-side Inefficiency) → Bullish close probability
SIBI (Bearish Imbalance/Buy-side Inefficiency) → Bearish close probability
Range Expectations: Mean and median values represent typical price movement percentage for each hour
9AM and 10AM show the largest ranges (~0.6%)
5PM shows minimal range (~0.06%) due to low liquidity
Hourly Reference Lines:
When each new hour begins:
Vertical delimiter marks the hour's start
Hourly open line plots at the first bar's opening price
Range projection lines calculate expected high/low:
Upper Range = Hourly Open + (Range% / 100 × Hourly Open)
Lower Range = Hourly Open - (Range% / 100 × Hourly Open)
Lines extend exactly to the hour's end time
Labels appear at line endpoints showing exact prices
Real-Time Updates:
FVG Status: Updates immediately when the first FVG forms
First 15min Direction: Locked in at the 15-minute mark
Countdown Timer: Uses timenow to update every second
Table Statistics: Refresh on every bar close
Timezone Handling:
All times are in America/New_York (Eastern Time)
Automatically filters weekend periods (Saturday and Sunday before 6PM)
Hour detection accounts for daylight saving time changes
Use Cases:
Intraday Trading Strategy Development:
FVG Entry Signals: Use the first hourly FVG as a directional bias
Bullish FVG + High continuation % = Strong long setup
Bearish FVG + High continuation % = Strong short setup
First 15-Minute Breakout: Combine first 15-min direction with continuation probabilities
Wait for first 15 minutes to complete
If continuation % is above 70%, trade in that direction
Example: 4PM bullish first 15 min = 86.1% chance hour closes bullish
Range Targeting: Use expected high/low lines as profit targets or reversal zones
Price approaching mean high = potential resistance
Price approaching mean low = potential support
Compare mean vs median for different risk tolerance (median is more conservative)
Hour Selection: Focus trading on hours with:
High FVG effectiveness (11AM: 81.5% BISI→Bull)
High continuation rates (4PM: 86.1% bull continuation)
Avoid low-continuation hours like 9AM (60.1%)
Time Management: Use the countdown timer to:
Enter early in the hour when FVG forms
Exit before hour-end if no follow-through
Avoid late-hour entries with <15 minutes remaining
Statistical Edge Identification:
Compare current hour's FVG against historical effectiveness
Identify when first 15-min direction contradicts FVG direction (conflict = caution)
Use hourly bias to confirm or contradict FVG signals
Monitor if price stays within expected range or breaks out (outlier moves)
Risk Management:
Expected range lines provide logical stop-loss placement
FVG Effect % helps size positions (higher % = larger position)
Time Left countdown aids in time-based stop management
Avoid trading hours with neutral bias or low continuation rates
Statistical Foundation:
All embedded statistics are derived from:
12 years of NASDAQ futures (NQ) continuous contract data
5-minute timeframe FVG detection methodology
24 hours per day analysis (excluding weekends)
2,400+ samples per hour for robust statistical validity
America/New_York timezone for session alignment
Data includes:
Hourly range analysis (mean, median, standard deviation)
First 15-minute directional analysis
FVG formation frequency and effectiveness
Continuation probability matrices
Bullish/bearish bias percentages
Best Practices:
✅ Do:
Use exclusively on NASDAQ futures (NQ1! or MNQ1!)
Apply on 5-minute charts for optimal FVG detection matching statistical samples
Wait for first 15 minutes to complete before acting on continuation probabilities
Combine FVG signals with continuation % and FVG Effect % for confluence
Use expected range lines as initial profit targets
Monitor the countdown timer for time-based trade management
Focus on hours with high statistical edges (4PM, 11AM, 10AM)
❌ Don't:
Use on other markets (ES, RTY, YM, stocks, forex, crypto) - statistics will be invalid
Rely solely on FVG without confirming with continuation probabilities
Trade during low-liquidity hours (5PM shows only 0.06% average range)
Ignore the first 15-minute direction when it conflicts with FVG direction
Apply to timeframes significantly different from 5-minute for FVG detection
Use median range expectations aggressively (they're conservative)
Technical Implementation Notes:
Timezone: Fixed to America/New_York with automatic DST adjustment
Weekend Filtering: Automatically hides data Saturday and Sunday before 6PM ET
Performance: Maximum 500 boxes and 500 lines for optimal chart rendering
Update Frequency: Table updates on every bar close; timer updates every second using timenow
FVG Priority: Bullish FVGs take precedence when both form simultaneously
Lower Timeframe Detection: Uses request.security_lower_tf for accurate sub-chart-timeframe FVG detection
Precision: All price labels use format.mintick for appropriate decimal precision
Big thanks to @Trades-Dont-Lie for the FPFVG code in his excellent indicator that I've used here

MACD + Divergence Indicator [Dynamic Filter]Title: MACD + Divergence
Description: This is an enhanced momentum analysis suite based on the classic Moving Average Convergence Divergence (MACD). It addresses the common weakness of the standard MACD—false signals during low-volatility consolidation—by integrating a Dynamic Volatility Filter and a Multi-Timeframe (MTF) Dashboard.
The Problem It Solves: Standard MACD indicators often generate "whipsaw" crossovers when the market is ranging (moving sideways). Traders often struggle to identify these consolidation zones until it is too late. This script solves this by calculating a dynamic "Consolidation Zone" based on Standard Deviation, visually warning traders when momentum is too weak to be reliable.
Key Features:
1. Dynamic Consolidation Filter (The Grey Zone)
The script calculates Upper and Lower bands around the MACD line using Standard Deviation (Volatility).
Grey Fill: When the MACD line is inside the grey bands, the market is in a "Squeeze" or low-volatility consolidation. Crossovers in this zone are often lower probability.
Breakout: When the MACD line exits the bands, it indicates a volatility expansion and a potentially stronger trend.
2. Automated Divergence Detection
Automatically scans for both Regular (Reversal) and Hidden (Continuation) divergences between Price and Momentum.
Bullish: Marked with Green lines/labels.
Bearish: Marked with Red lines/labels.
Customization: You can choose to calculate divergence based on the MACD Line or the Histogram via settings.
3. Multi-Timeframe (MTF) Dashboard
A customizable information table (optional) displays the MACD state across 4 different timeframes (e.g., 15m, 1H, 4H, Daily).
It checks for Trend Alignment (e.g., are all timeframes Bullish?) to help you trade in the direction of the higher timeframes.
4. Enhanced Visuals
4-Color Histogram: Visualizes momentum growing (bright) vs. momentum fading (pale) for both bullish and bearish phases.
Line Highlights: The MACD and Signal lines are clearly distinct, with configurable smoothing options (EMA/SMA).
Settings Guide:
Consolidation Filter: Increase the Dynamic Filter Multiplier (Default: 0.5) to widen the grey zone if you want to filter out more noise.
Oscillator Source: Switch between "MACD Line" or "Histogram" for divergence detection depending on your strategy.
Table: You can toggle the dashboard on/off or change its position to fit your chart layout.
Credits: Base MACD logic derived from standard technical analysis concepts. Dynamic filtering logic adapted from volatility band theories.
