Multiple Standard MomentumMultiple Standard Momentum
The momentum indicator is a technical indicator that measures the speed and strength of the price movement of a financial asset. This indicator is used to identify the underlying strength of a trend and predict potential changes in price direction.
The calculation of the momentum indicator is based on the difference between the current price and the price of a previous period. The result is displayed on a chart, which can be positive or negative, depending on whether the current price is higher or lower than the price of the previous period. The indicator can be used on any time frame, but is generally used on short-term charts.
To use the momentum indicator , you look for two types of signals:
🔹 Crossover Signal – When the indicator crosses the zero line, it can signal a change of direction in the price trend.
🔹 Divergence – When the asset price moves in one direction and the indicator moves in the opposite direction, a divergence can be identified. This divergence may indicate a possible trend reversal.
COMPOSITION AND MODE OF USE OF THE INDICATOR
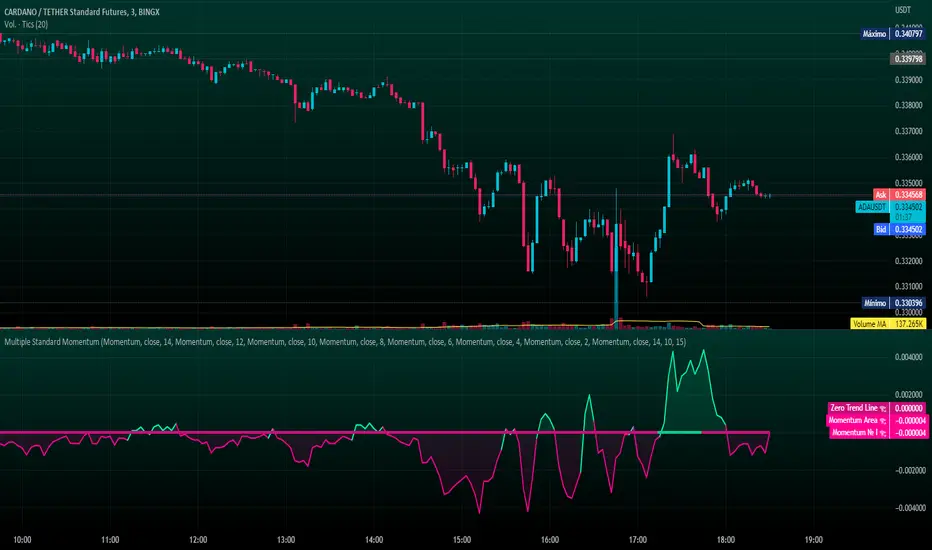
🔹 This indicator displays multiple Momentum levels on a single chart, allowing you to view multiple Momentum lines. Each level is represented on the chart where it can be hidden or shown as desired for better market analysis.
🔹 In addition, a zero trend line (also known as a horizontal trend line) has been added. The zero trend line is a horizontal line that indicates the point at which the current price equals the opening price, which allows users to draw a custom zero trend line on the chart using different colors and time periods of calculation.
* Highest performing custom setup for the Zero Trend Line. For Operations of:
- One Minute: Trend Line Time Frame = Five Minutes.
- Three Minutes: Trend Line Time Frame = Fifteen Minutes.
- Five Minutes: Trend Line Time Frame = Thirty Minutes.
- Fifteen Minutes: Trend Line Time Frame = Sixty Minutes.
Rules For Trading
🔹 Bullish:
* The Zero Trend Line must be in Green Color.
* When the Momentum Line Crosses the Zero Line from Bottom to Top.
🔹 Bearish:
* The Zero Trend Line must be in Red Color.
* When the Momentum Line Crosses the Zero Line from Top to Bottom.
In addition, parameters were defined to activate or deactivate the graphic signal taking into account the previous requirement (Bullish and Bearish):
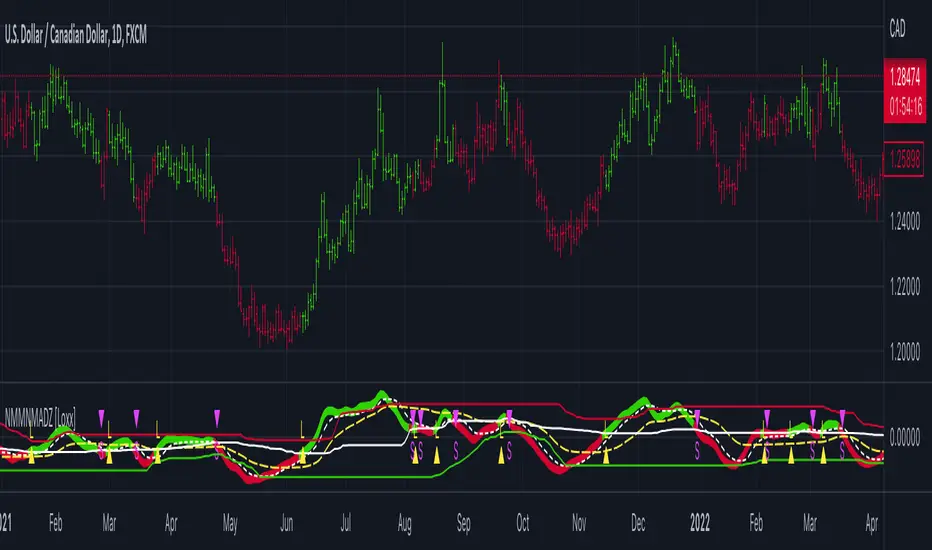
🔹 Long or Buy = ▲
🔹 Short or Sell = ▼
This script can be used in different markets such as forex, indices, and cryptocurrencies for analysis and trading. However, it is important to note that no trading strategy is guaranteed to be profitable, and traders should always conduct their own research and risk management.
Pine Script® indicator