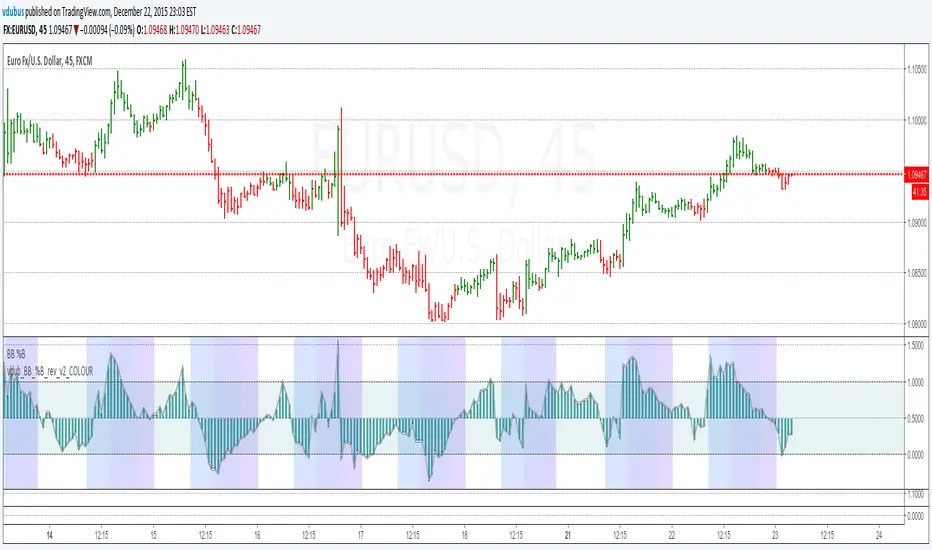
Vdub_BinaryBands_v1Combined 3 x Bollinger Bands With BUY & SELL zones
EMA,
Wma
SMA
Multiplier adjustment
Search in scripts for "binary"


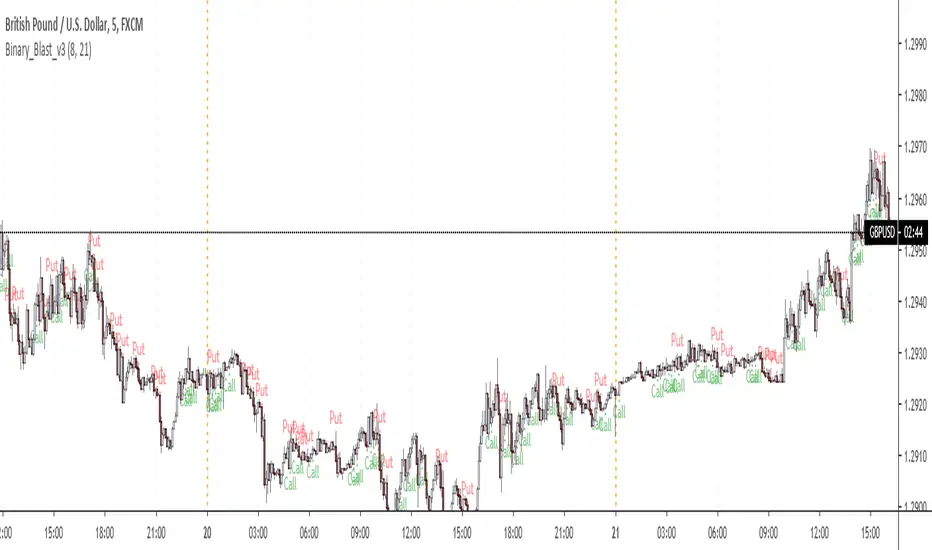
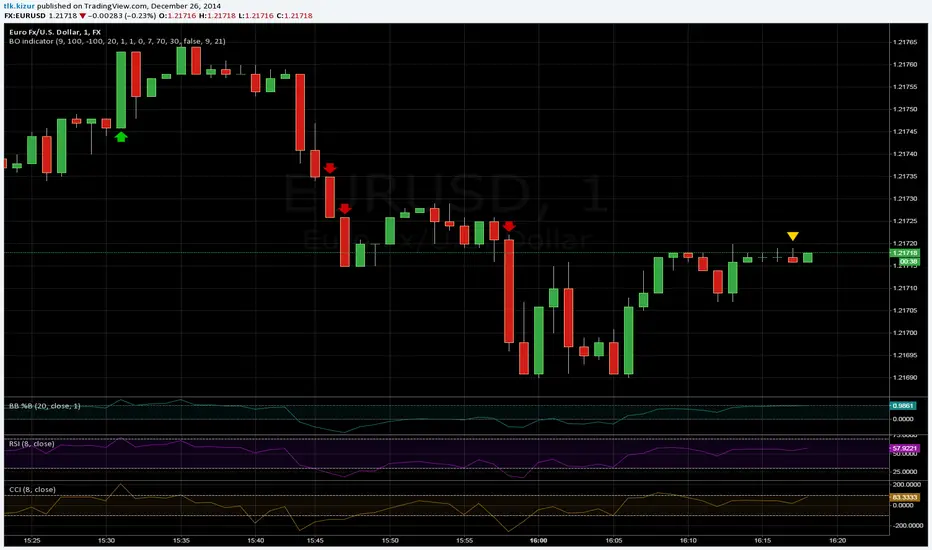
Binary_Blast_v3_directional biasThis is not my script.
The original was done by pizer.. I have just added an option to include a fast moving average and a slow moving average to filter the direction....implying should I look for "Put" or "Call"
Kay_StochasticRSIThis is a different version of Stochastic RSI. the only difference is the use of variable moving average by Lazybear instead of regular sma for K smoothing.
Its purely an experiment. I am not a professional trader but an enthusiastic programmer trying different indicator combination to see different results.
Criticizing and negative comments will be gracefully accepted. :)
Appreciation will be even more. :)
Binary Options v4.0This script fixes the situation of consecutive losses from single-direction trades through window logic

Binary ComboThis script combines Stochastic Divergence and WaveTrend Crosses.
Stochastic Divergence may be useful for seeing a shift in momentum before the price action reflects it.
WaveTrend gives us context to the short term trend.
You can combine these together to find good entries.


Binary Blast v2 Pipizer1 bar strategy after the signal bar closes. Maximum consecutive loses 5 found in back test!


Intrabar Volume Flow IntelligenceIntrabar Volume Flow Intelligence: A Comprehensive Analysis:
The Intrabar Volume Flow Intelligence indicator represents a sophisticated approach to understanding market dynamics through the lens of volume analysis at a granular, intrabar level. This Pine Script version 5 indicator transcends traditional volume analysis by dissecting price action within individual bars to reveal the true nature of buying and selling pressure that often remains hidden when examining only the external characteristics of completed candlesticks. At its core, this indicator operates on the principle that volume is the fuel that drives price movement, and by understanding where volume is being applied within each bar—whether at higher prices indicating buying pressure or at lower prices indicating selling pressure—traders can gain a significant edge in anticipating future price movements before they become obvious to the broader market.
The foundational innovation of this indicator lies in its use of lower timeframe data to analyze what happens inside each bar on your chart timeframe. While most traders see only the open, high, low, and close of a five-minute candle, for example, this indicator requests data from a one-minute timeframe by default to see all the individual one-minute candles that comprise that five-minute bar. This intrabar analysis allows the indicator to calculate a weighted intensity score based on where the price closed within each sub-bar's range. If the close is near the high, that volume is attributed more heavily to buying pressure; if near the low, to selling pressure. This methodology is far more nuanced than simple tick volume analysis or even traditional volume delta calculations because it accounts for the actual price behavior and distribution of volume throughout the formation of each bar, providing a three-dimensional view of market participation.
The intensity calculation itself demonstrates the coding sophistication embedded in this indicator. For each intrabar segment, the indicator calculates a base intensity using the formula of close minus low divided by the range between high and low. This gives a value between zero and one, where values approaching one indicate closes near the high and values approaching zero indicate closes near the low. However, the indicator doesn't stop there—it applies an open adjustment factor that considers the relationship between the close and open positions within the overall range, adding up to twenty percent additional weighting based on directional movement. This adjustment ensures that strongly directional intrabar movement receives appropriate emphasis in the final volume allocation. The adjusted intensity is then bounded between zero and one to prevent extreme outliers from distorting the analysis, demonstrating careful consideration of edge cases and data integrity.
The volume flow calculation multiplies this intensity by the actual volume transacted in each intrabar segment, creating buy volume and sell volume figures that represent not just quantity but quality of market participation. These figures are accumulated across all intrabar segments within the parent bar, and simultaneously, a volume-weighted average price is calculated for the entire bar using the typical price of each segment multiplied by its volume. This intrabar VWAP becomes a critical reference point for understanding whether the overall bar is trading above or below its fair value as determined by actual transaction levels. The deviation from this intrabar VWAP is then used as a weighting mechanism—when the close is significantly above the intrabar VWAP, buying volume receives additional weight; when below, selling volume is emphasized. This creates a feedback loop where volume that moves price away from equilibrium is recognized as more significant than volume that keeps price near balance.
The imbalance filter represents another layer of analytical sophistication that separates meaningful volume flows from normal market noise. The indicator calculates the absolute difference between buy and sell volume as a percentage of total volume, and this imbalance must exceed a user-defined threshold—defaulted to twenty-five percent but adjustable from five to eighty percent—before the volume flow is considered significant enough to register on the indicator. This filtering mechanism ensures that only bars with clear directional conviction contribute to the cumulative flow measurements, while bars with balanced buying and selling are essentially ignored. This is crucial because markets spend considerable time in equilibrium states where volume is simply facilitating position exchanges without directional intent. By filtering out these neutral periods, the indicator focuses trader attention exclusively on moments when one side of the market is demonstrating clear dominance.
The decay factor implementation showcases advanced state management in Pine Script coding. Rather than allowing imbalanced volume to simply disappear after one bar, the indicator maintains decayed values using variable state that persists across bars. When a new significant imbalance occurs, it replaces the decayed value; when no significant imbalance is present, the previous value is multiplied by the decay factor, which defaults to zero point eight-five. This means that a large volume imbalance continues to influence the indicator for several bars afterward, gradually diminishing in impact unless reinforced by new imbalances. This decay mechanism creates persistence in the flow measurements, acknowledging that large institutional volume accumulation or distribution campaigns don't execute in single bars but rather unfold across multiple bars. The cumulative flow calculation then sums these decayed values over a lookback period, creating a running total that represents sustained directional pressure rather than momentary spikes.
The dual moving average crossover system applied to these volume flows creates actionable trading signals from the underlying data. The indicator calculates both a fast exponential moving average and a slower simple moving average of the buy flow, sell flow, and net flow values. The use of EMA for the fast line provides responsiveness to recent changes while the SMA for the slow line provides a more stable baseline, and the divergence or convergence between these averages signals shifts in volume flow momentum. When the buy flow EMA crosses above its SMA while volume is elevated, this indicates that buying pressure is not only present but accelerating, which is the foundation for the strong buy signal generation. The same logic applies inversely for selling pressure, creating a symmetrical approach to detecting both upside and downside momentum shifts based on volume characteristics rather than price characteristics.
The volume threshold filtering ensures that signals only generate during periods of statistically significant market participation. The indicator calculates a simple moving average of total volume over a user-defined period, defaulted to twenty bars, and then requires that current volume exceed this average by a multiplier, defaulted to one point two times. This ensures that signals occur during periods when the market is actively engaged rather than during quiet periods when a few large orders can create misleading volume patterns. The indicator even distinguishes between high volume—exceeding the threshold—and very high volume—exceeding one point five times the threshold—with the latter triggering background color changes to alert traders to exceptional participation levels. This tiered volume classification allows traders to calibrate their position sizing and conviction levels based on the strength of market participation supporting the signal.
The flow momentum calculation adds a velocity dimension to the volume analysis. By calculating the rate of change of the net flow EMA over a user-defined momentum length—defaulted to five bars—the indicator measures not just the direction of volume flow but the acceleration or deceleration of that flow. A positive and increasing flow momentum indicates that buying pressure is not only dominant but intensifying, which typically precedes significant upward price movements. Conversely, negative and decreasing flow momentum suggests selling pressure is building upon itself, often preceding breakdowns. The indicator even calculates a second derivative—the momentum of momentum, termed flow acceleration—which can identify very early turning points when the rate of change itself begins to shift, providing the most forward-looking signal available from this methodology.
The divergence detection system represents one of the most powerful features for identifying potential trend reversals and continuations. The indicator maintains separate tracking of price extremes and flow extremes over a lookback period defaulted to fourteen bars. A bearish divergence is identified when price makes a new high or equals the recent high, but the net flow EMA is significantly below its recent high—specifically less than eighty percent of that high—and is declining compared to its value at the divergence lookback distance. This pattern indicates that while price is pushing higher, the volume support for that movement is deteriorating, which frequently precedes reversals. Bullish divergences work inversely, identifying situations where price makes new lows without corresponding weakness in volume flow, suggesting that selling pressure is exhausted and a reversal higher is probable. These divergence signals are plotted as distinct diamond shapes on the indicator, making them visually prominent for trader attention.
The accumulation and distribution zone detection provides a longer-term context for understanding institutional positioning. The indicator uses the bars-since function to track consecutive periods where the net flow EMA has remained positive or negative. When buying pressure has persisted for at least five consecutive bars, average intensity exceeds zero point six indicating strong closes within bar ranges, and volume is elevated above the threshold, the indicator identifies an accumulation zone. These zones suggest that smart money is systematically building long positions across multiple bars despite potentially choppy or sideways price action. Distribution zones are identified through the inverse criteria, revealing periods when institutions are systematically exiting or building short positions. These zones are visualized through colored fills on the indicator pane, creating a backdrop that helps traders understand the broader volume flow context beyond individual bar signals.
The signal strength scoring system provides a quantitative measure of conviction for each buy or sell signal. Rather than treating all signals as equal, the indicator assigns point values to different signal components: twenty-five points for the buy flow EMA-SMA crossover, twenty-five points for the net flow EMA-SMA crossover, twenty points for high volume presence, fifteen points for positive flow momentum, and fifteen points for bullish divergence presence. These points are summed to create a buy score that can range from zero to one hundred percent, with higher scores indicating that multiple independent confirmation factors are aligned. The same methodology creates a sell score, and these scores are displayed in the information table, allowing traders to quickly assess whether a signal represents a tentative suggestion or a high-conviction setup. This scoring approach transforms the indicator from a binary signal generator into a nuanced probability assessment tool.
The visual presentation of the indicator demonstrates exceptional attention to user experience and information density. The primary display shows the net flow EMA as a thick colored line that transitions between green when above zero and above its SMA, indicating strong buying, to a lighter green when above zero but below the SMA, indicating weakening buying, to red when below zero and below the SMA, indicating strong selling, to a lighter red when below zero but above the SMA, indicating weakening selling. This color gradient provides immediate visual feedback about both direction and momentum of volume flows. The net flow SMA is overlaid in orange as a reference line, and a zero line is drawn to clearly delineate positive from negative territory. Behind these lines, a histogram representation of the raw net flow—scaled down by thirty percent for visibility—shows bar-by-bar flow with color intensity reflecting whether flow is strengthening or weakening compared to the previous bar. This layered visualization allows traders to simultaneously see the raw data, the smoothed trend, and the trend of the trend, accommodating both short-term and longer-term trading perspectives.
The cumulative delta line adds a macro perspective by maintaining a running sum of all volume deltas divided by one million for scale, plotted in purple as a separate series. This cumulative measure acts similar to an on-balance volume calculation but with the sophisticated volume attribution methodology of this indicator, creating a long-term sentiment gauge that can reveal whether an asset is under sustained accumulation or distribution across days, weeks, or months. Divergences between this cumulative delta and price can identify major trend exhaustion or reversal points that might not be visible in the shorter-term flow measurements.
The signal plotting uses shape-based markers rather than background colors or arrows to maximize clarity while preserving chart space. Strong buy signals—meeting multiple criteria including EMA-SMA crossover, high volume, and positive momentum—appear as full-size green triangle-up shapes at the bottom of the indicator pane. Strong sell signals appear as full-size red triangle-down shapes at the top. Regular buy and sell signals that meet fewer criteria appear as smaller, semi-transparent circles, indicating they warrant attention but lack the full confirmation of strong signals. Divergence-based signals appear as distinct diamond shapes in cyan for bullish divergences and orange for bearish divergences, ensuring these critical reversal indicators are immediately recognizable and don't get confused with momentum-based signals. This multi-tiered signal hierarchy helps traders prioritize their analysis and avoid signal overload.
The information table in the top-right corner of the indicator pane provides real-time quantitative feedback on all major calculation components. It displays the current bar's buy volume and sell volume in millions with appropriate color coding, the imbalance percentage with color indicating whether it exceeds the threshold, the average intensity score showing whether closes are generally near highs or lows, the flow momentum value, and the current buy and sell scores. This table transforms the indicator from a purely graphical tool into a quantitative dashboard, allowing discretionary traders to incorporate specific numerical thresholds into their decision frameworks. For example, a trader might require that buy score exceed seventy percent and intensity exceed zero point six-five before taking a long position, creating objective entry criteria from subjective chart reading.
The background shading that occurs during very high volume periods provides an ambient alert system that doesn't require focused attention on the indicator pane. When volume spikes to one point five times the threshold and net flow EMA is positive, a very light green background appears across the entire indicator pane; when volume spikes with negative net flow, a light red background appears. These backgrounds create a subliminal awareness of exceptional market participation moments, ensuring traders notice when the market is making important decisions even if they're focused on price action or other indicators at that moment.
The alert system built into the indicator allows traders to receive notifications for strong buy signals, strong sell signals, bullish divergences, bearish divergences, and very high volume events. These alerts can be configured in TradingView to send push notifications to mobile devices, emails, or webhook calls to automated trading systems. This functionality transforms the indicator from a passive analysis tool into an active monitoring system that can watch markets continuously and notify the trader only when significant volume flow developments occur. For traders monitoring multiple instruments, this alert capability is invaluable for efficient time allocation, allowing them to analyze other opportunities while being instantly notified when this indicator identifies high-probability setups on their watch list.
The coding implementation demonstrates advanced Pine Script techniques including the use of request.security_lower_tf to access intrabar data, array manipulation to process variable-length intrabar arrays, proper variable scoping with var keyword for persistent state management across bars, and efficient conditional logic that prevents unnecessary calculations. The code structure with clearly delineated sections for inputs, calculations, signal generation, plotting, and alerts makes it maintainable and educational for those studying Pine Script development. The use of input groups with custom headers creates an organized settings panel that doesn't overwhelm users with dozens of ungrouped parameters, while still providing substantial customization capability for advanced users who want to optimize the indicator for specific instruments or timeframes.
For practical trading application, this indicator excels in several specific use cases. Scalpers and day traders can use the intrabar analysis to identify accumulation or distribution happening within the bars of their entry timeframe, providing early entry signals before momentum indicators or price patterns complete. Swing traders can use the cumulative delta and accumulation-distribution zones to understand whether short-term pullbacks in an uptrend are being bought or sold, helping distinguish between healthy retracements and trend reversals. Position traders can use the divergence detection to identify major turning points where price extremes are not supported by volume, providing low-risk entry points for counter-trend positions or warnings to exit with-trend positions before significant reversals.
The indicator is particularly valuable in ranging markets where price-based indicators produce numerous false breakout signals. By requiring that breakouts be accompanied by volume flow imbalances, the indicator filters out failed breakouts driven by low participation. When price breaks a range boundary accompanied by a strong buy or sell signal with high buy or sell score and very high volume, the probability of successful breakout follow-through increases dramatically. Conversely, when price breaks a range but the indicator shows low imbalance, opposing flow direction, or low volume, traders can fade the breakout or at minimum avoid chasing it.
During trending markets, the indicator helps traders identify the healthiest entry points by revealing where pullbacks are being accumulated by smart money. A trending market will show the cumulative delta continuing in the trend direction even as price pulls back, and accumulation zones will form during these pullbacks. When price resumes the trend, the indicator will generate strong buy or sell signals with high scores, providing objective entry points with clear invalidation levels. The flow momentum component helps traders stay with trends longer by distinguishing between healthy momentum pauses—where momentum goes to zero but doesn't reverse—and actual momentum reversals where opposing pressure is building.
The VWAP deviation weighting adds particular value for traders of liquid instruments like major forex pairs, stock indices, and high-volume stocks where VWAP is widely watched by institutional participants. When price deviates significantly from the intrabar VWAP and volume flows in the direction of that deviation with elevated weighting, it indicates that the move away from fair value is being driven by conviction rather than mechanical order flow. This suggests the deviation will likely extend further, creating continuation trading opportunities. Conversely, when price deviates from intrabar VWAP but volume flow shows reduced intensity or opposing direction despite the weighting, it suggests the deviation will revert to VWAP, creating mean reversion opportunities.
The ATR normalization option makes the indicator values comparable across different volatility regimes and different instruments. Without normalization, a one-million share buy-sell imbalance might be significant for a low-volatility stock but trivial for a high-volatility cryptocurrency. By normalizing the delta by ATR, the indicator accounts for the typical price movement capacity of the instrument, making signal thresholds and comparison values meaningful across different trading contexts. This is particularly valuable for traders running the indicator on multiple instruments who want consistent signal quality regardless of the underlying instrument characteristics.
The configurable decay factor allows traders to adjust how persistent they want volume flows to remain influential. For very short-term scalping, a lower decay factor like zero point five will cause volume imbalances to dissipate quickly, keeping the indicator focused only on very recent flows. For longer-term position trading, a higher decay factor like zero point nine-five will allow significant volume events to influence the indicator for many bars, revealing longer-term accumulation and distribution patterns. This flexibility makes the single indicator adaptable to trading styles ranging from one-minute scalping to daily chart position trading simply by adjusting the decay parameter and the lookback bars.
The minimum imbalance percentage setting provides crucial noise filtering that can be optimized per instrument. Highly liquid instruments with tight spreads might show numerous small imbalances that are meaningless, requiring a higher threshold like thirty-five or forty percent to filter noise effectively. Thinly traded instruments might rarely show extreme imbalances, requiring a lower threshold like fifteen or twenty percent to generate adequate signals. By making this threshold user-configurable with a wide range, the indicator accommodates the full spectrum of market microstructure characteristics across different instruments and timeframes.
In conclusion, the Intrabar Volume Flow Intelligence indicator represents a comprehensive volume analysis system that combines intrabar data access, sophisticated volume attribution algorithms, multi-timeframe smoothing, statistical filtering, divergence detection, zone identification, and intelligent signal scoring into a cohesive analytical framework. It provides traders with visibility into market dynamics that are invisible to price-only analysis and even to conventional volume analysis, revealing the true intentions of market participants through their actual transaction behavior within each bar. The indicator's strength lies not in any single feature but in the integration of multiple analytical layers that confirm and validate each other, creating high-probability signal generation that can form the foundation of complete trading systems or provide powerful confirmation for discretionary analysis. For traders willing to invest time in understanding its components and optimizing its parameters for their specific instruments and timeframes, this indicator offers a significant informational advantage in increasingly competitive markets where edge is derived from seeing what others miss and acting on that information before it becomes consensus.

Volatility RadarVolatility Radar: Script Summary
The **Volatility Radar** is a real-time TradingView dashboard designed to decode dealer positioning by fusing structural VIX analysis with options flow. Instead of treating volatility as a static number, it categorizes the market into distinct regimes—supportive "Green Rooms," noisy "Grey Channels," or dangerous "Red Rooms"—to determine whether options flow represents genuine momentum or a dealer hedging trap.
Recent upgrades have transformed the script from a passive monitor into an active threat detection system. It now features a **Velocity Check** that instantly overrides standard confirmation timers during sudden VIX spikes, **Gatekeeper Logic** to identify regime breakout events, and a **Dealer Reality Check** that flags "Trap Risks" when call buying occurs directly into high-velocity resistance.
### Detailed Mechanics: Velocity & Gatekeeper Logic
**The Velocity Check (The "Speed Trap")**
Standard indicators often lag because they wait for candle closes or fixed time intervals (e.g., a 10-minute confirmation rule). The Velocity Check bypasses this by monitoring the *rate of change* in the VIX over a rolling 5-bar window. If the VIX moves more than **0.40 points** in this short timeframe, the script triggers an "Immediate Override." This acknowledges that high-velocity moves—whether spikes or crushes—force dealers to re-hedge instantly, making the standard wait times dangerous. If the velocity threshold is breached, the script flashes a lightning bolt icon (`⚡`) and treats the move as confirmed immediately.
**The Gatekeeper Check (The "Zone Logic")**
Rather than viewing volatility as a simple high/low binary, the Gatekeeper logic defines a "Neutral Zone" (Grey Channel) bounded by specific "Gates" (e.g., 14.78 and 15.26).
* **Inside the Gates:** The market is considered to be in "Chop/Noise," where directional signals are unreliable and often result in whipsaws.
* **Crossing the Gates:** The logic specifically watches for *breakout events*. A move from the Grey Channel into the "Red Room" (>Bear Chop) signals a **Bearish Breakout**, immediately flipping the script's interpretation of "Buying Pressure" from bullish momentum to a "Trap Risk" (dealers selling into resistance). Conversely, a breakdown into the "Green Room" (

TRIDENT TREND Daily Decision Engine v1.4TRIDENT TREND is a rules-based, daily-timeframe decision engine designed for swing and position traders.
It evaluates market regime, trend structure, and risk conditions using end-of-day data only.
All decisions update after the daily candle closes to reduce noise and intraday over-trading.
Core Concepts
1. Market Regime (Directional Permission)
The script first determines whether the market environment supports long exposure.
If conditions are unfavorable, the system explicitly signals no-trade or exit, prioritizing capital preservation over constant participation.
2. Trend Structure & Risk Control
When long exposure is permitted, trend structure is evaluated to manage continuation and exits.
Risk controls adapt to market volatility, providing structured downside protection rather than fixed targets.
3. Indicator Inputs
The decision engine incorporates trend regime analysis and volatility-aware structure tracking derived from widely used technical frameworks.
These components are not used as standalone signals, but are combined, filtered, and gated into a single daily decision state that determines whether long exposure is permitted, maintained, or exited.
Regime context is derived from cloud-based trend analysis, while structure and risk controls adapt to volatility-based trend frameworks.
The resulting output reflects the interaction between regime context and trend structure, rather than raw indicator crossovers or alerts.
4. Daily Decision Framework
This script is not designed to generate frequent entries.
Instead, it provides a daily binary framework:
Long exposure permitted
Hold existing position
Exit / remain in cash
Visual Outputs:
Regime coloring indicates whether long exposure is allowed
Trend and stop overlays display structural context
Status table summarizes the current decision state at a glance
Intended Use:
Designed for daily charts
Best suited for swing and position trading
Not intended for scalping or intraday execution
Decisions should be evaluated once per day after candle close
Important Notes:
This is a decision-support tool, not a signal service
No predictions are made
Users are responsible for execution, position sizing, and risk management

Not only a Supertrend [by Oberlunar]Not only a Supertrend of Oberlunar was commissioned by a member of my community, Vincent K., who trades options intraday and needed something that stays reactive in fast regimes but does not collapse when the tape becomes discontinuous (volume gaps, micro-structure noise, sudden volatility shocks). Trust me... it was a real mathematical challenge...
The design goal is to estimate “regime probability + regime acceleration” rather than a simple trend signal. Options care about second-order effects: not only direction, but whether volatility is expanding or contracting, how persistent the expansion is, and whether the move is supported by genuine flow or is a transient spike.
There is no type of lookahead bias or repaint:
More or less 2 R in 10 minutes chart...
The core signal starts from two independent regime proxies that behave differently under stress. The first is log-return realized volatility mapped into a normalized percentile on a rolling window; this makes the volatility metric scale-free and comparable across instruments and regimes, and it avoids the distortion you get when using raw ATR-like measures during jumps. The second proxy is Bollinger width expansion relative to its own EMA baseline, then compressed through a logistic mapping so the regime evidence is continuous and saturates smoothly instead of generating threshold artifacts. The result is an “expansion base” and a “contraction base” that are both bounded and stable, even when price prints a discontinuity.
Directional bias is not treated as a hard filter but as a soft prior. A weighted multi-timeframe RSI is used to build a probabilistic prior over long vs short bias, so the model can express partial conviction and can reconcile conflicts across timeframes. This is important for options because you often want to separate “directional edge” from “volatility regime edge”: the engine keeps them coupled but not identical. The four channels (expansion-long, expansion-short, contraction-long, contraction-short) are therefore evidence streams, not binary states, and band breaks are used as conditional boosts rather than absolute triggers, which reduces false positives in noisy breakouts.
You can use a "not only" super trend line style with signals...
...or just follow the "not only" super trend planes and their breakout:
To make the system robust to gaps and one-bar anomalies, raw evidence is passed through an alpha–beta Kalman update. In practice this behaves like a minimal state-space tracker that estimates both the level of evidence and its drift. The level is the smoothed regime probability proxy; the drift is the important part for options because it measures “acceleration” of regime transition. The script explicitly uses the step of the filtered state as a normalized feature, so the engine can distinguish between a high but stagnant regime reading and a regime that is actively ramping. That step feature is intentionally bounded to avoid overreaction to single prints.
The final confidence is built as a Bayesian-style posterior update in a Beta-mean sense using pseudo-counts. The RSI-derived prior provides the base belief, and the likelihood is a convex combination of Bollinger regime evidence and Kalman-step evidence. The pseudo-count strengths control how sticky the posterior is: higher prior strength makes the posterior less jumpy, higher likelihood strength makes it adapt faster to new information. This is a practical probabilistic calibration layer: instead of stacking raw indicators, the model aggregates heterogeneous signals into a single posterior probability with controllable inertia, which is exactly what you want when trading convex instruments where “confidence stability” matters.
Bands filled by expansion Bayesian posterior:
Because regime detection alone is not sufficient to avoid whipsaws, the script implements an adaptive lane supertrend concept, but it is not a classic ATR stop. It runs on the net posterior difference between bullish and bearish hypotheses for expansion and contraction. Direction flips are gated by a deadband that adapts with confidence and regime intensity; this is effectively a hysteresis mechanism that increases tolerance near neutrality when noise is high, and tightens when the posterior is decisive. A flip-confirm mechanism requires persistence across bars, preventing the engine from toggling on micro-oscillations. The lane is drawn as a geometric mapping of the posterior net into price space, so you can read it visually as a “probabilistic supertrend line” rather than an oscillator background.
Finally, the key addition for the real-world tape problem is the Volumetrix Ribbon filter (another of my free public indicators).
This block is meant to catch the "not only" classic failure mode: the volatility engine signals bullish expansion while multi-venue flow is dominantly bearish (distribution/absorption) or vice versa. Dominance is computed from a multi-broker aggregation of volume pressure (body vs close-location mixing), normalised by an EMA of absolute pressure to be scale-stable, and evaluated across a ladder of fast TRIX/EMA sensitivities. Each lane votes bullish, bearish, or neutral based on the alignment of the price momentum proxy and flow proxy; dominance score captures directionality, while agreement captures how concentrated the vote is. When dominance is meaningfully bearish with sufficient agreement, bullish expansion signals are hard-blocked (and symmetrically for bearish expansion during bullish dominance). This is not a “confirmation” toy; it is a regime-consistency constraint intended to reduce false positives in exactly those scenarios that destroy options entries: apparent volatility expansion into opposing flow.
Thus, this is "not only" a supertrend... you get a probabilistic regime engine that is bounded, smooth, and statistically well-behaved; you get an acceleration detector that is robust to outliers; you get a Bayesian calibration layer that controls inertia; and you get a flow-consistency dominance gate that prevents taking expansion signals against prevailing multi-venue pressure. This is why it remains sensitive in fast markets without becoming fragile in the presence of gaps and high volatility.
Enjoy and comment on the setup and your considerations!
Your advice matters!
by Oberlunar 👁★

Black-Scholes Model and Greeks for European OptionsThe Black-Scholes model is a mathematical model used for pricing options. From this model you can derive the theoretical fair value of a European option (an option where you have to wait until expiry to exercise). Additionally, you can derive various risk parameters called Greeks. This indicator includes three types of data: Theoretical Option Price (blue), the Greeks (green), and implied volatility (red); their values are presented in that order.
1) Theoretical Option Price:
This first value gives only the theoretical fair value of an option with a given strike based on the Black-Scholes framework. Remember this is a model and does not reflect actual option prices, just the theoretical price based on the Black-Scholes model and its parameters and assumptions.
2)Greeks (all of the Greeks included in this indicator are listed below):
a)Delta is the rate of change of the theoretical option price with respect to the change in the underlying's price. This can also be used to approximate the probability of your option expiring in the money. For example, if you have an option with a delta of 0.62, then it has about a 62% chance of expiring in-the-money. This number runs from 0 to 1 for Calls, and 0 to -1 for Puts.
b)Gamma is the rate of change of delta with respect to the change in the underlying's price.
c)Theta, aka "time decay", is the rate of change in the theoretical option price with respect to the change in time. Theta tells you how much an option will lose its value day by day.
d)Vega is the rate of change in the theoretical option price with respect to change in implied volatility.
e)Rho is the rate of change in the theoretical option price with respect to change in the risk-free rate. Rho is rarely used because it is the parameter that options are least effected by, it is more useful for longer term options, like LEAPs.
f)Vanna is the sensitivity of delta to changes in implied volatility. Vanna is useful for checking the effectiveness of delta-hedged and vega-hedged portfolios.
g)Charm, aka "delta decay", is the instantaneous rate of change of delta over time. Charm is useful for monitoring delta-hedged positions.
h)Vomma measures the sensitivity of vega to changes in implied volatility.
i)Veta measures the rate of change in vega with respect to time.
j)Vera measures the rate of change of rho with respect to implied volatility.
k)Speed measures the rate of change in gamma with respect to changes in the underlying's price. Speed can be used when evaluating delta-hedged and gamma hedged portfolios.
l)Zomma measures the rate of change in gamma with respect to changes in implied volatility. Zomma can be used to evaluate the effectiveness of a gamma-hedged portfolio.
m)Color, aka "gamma decay", measures the rate of change of gamma over time. This can also be used to evaluate the effectiveness of a gamma-hedged portfolio.
n)Ultima measures the rate of change in vomma with respect to implied volatility.
o)Probability of Touch, is not a Greek, but a metric that I included, which tells you the probability of price touching your strike price before expiry.
3) Implied Volatility:
This is the market's forecast of future volatility. Implied volatility is directionless, it cannot be used to forecast future direction. All it tells you is the forecast for future volatility.
How to use this indicator:
1st. Input the strike price of your option. If you input a strike that is more than 3 standard deviations away from the current price, the model will return a value of n/a.
2nd. Input the current risk-free rate.(Including this is optional, because the risk-free rate is so small, you can just leave this number at zero.)
3rd. Input the time until expiry. You can enter this in terms of days, hours, and minutes.
4th.Input the chart time frame you are using in terms of minutes. For example if you're using the 1min time frame input 1, 4 hr time frame input 480, daily time frame input 1440, etc.
5th. Pick what type of option you want data for, Long Call or Long Put.
6th. Finally, pick which Greek you want displayed from the drop-down list.
*Remember the Option price presented, and the Greeks presented, are theoretical in nature, and not based upon actual option prices. Also, remember the Black-Scholes model is just a model based upon various parameters, it is not an actual representation of reality, only a theoretical one.

Trend Pulse Pro V2Trend Pulse Pro V2 (Non Repaint)
TradingView Account Needed: Free
You don't need to be an expert to use Trend Pulse Pro.
Just follow the signals and that's all and use simple Fibonacci levels to find stop loss and take profit!
You can increase the win rate even more by following some simple technical analysis, for example, when trend breaks (price break signal level) you can use that as support become resistance level (sell) or resistance becomes support (buy):
No complex things. No waste of time.
And although you won't win 100% of the trades (no signals can guarantee that), your trading will surely improve a lot!
Even someone with almost no trading experience can read the simple trading rules given in the included user guide, watch the how-to videos and follow Trend Pulse Pro’s signals to consistently make smarter trades.
With Trend Pulse Pro you will get accurate buy and sell signals every time there is a new trading opportunity so that you never miss any big price movements and makes your trading both easier and more profitable.
How to use the signals and alerts:
Trend Pulse Pro automatically analyze trend and price action to give you a signal when there's a good trade.
These trend signals and alerts are derived from live data but the stability of our code allows it to not repaint.
Trend Pulse Pro allow you to easily determine the trend and will give you buy and sell entry levels.
Works on all markets on all time frames so it's suitable for scalpers, day and swing traders.
If you want more details, the link is in the signature.
Disclaimer:
Past performance is not indicative of future performance. No representation is being made that any results discussed within the service and its related media content will be achieved. All opinions, news, research, analyses, prices or other information is provided as general market commentary and not as investment advice. TradingWalk, their members, shareholders, employees, agents, representatives and resellers do not warrant the completeness, accuracy or timeliness of the information supplied, and they shall not be liable for any loss or damages, consequential or otherwise, which may arise from the use or reliance of the TradingWalk service and its content. © 2019 TradingWalk.
TradingWalk indicators are built for TradingView. TradingWalk is on no way a part of TradingView.

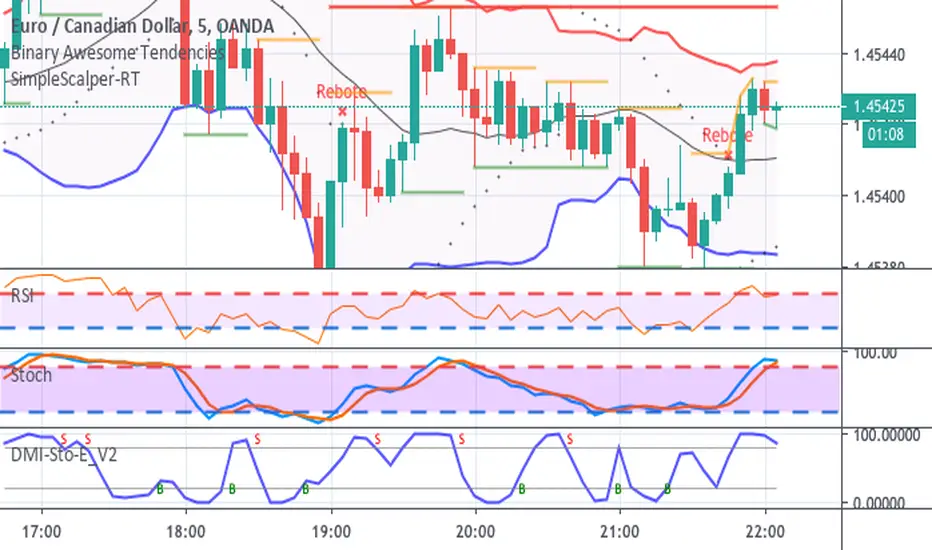
MM-Microtrend-Reversal-IndicatorThis indicator detects microtrend reversals based on crossing of the DMI+ and DMI- + signals
It indicates the trigger event on the chart as well as the reversal candle
In addition to that it shows a countdown above the bars
This is helping when multiple reversals occur
Important: when the Bollinger Bands are crossed in the previous bars it's possible that the prognosted reversal will NOT show up
Recommended timeframes are M1 and M2
Avoid trading sideway trends, the reverals are low and reversal triggers and assumed reversal candles could get chaotic
