BeeQuant - Hive Visualizer💠 OVERVIEW
The " Hive Visualizer " is a game-changing, invite-only tool, expertly designed to give every trader, from beginner to experienced, instant and clear visual clues about what price is doing. Its main job is to easily show you the highest and lowest points price has reached recently. Think of it as a smart, automated helper that colors your candles to reveal powerful market moves. This helps you quickly see if prices are getting stronger or weaker right on your chart. It's a groundbreaking, high-quality tool that cuts through the noise, making it simple to spot key moments when the market is about to make a big move up or down, giving you an edge.
__________________________________________________________________________
🧠 CONCEPTS
The core philosophy behind Hive Visualizer is rooted in contextual volatility exposure and directional bias reinforcement. Through a sophisticated internal mechanism that evaluates local maxima/minima behavior within a compact temporal field, the indicator provides adaptive color‑based candle transitions that align with latent directional pressure.
1. Uses localized equilibrium breach detection to monitor directional intent and exhaustion points.
2. Embeds a dynamically updating framework that reacts to both trend continuation and structural reversals.
3. Avoids false positives by disregarding noisy fluctuations below system‑defined relevance thresholds.
4. Provides non‑repainting, fully forward‑confirmed visual outputs for reliable retrospective analysis.
Hive Visualizer is not designed to be predictive. Instead, it allows traders to observe the evolution of price structure in a cleaner and more digestible format, supporting high-confidence discretionary execution or automated model overlays.
__________________________________________________________________________
✨ FEATURES
The "Hive Visualizer" comes with a suite of smart features, all designed for amazing clarity, quick reactions, and deeper understanding, making your charting experience truly effortless:
🔹 Easy Range Customization
A super easy "Smoother" setting lets you perfectly adjust how the indicator reacts to recent price changes. This means you can fine-tune it to match exactly how you like to trade
🔹 Instant, Clear Signals
The simple Green and Red candles give you immediate, unmistakable visual cues about strong upward or downward moves, providing insights you can grasp in a heartbeat.
🔹 Smart Continuity in Quiet Times
The clever way it keeps the same color for candles that aren't breaking out offers valuable, subtle insights into those periods when the market is just moving sideways or finding its balance, helping you see the hidden dynamics.
🔹 Seamless Chart Integration
This indicator works like a transparent overlay, appearing directly on your price chart without getting in the way or changing your original candles. It fits perfectly, making your analysis smooth and uninterrupted.
🔹 Clean and Focused Visuals
The indicator’s simple design focuses only on coloring the main candle body and border to clearly highlight important breakouts. This keeps your chart clean and effective, showing you only what truly matters.
🔹 Cross-Market Versatility
This indicator is engineered to perform with precision across all major markets—whether you're trading forex, commodities, stocks, or indices. Its adaptive logic automatically aligns with the unique volatility and structure of each asset class, delivering consistently reliable insights no matter where you trade.
__________________________________________________________________________
⚙️ USAGE
Using and making the "Hive Visualizer" a part of your trading routine is incredibly simple and designed to significantly boost how you understand the market:
Getting Started: Once you have access, just add the "Hive Visualizer" indicator to any chart and timeframe you want on TradingView. It's that easy.
Tuning the "Smoother" Setting: Go into the indicator's settings and play with the "Smoother" number. This is a crucial step to make it react just right for you.
Smaller numbers (like 1-3 bars) will make the indicator very quick to react to the most recent, short-term ups and downs, perfect for fast trading.
Larger numbers (like 5-10+ bars) will give you a wider view, smoothing out small changes and highlighting bigger, more important breakouts, ideal for longer-term analysis. Spend a little time trying different settings to find what works best for your chosen asset and your trading style – it's like finding the perfect lens for your market view.
Understanding the Colors: Once you've set it up, here's how to quickly understand what the "Hive Visualizer" is telling you: New Green Candle: This means a strong sign that buyers are in control and prices are likely to keep moving up, giving you confidence in bullish moves.
New Red Candle: This indicates as a strong signal that sellers are dominating and prices are likely to keep moving down, preparing you for bearish shifts.
__________________________________________________________________________
⚠️ LIMITATIONS
👉 Visual Guide, Not a Bot: Use as part of a broader strategy—it won’t auto‑trade for you
👉 Retroactive Insight: It reflects past price action; it doesn’t predict the future.
👉 Setting‑Dependent: Effectiveness relies on your “Smoother” choice—too low = noise; too high = lag.
👉 Price‑Range Focused: Highlights trends and range only — doesn’t analyze volume, news, or other complex factors.
👉 This tool enhances trend validation but isn’t a standalone signal generator.
█ ▒▒▒▒▒▒▒▒▒▒▒▒▒▒▒▒▒▒▒▒▒▒▒ 『•••• ✎ ••••』 ▒▒▒▒▒▒▒▒▒▒▒▒▒▒▒▒▒▒▒▒▒▒▒▒ █
🎯 CONCLUSION
The "Hive Visualizer" offers an incredibly easy-to-use and adaptable way to see price strength and weakness with crystal clarity on your charts. By giving you instant, clear feedback on whether prices are powerfully breaking out or falling below a recent historical range, it truly empowers you to quickly understand market momentum and spot key turning points. Seamlessly add this smart visual tool into your current trading methods to gain a sharper, more insightful view, and elevate your trading decisions. It's about seeing the market with new eyes.
▣▣▣▣▣▣▣▣▣▣▣▣▣▣▣▣▣▣▣▣▣▣▣▣▣▣▣▣▣▣▣▣▣▣▣▣▣▣▣▣▣▣▣▣▣▣▣▣▣▣▣
🚨 RISK DISCLAIMER
Engagement in financial market speculation inherently carries a substantial degree of inherent risk, and the potential for capital diminution, potentially exceeding initial deposits, is a pervasive and non-trivial consideration. All content, algorithmic tools, scripts, articles, and educational materials disseminated by "Hive Visualizer" are exclusively purposed for informational and pedagogical objectives, strictly for reference. Historical performance data, whether explicitly demonstrated or implicitly suggested, offers no infallible assurance or guarantee of future outcomes. Users bear sole and ultimate accountability for their individual trading decisions and are emphatically urged to meticulously assess their financial disposition, risk tolerance parameters, and conduct independent due diligence prior to engaging in any speculative market activity.
Search in scripts for "bot"

Contrarian 100 MAPairs nicely with Enhanced-Stock-Ticker-with-50MA-vs-200MA located here:
Description
The Contrarian 100 MA is a sophisticated Pine Script v6 indicator designed for traders seeking to identify key market structure shifts and trend reversals using a combination of a 100-period Simple Moving Average (SMA) envelope and Inner Circle Trader (ICT) Break of Structure (BoS) and Market Structure Shift (MSS) logic. By overlaying a semi-transparent SMA-based shadow on the price chart and plotting bullish and bearish structure signals, this indicator helps traders visualize critical price levels and potential trend changes. It leverages higher timeframe (HTF) pivot points and dynamic logic to adapt to various chart timeframes, making it ideal for swing and contrarian trading strategies. Customizable colors, timeframes, and alert conditions enhance its versatility for manual and automated trading setups.
Key Features
SMA Envelope: Plots a 100-period SMA for high and low prices, creating a semi-transparent (50% opacity) purple shadow to highlight the price range and provide context for price movements.
ICT BoS/MSS Logic: Identifies Break of Structure (BoS) and Market Structure Shift (MSS) signals for both bullish and bearish conditions, based on HTF pivot points.
Dynamic Timeframe Support: Adjusts pivot detection based on user-selected HTF (default: 1D) and chart timeframe (1M, 5M, 15M, 30M, 1H, 4H, 1D), ensuring adaptability across markets.
Visual Signals: Draws dotted lines for BoS (bullish/bearish) and MSS (bullish/bearish) signals at pivot levels, with customizable colors for easy identification.
Contrarian Approach: Signals potential reversals by combining SMA context with ICT structure breaks, ideal for traders looking to capitalize on trend shifts.
Alert Conditions: Supports alerts for bullish/bearish BoS and MSS signals, enabling integration with TradingView’s alert system for automated trading.
Performance Optimization: Uses efficient pivot detection and line management to minimize resource usage while maintaining accuracy.
Technical Details
SMA Calculation:
Computes 100-period SMAs for high (smaHigh) and low (smaLow) prices.
Plots invisible SMAs (fully transparent) and fills the area between them with 50% transparent purple for visual context.
Pivot Detection:
Uses ta.pivothigh and ta.pivotlow to identify HTF swing points, with dynamic lookback periods (rlBars: 5 for daily, 2 for intraday).
Tracks pivot highs (pH, nPh) and lows (pL, nPl) using a custom piv type for price and time.
BoS/MSS Logic:
Bullish BoS: Triggered when price breaks above a pivot high in a bullish trend, drawing a line at the pivot level.
Bearish BoS: Triggered when price breaks below a pivot low in a bearish trend.
Bullish MSS: Occurs when price breaks a pivot high in a bearish trend, signaling a potential trend reversal.
Bearish MSS: Occurs when price breaks a pivot low in a bullish trend.
Lines are drawn using line.new with xloc.bar_time for precise alignment, styled as dotted with customizable colors.
HTF Integration: Fetches HTF close prices and pivot data using request.security with lookahead_on for accurate signal timing.
Line Management: Maintains an array of lines (lin), removing outdated lines when new MSS signals occur to keep the chart clean.
Pivot Reset: Clears broken pivots (e.g., when price exceeds a pivot high or falls below a pivot low) to ensure fresh signal generation.
How to Use
Add to Chart:
Copy the script into TradingView’s Pine Editor and apply it to your chart.
Configure Settings:
SMA Length: Adjust the SMA period (default: 100 bars) to suit your trading style.
Structure Timeframe: Set the HTF for pivot detection (default: 1D).
Chart Timeframe: Select the chart timeframe (1M, 5M, 15M, 30M, 1H, 4H, 1D) to adjust pivot sensitivity.
Colors: Customize bullish/bearish BoS and MSS line colors via input settings.
Interpret Signals:
Bullish BoS: White dotted line (default) at a broken pivot high in a bullish trend, indicating trend continuation.
Bearish BoS: White dotted line at a broken pivot low in a bearish trend.
Bullish MSS: White dotted line at a broken pivot high in a bearish trend, suggesting a reversal to bullish.
Bearish MSS: White dotted line at a broken pivot low in a bullish trend, suggesting a reversal to bearish.
Use the SMA shadow to gauge price position within the recent range.
Set Alerts:
Create alerts for bullish/bearish BoS and MSS signals using TradingView’s alert system.
Customize Visuals:
Adjust line colors or SMA fill transparency via TradingView’s settings for better visibility.
Example Use Cases
Swing Trading: Use MSS signals to enter trades at potential trend reversals, with the SMA envelope confirming price extremes.
Contrarian Trading: Capitalize on BoS and MSS signals to trade against prevailing trends, using the SMA shadow for context.
Automated Trading: Integrate BoS/MSS alerts with trading bots for systematic entries and exits.
Multi-Timeframe Analysis: Combine HTF signals (e.g., 1D) with lower timeframe charts (e.g., 1H) for precise entries.
Notes
Testing: Backtest the indicator on your chosen market and timeframe to validate performance.
Compatibility: Built for Pine Script v6 and tested on TradingView as of June 19, 2025.
Limitations: Signals rely on HTF pivot accuracy, which may lag in fast-moving markets. Adjust rlBars or timeframe for sensitivity.
Optional Enhancements: Consider uncommenting or adding a histogram for SMA divergence (e.g., smaHigh - smaLow) for additional insights.
Acknowledgments
This indicator combines ICT’s market structure concepts with a dynamic SMA envelope to provide a unique contrarian trading tool. Share your feedback or suggestions in the TradingView comments, and happy trading!

SuperTrend Adaptive (STD Smooth)Supertrend Adaptive (Smoothed StdDev)
Supertrend Adaptive is a refined trend-following indicator based on the classic Supertrend. It enhances the original by incorporating smoothed standard deviation into the volatility calculation, instead of relying solely on ATR. This hybrid approach enables more responsive and adaptive trend detection, reducing noise and false signals in volatile or ranging markets. The indicator also features confidence-weighted signal labels and a clean, uncluttered display, making it practical for any trading timeframe.
🔍 Detailed Methodology and Conceptual Foundation
Unlike traditional Supertrend indicators that use only absolute volatility (ATR) to define trend bands, this version blends standard deviation — a relative volatility measure — into the calculation. Standard deviation helps capture the dispersion of price, not just its range, and when smoothed, it filters out erratic jumps caused by sudden spikes or drops.
This fusion creates trend bands that expand and contract dynamically based on recent price variability. As a result:
Fewer whipsaws : The trend bands adjust to both low and high volatility environments, which helps avoid unnecessary signal flips during consolidation.
Stronger trend adherence : Signals are less reactive to momentary price movements. This allows the indicator to hold positions longer in trending markets, giving traders the opportunity to ride extended moves.
Bollinger Band-style adaptation : By including standard deviation, this indicator behaves similarly to Bollinger Bands — accounting for relative price change rather than absolute moves alone.
These enhancements make the tool suitable not only for identifying directional bias, but also for refining entries and exits with more context-aware volatility filtering.
📈 How to Use the Indicator
Trend Direction: The script draws a colored line beneath (uptrend) or above (downtrend) price. Green indicates bullish trend, red indicates bearish.
Buy/Sell Labels: Only the most recent signal is shown to reduce clutter:
🟢 Green "Buy" label = trend reversal to bullish, with strong confidence.
🔵 Blue "Buy" label = same reversal, but with lower volume confidence.
🔴 Red "Sell" label = trend reversal to bearish, with strong confidence.
🟠 Orange "Sell" label = bearish signal with lower volume confidence.
These color codes are derived from comparing current volume to its average — a higher-than-average volume gives greater confidence to the signal.
Settings:
ATR Period: Controls the smoothing window for volatility calculation.
ATR Multiplier: Adjusts the size of the trend bands.
Std Smooth: Controls smoothing applied to standard deviation to reduce jitter.
Change ATR Method: Option to toggle between default and smoothed ATR.
Show Signals: Toggle for label display.
📢 Alerts
The script includes three built-in alert conditions:
Buy Signal: Triggered when the trend flips to bullish.
Sell Signal: Triggered when the trend flips to bearish.
Trend Direction Change: Alerts on any switch in trend regardless of confidence level.
These alerts allow traders to automate notifications or integrations with bots or trading platforms.
🧼 Clean Chart Display
To ensure clarity and comply with best practices:
The chart shows only this indicator.
Trend lines are drawn in real time for visual context.
Only one label per direction is shown — the most recent one — to keep the chart readable.
No drawings or unrelated indicators are included.
This setup ensures the script’s signals and structure are immediately understandable at a glance.
📌 Best Use Cases
This tool is designed for:
Traders who want adaptive volatility filters instead of rigid ATR-based models.
Scalpers and swing traders who prefer clean charts with minimal lag and fewer false signals.
Any asset class — works well on crypto, FX, and equities.
Shortcoming of this tool is sideway price action (will be tackled in next versions).
Credit for www.tradingview.com the version which this script extends.

MACD Full [Titans_Invest]MACD Full — A Smarter, More Flexible MACD.
Looking for a MACD with real customization power?
We present one of the most complete public MACD indicators available on TradingView.
It maintains the classic MACD structure but is enhanced with 20 fully customizable long entry conditions and 20 short entry conditions , giving you precise control over your strategy.
Plus, it’s fully automation-ready, making it ideal for quantitative systems and algorithmic trading.
Whether you're a discretionary trader or a bot developer, this tool is built to seamlessly adapt to your style.
⯁ WHAT IS THE MACD❓
The Moving Average Convergence Divergence (MACD) is a technical analysis indicator developed by Gerald Appel. It measures the relationship between two moving averages of a security’s price to identify changes in momentum, direction, and strength of a trend. The MACD is composed of three components: the MACD line, the signal line, and the histogram.
⯁ HOW TO USE THE MACD❓
The MACD is calculated by subtracting the 26-period Exponential Moving Average (EMA) from the 12-period EMA. A 9-period EMA of the MACD line, called the signal line, is then plotted on top of the MACD line. The MACD histogram represents the difference between the MACD line and the signal line.
Here are the primary signals generated by the MACD:
Bullish Crossover: When the MACD line crosses above the signal line, indicating a potential buy signal.
Bearish Crossover: When the MACD line crosses below the signal line, indicating a potential sell signal.
Divergence: When the price of the security diverges from the MACD, suggesting a potential reversal.
Overbought/Oversold Conditions: Indicated by the MACD line moving far away from the signal line, though this is less common than in oscillators like the RSI.
⯁ ENTRY CONDITIONS
The conditions below are fully flexible and allow for complete customization of the signal.
______________________________________________________
🔹 CONDITIONS TO BUY 📈
______________________________________________________
• Signal Validity: The signal will remain valid for X bars .
• Signal Sequence: Configurable as AND or OR .
🔹 MACD > Signal Smoothing
🔹 MACD < Signal Smoothing
🔹 Histogram > 0
🔹 Histogram < 0
🔹 Histogram Positive
🔹 Histogram Negative
🔹 MACD > 0
🔹 MACD < 0
🔹 Signal > 0
🔹 Signal < 0
🔹 MACD > Histogram
🔹 MACD < Histogram
🔹 Signal > Histogram
🔹 Signal < Histogram
🔹 MACD (Crossover) Signal
🔹 MACD (Crossunder) Signal
🔹 MACD (Crossover) 0
🔹 MACD (Crossunder) 0
🔹 Signal (Crossover) 0
🔹 Signal (Crossunder) 0
______________________________________________________
______________________________________________________
🔸 CONDITIONS TO SELL 📉
______________________________________________________
• Signal Validity: The signal will remain valid for X bars .
• Signal Sequence: Configurable as AND or OR .
🔸 MACD > Signal Smoothing
🔸 MACD < Signal Smoothing
🔸 Histogram > 0
🔸 Histogram < 0
🔸 Histogram Positive
🔸 Histogram Negative
🔸 MACD > 0
🔸 MACD < 0
🔸 Signal > 0
🔸 Signal < 0
🔸 MACD > Histogram
🔸 MACD < Histogram
🔸 Signal > Histogram
🔸 Signal < Histogram
🔸 MACD (Crossover) Signal
🔸 MACD (Crossunder) Signal
🔸 MACD (Crossover) 0
🔸 MACD (Crossunder) 0
🔸 Signal (Crossover) 0
🔸 Signal (Crossunder) 0
______________________________________________________
______________________________________________________
🤖 AUTOMATION 🤖
• You can automate the BUY and SELL signals of this indicator.
______________________________________________________
______________________________________________________
⯁ UNIQUE FEATURES
______________________________________________________
Signal Validity: The signal will remain valid for X bars
Signal Sequence: Configurable as AND/OR
Condition Table: BUY/SELL
Condition Labels: BUY/SELL
Plot Labels in the Graph Above: BUY/SELL
Automate and Monitor Signals/Alerts: BUY/SELL
Signal Validity: The signal will remain valid for X bars
Signal Sequence: Configurable as AND/OR
Table of Conditions: BUY/SELL
Conditions Label: BUY/SELL
Plot Labels in the graph above: BUY/SELL
Automate & Monitor Signals/Alerts: BUY/SELL
______________________________________________________
📜 SCRIPT : MACD Full
🎴 Art by : @Titans_Invest & @DiFlip
👨💻 Dev by : @Titans_Invest & @DiFlip
🎑 Titans Invest — The Wizards Without Gloves 🧤
✨ Enjoy!
______________________________________________________
o Mission 🗺
• Inspire Traders to manifest Magic in the Market.
o Vision 𐓏
• To elevate collective Energy 𐓷𐓏

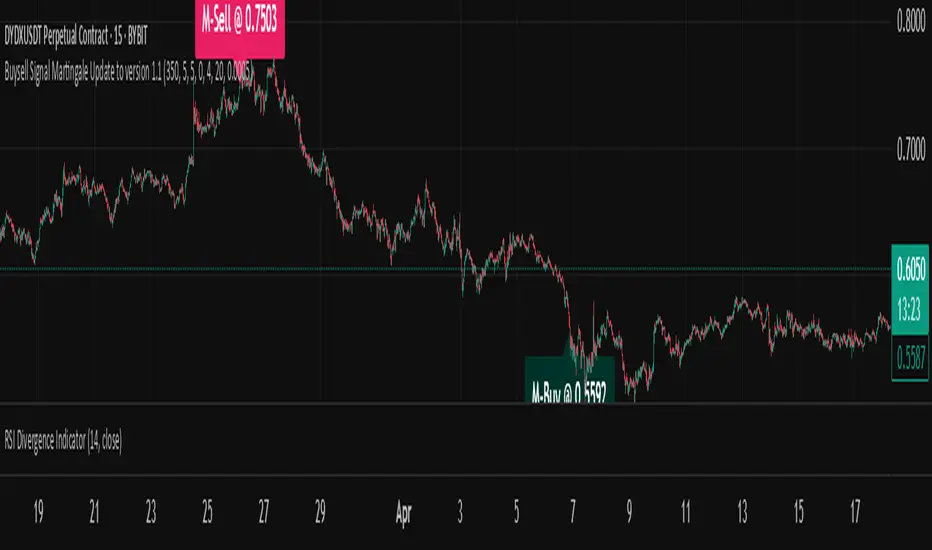
Buysell Martingale Signal - CustomBuysell Martingale Signal - Custom Indicator
Introduction:
This indicator provides a dynamic buy and sell signal system incorporating an adaptive Martingale logic. Built upon the signalLib_yashgode9/2 library, it is designed for use across various markets and timeframes.
Key Features:
Primary Buy & Sell Signals: Identifies initial buy and sell opportunities based on directional changes derived from the signalLib.
Martingale Signals:
For Short (Sell) Positions: A Martingale Sell signal is triggered when the price moves against the existing short position by a specified stepPercent from the last entry price, indicating a potential opportunity to average down or increase position size.
For Long (Buy) Positions: Similarly, a Martingale Buy signal is triggered when the price moves against the existing long position by a stepPercent from the last entry price.
On-Chart Labels: Displays clear, customizable labels on the chart for primary Buy, Sell, Martingale Buy, and Martingale Sell signals.
Customizable Colors: Allows users to set distinct colors for primary signals and Martingale signals for better visual distinction.
Adjustable Sensitivity: Features configurable parameters (DEPTH_ENGINE, DEVIATION_ENGINE, BACKSTEP_ENGINE) to fine-tune the sensitivity of the underlying signal generation.
Webhook Support (Static Message Alerts): This indicator provides alerts with static messages for both primary and Martingale buy/sell signals. These alerts can be leveraged for automation by external systems (such as trading bots or exchange-provided Webhook Signal Trading services).
Important Note: When using these alerts for automation, an external system is required to handle the complex Martingale logic and position management (e.g., tracking steps, PnL calculation, hedging, dynamic quantity sizing), as this indicator solely focuses on signal generation and sending predefined messages.
How to Use:
Add the indicator to your desired chart.
Adjust the input parameters in the indicator's settings to match your specific trading symbol and timeframe.
For automation, you can set up TradingView alerts for the Buy Signal (Main/Martingale) and Sell Signal (Main/Martingale) conditions, pointing them to your preferred Webhook URL.
Configurable Parameters:
DEPTH_ENGINE: (e.g., 30) Controls the depth of analysis for the signal algorithm.
DEVIATION_ENGINE: (e.g., 5) Defines the allowable deviation for signal generation.
BACKSTEP_ENGINE: (e.g., 5) Specifies the number of historical bars to look back.
Martingale Step Percent: (e.g., 0.5) The percentage price movement against the current position that triggers a Martingale signal.
Labels Transparency: Adjusts the transparency of the on-chart signal labels.
Buy-Color / Sell-Color: Sets the color for primary Buy and Sell signal labels.
Martingale Buy-Color / Martingale Sell-Color: Sets the color for Martingale Buy and Sell signal labels.
Label size: Controls the visual size of the labels.
Label Offset: Adjusts the vertical offset of the labels from the candlesticks.
Risk Warning:
Financial trading inherently carries significant risk. Martingale strategies are particularly high-risk and can lead to substantial losses or even complete liquidation of capital if the market moves strongly and persistently against your position. Always backtest thoroughly and practice with a demo account, fully understanding the associated risks, before engaging with real capital.
Enhanced Stock Ticker with 50MA vs 200MADescription
The Enhanced Stock Ticker with 50MA vs 200MA is a versatile Pine Script indicator designed to visualize the relative position of a stock's price within its short-term and long-term price ranges, providing actionable bullish and bearish signals. By calculating normalized indices based on user-defined lookback periods (defaulting to 50 and 200 bars), this indicator helps traders identify potential reversals or trend continuations. It offers the flexibility to plot signals either on the main price chart or in a separate lower pane, leveraging Pine Script v6's force_overlay functionality for seamless integration. The indicator also includes a customizable ticker table, visual fills, and alert conditions for automated trading setups.
Key Features
Dual Lookback Indices: Computes short-term (default: 50 bars) and long-term (default: 200 bars) indices, normalizing the closing price relative to the high/low range over the specified periods.
Flexible Signal Plotting: Users can toggle between plotting crossover signals (triangles) on the main price chart (location.abovebar/belowbar) or in the lower pane (location.top/bottom) using the Plot Signals on Main Chart option.
Crossover Signals: Generates bullish (Golden Cross) and bearish (Death Cross) signals when the short or long index crosses above 5 or below 95, respectively.
Visual Enhancements:
Plots short-term (blue) and long-term (white) indices in a separate pane with customizable lookback periods.
Includes horizontal reference lines at 0, 20, 50, 80, and 100, with green and red fills to highlight overbought/oversold zones.
Dynamic fill between indices (green when short > long, red when long > short) for quick trend visualization.
Displays a ticker and legend table in the top-right corner, showing the symbol and lookback periods.
Alert Conditions: Supports alerts for bullish and bearish crossovers on both short and long indices, enabling integration with TradingView's alert system.
Technical Innovation: Utilizes Pine Script v6's force_overlay parameter to plot signals on the main chart from a non-overlay indicator, combining the benefits of a separate pane and chart-based signals in a single script.
Technical Details
Calculation Logic:
Uses confirmed bars (barstate.isconfirmed) to calculate indices, ensuring reliability by avoiding real-time bar fluctuations.
Short-term index: (close - lowest(low, lookback_short)) / (highest(high, lookback_short) - lowest(low, lookback_short)) * 100
Long-term index: (close - lowest(low, lookback_long)) / (highest(high, lookback_long) - lowest(low, lookback_long)) * 100
Signals are triggered using ta.crossover() and ta.crossunder() for indices crossing 5 (bullish) and 95 (bearish).
Signal Plotting:
Main chart signals use force_overlay=true with location.abovebar/belowbar for precise alignment with price bars.
Lower pane signals use location.top/bottom for visibility within the indicator pane.
Plotting is controlled by boolean conditions (e.g., bullishLong and plot_on_chart) to ensure compliance with Pine Script's global scope requirements.
Performance Considerations: Optimized for efficiency by calculating indices only on confirmed bars and using lightweight plotting functions.
How to Use
Add to Chart:
Copy the script into TradingView's Pine Editor and add it to your chart.
Configure Settings:
Short Lookback Period: Adjust the short-term lookback (default: 50 bars) to match your trading style (e.g., 20 for shorter-term analysis).
Long Lookback Period: Adjust the long-term lookback (default: 200 bars) for broader market context.
Plot Signals on Main Chart: Check this box to display signals on the price chart; uncheck to show signals in the lower pane.
Interpret Signals:
Golden Cross (Bullish): Green (long) or blue (short) triangles indicate the index crossing above 5, suggesting a potential buying opportunity.
Death Cross (Bearish): Red (long) or white (short) triangles indicate the index crossing below 95, signaling a potential selling opportunity.
Set Alerts:
Use TradingView's alert system to create notifications for the four alert conditions: Long Index Valley, Long Index Peak, Short Index Valley, and Short Index Peak.
Customize Visuals:
The ticker table displays the symbol and lookback periods in the top-right corner.
Adjust colors and styles via TradingView's settings if desired.
Example Use Cases
Swing Trading: Use the short-term index (e.g., 50 bars) to identify short-term reversals within a broader trend defined by the long-term index.
Trend Confirmation: Monitor the fill between indices to confirm whether the short-term trend aligns with the long-term trend.
Automated Trading: Leverage alert conditions to integrate with bots or manual trading strategies.
Notes
Testing: Always backtest the indicator on your chosen market and timeframe to validate its effectiveness.
Optional Histogram: The script includes a commented-out histogram for the index difference (index_short - index_long). Uncomment the plot(index_diff, ...) line to enable it.
Compatibility: Built for Pine Script v6 and tested on TradingView as of May 27, 2025.
Acknowledgments
This indicator was inspired by the need for a flexible tool that combines lower-pane analysis with main chart signals, made possible by Pine Script's force_overlay feature. Share your feedback or suggestions in the comments below, and happy trading!

RSI Crossover Signal Companion - Alerts + Visuals🔷 RSI Crossover Signal Companion — Alerts + Visuals
The Relative Strength Index (RSI) is a momentum oscillator that measures the speed and change of recent price movements. It helps traders identify overbought or oversold conditions, possible trend reversals, and momentum strength.
This utility builds on TradingView’s classic Relative Strength Index (RSI) by adding real-time alerts and triangle markers when the RSI crosses its own moving average — a common technique for early momentum detection.
It is designed as a lightweight, visual companion tool for traders using RSI/MA crossover logic in manual or semi-automated strategies.
🔍 Features
✅ Preserves the full original RSI layout, including:
• Gradient fill and overbought/oversold zones
• Standard RSI input settings (length, source, etc.)
• MA smoothing options with user-defined type and length
🔺 Adds visual triangle markers:
🔼 Up triangle when RSI crosses above its MA
🔽 Down triangle when RSI crosses below its MA
📢 Built-in alerts for RSI/MA crosses:
“RSI Crossed Above MA”
“RSI Crossed Below MA”
📈 How to Use
This script is ideal for:
• Spotting early momentum shifts
• Confirming entries or exits in other systems (price action, trendlines, breakouts)
• Building alert-based automation (webhooks, bots, etc.)
Popular use cases:
• Combine with trend indicators like MA200 or MA12
• Use in confluence with price structure and divergence
• Validate breakout moves with momentum confirmation
⚙️ Customization
RSI length, MA length, MA type, and source are fully adjustable
Triangle marker size, shape, and color can be edited under Style
Alerts are pre-built and ready for use

ML: Lorentzian Classification Premium█ OVERVIEW
Lorentzian Classification Premium represents the culmination of two years of collaborative development with over 1,000 beta testers from the TradingView community. Building upon the foundation of the open-source version, this premium edition introduces powerful enhancements that transform how machine-learning classification can be applied to market analysis.
The premium version maintains the core Lorentzian distance-based classification algorithm while expanding its capabilities through triple the feature dimensionality (up to 15 features), sophisticated mean-reversion detection, first-pullback identification, and a comprehensive signal taxonomy that goes far beyond simple buy/sell signals. Whether you're building automated trading systems, conducting deep market research, or integrating proprietary indicators into ML workflows, this tool provides the advanced edge needed for professional-grade analysis.
█ BACKGROUND
Lorentzian Classification analyzes market structures, especially those exhibiting non-linear distortions under stress, by employing advanced distance metrics like the Lorentzian metric, prominent in fields such as relativity theory. Where traditional indicators assume flat space, we embrace the curve. The heart of this approach is the Lorentzian distance metric—a sophisticated mathematical tool. This framework adeptly navigates the complex curves and distortions of market space, aiming to provide insights that traditional analysis might miss, especially during moments of extreme volatility. It analyzes historical data from a multi-dimensional feature space consisting of various technical indicators of your choosing. Where traditional approaches fail, Lorentzian space reveals the true geometry of market dynamics.
Neighborhoods in Different Geometries: In the above figure, the Lorentzian metric creates distinctive cross-patterns aligned with feature axes (RSI, CCI, ADX), capturing both local similarity and dimensional extremes. This unique geometry allows the algorithm to recognize similar market conditions that Euclidean spheres and Manhattan diamonds would miss entirely. In LC Premium, users can have up to 15 features -- you are not limited to 3-dimensions.
Among the thousands of distance metrics discovered by mathematicians, each perceives data through its own geometric lens. The Lorentzian metric stands apart with its unique ability to capture market behavior during volatile events.
█ COMMUNITY-DRIVEN EVOLUTION
It has been profoundly humbling over the past 2 years to witness this indicator's evolution through the collaborative efforts of our incredible community. This journey has been shaped by thousands of user suggestions and validated through real-world application.
A particularly amazing milestone was the development of a complete community-driven Python port, which meticulously matched even the most minute PineScript quirks. Building on this solid foundation, a new command-line interface (CLI) has opened up exciting possibilities for chart-specific parameter optimization:
Early insights from parameter optimization research: Through grid-search testing across thousands of parameter combinations, the analysis identifies which parameters have the biggest effects on performance and maps regions of stability across different market regimes. This reveals that optimal neighbor counts vary significantly based on market conditions—opening up incredible potential for timeframe-specific optimization.
This is just one of the insights gleaned so far from this ongoing investigation. The potential for chart-specific optimization for any given timeframe could transform how traders approach parameter selection.
Demand from power users for extra capabilities—while keeping the open-source version simple—sparked this Premium release. The open-source branch remains maintained, but the premium tier adds unique features for those who need an analytical edge and to leverage their own custom indicators as feature series for the algorithm.
█ KEY PREMIUM FEATURES
📈 First Pullback Detection System
Automatically identifies high-probability trend-continuation entries after initial momentum moves.
Detects when price retraces to optimal entry zones following breakouts or trend initiations.
Green/red triangle signals often fire before main classification arrows.
Dedicated alerts for both bullish and bearish pullback opportunities.
Based on veryfid's extensive research into pullback mechanics and market structure.
🔄 Dynamic Kernel Regression Envelope
Powerful, zero-setup confluence layer that immediately communicates trend shifts.
Dual-kernel system creates a visual envelope between trend estimates.
Color gradient dynamically represents prediction strength and market conviction.
Crossovers provide additional confirmation without cluttering your chart.
Professional visualization that rivals institutional-grade analysis tools.
✨ Massively Expanded Dimensionality: 10 Custom Sources, 5 Built-In Sources
Transform the indicator from 5 built-in standard to 15 total total features—triple the analytical power.
Integrate ANY TradingView indicator as a machine learning feature.
Built-in normalization ensures all indicators contribute equally regardless of scale.
Create theme-based systems: pure volume analysis, multi-timeframe momentum, or hybrid approaches.
📊 Tiered Mean Reversion Signals with Scalping Alerts
Regular (🔄) and Strong (⬇️/⬆️) mean reversion signals based on statistical extremes.
Opportunities often arise before candle close—perfect for scalping entries.
Visual markers appear at high-probability reversal zones.
Four specialized alert types: upward/downward for both regular and strong reversals.
Pre-optimized probability thresholds, no fine-tuning required.
📅 Daily Kernel Trend Filter
Instantly cleans up noisy intraday charts by aligning with higher timeframe trends.
Swing traders report immediate signal quality improvement.
Automatically deactivates on daily+ timeframes (intelligent context awareness).
Reduces counter-trend signals by up to 60% on lower timeframes.
Simple toggle—no complex multi-timeframe setup required.
📋 Professional Backtesting Stream (-6 to +6)
Multiple distinct signal types (including pullbacks, mean reversions, and kernel deviations) vs. basic binary (buy/sell) output for nuanced analysis.
Enables detailed walk-forward analysis and ML model training.
Compatible with external backtesting frameworks via numeric stream.
Rare precision for TradingView indicators—usually only found in institutional tools.
Perfect for quants building sophisticated strategy layers.
⚡ Performance Optimizations
Faster distance calculations through algorithmic improvements.
Reduced indicator load time (measured via Pine Profiler).
Handles 15 active features without timeouts—critical for multi-chart setups.
Optimized for live auto-trading bots requiring minimal latency.
🎨 Full Visual Customization & Accessibility
Complete color control for all visual elements.
Colorblind-safe default palette with customization options.
Dark mode optimization for extended trading sessions.
Professional appearance matching your trading workspace.
Accessibility features meeting modern UI standards.
🛠️ Advanced Training Modes
Downsampling mode for training on diverse market conditions; Down-sampling and remote-fractals for exotic pattern discovery.
Remote fractals option extends analysis to deep historical patterns.
Reset factor control for fine-tuning neighbor diversity; Reset-factor tuning to control neighbor diversity.
Appeals to systematic traders exploring exotic data approaches.
Prevents temporal clustering bias in model training.
█ HOW TO USE
Understanding the Approach (Core Concept):
Lorentzian Classification uses a k-Nearest Neighbors (k-NN) algorithm. It searches for historical price action "neighborhoods" similar to the current market state. Instead of a simple straight-line (Euclidean) distance, it primarily uses a Lorentzian distance metric, which can account for market "warping" or distortions often seen during high volatility or significant events. Each historical neighbor "votes" on what happened next in its context, and these votes aggregate into a classification score for the current bar.
Interpreting Bar Scores & Signals (Interpreting the Chart):
Bar Prediction Values: Numbers over each candle (e.g., ranging from -8 to +8 if Neighbors Count is 8) represent the aggregated vote from the nearest neighbors. Strong positive scores (e.g., +7, +8) indicate a strong bullish consensus among historical analogs. Strong negative scores (e.g., -7, -8) indicate a strong bearish consensus. Scores near zero suggest neutrality or conflicting signals from neighbors. The intensity of bar colors (if Use Confidence Gradient is on) often reflects these scores.
Main Arrows (Main Buy/Sell Labels): Large ▲/▼ labels are the primary entry signals generated when the overall classification (after filters) is bullish or bearish.
Pullback Triangles: Small green/red ▲/▼ identify potential trend continuation entries. These signals often appear after an initial price move and a subsequent minor retracement, suggesting the trend might resume. This is based on recognizing patterns where a brief counter-movement is followed by a continued advance in the initial trend direction.
Mean-Reversion Symbols: 🔄 (Regular Reversion) appears when price has crossed the average band of the Dynamic Kernel Regression Envelope. ⬇️/⬆️ (Strong Reversion) means price has crossed the far band of the envelope, indicating a more extreme deviation and potentially a stronger reversion opportunity.
Custom Mean Reversion Deviation Markers (Deviation Dots): If Enable Custom Mean Reversion Alerts is on, these dots appear when price deviates from the main kernel regression line by a user-defined ATR multiple, signaling a custom-defined reversion opportunity.
Kernel Regression Lines & Envelope: The Main Kernel Estimate (thicker line) is an adaptive moving average that smooths price and helps identify trend direction. Its color indicates the current trend bias. The Envelope (outer bands and a midline) creates a channel around price, and its interaction with price generates mean reversion signals.
Key Input Groups & Their Purpose:
🔧 GENERAL SETTINGS:
Reduce Price-Time Warping : Toggles the distance metric. When enabled, it reduces the characteristic "warping" effect of the default Lorentzian metric, making the distance calculation more Euclidean in nature. This may be suited for periods exhibiting less pronounced price-time distortions.
Source : Price data for calculations (default: close ).
Neighbors Count : The 'k' in k-NN – number of historical analogs considered.
Max Bars Back : How far back the indicator looks for historical patterns.
Show Exits / Use Dynamic Exits : Controls visibility and logic for exit signals.
Include Full History (Use Remote Fractals) : Allows model to pick "exotic" fractals from deep chart history.
Use Downsampling / Reset Factor : Advanced training parameters affecting neighbor selection.
Show Trade Stats / Use Worst Case Estimates : Displays a real-time performance table (for calibration only).
🎛️ DEFINE CUSTOM SOURCES (OPTIONAL):
Integrate up to 10 external data series (e.g., from other indicators) as features. Each can be optionally normalized. Load the external indicator on your chart first for it to appear in the dropdown.
🧠 FEATURE ENGINEERING:
Configure up to 15 features for the k-NN algorithm. Select type (RSI, WT, CCI, ADX, Custom Sources), parameters, and enable/disable. Start simple (3-5 features) and add complexity gradually. Normalize features with vastly different scales.
🖥️ DISPLAY SETTINGS:
Controls visibility of chart elements: bar colors, prediction values/labels, envelope, etc.
Align Signal with Current Bar : If true, pullback signals appear on the current bar (calculated on closed data). If false (default), they appear on the next bar.
Use ATR Offset : Positions bar prediction values using ATR for visibility.
🧮 FILTERS SETTINGS:
Refine raw classification signals: Volatility, Regime, ADX, EMA/SMA, and Daily Kernel filters.
🌀 KERNEL SETTINGS (Main Kernel):
Adjust parameters for the primary Nadaraya-Watson Kernel Regression line. Lookback Window , Relative Weighting , Regression Level , Lag control sensitivity and smoothness.
✉️ ENVELOPE SETTINGS (for Mean Reversion):
Configure the dynamic Kernel Regression Envelope. ATR Length , Near/Far ATR Factor define band width.
🎨 COLOR SETTINGS (Colors):
Customize colors for all visual elements; override every palette element.
General Approach to Using the Indicator (Suggested Workflow):
Load defaults and observe behavior: Familiarize yourself with the indicator's behavior.
Feature Engineering: Experiment with features, considering momentum, trend, and volatility. Add/replace features gradually.
Apply Filters: Refine signals according to your trading style.
Contextualize: Use kernels and envelope to understand broader trend and potential overbought/oversold areas.
Observe Signals: Pay attention to the interplay of main signals, pullbacks, and mean reversions. Watch interplay of main, pullback & mean-reversion signals.
Calibrate (Not Backtest): Use the "Trade Stats" table for real-time feedback on current settings. This is for calibration, *not a substitute for rigorous backtesting.*
Iterate & refine: Adjust settings, observe outcomes, and refine your approach.
█ ACKNOWLEDGMENTS
This premium version wouldn't exist without the invaluable contributions of:
veryfid for his groundbreaking ideas on unifying pullback detection with Lorentzian Classification, but most of all for always believing in and encouraging me and so many others. For being a mentor and, most importantly, a friend. We all miss you.
RikkiTavi for his help in creating the settings optimization framework and for other invaluable theoretical discussions.
The 1,000+ beta testers worldwide who provided continuous feedback over two years.
The Python porting team who created the foundation for advanced optimization; for the cross-language clone.
The broader TradingView community for making this one of the platform's most popular indicators.
█ FUTURE DEVELOPMENT
The Premium version will continue to evolve based on community feedback. Planned enhancements include:
Specialized exit model trained independently from entry signals (ML-based exit model).
Feature hub with pre-normalized, commonly requested indicators (Pre-normalized feature hub).
Better risk-management options (Enhanced risk-management options).
Fully automated settings optimization (Auto-settings optimization tool).
Paid script
[Stoxello] Linear Regression Chop Zone Indicator📊 Linear Regression Chop Zone Indicator – Description
The Stoxello Linear Regression Chop Zone Indicator is a custom-built, multi-functional visual tool for identifying market trend direction, strength, and potential entry/exit signals using a combination of linear regression, EMA slope angles, and volatility-adjusted smoothing.
🧠 Core Features:
🔶 1. Chop Zone Color Coding (Trend Strength via EMA Angle)
The script calculates the angle of a 34-period EMA, representing momentum and trend steepness.
This angle is then translated into color-coded bars on the chart to help traders visually identify chop zones and trend strength.
Turquoise / Dark Green / Pale Green = Increasing bullish trend.
Lime / Yellow = Neutral or low momentum (choppy zones).
Orange / Red / Dark Red = Increasing bearish trend.
🔶 2. Linear Regression Deviation Channels (Trend Path)
A custom linear regression line is drawn with +/- deviation bands above and below it.
These lines track the expected price path and visually define upper/lower zones, similar to regression channels.
The correlation (R) and determination (R²) values are displayed as labels on the chart, measuring the strength and reliability of the linear fit.
🔶 3. Linear Regression-Adjusted EMA (Smoothing with Volatility)
A novel volatility-adaptive EMA is computed by combining a traditional EMA with distance from a linear regression line.
The result is a dynamic EMA that becomes more reactive in volatile conditions and smoother in stable ones.
Two lines are plotted:
Primary EMA (Yellow)
Trigger Line (Lagged by 2 bars, Fuchsia)
The fill color between these two helps visualize short-term bullish or bearish pressure.
🔶 4. Buy/Sell Signal Logic with De-Duplication
Buy signals are triggered when:
The adjusted EMA crosses above its previous value (bullish inflection).
Or when the EMA angle exceeds +5° (strong trend detected).
Sell signals occur when:
The adjusted EMA crosses below its previous value.
Each signal is deduplicated by tracking the last signal using var string lastSignal:
No repeat buys after a buy, or sells after a sell.
Signals are marked on the chart using clean text labels:
Buy: "•Entry• = Price"
Sell: "•Exit• = Price"
🔶 5. Alerts
Two alertconditions are included for:
BUY signals (long_signal)
SELL signals (short_signal)
Can be used with webhooks, email, or app notifications to automate or monitor trades.
🔍 Ideal Use Cases:
Traders who want a clear visual aid for market chop vs. trend.
Swing or intraday traders looking for adaptive entry/exit points.
Anyone combining regression analysis and momentum tracking into one indicator.

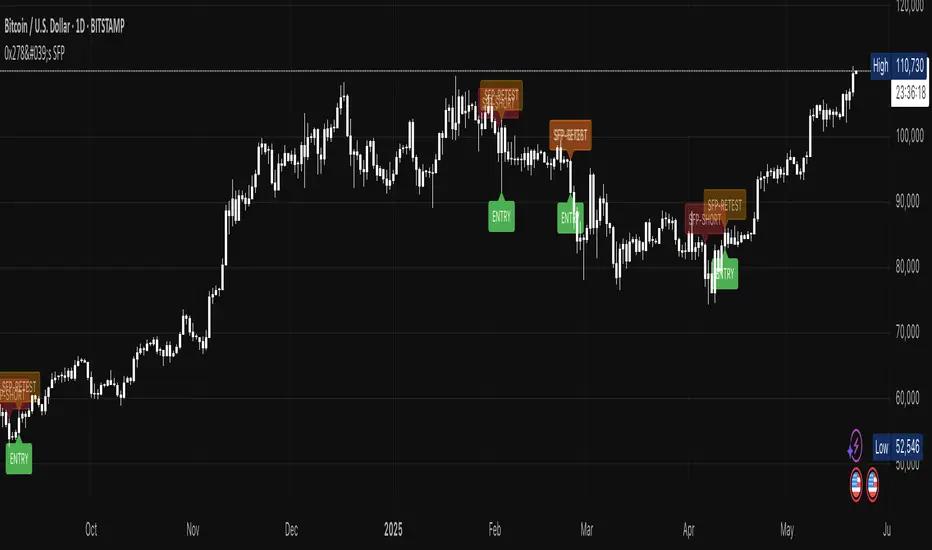
0x278's Swing-Failure-Pattern (SFP)0x278's Swing-Failure-Pattern (SFP) ‑ Confirmed Short
Table of Contents
Introduction
Core Concept – What Is an SFP?
How the Indicator Works
Visual Elements & Their Meaning
Input Parameters Explained
Step-by-Step Trading Playbook
Example Workflow (Daily BTC-USDT)
Alerts & Automation
Tips, Tricks & Best Practices
FAQ
Advanced Configuration & Asset-Class Playbook
1. Introduction
The Swing-Failure-Pattern (SFP) – Confirmed Short indicator spots and tracks bearish SFPs on any market and timeframe, with defaults tuned for Daily charts.
A bearish SFP occurs when price sweeps a prior swing high (liquidity grab) and then decisively rejects lower , signalling a possible trend reversal or sharp pullback.
This script automatically:
Identifies the liquidity sweep & rejection (‐"SFP-SHORT" label)
Confirms directional intent via a structure-breaking close below the setup low
Paints a preferred sell-on-retest zone and tracks its validity
Identifies optimal entry opportunities when price retests the zone
Generates optional retest and entry alerts when trading conditions appear
Self-cleans after a configurable number of bars – keeping your chart tidy
Default Timeframe : Daily
Default Market : Crypto / FX majors
Works On : All symbols + timeframes – simply adjust parameters.
2. Core Concept – What Is an SFP?
Sweep (Liquidity Grab) – Price trades above a meaningful swing high, triggering stops & inducing breakout buyers.
Rejection – The same bar (or the next) closes back below the swept high, invalidating the breakout.
Structure Break – Bears confirm intent by closing below the "setup low" (the most recent pivot low before the sweep).
Retest – Price retraces to the sweep zone. Traders seek entries inside the upper half of that zone with invalidation just above the swing high.
The indicator encodes these four steps so you can spot high-quality bearish reversals without manual bar-by-bar analysis.
3. How the Indicator Works
Phase: Sweep & Rejection
Script Logic: high > lastSwingHigh and close < lastSwingHigh
Visual Cue: Red SFP-SHORT label above candle
Phase: Structure Break
Script Logic: Close < setupLow while pattern locked
Visual Cue: Zone (red line-box) plotted; SFP-SHORT label stays
Phase: Retest Tracking
Script Logic: Zone stays active for retestExpiry bars or until tapped
Visual Cue: Orange SFP-RETEST label when hit
Phase: Entry Signal
Script Logic: Price rejection within retest zone
Visual Cue: Green ENTRY label at optimal entry point
Phase: Expiry / Cleanup
Script Logic: Zone deleted after expiry
Visual Cue: Labels fade but remain visible for reference
All calculations reset after each completed/expired pattern ensuring fresh, uncluttered signals.
4. Visual Elements & Their Meaning
SFP-SHORT (red) – Bar that swept a prior high and closed below it.
Red Box / Line – Preferred sell zone between the swing high (upper bound) and dynamic lower bound (see sizing methods). Extends right until filled/expired.
SFP-RETEST (orange) – Bar that first tags the zone after confirmation.
ENTRY (green) – Appears when a high-probability entry signal occurs within the retest zone.
EXPIRED (gray) – Appears when the retest zone expires without being hit.
Visual Persistence – Labels fade but remain visible after expiry for reference and historical analysis.
5. Input Parameters Explained
Pivot Detection
Pivot left / right : Bars left/right of the pivot that must stay below/above it. Tip : Symmetrical values (3/3) work best for clean structure.
Retest Management
Retest expiry (bars) : Lifespan of a retest zone before it is considered stale. Default: 14 bars on Daily . Tip : Shorten for intraday, lengthen for swing trading.
Retest Zone Sizing
Sizing method : Select Static %, ATR-based or Hybrid logic for the lower boundary. Tip : Hybrid balances tight stops with realistic fills.
Static % : Fixed fraction of sweep range when Static/Hybrid is selected. Tip : Higher % deepens zone & widens stop.
ATR period : Look-back length for ATR when volatility sizing is used. Tip : Increase to smooth choppy markets.
ATR multiplier : Multiplier applied to ATR in ATR-based/Hybrid mode. Tip : Higher value widens zone during volatility.
Visual – Retest Zone
Show retest zone box : Toggles drawing of the semi-transparent sell zone box. Tip : Disable for ultra-clean look.
Retest box color : Fill colour of the box (alpha = transparency). Tip : Match your chart theme.
Max retest boxes : How many historical boxes remain visible (0 = unlimited). Tip : Lower to boost performance.
Only show active boxes : Automatically deletes a box once it's hit. Tip : Reduces clutter during back-testing.
Visual – General
Minimal mode : Hides most visuals apart from critical labels. Tip : Ideal for screenshots.
Show retest zone line : Draws a vertical line linking upper/lower boundaries. Tip : Acts as a quick depth guide.
Show ENTRY labels : Plots 'ENTRY' on optimal candles. Tip : Turn off for manual confirmation.
Labels
Label size : Overall size of all labels. Tip : tiny / small / normal.
Use simple label style : Switches to pixel text style for labels. Tip : Faster rendering on low-spec machines.
Advanced
minPct / maxPct (hard-coded) : Internal floor/cap for Hybrid logic. Tip : Exposed in code for power-users only.
Zone-Sizing Methods
Static – Lower bound = sweepRange × staticPct.
ATR-based – Lower bound = ATR × multiplier, normalised to the sweepRange.
Hybrid – Uses the greater of Static and ATR-based (capped by an internal safety ceiling).
6. Step-by-Step Trading Playbook
Identify Context – Prefer setups against extended moves into obvious highs (e.g., daily swing highs, prior week high, round numbers).
Wait for SFP Confirmation – The indicator will label an SFP-SHORT only after the candle closes. Do not front-run.
Structure-Break Close – A close below setupLow turns the zone live. This is your go signal – prepare sell orders.
Place Orders in the Zone
Entry : Limit order anywhere between retestLower and the swing high.
Stop : 1-2 ticks/pips above the swing high.
Risk Management
Size position so risk per trade ≤ account risk % (common: 0.5-1%).
If no retest before retestExpiry bars → cancel order .
Targets
Conservative: First liquidity pocket / FVG below.
Aggressive: 2-3× risk or next HTF support.
Trail or Partial – Consider trailing stop once 1R is achieved or partial profit at 1R.
7. Example Workflow (Daily BTC-USDT)
BTC trades to a fresh one-month high at $31 050 sweeping prior highs.
Candle closes at $30 420 – below the swept high – SFP-SHORT label appears.
Two days later, candle closes below setupLow at $29 880 – confirmation & zone plotted (upper = $31 050, lower ≈ $30 550).
Five days later price retests the zone hitting $30 750 – SFP-RETEST alert fires, trade filled.
Stop placed @ $31 120 (70$ risk). 1R target = $29 680 reached four days later.
8. Alerts & Automation
SFP Short confirmed
Fires When: Structure-break close below setupLow.
Suggested Action: Prepare/submit sell-limit order in the zone.
SFP Short retest
Fires When: Price enters the retest zone.
Suggested Action: Monitor for entry signals or prepare for manual entry.
SFP Short Entry Signal
Fires When: Optimal entry conditions detected within retest zone.
Suggested Action: Execute short trade with defined risk parameters.
Use TradingView's Webhook URL to forward alerts to a trade-execution bot (e.g., PineConnector) for automated order placement.
9. Tips, Tricks & Best Practices
Combine with HTF Bias – Only take bearish SFPs in bearish weekly trend.
Watch Volume – High volume on the sweep bar adds conviction.
Time Window – SFPs during NY session FX / US session crypto tend to be stronger.
Cluster Zones – Multiple overlapping SFP zones increase probability; treat the cluster as one larger supply.
Avoid News – Skip SFPs forming minutes before high-impact macro news.
10. FAQ
Q: Can I use this on lower timeframes?
A: Yes – reduce retestExpiry (e.g., 15 bars on 15-minute) and test ATR-based sizing.
Q: Does it work for longs?
A: This script focuses on bearish SFPs. Clone & invert conditions for longs.
Q: Why did a zone disappear?
A: Either it expired (retestExpiry) without a retest or the cleanup routine removed old visuals to stay within Pine limits (500 objects per type).
Q: What's the difference between the "SFP-RETEST" and "ENTRY" signals?
A: "SFP-RETEST" indicates price has entered the zone, while "ENTRY" signals an optimal entry opportunity based on price rejection within the zone.
Q: How do I customize the label appearance?
A: Use the "Label size" and "Use simple label style" settings to adjust all labels to your preferred visual style.
Happy trading & trade safe!
11. Advanced Configuration & Asset-Class Playbook
Why does the retest box feel "too high" and how do I actually get filled? Use the quick tweaks below or the power-user code snippet to shape the zone to your personality and instrument.
11.1 Why the default box is shallow
The Static 25 % / ATR-Hybrid logic keeps stops small. Around 50 % of Daily BTC SFPs never look back – that's the cost of tight risk. If you need higher fill-rates, deepen the zone (11.2).
11.2 Three slider moves – no coding required
Retest zone sizing method – switch Static → Hybrid or ATR-based
Static % – raise from 0.25 → 0.45-0.60
ATR multiplier – raise from 1.0 → 1.5-2.0
Each turn pulls the lower edge of the box deeper while keeping the invalidation at the swing high.
11.3 One-liner for coders
To allow >60 % of the sweep range edit the source:
Old code:
minPct = 0.05
maxPct = 0.60
New code:
minPct = 0.05
maxPct = input.float(0.60, "Max retest % of sweep", step = 0.05, minval = 0.10, maxval = 0.95)
Then dial the cap up to ~0.80-0.90 from the settings panel.
11.4 If price never comes back…
No-retest partial – take 25-40 % size on the confirmation candle, stop above the high.
Lower-TF confirmation – drop to 4 h / 1 h and hunt an internal SFP or bearish FVG inside the sweep.
ATR trail – if price dumps immediately, trail the stop above each new lower-high.
11.5 Asset-Class Cheat-Sheet
Crypto – Daily : Static %: 0.20-0.35, ATR mult: 1.0, Retest Expiry: 12-20 . Notes : High volatility; sweeps expand fast.
FX Majors – 4 h/D : Static %: 0.25-0.40, ATR mult: 1.2, Retest Expiry: 15-25 . Notes : ATR handles session compression.
Index Futures – 1 h : Static %: 0.30-0.50, ATR mult: 1.5, Retest Expiry: 10-20 . Notes : Hybrid recommended; gaps tighten sweeps.
US Equities – 30 m : Static %: 0.35-0.55, ATR mult: 1.5-2.0, Retest Expiry: 10-14 . Notes : Consider no-retest entry on earnings spikes.
Always forward-test on your own symbol & timeframe ✔️
[blackcat] L2 Angle Trend TrackerOVERVIEW
The " L2 Angle Trend Tracker" is a sophisticated technical analysis tool designed to monitor trend direction and momentum using multiple Exponential Moving Averages (EMAs) with different periods. 📈 This script calculates the angles of 5 EMAs (5, 8, 10, 12, and 15 periods) and displays them with gradient colors, providing a comprehensive view of market momentum. When all EMAs cross above or below specified threshold levels, it generates Buy or Sell signals with visual alerts. The indicator helps traders identify trend reversals, potential entry/exit points, and market sentiment shifts with precision. 🚀 This powerful tool is particularly useful for traders who want to combine multiple timeframe analysis with angle-based momentum confirmation.
FEATURES
Calculates angles for 5 EMAs with customizable periods (5, 8, 10, 12, and 15)
Displays angle values with distinct colors for each EMA (Green, Blue, Purple, Orange, and Red)
Generates Buy signals when all EMAs cross above the lower threshold
Generates Sell signals when all EMAs cross below the upper threshold
Shows a zero line and threshold lines for easy reference
Customizable threshold levels for Buy/Sell signals
Visual alerts with "Buy" and "Sell" labels at the point of signal generation
The script uses a mathematical formula to calculate the angle of each EMA relative to its position 11 bars ago
Angle values are converted from radians to degrees for easier interpretation
The zero line represents no change in the EMA angle
The indicator is not overlayed on the price chart by default, but can be adjusted in the script settings 📊
HOW TO USE
Adjust the EMA periods to match your trading strategy 🛠️
Shorter periods (5, 8) are more sensitive to price changes
Longer periods (10, 12, 15) provide smoother trend confirmation
Set appropriate threshold values for Buy/Sell signals based on your risk tolerance
Default thresholds are 70 for upper threshold and -70 for lower threshold
Consider adjusting thresholds based on market volatility
Watch for Buy signals when all EMAs cross above the lower threshold (default: -70)
The signal appears as a green "Buy" label on the chart
This indicates a potential trend reversal to the upside
Watch for Sell signals when all EMAs cross below the upper threshold (default: 70)
The signal appears as a red "Sell" label on the chart
This indicates a potential trend reversal to the downside
Combine with other indicators for confirmation before making trading decisions 🧠
Consider using volume confirmation, support/resistance levels, or other oscillators
The angle tracker works well with trend-following strategies
Use the angle values to gauge momentum strength
Steeper angles indicate stronger momentum
Flatter angles suggest weakening momentum or consolidation
CONFIGURATION
EMA Periods: The script uses five different EMA periods that can be customized:
EMA Period 5: Short-term trend indicator
EMA Period 8: Medium-short term trend indicator
EMA Period 10: Medium-term trend indicator
EMA Period 12: Medium-long term trend indicator
EMA Period 15: Long-term trend indicator
Threshold Settings:
Threshold Top: Sets the upper boundary for Sell signals (default: 70)
Threshold Bot: Sets the lower boundary for Buy signals (default: -70)
These thresholds can be adjusted based on market conditions and trading style
LIMITATIONS
The script may generate false signals in ranging markets or during periods of high volatility
All EMAs must cross the threshold for a signal to appear, which may filter some valid signals
The angle calculation uses a 11-bar lookback period, which may not be suitable for all timeframes
Works best in trending markets and may produce whipsaws in choppy conditions ⚠️
The indicator is more effective on higher timeframes (4H, 1D) than on very short timeframes (1M, 5M)
Signal generation requires confirmation from multiple EMAs, which may delay entry/exit points
The angle calculation method may not be suitable for all financial instruments
ADVANCED TIPS
Use multiple instances of this indicator with different EMA settings for multi-timeframe analysis
Combine with volume analysis to confirm the strength of signals
Look for confluence with support and resistance levels for more reliable signals
Consider using the angle values as a filter for other trading strategies
The indicator can be used to identify momentum exhaustion points when angles flatten
For swing trading, consider using the Buy and Sell signals as potential entry/exit points
For day trading, you may want to use shorter EMA periods and adjust threshold values accordingly
NOTES
The script uses a mathematical formula to calculate the angle of each EMA relative to its position 11 bars ago
The angle values are converted from radians to degrees for easier interpretation
The zero line represents no change in the EMA angle
The indicator is not overlayed on the price chart by default, but can be adjusted in the script settings 📊
The angle calculation provides a dynamic view of momentum that traditional moving averages don't offer
The threshold values are based on empirical testing and can be fine-tuned for specific instruments
THANKS
Special thanks to the TradingView community for their support and feedback on this indicator. If you find this script helpful, please consider leaving a comment or sharing your experiences with it. Your feedback helps improve the tool for everyone. 🙏
Also, a nod to the original concept developers who pioneered angle-based trend analysis. This script builds upon those foundational ideas to provide a more comprehensive view of market momentum. 🌟

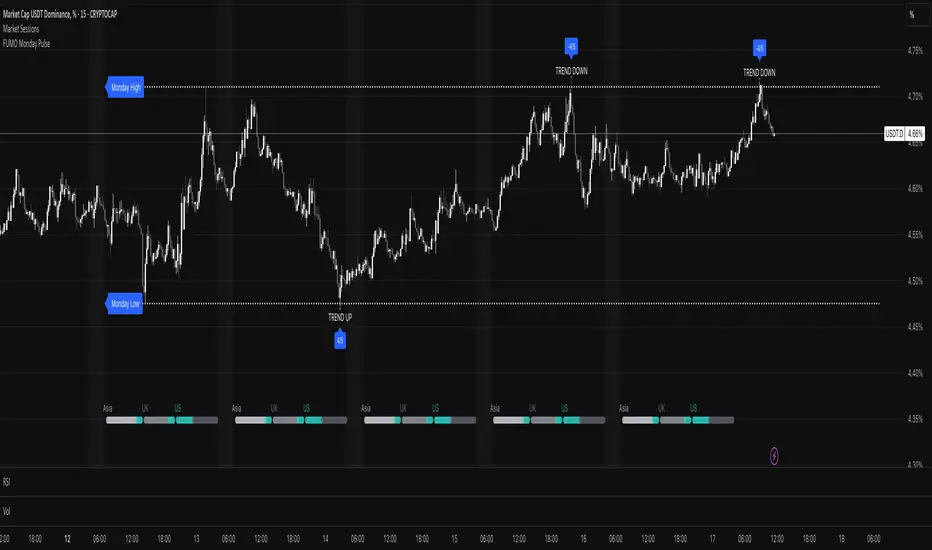
FUMO Monday Pulse💓 FUMO Monday Pulse – Weekly Directional Strategy
FUMO Monday Pulse is a directional trading strategy designed to detect early-week momentum and breakout structure, based on Monday’s high and low levels. This tool combines smart breakout detection, retests, and volume filters — ideal for traders looking to systematize early trend entries.
🔍 How It Works
Each week, the indicator automatically tracks Monday’s High and Low, then evaluates how price reacts around those levels during the rest of the week.
It generates two types of signals:
RETEST signals (LONG / SHORT) – a confirmed breakout on a higher timeframe (e.g. 4H), followed by a retest with candle and volume confirmation.
TREND signals (UP / DOWN) – impulsive moves without confirmation, often indicating the start of a directional push.
⚙️ Key Features
Customizable line width, style, and label size
Volume confirmation (optional)
Higher timeframe breakout validation
Cooldown period between signals to avoid clutter
🔔 Alerts
This script supports 4 alert types:
FUMO: RETEST LONG
FUMO: RETEST SHORT
FUMO: TREND UP
FUMO: TREND DOWN
Each alert sends a structured JSON payload via webhook:
{
"event": "RETEST_LONG",
"source": "FUMO_Monday_Pulse",
"symbol": "{{ticker}}",
"time": "{{time}}",
"price": {{close}}
}
You can use this with Telegram bots, Discord webhooks, or execution scripts.
💡 Recommended Use
Use this tool on 15m–1H charts, especially for breakout traders looking to align with early-week momentum. Built to integrate with automated workflows — and powered by the FUMO mindset: focus, structure, clarity.
The Ultimate Buy and Sell Indicator: Unholy Grail Edition"You see, Watson, the market is not random—it simply whispers in a code too complex for the average trader. Lucky for you, I am not average."
They searched for the Holy Grail of trading for decades—promises, false prophets, and overpriced PDFs.
But they were all looking in the wrong place.
This isn’t a relic buried in the desert.
This is the Unholy Grail — a machine-forged fusion of logic, engineering, and tactical overkill .
Built by Sherlock Macgyver , this is not a mystical object. It’s a surveillance system for trend detection, signal validation, and precision entries .
⚠️ Important: This script draws its own candles.
To see it properly, disable regular candles by turning off "Body", "Wick" and "Border" colors.
🔧 What You’re Looking At
This overlay plots confirmed Buy/Sell signals , momentum-based “watch” zones , adaptive candle coloring , SuperTrend bias detection , dual Bollinger Bands , and a moving average ribbon .
It’s not “minimalist” —it’s comprehensive .
📍 Configuring the Tool: Follow the Breadcrumbs
Every setting includes a tooltip — read them . They're not filler. They explain exactly how each feature functions so you can dial this thing in like you're tuning a surveillance rig in a Cold War bunker .
If you skip them, you're walking blind in a minefield .
🕰️ Timeframes: The Signal Sweet Spot
Each asset has a tempo . You need to find the one where signals align with clarity —not chaos .
Start with 4H or 1H —work up or down from there.
Too many fakeouts? → Higher timeframe
Too slow? → Drop to 15m or 5m —but expect more noise and adjust settings accordingly.
The signals scale with time, but you must find the rhythm that best fits your asset—and your trading lifestyle .
♻️ RSI Cycle = Signal Sensitivity
This is the heart of the system . It controls how reactive the RSI engine is.
Adjust based on noise level and how often you can actually monitor your charts.
Short cycle (14–24): More signals, more speed, more noise
Longer cycle (36–64): Smoother entries, better for swing traders
Tip: If your signals feel too jittery, increase the cycle. If they lag too much, reduce it.
📉 SuperTrend: Your Trend Bias Compass
This isn’t your average SuperTrend. It adapts with RSI overlay logic and detects market “silence” via EMA compression— turning white right before the chaos . That said, you still control its aggression.
ATR Length = how many bars to average
ATR Factor = how tight or loose it hugs price
Lower = more sensitive (more trades, more noise)
Higher = confirmation only (fewer, but stronger signals)
Tweak until it feels like a sniper rifle.
No, you won’t get it perfect on the first try.
Yes, it’s worth it.
🛠️ Modular Signals: Why Things Fire (or Don’t)
Buy/Sell entries require conditions to align. The logic is modular, and that’s on purpose.
RSI signals only fire if RSI crosses its smoothed MA outside the dead zone and a “Watch” condition is active.
SuperTrend signals can be enabled to act on crossovers, optionally ignoring the Watch filter .
Watch conditions (colored squares) act as early recon and hint at possible upcoming trades.
Background color changes are “pre-signal warnings” and will repaint . Use them as leading signals, not gospel.
Want more trades? Loosen your filters .
Want sniper entries? Lock them down .
🌈 Candles and MAs: Visual Market Structure
Candles adapt in real-time to MA structure:
Green = bullish (above both fast/slow MAs)
Yellow = indecision (between)
Red = bearish (below both)
Buy/Sell signals override candles with bright orange and fuchsia —because subtlety doesn’t win wars .
You can also enable up to 8 customizable moving averages —great for confluence , trend confirmation , or just looking like a wizard .
🧠 Pro Usage Tips (TL;DR for Smart People):
Use tooltips in the settings menu —every toggle and slider is explained
Test timeframes until signal frequency and reliability match your goals
Adjust RSI cycle to reduce noise or speed up signals based on how frequently you trade
Tweak SuperTrend factor and ATR to fit volatility on your asset
Start with visual confirmation :
• Are watch signals lining up with trend zones?
• Are backgrounds firing before price moves?
• Are candle colors agreeing with signal direction?
📣 Alerts & Integration
Alerts are available for:
Buy/Sell entries (confirmed or advanced background)
Watch signals
Full band agreement (both Bollinger bands bullish or bearish)
Use these with webhook systems , bots , or your own trade journals .
Created by Sherlock Macgyver
Because sometimes the best trade…
is knowing exactly when not to take one.

Q Squeeze TrendQ Squeeze Trend
A sharp, signal-based trend tool that combines classic SuperTrend mechanics with configurable squeeze breakout logic and momentum confirmation. Built for clean entry points and minimalist charting — perfect for fast setups and real-time alerts.
🔧 Core Features
Configurable Squeeze Breakout Logic
• Detects low-volatility "squeeze" phases using customizable Bollinger Band vs. Keltner Channel logic
• Confirms breakouts only when momentum aligns with directional bias
SuperTrend Confirmation
• Filters noise and validates signals based on ATR-based trend logic
• Adds directional confidence before triggering signals
Alternating Signal Logic
• Ensures only one directional signal is active at a time
• Avoids repetitive entries and improves clarity
Clean Visual Feedback
• Directional arrows on confirmed buy/sell signals
• Optional colored fill between price and signal level
• Lightweight, non-intrusive label system
Real-Time Alerts
• Alerts for confirmed buy and sell setups
• Easy integration with webhooks, bots, or mobile notifications
⚙️ Configurable Inputs
• ATR Period & Multiplier – adjust SuperTrend sensitivity
• Squeeze Length, BB/KC Multipliers – fine-tune compression detection
• Signal Colors – customize arrow and background styling
✨ Highlights
• Designed for fast, visual trading with minimal clutter
• Non-repainting logic, effective across all timeframes
• Pairs well with structure, momentum, and volume strategies
📈 How to Use
• Enter on breakout arrows when trend, momentum, and squeeze align
• Use background fill to track current direction
• Exit on opposite signal, or combine with your own trade management logic
Sniper Core XT [Indicator Edition]🔫 SNIPER CORE XT — ZLEMA-Based Trend, Momentum & Volume Confirmation
⚙️ How It Works (What Makes It Unique):
Sniper Core XT is a precision crypto trading tool that visualizes real-time trend, momentum, volume, and volatility confirmation. Built from the ground up using Pine Script v5, it is optimized for semi-manual or alert-driven trading on the 1H timeframe.
Instead of relying on indicator mashups, Sniper Core XT builds its logic around the ZLEMA (Zero Lag Exponential Moving Average) trend engine, refined with strict momentum, volume, and volatility filters to highlight only high-probability trading opportunities.
🧠 Core Logic & Components:
ZLEMA Trend Engine:
Plots fast, slow, and signal ZLEMA lines to detect clean trend transitions with minimal lag, enabling early, reliable trend identification.
Vortex Direction & Strength Filter:
Confirms directional bias based on Vortex Indicator internals. Signals only activate when vortex strength exceeds a customizable threshold and aligns with ZLEMA trend.
Volume Confirmation via ZLEMA of Volume:
Uses adaptive volume confirmation, requiring current volume to exceed a ZLEMA-smoothed threshold to validate breakout moves.
Normalized Volatility-Adjusted Momentum Filter:
Measures momentum via a normalized, ATR-adjusted rate of change. Filters out low-momentum or exhausted moves before they trigger false signals.
Real-Time Take Profit Tracking:
Plots real-time TP1 and TP2 targets after entry. Visual labels confirm when TP1 or TP2 are hit, without relying on broker execution.
Non-Canvas Dashboard:
Includes a fully integrated live table showing:
Current Signal (Long, Short, None)
Entry Price
TP1/TP2 Status
Trend Direction
Bars Since Entry
Exit Signals for Trend Weakness:
Plots exit labels when trend strength fades or reverses, allowing traders to manually close positions with precision.
🧪 Indicator Use & Applications:
Designed for manual or semi-automated crypto trading
Ideal for trending pairs and medium-high volatility environments
Compatible with external bots through alerts (WunderTrading, PineConnector, 3Commas, etc.)
Suited for 1H timeframe, but adjustable
🛡️ Indicator Style:
Feature Value
Repainting ❌ Never
Cooldown Mechanism ✅ 1-Bar
TP1/TP2 Tracking ✅ Built-in
Alert Compatibility ✅ Full support
Recommended Timeframe 🕒 1H
Entry & Exit Labels ✅
⚠️ Disclaimer:
This indicator is for educational and informational purposes only. It does not constitute financial advice. Always practice proper risk management and confirm entries with your own analysis before executing trades.

SMC Entry Signals MTF v2📘 User Guide for the SMC Entry Signals MTF v2 Indicator
🎯 Purpose of the Indicator
This indicator is designed to identify reversal entry points based on Smart Money Concepts (SMC) and candlestick confirmation. It’s especially useful for traders who use:
Imbalance zones, order blocks, breaker blocks
Liquidity grabs
Multi-timeframe confirmation (MTF)
📈 How to Use the Signals on the Chart
✅ LONG Signal (green triangle below the candle):
Conditions:
Price is in a discount zone (below the FIB 50% level)
A bullish engulfing candle appears
A bullish Order Block (OB) or Breaker Block is detected
There’s an upward imbalance
A bullish OB is confirmed on the higher timeframe
➡️ How to act:
Consider entering long on the current or next candle.
Place your stop-loss below the OB or the nearest swing low.
Take profit at the nearest liquidity zone or premium area (above FIB 50%).
🔻 SHORT Signal (red triangle above the candle):
Conditions:
Price is in a premium zone (above FIB 50%)
A bearish engulfing candle appears
A bearish OB or Breaker Block is detected
There’s a downward imbalance
A bearish OB is confirmed on the higher timeframe
➡️ How to act:
Consider short entry after the signal.
Place your stop-loss above the OB or swing high.
Target the discount zone or the next liquidity pocket.
⚙️ Recommended Settings by Trading Style
Trading Style Suggested Settings Notes
Intraday (1–15m) fibLookback = 20–50, obLookback = 5–10, htf_tf = 1H/4H Fast signals. Use Discount/Premium + Engulfing.
Swing/Position (1H–1D) fibLookback = 50–100, obLookback = 10–20, htf_tf = 1D/1W Higher trust in MTF confirmation. Ideal with fundamentals.
Scalping (1m) fibLookback = 10–20, obLookback = 3–5, htf_tf = 15m/1H Remove Breaker and MTF for quick reaction trades.
🧠 Best Practices for Traders
Trend Filtering:
Use EMAs or volume to confirm the current trend.
Take longs only in uptrends, shorts in downtrends.
Liquidity Zones:
Use this indicator after liquidity grabs.
OBs and Breakers often appear right after stop hunts.
Combine with Manual Zones:
This works best when paired with manually drawn OBs and key levels.
Backtest the Signals:
Use Bar Replay mode on TradingView to test past signals.
🧪 Example Trade Setup
Example on BTCUSDT 15m:
Price drops into the discount zone.
A green triangle appears (bullish engulfing + OB + imbalance + HTF OB).
You enter long, stop below the OB, target the premium zone.
🎯 This type of setup often gives a risk/reward ratio of 1:2 or better — profitable even with a 40% win rate.
⏰ Alerts & Automation
Enable alerts:
"SMC Long Entry" — fires when a long signal appears.
"SMC Short Entry" — fires when a short signal appears.
You can integrate this with bots via webhook, like:
TradingConnector, 3Commas, Alertatron, etc.
✅ What This Indicator Gives You
High-probability entries using SMC logic
Customizable filters for entry logic
Multi-timeframe confirmation for stronger setups
Suitable for both intraday and swing trading

Aggregate PDH High Break Alert**Aggregate PDH High Break Alert**
**Overview**
The “Aggregate PDH High Break Alert” is a lightweight Pine Script v6 indicator designed to instantly notify you when today’s price breaks above any prior-day high in a user-defined lookback window. Instead of manually scanning dozens of daily highs, this script automatically loops through the last _N_ days (up to 100) and fires a single-bar alert the moment price eclipses a specific day’s high.
**Key Features**
- **Dynamic Lookback**: Choose any lookback period from 1 to 100 days via a single `High-Break Lookback` input.
- **Single Security Call**: Efficiently retrieves the entire daily-high series in one call to avoid TradingView’s 40-call security limit.
- **Automatic Looping**: Internally loops through each prior-day high, so there’s no need to manually code dozens of lines.
- **Custom Alerts**: Generates a clear, formatted alert message—e.g. “Crossed high from 7 day(s) ago”—for each breakout.
- **Lightweight & Maintainable**: Compact codebase (<15 lines) makes tweaking and debugging a breeze.
**Inputs**
- **High-Break Lookback (days)**: Number of past days to monitor for high breaks. Valid range: 1–100.
**How to Use**
1. **Add to Chart**: Open TradingView, click “Indicators,” then “Create,” and paste in the code.
2. **Configure Lookback**: In the script’s settings, set your desired lookback window (e.g., 20 for the past 20 days).
3. **Enable Alerts**: Right-click the indicator’s name on your chart, select “Add Alert on Aggregate PDH High Break Alert,” and choose “Once per bar close.”
4. **Receive Notifications**: Whenever price crosses above any of the specified prior-day highs, you’ll get an on-screen and/or mobile push alert with the exact number of days ago.
**Use Cases**
- **Trend Confirmation**: Confirm fresh bullish momentum when today’s high outpaces any of the last _N_ days.
- **Breakout Trading**: Automate entries off multi-day highs without manual chart scanning.
- **System Integration**: Integrate with alerts to trigger orders in third-party bots or webhook receivers.
**Disclaimer**
Breakouts alone do not guarantee sustained moves. Combine with your preferred risk management, volume filters, and other indicators for higher-probability setups. Use on markets and timeframes where daily breakout behavior aligns with your strategy.

Michael's EMA (Selectable TF) by Koenigsegg📌 Michael’s EMA (Selectable TF) by Koenigsegg
A multi-timeframe EMA crossover trend tool for clear market direction.
🔍 CORE LOGIC & PURPOSE
This indicator visualizes the trend based on two Exponential Moving Averages (EMAs) — fast and slow — from a user-defined timeframe.
Referencing a higher timeframe strengthens the trend signal and reduces the noise from short-term volatility.
Perfect for traders seeking cleaner entries and exits , especially those who get faked out by lower timeframe chop.
✅ KEY FEATURES
1. Multi-Timeframe EMA Calculation
- Fetches EMAs from any timeframe using `request.security()`.
- Selecting a higher timeframe makes signals more meaningful and decisive .
2. Customizable EMAs
- Small EMA (default: 12) and Big EMA (default: 21).
- Clear logic:
- Uptrend = Small EMA ≥ Big EMA
- Downtrend = Small EMA < Big EMA
3. Dynamic Trend Coloring
- EMAs change color based on the trend:
- Uptrend: Green (customizable)
- Downtrend: Red (customizable)
4. Crossover Detection & Arrows
- Clean visual arrows on trend flips only.
- Optional visibility, customizable size & color.
- Built with a debounce mechanic to avoid spam signals.
5. Built-In Alerts
- Trend Up Alert when fast EMA crosses above slow EMA.
- Trend Down Alert when fast EMA crosses below slow EMA.
- Compatible with automation, bots, and manual strategies.
⚠️ PRO TIP
Using a higher timeframe (e.g., 1H on a 15m chart, or 15m on a 5m chart as visually represented on the chart) makes trend flips more decisive and reliable, helping you avoid being faked out by short-term volatility. When the higher TF flips red — that’s your true trend shift, not just noise.
🏷️ HASHTAGS
#EMA #MovingAverage #MultiTimeframe #TrendIndicator #TradingViewScript #TradingTools
#TechnicalAnalysis #PriceAction #ForexTrader #CryptoTrader #StockTrader
#AlgoTrading #TrendFlip #SmartMoney #SwingTrading #DayTrading #MarketStructure #TradingEdge #ProfMichaelG #Koenigsegg #Bitcoin
⚠️ DISCLAIMER
This script is provided for educational and informational purposes only .
It does not constitute financial advice , investment advice, or a recommendation to buy or sell any financial instruments.
Always do your own research and consult with a licensed financial advisor before making any trading decisions.
Use this tool at your own risk.

Signal Indicator + SAR + 30min Trend Background🔹 BTC/USD 3-Minute Trend Signal Indicator + SAR + 30-Minute Background Trend
📌 Overview
This indicator is designed for high-precision BTC/USD trading on the 3-minute timeframe. It integrates multiple trend confirmation tools to improve signal accuracy, reduce false entries, and help traders align with higher timeframe trends.
⚡ Key Features & Enhancements
✅ Multi-Timeframe Trend Confirmation:
Uses 3-minute EMA trend filter + 30-minute EMA confirmation.
Background color changes dynamically based on 30-minute trend.
✅ Smart Parabolic SAR Filter (Optional):
Reduces false signals with an adjustable confirmation delay.
Helps avoid premature exits in strong trends.
✅ Momentum & Trend Strength Analysis:
Uses MACD for directional confirmation.
RSI filtering to avoid overbought/oversold conditions.
ADX filter ensures trades are taken in strong trends.
✅ Breakout Confirmation & Heikin-Ashi Filtering:
Detects breakouts from key resistance & support levels.
Uses Heikin-Ashi candle trend confirmation for smoother signals.
✅ Bollinger Bands Trend Validation:
Filters trades based on price position relative to Bollinger Bands.
Avoids choppy market conditions.
✅ Session Time Filtering:
Limits trades to high-liquidity trading hours (9 AM - 8 PM UTC).
✅ BUY/SELL Alerts & Labels:
Displays BUY/SELL labels on the chart when conditions are met.
TradingView Alerts for automated bot integration.
🛠️ How It Works
1️⃣ Trend Confirmation
Short-term (3-min) trend: Calculated using EMA(20).
Higher timeframe (30-min) trend: Acts as a filter (optional background color).
Valid BUY/SELL signals must align with the higher timeframe trend.
2️⃣ Entry Signals (BUY & SELL Conditions)
🚀 BUY Signal
Price breaks above resistance (last 20 candles).
MACD bullish crossover.
EMA Trend + Higher TF EMA confirms uptrend.
Bollinger Bands validation (trading above mid-band).
SAR confirms uptrend (optional).
Heikin-Ashi trend aligns bullish.
ADX > 20 (ensures strong trend).
Time filter active (9 AM - 8 PM UTC).
🔻 SELL Signal
Price breaks below support (last 20 candles).
MACD bearish crossover.
EMA Trend + Higher TF EMA confirms downtrend.
Bollinger Bands validation (trading below mid-band).
SAR confirms downtrend (optional).
Heikin-Ashi trend aligns bearish.
ADX > 20 (ensures strong trend).
Time filter active (9 AM - 8 PM UTC).
3️⃣ Alerts & Labels
BUY alert triggers 🚀 when all conditions align.
SELL alert triggers 🔻 when all conditions align.
Labels appear on the chart to indicate signals.
⚙️ Customization & Settings
🔧 User-Configurable Options:
Parabolic SAR filter (optional).
SAR confirmation delay (prevents false exits).
Background trend color from 30-min timeframe.
Adjustable background opacity for better visibility.
Trading session filter (to avoid low-volume periods).
📊 Best Use Cases
✅ Scalping BTC/USD on a 3-minute chart.
✅ Trend-following strategy with multiple confirmations.
✅ Reducing false signals with multi-indicator validation.
✅ Automated trading (TradingView alerts integration).
⚠️ Disclaimer
📌 This indicator is for educational purposes only and should not be considered financial advice.
📌 Always backtest and validate the strategy before using it for live trading.
📌 Past performance does not guarantee future results.
💬 How to Use?
1️⃣ Add the indicator to your 3-minute BTC/USD chart.
2️⃣ Enable/disable filters based on your trading style.
3️⃣ Set alerts for automated notifications.
4️⃣ Follow trend confirmations before entering trades.

Advanced HFT Detection with VWAP & SpreadsExplanation of the HFT Detection Strategy
🔹 1. Key Indicators Used in the Strategy
It's works by combining VWAP, moving averages (SMA), volume spikes, and price jumps to detect potential HFT activity.
✅ (A) VWAP (Volume Weighted Average Price)
VWAP acts as a benchmark price that professional traders and institutions use to execute large orders.
If price is above VWAP, buyers are in control → Bullish trend
If price is below VWAP, sellers are in control → Bearish trend
HFT algorithms often place buy orders above VWAP and sell orders below VWAP to follow momentum.
➡️ Why VWAP? It ensures that signals follow the institutional trading trend.
✅ (B) Moving Averages (SMA)
Moving averages smooth out price data and help in detecting short-term momentum changes.
Fast Moving Average (5-period SMA): Reacts quickly to price changes
Slow Moving Average (20-period SMA): Identifies trend direction
➡️ Why SMA? It filters noise and confirms short-term trend shifts.
✅ (C) Volume Spike Detection
High-frequency trading is often accompanied by large volume surges. We define a volume spike as:
📌 Current Volume > 2× Average Volume of last 20 bars
➡️ Why Volume? HFTs execute rapid buy/sell orders when they detect liquidity, leading to sudden volume bursts.
✅ (D) Price Jump Detection (Sudden Volatility)
HFT algorithms often exploit quick price movements. We check if the price has moved more than twice the ATR (Average True Range) in the last 5 bars.
➡️ Why ATR? It helps to detect abnormal price movements compared to normal volatility.
🔹 2. Trading Signal Logic
Now that we have VWAP, moving averages, volume, and price movement filters, we generate buy and sell signals based on conditions.
✅ (A) Buy Signal Condition
A BUY signal is triggered when:
✔ Fast SMA crosses above Slow SMA → Short-term trend is turning bullish
✔ Volume spike occurs → HFTs are active
✔ Sudden price jump detected → High volatility
✔ Price is above VWAP → Confirms bullish trend
➡️ Why this works? It confirms that institutional traders & HFTs are buying aggressively.
✅ (B) Sell Signal Condition
A SELL signal is triggered when:
✔ Fast SMA crosses below Slow SMA → Short-term trend is turning bearish
✔ Volume spike occurs → HFTs are selling aggressively
✔ Sudden price drop detected → High volatility
✔ Price is below VWAP → Confirms bearish trend
➡️ Why this works? It confirms that institutional traders & HFTs are selling aggressively.
🔹 3. Visual Representation (Plotting Signals & VWAP)
Once we detect buy and sell signals, we mark them on the chart.
✅ (A) Buy/Sell Markers
🟢 Buy → Green upward arrow below the candle
🔴 Sell → Red downward arrow above the candle
✅ (B) VWAP Line on Chart
We also plot VWAP as a blue line to visualize trend direction.
✅ (C) Highlighting Volume Spikes
To easily spot HFT activity, we highlight volume spike bars with a blue background.
🔹 4. How to Use This Strategy?
1️⃣ Apply this script on a 1-minute or 5-minute intraday chart.
2️⃣ Look for BUY signals above VWAP and SELL signals below VWAP.
3️⃣ Verify that the volume spikes before taking action.
4️⃣ Use stop-loss & risk management (e.g., stop-loss at recent low/high).
🚀 Summary: Why This Strategy Works?
✅ VWAP ensures we follow institutional traders
✅ Volume spikes confirm sudden liquidity inflows
✅ Price jumps detect fast market moves caused by HFT bots
✅ Moving averages smooth out short-term trend shifts
BB Session RangesBB Session Ranges Indicator
Overview
The Bender Bot Session Ranges indicator is a powerful tool for traders who want to visualize and analyze important market sessions throughout the trading day. This indicator identifies and tracks price ranges during specific time periods, helping you spot potential trading opportunities based on session breakouts, retests, and range comparisons.
Key Features
• Multiple Session Tracking: Monitor up to 6 different time-based ranges simultaneously (pre-configured for NY AM Open, NY PM Open, Lunch, Premarket, Midnight Open, and a custom session).
• Range Visualization: Clearly displays high and low boundaries for each session with customizable colors and line styles.
• Historical Comparison: Tracks and displays the average size of ranges over time, helping you identify when current ranges are larger or smaller than typical.
• Flexible Time Settings: Easily configure exact session times based on your trading schedule and preferred markets.
• Range Extension Options: Extend range boundaries by bars, days, or weeks to track the longer-term influence of session ranges.
• Sidecar Information Display: Optional labels show range details, including size, percentage of average, and dollar value.
How It Works
The indicator identifies specific time-based sessions (for example, the first 5 minutes of the NY market open) and tracks the high and low prices established during these periods. Once a session is complete, the range boundaries are plotted on your chart and can be extended for further analysis. The indicator calculates the current range size and compares it to historical averages, giving you context for the day’s market behavior.
Sidecar Functionality
The sidecar feature is a key aspect of this indicator that helps keep your charts clean and organized. Instead of cluttering your price action with labels and annotations directly on the ranges, the sidecar system:
• Creates a dedicated information panel offset from the price action.
• Connects to ranges with discreet connecting lines.
• Displays key statistics like range size, dollar value, and percentage of average.
• Can be positioned at custom distances from the main chart (measured in bars).
• Allows you to see important data without interfering with your price analysis.
• Can be completely disabled when you prefer minimal chart elements.
• Helps maintain visual clarity even when tracking multiple sessions simultaneously.
This design philosophy puts trader experience first by separating information display from price action analysis, giving you the best of both worlds: clean charts and detailed information.
Setup Guide
1. Choose Your Sessions: Enable or disable each of the six available ranges by setting the Max Ranges to Plot parameter (use 0 to disable a range).
2. Configure Session Times: Set exact times for each range using standard 24-hour format (for example, 0930-0935 for 9:30-9:35 AM).
3. Customize Display: Select colors, line widths, and information display options for each range.
4. Set Extension Parameters: Choose how far to extend range lines (by a number of bars, days, or weeks, or select Always for continuous extension).
5. Configure Sidecar Labels: Set the offset for the information displays (use 0 to disable sidecar labels entirely).
Trading Applications
• Identify potential support and resistance levels based on session highs and lows.
• Compare current session ranges to historical averages to gauge volatility.
• Look for breakouts from established session ranges.
• Use range extensions to anticipate potential price targets.
• Monitor multiple session ranges to identify pattern correlations.
Advanced Usage
The indicator includes fields that help you assess range size relative to past performance, including dollar value calculations. This can be particularly useful for position sizing and risk management when trading breakouts from these ranges.
Future Development
We’re actively working on expanding this indicator to include robust strategy and alert functionality. This will allow traders to:
• Backtest trading strategies based on session range breakouts and retests.
• Customize entry, exit, and risk management parameters.
• Receive real-time alerts when price interacts with significant range levels.
• Set conditional alerts based on range size compared to historical averages.
• Automate trading decisions based on your specific session-based criteria.
If these strategy and alert features would be valuable for your trading, please let us know in the comments. Your feedback directly influences our development priorities and helps us create tools that best serve the trading community.
Notes
• All times are based on the America/New_York timezone.
• The indicator dynamically adjusts to different timeframes, providing consistent results whether you’re viewing 1-minute or daily charts.
• Range calculations are based on the highs and lows established during the defined sessions.
UT Bot Alerts – Time Filtered with ExitsThis indicator combines several technical approaches to generate precise entry and exit signals, while incorporating time filters that ensure signals are sent only during desired time windows and with defined cooldown periods. It is based on the original idea by QuantNomad.
Main Components:
ATR-based Trailing Stop:
Using the Average True Range (ATR) and an adjustable multiplier ("Key Value"), a dynamic trailing stop is calculated that adapts to the current price. This trailing stop forms the basis for the signal generation.
EMA-based Entry Signals:
A very short exponential moving average (EMA, period 1) is used in combination with the trailing stop to identify clear buy (long) and sell (short) signals via crossovers. An additional buffer zone helps reduce false signals.
Persistent Trade State:
The current state (long, short, or neutral) is maintained so that the system remains in the trend until a new signal is generated.
Linear Regression as Reference:
A linear regression line computed over a defined period serves as a reference for determining exit levels.
Exit Signals with Delay:
Exit signals are generated when the price deviates from the linear regression line by a defined percentage (Exit Signal Deviation) and the condition persists for at least a specified number of bars (Exit Signal Delay). Only one exit signal is issued per trade to avoid excessive exits.
Time Filters and Cooldown:
Session Filter: A user-defined session (e.g., "2200-0500") can disable signals during specified periods.
Cooldown Period: After a signal is triggered, a cooldown phase (in minutes) can be set during which no new signals are sent.
Visual Display and Alerts:
Entry Signals: Buy and sell signals are displayed as labels (green for long, red for short).
Exit Signals: Exit signals appear as triangles, with the exit long signal text displayed in white.
Reference Lines:
The upper exit level (Exit Short Level) is drawn as a solid line in turquoise (color.aqua).
The lower exit level (Exit Long Level) is drawn as a solid line in yellow.
Additionally, the ATR trailing stop and the linear regression line are clearly plotted on the chart.
Alerts can be configured for all signal types.
In Summary:
The indicator delivers precise entry signals based on an ATR trailing stop and a short EMA, supplemented by dynamic exit levels determined via linear regression. With integrated time filters (session and cooldown) and a flexible exit mechanism, this indicator offers controlled trade management—ideal for traders who wish to receive signals only during desired time periods.
Original Author: QuantNomad

ICT Unicorn Breaker + FVG Alert📌 How to Use the ICT Breaker Block Indicator
The ICT Breaker Block Indicator helps you spot potential trade opportunities by setting up alerts. Here’s how to get started:
1️⃣ Draw Your Breaker Block
First, find a Bullish or Bearish Breaker Block on your chart.
Bullish Breaker Block: This forms when a bearish order block doesn't hold, and price breaks through to the upside. This indicates a shift from a bearish to a bullish market, with the previous bearish order block now acting as support.
Bearish Breaker Block: This forms when a bullish order block fails to hold, and price breaks through to the downside. This indicates a shift from a bullish to a bearish market, with the previous bullish order block now acting as resistance.
Use the drawing tool to mark the Breaker Block on your chart.
2️⃣ Set Your Entry & Stop Levels
Entry: For a bullish trade, enter at the top of the Breaker Block; for a bearish trade, enter at the bottom.
Stop Loss: Place this on the opposite side of the Breaker Block.
3️⃣ Choose Your Trade Direction
Bullish setup: Choose Buy for a bullish Breaker Block (upward break).
Bearish setup: Choose Sell for a bearish Breaker Block (downward break).
4️⃣ Create Two Alerts
You’ll need to set up the following two alerts in order:
✅ Unicorn Alert (Once Per Bar Close): Set this alert first for your selected Breaker Block (Bullish or Bearish). It triggers when price closes above the entry level (for a bullish setup) or below the entry level (for a bearish setup), and checks for bullish or bearish unmitigated Fair Value Gaps (FVGs) that overlap within the Breaker Block.
✅ Terminus Alert (Triggered Once): Once the Unicorn alert has been triggered, change the alert to a Terminus Alert. This alert is activated once the TP (terminus) is hit before the limit order fills from the Unicorn alert signal.
5️⃣ Automate with Webhook (Optional)
Want to automate your trades? Simply enter your Trader Post Webhook URL in the alert settings to send signals directly to your trading bot! 🤖
