Volatility Cone Forecaster Lite [PhenLabs]📊 Volatility Cone Forecaster
Version: PineScript™v6
📌Description
The Volatility Cone Forecaster (VCF) is an advanced indicator designed to provide traders with a forward-looking perspective on market volatility. Instead of merely measuring past price fluctuations, the VCF analyzes historical volatility data to project a statistical “cone” that outlines a probable range for future price movements. Its core purpose is to contextualize the current market environment, helping traders to anticipate potential shifts from low to high volatility periods (and vice versa). By identifying whether volatility is expanding or contracting relative to historical norms, it solves the critical problem of preparing for significant market moves before they happen, offering a clear statistical edge in strategy development.
This indicator moves beyond lagging measures by employing percentile analysis to rank the current volatility state. This allows traders to understand not just what volatility is, but how significant it is compared to the recent past. The VCF is built for discretionary traders, system developers, and options strategists who need a sophisticated understanding of market dynamics to manage risk and identify high-probability opportunities.
🚀Points of Innovation
Forward-Looking Volatility Projection: Unlike standard indicators that only show historical data, the VCF projects a statistical cone of future volatility.
Percentile-Based Regime Analysis: Ranks current volatility against historical data (e.g., 90th, 75th percentiles) to provide objective context.
Automated Regime Detection: Automatically identifies and labels the market as being in a ‘High’, ‘Low’, or ‘Normal’ volatility regime.
Expansion & Contraction Signals: Clearly indicates whether volatility is currently increasing or decreasing, signaling shifts in market energy.
Integrated ATR Comparison: Plots an ATR-equivalent volatility measure to offer a familiar point of reference against the statistical model.
Dynamic Visual Modeling: The cone visualization directly on the price chart provides an intuitive guide for future expected price ranges.
🔧Core Components
Realized Volatility Engine: Calculates historical volatility using log returns over multiple user-defined lookback periods (short, medium, long) for a comprehensive view.
Percentile Analysis Module: A custom function calculates the 10th, 25th, 50th, 75th, and 90th percentiles of volatility over a long-term lookback (e.g., 252 days).
Forward Projection Calculator: Uses the calculated volatility percentiles to mathematically derive and draw the upper and lower bounds of the future volatility cone.
Volatility Regime Classifier: A logic-based system that compares current volatility to the historical percentile bands to classify the market state.
🔥Key Features
Customizable Lookback Periods: Adjust short, medium, and long-term lookbacks to fine-tune the indicator’s sensitivity to different market cycles.
Configurable Forward Projection: Set the number of days for the forward cone projection to align with your specific trading horizon.
Interactive Display Options: Toggle visibility for percentile labels, ATR levels, and regime coloring to customize the chart display.
Data-Rich Information Table: A clean, on-screen table displays all key metrics, including current volatility, percentile rank, regime, and trend.
Built-in Alert Conditions: Set alerts for critical events like volatility crossing the 90th percentile, dropping below the 10th, or switching between expansion and contraction.
🎨Visualization
Volatility Cone: Shaded bands projected onto the future price axis, representing the probable price range at different statistical confidence levels (e.g., 75th-90th percentile).
Color-Coded Volatility Line: The primary volatility plot dynamically changes color (e.g., red for high, green for low) to reflect the current volatility regime, providing instant context.
Historical Percentile Bands: Horizontal lines plotted across the indicator pane mark the key percentile levels, showing how current volatility compares to the past.
On-Chart Labels: Clear labels automatically display the current volatility reading, its percentile rank, the detected regime, and trend (Expanding/Contracting).
📖Usage Guidelines
Setting Categories
Short-term Lookback: Default: 10, Range: 5-50. Controls the most sensitive volatility calculation.
Medium-term Lookback: Default: 21, Range: 10-100. The primary input for the current volatility reading.
Long-term Lookback: Default: 63, Range: 30-252. Provides a baseline for long-term market character.
Percentile Lookback Period: Default: 252, Range: 100-1000. Defines the period for historical ranking; 252 represents one trading year.
Forward Projection Days: Default: 21, Range: 5-63. Determines how many bars into the future the cone is projected.
✅Best Use Cases
Breakout Trading: Identify periods of deep consolidation when volatility falls to low percentile ranks (e.g., below 25th) and begins to expand, signaling a potential breakout.
Mean Reversion Strategies: Target trades when volatility reaches extreme high percentile ranks (e.g., above 90th), as these periods are often unsustainable and lead to contraction.
Options Strategy: Use the cone’s projected upper and lower bounds to help select strike prices for strategies like iron condors or straddles.
Risk Management: Widen stop-losses and reduce position sizes when the indicator signals a transition into a ‘High’ volatility regime.
⚠️Limitations
Probabilistic, Not Predictive: The cone represents a statistical probability, not a guarantee of future price action. Extreme, unpredictable news events can drive prices outside the cone.
Lagging by Nature: All calculations are based on historical price data, meaning the indicator will always react to, not pre-empt, market changes.
Non-Directional: The indicator forecasts the *magnitude* of future moves, not the *direction*. It should be paired with a directional analysis tool.
💡What Makes This Unique
Forward Projection: Its primary distinction is projecting a data-driven, statistical forecast of future volatility, which standard oscillators do not do.
Contextual Analysis: It doesn’t just provide a number; it tells you what that number means through percentile ranking and automated regime classification.
🔬How It Works
1. Data Calculation:
The indicator first calculates the logarithmic returns of the asset’s price. It then computes the annualized standard deviation of these returns over short, medium, and long-term lookback periods to generate realized volatility readings.
2. Percentile Ranking:
Using a 252-day lookback, it analyzes the history of the medium-term volatility and determines the values that correspond to the 10th, 25th, 50th, 75th, and 90th percentiles. This builds a statistical map of the asset’s volatility behavior.
3. Cone Projection:
Finally, it takes these historical percentile values and projects them forward in time, calculating the potential upper and lower price bounds based on what would happen if volatility were to run at those levels over the next 21 days.
💡Note:
The Volatility Cone Forecaster is most effective on daily and weekly charts where statistical volatility models are more reliable. For lower timeframes, consider shortening the lookback periods. Always use this indicator as part of a comprehensive trading plan that includes other forms of analysis.
Search in scripts for "break"

Stacey Burke Signal Day LTE“Previously published as ‘Day Zero Fakeout Detector MTF’”
Stacey Burke Signal Day LTE
Automatic detection of Day Zero, Inside Days, and Outside Days for Stacey Burke’s intraday playbook
🔎 Stacey Burke’s Signal Days
This indicator highlights the key daily patterns that often lead to high-probability intraday setups in Stacey Burke’s methodology:
1️⃣ Day Zero
The reset days within a 3-day cycle (e.g. breakout → continuation → exhaustion/reversal).
Can mark the beginning of a new directional phase.
Trades back inside the prior range after a Peak Formation High (PFH) or Peak Formation Low (PFL).
Bias: Look for measured parabolic session moves. When combined with trend following indicators, these signal days can be very powerful.
2️⃣ Inside Day
A day where the entire range is contained within the prior day’s range.
Signals consolidation and energy build-up.
Often leads to explosive breakouts in the next session.
Bias: Trade breakouts of the inside day’s high/low or breakout reversal in the session at key timings in the direction of higher timeframe bias. When combined with trend following indicators, these signal days can be very powerful.
3️⃣ Outside Day (Engulfing Day)
`
A day where the range is larger than the prior day’s range, engulfing both high and low.
Marks trapped traders and fakeouts on both sides.
Often precedes strong continuations or sharp reversals from outside of the ranges.
Bias: Align trades with the true continuation move. When combined with trend following indicators, these signal days can be very powerful.
📌 How They Work Together
Day Zero → Signals the new cycle after PFH/PFL.
Inside Day → Signals compression → expect breakout setups.
Outside Day → Signals exhaustion/fakeouts → expect reversals or continuations.
Together, they give traders a clear daily roadmap for where liquidity sits and when to expect the highest-probability setups.
✅ Example in Practice
Market rallies for 3 days → PFH forms → Day Zero short bias.
Next day prints an Inside Day → watch for breakout continuation short, and breakout reversals.
Later, an Outside Day traps both longs and shorts → the following session offers a clean intraday reversal or continuation trade in line with the underlying MTF trend/bias.
⚙️ Features of This Indicator
Automatic detection of Day Zero, Inside Days, and Outside Days
Multi-Timeframe (MTF) support for cycle alignment
Visual markers for PFH/PFL and consolidation zones
Measured move projections for breakout targets
👉 Stacey Burke Signal Day LTE gives traders just a few of the most important signal days — Day Zero, Inside Day, and Outside Day — to structure their intraday trades around fake outs, breakouts, and reversals within the daily cycles of the week. (This is work in progress: Next up, FRD/FGD's, 3-day cycle detecting, 3DLs, 3DSs).

Peak Reversal v3# Peak Reversal v3
## Summary
Peak Reversal v3 adds new configurability, clearer visuals, and a faster trader workflow. The release introduces a new Squeeze Detector , expanded Keltner Channels , and streamlined Momentum signals , with no repaints and improved performance. The menus have been reorganized and simplified. Color swatches have been added for better customization. All other colors will be derived from these swatches.
## Highlights
New Squeeze Detector to mark low-volatility periods and prepare for breakouts.
New: Bands are now fully configurable with independent MA length, ATR length, and multipliers.
Five moving average bases for bands: EMA (from v2), SMA, RMA, VMA, HMA.
Simplified color system: three swatches drive candles, on-chart marks, and band fill.
Reorganized menu with focused sections and tooltips for each parameter making the entire trader experience more intuitive.
No repaints and faster performance across calculations.
## Overview
Configuration : Pick from three color swatches and apply them to candles, plotted characters, and band fill for consistent chart context. Use the reorganized menu to reach Keltner settings, momentum signals, and squeeze detection without extra clicks; tooltips clarify each input.
Bands and averages: Choose the band basis from EMA, SMA, RMA, VMA, or HMA to match your strategy. Configure two bands independently by setting MA length, ATR length, and band multipliers for the inner and outer envelopes.
Signals : Select the band responsible for momentum signals. Choose wick or close as the price source for entries and exits. Control the window for extreme momentum with “Max Momentum Bars,” a setting now exposed in v3 for direct tuning.
Squeeze detection : The Squeeze Detector normalizes band width and uses percentile ranking to highlight volatility compression. When the market falls below a user-defined threshold, the indicator colors the region with a gradient to signal potential expansion.
## Details about major features and changes
### New
Squeeze Detector to highlight low-volatility conditions.
Five MA bases for bands: EMA, SMA, RMA, VMA, HMA.
“Max Momentum Bars” to cap the bars used for extreme momentum.
### Keltner channel improvements
Refactored Keltner settings for flexible inner and outer band control.
MA type selection added; band calculations updated for consistency.
Removed the third Keltner band to reduce noise and simplify setup.
### Display and signals
Gradient fills for band breakouts, mean deviations, and squeeze periods.
“Show Mean EMA?” set to true and default “Signal Band” set to “Inner.”
Clearer tooltips and input descriptions.
### Reliability and performance
No more repaints. The indicator waits for confirmation before drawing occurs.
Faster execution through targeted refactors.
All algorithms have been reviewed and now use a consistent logic, naming, and structure.

Advanced Range Analyzer ProAdvanced Range Analyzer Pro – Adaptive Range Detection & Breakout Forecasting
Overview
Advanced Range Analyzer Pro is a comprehensive trading tool designed to help traders identify consolidations, evaluate their strength, and forecast potential breakout direction. By combining volatility-adjusted thresholds, volume distribution analysis, and historical breakout behavior, the indicator builds an adaptive framework for navigating sideways price action. Instead of treating ranges as noise, this system transforms them into opportunities for mean reversion or breakout trading.
How It Works
The indicator continuously scans price action to identify active range environments. Ranges are defined by volatility compression, repeated boundary interactions, and clustering of volume near equilibrium. Once detected, the indicator assigns a strength score (0–100), which quantifies how well-defined and compressed the consolidation is.
Breakout probabilities are then calculated by factoring in:
Relative time spent near the upper vs. lower range boundaries
Historical breakout tendencies for similar structures
Volume distribution inside the range
Momentum alignment using auxiliary filters (RSI/MACD)
This creates a live probability forecast that updates as price evolves. The tool also supports range memory, allowing traders to analyze the last completed range after a breakout has occurred. A dynamic strength meter is displayed directly above each consolidation range, providing real-time insight into range compression and breakout potential.
Signals and Breakouts
Advanced Range Analyzer Pro includes a structured set of visual tools to highlight actionable conditions:
Range Zones – Gradient-filled boxes highlight active consolidations.
Strength Meter – A live score displayed in the dashboard quantifies compression.
Breakout Labels – Probability percentages show bias toward bullish or bearish continuation.
Breakout Highlights – When a breakout occurs, the range is marked with directional confirmation.
Dashboard Table – Displays current status, strength, live/last range mode, and probabilities.
These elements update in real time, ensuring that traders always see the current state of consolidation and breakout risk.
Interpretation
Range Strength : High scores (70–100) indicate strong consolidations likely to resolve explosively, while low scores suggest weak or choppy ranges prone to false signals.
Breakout Probability : Directional bias greater than 60% suggests meaningful breakout pressure. Equal probabilities indicate balanced compression, favoring mean-reversion strategies.
Market Context : Ranges aligned with higher timeframe trends often resolve in the dominant direction, while counter-trend ranges may lead to reversals or liquidity sweeps.
Volatility Insight : Tight ranges with low ATR imply imminent expansion; wide ranges signal extended consolidation or distribution phases.
Strategy Integration
Advanced Range Analyzer Pro can be applied across multiple trading styles:
Breakout Trading : Enter on probability shifts above 60% with confirmation of volume or momentum.
Mean Reversion : Trade inside ranges with high strength scores by fading boundaries and targeting equilibrium.
Trend Continuation : Focus on ranges that form mid-trend, anticipating continuation after consolidation.
Liquidity Sweeps : Use failed breakouts at boundaries to capture reversals.
Multi-Timeframe : Apply on higher timeframes to frame market context, then execute on lower timeframes.
Advanced Techniques
Combine with volume profiles to identify areas of institutional positioning within ranges.
Track sequences of strong consolidations for trend development or exhaustion signals.
Use breakout probability shifts in conjunction with order flow or momentum indicators to refine entries.
Monitor expanding/contracting range widths to anticipate volatility cycles.
Custom parameters allow fine-tuning sensitivity for different assets (crypto, forex, equities) and trading styles (scalping, intraday, swing).
Inputs and Customization
Range Detection Sensitivity : Controls how strictly ranges are defined.
Strength Score Settings : Adjust weighting of compression, volume, and breakout memory.
Probability Forecasting : Enable/disable directional bias and thresholds.
Gradient & Fill Options : Customize range visualization colors and opacity.
Dashboard Display : Toggle live vs last range, info table size, and position.
Breakout Highlighting : Choose border/zone emphasis on breakout events.
Why Use Advanced Range Analyzer Pro
This indicator provides a data-driven approach to trading consolidation phases, one of the most common yet underutilized market states. By quantifying range strength, mapping probability forecasts, and visually presenting risk zones, it transforms uncertainty into clarity.
Whether you’re trading breakouts, fading ranges, or mapping higher timeframe context, Advanced Range Analyzer Pro delivers a structured, adaptive framework that integrates seamlessly into multiple strategies.

Smart Bar Coloring: Tight Closes & Volume BreakoutsAdvanced Bar Coloring Indicator for Price Action and Volume Analysis
This sophisticated indicator automatically colors price bars based on two key market conditions: tight closing ranges and significant volume activity, helping traders quickly identify consolidation periods and potential breakout setups.
Key Features:
Tight Close Detection:
ATR-Based Analysis: Uses 14-period ATR to define "tight" price movement
Dual-Bar Confirmation: Requires both current and previous bar to have closing ranges ≤ 20% of ATR
Consolidation Identification: Highlights periods of reduced volatility that often precede significant moves
Customizable Color: Default amber/orange highlighting for easy visual identification
Volume Breakout Detection:
Multi-Criteria Volume Analysis: Triggers when volume exceeds any of three thresholds:
150% of 20-period volume SMA
150% of recent 3-bar average volume
150% of 50-period volume SMA
Price Action Filter: Requires bullish price action (close > previous close OR close in upper 75% of range)
Smart Volume Handling: Automatically detects and works only with instruments that have volume data
Customizable Color: Default teal highlighting for volume-driven moves
Technical Analysis Applications:
Consolidation Patterns: Identify tight trading ranges before potential breakouts
Volume Confirmation: Spot high-volume moves with supportive price action
Entry Timing: Use tight closes to identify potential accumulation zones
Breakout Validation: Volume-colored bars confirm legitimate breakout attempts
Risk Management: Tight closes often indicate lower immediate volatility
How to Use:
Amber/Orange Bars: Indicate tight closing ranges - potential accumulation or consolidation
Teal Bars: Show significant volume with bullish price action - potential breakout confirmation
Normal Bars: Standard market conditions without special highlighting
Pattern Recognition: Look for clusters of tight closes followed by volume breakouts
Technical Requirements:
Works on any timeframe
Automatically adapts to instruments with or without volume data
Compatible with all chart types and drawing tools

CleanBreak Lines (Break + First Retest)CleanBreak lines draws one robust support line (green) from swing lows and one robust resistance line (red) from swing highs, then optionally signals a confirmed break and the first clean retest back to that line. Lines are scored with a transparent W-Score (0–100) so traders can judge quality at a glance. The script is non-repainting and uses only confirmed bar data.
What it does
Auto-builds two trendlines that aim to represent meaningful support and resistance.
Uses a median-based slope so outliers and single spikes do not distort the line.
Computes a W-Score per line from three things: touches, span (how long it held), and respect (staying on the correct side).
Optionally triggers a single, tightly-gated signal on Break + First Retest.
How it works (plain English)
Detect recent swing highs and swing lows.
Fit one line through highs and one through lows using a robust, median-style slope estimate.
Score each line: more clean touches and longer span raise the W-Score; frequent violations lower it.
A break requires a candle close beyond the line by a small ATR margin.
A first retest requires price to come back to the line within a limited number of bars and hold on close.
A single arrow may print on that confirmed retest, with optional alerts.
What it is not
Not a prediction model and not a promises-of-profit tool.
Not a multi-signal spammer: by design it aims to allow one retest entry per break.
Not a regression channel or machine-learning system.
How to use
At a glance: treat the green line as candidate support and the red line as candidate resistance.
Conservative approach: wait for a break on close and then the first retest to hold; use the arrow as a prompt, not a command.
Context-only mode: hide arrows in Style if you want the lines and W-Score only.
Inputs (brief)
Core: Swing Length, Max Pivots, Min Touches, Min Span Bars.
Scoring: Touches Max (cap), Weights for touches vs span, Min W-Score to arm.
Break and Retest: Break Margin x ATR, Retest Tolerance x ATR, Retest Window (bars).
Visuals: Show Labels, Show Table, Line Width, Fade When Refit.
Recommended presets
Cleaner, fewer signals: Min Touches 4–5, Min Span Bars 100–150, Min W-Score 70–80, Break Margin 0.40–0.60 ATR, Retest Tolerance 0.10–0.15 ATR, Retest Window 8–12 bars.
Lines-only: keep defaults and uncheck the two plotshapes in Style.
Alerts
CB Long Retest: break above the red line and first retest holds.
CB Short Retest: break below the green line and first retest holds.
Use “Once per bar close” for consistency.
On-chart table (if enabled)
RES / SUP: W-Score and distance from price in ATR terms.
Status: “Waiting Long RT”, “Waiting Short RT”, or “Idle”.
Thresholds: MinScore and Retest bars for quick context.
Timeframes
Works well on 1h to 1D. On very low timeframes, raise Break Margin x ATR to reduce whipsaw effects. On higher timeframes, increase Min Touches and Min Span Bars.
Non-repainting policy
All logic uses confirmed pivots and confirmed bar closes.
Breaks and retests are validated on close; alerts reference only confirmed conditions.
No lookahead in any request.security call.
Original implementation focused on a median-based robust slope for auto trendlines, plus a transparent W-Score and a single retest gate.
Disclosure
This script is for education and charting. It does not guarantee outcomes, and past behavior does not imply future results. Always validate on historical data and practice risk management.

Momentum_EMABand📢 Reposting Notice
I am reposting this script because my earlier submission was hidden due to description requirements under TradingView’s House Rules. This updated version fully explains the originality, the reason for combining these indicators, and how they work together. Follow me for future updates and refinements.
🆕 Momentum EMA Band, Rule-Based System
Momentum EMA Band is not just a mashup — it is a purpose-built trading tool for intraday traders and scalpers that integrates three complementary technical concepts into a single rules-based breakout & retest framework.
Originality comes from the specific sequence and interaction of these three filters:
Supertrend → Sets directional bias.
EMA Band breakout with retest logic → Times precise entries.
ADX filter → Confirms momentum strength and avoids noise.
This system is designed to filter out weak setups and false breakouts that standalone indicators often fail to avoid.
🔧 How the Indicator Works — Combined Logic
1️⃣ EMA Price Band — Dynamic Zone Visualization
Plots upper & lower EMA bands (default: 9-period EMA).
Green Band → Price above upper EMA = bullish momentum
Red Band → Price below lower EMA = bearish pressure
Yellow Band → Price within band = neutral zone
Acts as a consolidation zone and breakout trigger level.
2️⃣ Supertrend Overlay — Reliable Trend Confirmation
ATR-based Supertrend adapts to volatility:
Green Line = Uptrend bias
Red Line = Downtrend bias
Ensures trades align with the prevailing trend.
3️⃣ ADX-Based No-Trade Zone — Choppy Market Filter
Manual ADX calculation (default: length 14).
If ADX < threshold (default: 20) and price is inside EMA Band → gray background marks low-momentum zones.
🧩 Why This Mashup Works
Supertrend confirms trend direction.
EMA Band breakout & retest validates the breakout’s strength.
ADX ensures the market has enough trend momentum.
When all align, entries are higher probability and whipsaws are reduced.
📈 Example Trade Walkthrough
Scenario: 5-minute chart, ADX threshold = 20.
Supertrend turns green → trend bias is bullish.
Price consolidates inside the yellow EMA Band.
ADX rises above 20 → trend momentum confirmed.
Price closes above the green EMA Band after retesting the band as support.
Entry triggered on candle close, stop below band, target based on risk-reward.
Exit when Supertrend flips red or ADX momentum drops.
This sequence prevents premature entries, keeps trades aligned with trend, and avoids ranging markets.
🎯 Key Features
✅ Multi-layered confirmation for precision trading
✅ Built-in no-trade zone filter
✅ Fully customizable parameters
✅ Clean visuals for quick decision-making
⚠ Disclaimer: This is Version 1. Educational purposes only. Always use with risk management.

CTA-min D1 — Donchian 55/20 Trend Breakout (ATR Risk)What it is
A clean, daily trend-following breakout inspired by classic CTA/Turtle logic. It buys strength and sells weakness, then lets winners run with a channel-based trailing stop. No curve-fitting, no clutter—just rules.
How it trades
Timeframe: Daily (D1)
Entry: Close breaks the previous 55-bar Donchian channel (above for longs, below for shorts).
Exit/Trail: Trailing stop at the 20-bar Donchian channel on the opposite side (no fixed TP).
Risk: Initial stop = ATR(N) × stopMult (ATR is smoothed). Position size risks riskPct% of equity based on stop distance.
Labels: “BUY/SELL” only on the entry bar; “STOP BUY/STOP SELL” only on the exit bar.
Pyramiding: Off (one position at a time).
Regime Alignment with EMAs (recommended filter, not enforced by code)
Add EMA 50 and EMA 200 to the D1 chart.
Long bias: take BUY signals only when EMA50 > EMA200 (bullish regime).
Short bias: take SELL signals only when EMA50 < EMA200 (bearish regime).
Optional: for extra selectivity, require the H4 EMAs (50/200) to align with D1 before acting on a signal.
Inputs
entryN (55), exitN (20), atrLen (20), atrSmooth (10), stopMult (2.0), riskPct (0.5%–1.0% recommended).
Works well on (tested by user)
BTCUSD (Bitcoin), EURUSD, GBPJPY, NAS100/US100, USDJPY, AUDUSD, XAGUSD (Silver), US30 (Dow), JP225 (Nikkei), EURGBP, NZDUSD, EURCHF, USDCHF.
How to use
Apply to D1 charts. Review once per day after the daily close and execute next session open to mirror backtest assumptions. Best used as a portfolio strategy across multiple uncorrelated markets. Use the EMA alignment above as a discretionary regime filter to reduce false breakouts.
Notes
For educational use. Markets involve risk; past performance does not guarantee future results. Use responsible position sizing.

Recent Range DetectorOverview
The Recent Range Detector is a specialized indicator designed to identify when an asset is currently range-bound, providing traders with clear support and resistance levels for range trading strategies. Unlike traditional indicators that focus on trend detection, this tool specifically answers the question: "Is the price range-bound right now, and what are the exact trading levels?"
Key Features
✅ Smart Range Detection - Uses a multi-factor scoring system to identify legitimate ranges
✅ Dynamic Support/Resistance Levels - Automatically calculates and displays key trading levels
✅ Range Quality Scoring - Provides confidence levels (Strong/Moderate/Weak Range)
✅ Touch Validation - Counts actual price touches to confirm range reliability
✅ Breakout Detection - Alerts when price exits the established range
✅ Visual Clarity - Clean boxes, lines, and labels for easy interpretation
How It Works
The indicator analyses recent price action using three core metrics:
Touch Quality (40%) - How many times price has respected support/resistance levels
Containment Quality (40%) - What percentage of recent bars stayed within the range
Recent Respect (20%) - Whether the latest price action confirms the range
These combine into a Range Score (0-1) that determines range strength and reliability.
Settings & Parameters
Range Lookback Period (Default: 15)
Number of bars to analyse for range detection
Shorter periods = more responsive to recent ranges
Longer periods = more stable, fewer false signals
Range Tolerance (Default: 2.0%)
Tolerance for price touches around exact highs/lows
Lower values = stricter range requirements
Higher values = more flexible range detection
Minimum Touches (Default: 3)
Required number of support/resistance touches for valid range
Higher values = more confirmed ranges, fewer signals
Lower values = more sensitive, earlier detection
Visual Options
Show Range Box: Displays the range boundaries
Show Support/Resistance Lines: Extends levels into the future
Understanding the Output
Range Score (0.000 - 1.000)
0.7+ = Strong Range (Green) - High confidence range trading setup
0.5-0.7 = Moderate Range (Yellow) - Decent range with some caution
0.3-0.5 = Weak Range (Orange) - Low confidence, be careful
<0.3 = Not Ranging - Avoid range trading strategies
Range Status Classifications
Strong Range - Perfect for range trading strategies
Moderate Range - Good range with normal risk
Weak Range - Marginal range, use smaller positions
Not Ranging - Price is trending or too choppy for range trading
Key Metrics in Info Table
Range Size (%) - Size of the range relative to price level
5-15% = Ideal range size for most strategies
<5% = Tight range, lower profit potential
>15% = Wide range, higher profit potential but more risk
Support/Resistance Levels - Exact price levels for entries/exits
Use these as your key trading levels
Support = potential buy zone
Resistance = potential sell zone
Total Touches - Number of times price respected the levels
3-5 touches = Newly formed range
6-10 touches = Well-established range
10+ touches = Very strong, reliable range
Price Position (%) - Current location within the range
0-20% = Near support (potential long opportunity)
80-100% = Near resistance (potential short opportunity)
40-60% = Middle of range (wait for better entry)
Visual Elements
Range Box
Green Box = Strong Range (Score ≥ 0.7)
Yellow Box = Moderate Range (Score 0.5-0.7)
Orange Box = Weak Range (Score 0.3-0.5)
Support/Resistance Lines
- Horizontal lines showing exact trading levels
- Extend into the future for forward guidance
- Colour matches the range strength
Background Colouring
- Subtle background tint during range periods
- Helps quickly identify ranging vs trending markets
Breakout Signals
- 📈 RANGE BREAK UP - Price breaks above resistance
- 📉 RANGE BREAK DOWN - Price breaks below support
- Only appears for confirmed ranges (Score ≥ 0.5)
Trading Applications
Range Trading Strategy
1. Look for Range Score ≥ 0.5
2. Buy near support (Price Position 0-20%)
3. Sell near resistance (Price Position 80-100%)
4. Set stops just outside the range
5. Exit on breakout signals
Breakout Strategy
1. Identify strong ranges (Score ≥ 0.7)
2. Wait for volume-confirmed breakout
3. Enter in breakout direction
4. Use previous resistance as support (or vice versa)
Market Context
- Strong ranges often occur after trending moves
- Use higher timeframes to confirm overall market structure
- Combine with volume analysis for better entries/exits
Best Practices
What to Look For
✅ Range Score ≥ 0.5 for trading consideration
✅ Multiple touches (5+) for confirmation
✅ Clear price rejection at levels
✅ Reasonable range size (5-15% for most assets)
✅ Recent price respect of boundaries
What to Avoid
❌ Trading ranges with Score < 0.3
❌ Very tight ranges (<3% size) - low profit potential
❌ Ranges with only 1-2 touches - not confirmed
❌ Ignoring breakout signals
❌ Trading against the higher timeframe trend
Alerts Available
- Range Detected - New range formation
- Range Break Up - Upward breakout
- Range Break Down - Downward breakout
- Range Ended - Range condition ended
Timeframe Recommendations
- Daily Charts - Best for swing trading ranges
- 4H Charts - Good for intermediate-term ranges
- 1H Charts - Suitable for day trading ranges
- Lower Timeframes - May produce more noise
Conclusion
The Recent Range Detector eliminates guesswork in range identification by providing objective, quantified range analysis. It's particularly valuable for traders who prefer range-bound strategies or need to identify when trending strategies should be avoided.
Remember: No indicator is perfect. Always combine with proper risk management, volume analysis, and broader market context for best results.
Disclaimer
This indicator is for educational purposes only and should not be considered as financial advice. Trading involves risk, and past performance does not guarantee future results. Always conduct your own research and consider your risk tolerance before making any trading decisions.

Engulfing & Pin Bar Breakout StrategyOverview
This strategy automates a classic, powerful trading methodology based on identifying key candlestick reversal patterns and trading the subsequent price breakout. It is designed to be a complete, "set-and-go" system with built-in risk and position size management.
The core logic operates on the 1-Hour timeframe, scanning for four distinct high-probability reversal signals: two bullish and two bearish. An entry is only triggered when the market confirms the signal by breaking a key price level, aiming to capture momentum following a potential shift in market sentiment.
The Strategy Logic
The system is composed of two distinct modules: Bullish (Long) and Bearish (Short).
🐂 Bullish (Long) Setup
The script initiates a long trade based on the following strict criteria:
Signal: Identifies either a Hammer or a Bullish Engulfing pattern. These patterns often indicate that sellers are losing control and buyers are stepping in.
Confirmation: Waits for the very next candle after the signal.
Entry Trigger: A long position is automatically opened as soon as the price breaks above the high of the signal candle.
Stop Loss: Immediately set just below the low of the signal candle.
Take Profit: A fixed target is placed at a 1:5 Risk/Reward Ratio.
🐻 Bearish (Short) Setup
The script initiates a short trade based on the following strict criteria:
Signal: Identifies either a Shooting Star or a Bearish Engulfing pattern. These patterns suggest buying pressure is fading and sellers are taking over.
Confirmation: Waits for the very next candle after the signal.
Entry Trigger: A short position is automatically opened as soon as the price breaks below the low of the signal candle.
Stop Loss: Immediately set just above the high of the signal candle.
Take Profit: A fixed target is placed at a 1:4 Risk/Reward Ratio.
Key Feature: Automated Risk Management
This strategy is designed for disciplined trading. You do not need to calculate position sizes manually.
Fixed Risk: The script automatically calculates the correct position size to risk exactly 2% of your total account equity on every single trade.
Dynamic Sizing: The position size will adjust based on the distance between your entry price and your stop loss for each specific setup, ensuring a consistent risk profile.
How To Use
Apply the script to your chosen chart (e.g., BTC/USD).
Crucially, set your chart's timeframe to 1-Hour (H1). The strategy is specifically calibrated for this interval.
Navigate to the "Strategy Tester" tab below your chart to view backtest results, including net profit, win rate, and individual trades.
Disclaimer: This script is provided for educational and informational purposes only. It is not financial advice. All trading involves substantial risk, and past performance is not indicative of future results. Please use this tool responsibly and at your own risk.

Opening Range BreakoutThis indicator is designed for Opening Range Breakout (ORB) traders who want automatic calculation of breakout levels and multiple price targets.
It is optimised for NSE intraday trading, capturing the first 15-minute range from 09:15 to 09:30 and plotting key breakout targets for both long and short trades.
✨ Features:
Automatic daily reset — fresh levels are calculated every trading day.
Opening Range High & Low plotted immediately after 09:30.
Two profit targets for both Buy & Sell breakouts based on the opening range size:
T1 = 100% of range added/subtracted from OR high/low.
T2 = 200% of range added/subtracted from OR high/low.
Clear breakout signals (BUY / SELL labels) when price crosses the OR High or Low.
Custom alerts for both buy and sell triggers.
Designed to work on any intraday timeframe (1min, 3min, 5min, etc.).
📊 How it works:
From 09:15 to 09:30, the script records the highest and lowest prices.
At 09:30, the range is locked in and breakout targets are calculated automatically.
Buy and Sell signals are generated when price breaks above the OR High or below the OR Low.
Targets and range lines automatically reset for the next day.
⚠️ Notes:
This script is tuned for NSE market timings but can be adapted for other markets by changing the session input.
Works best on intraday charts for active traders.
This is not financial advice — always backtest before trading live.

Squeeze Momentum Regression Clouds [SciQua]╭──────────────────────────────────────────────╮
☁️ Squeeze Momentum Regression Clouds
╰──────────────────────────────────────────────╯
🔍 Overview
The Squeeze Momentum Regression Clouds (SMRC) indicator is a powerful visual tool for identifying price compression , trend strength , and slope momentum using multiple layers of linear regression Clouds. Designed to extend the classic squeeze framework, this indicator captures the behavior of price through dynamic slope detection, percentile-based spread analytics, and an optional UI for trend inspection — across up to four customizable regression Clouds .
────────────────────────────────────────────────────────────
╭────────────────╮
⚙️ Core Features
╰────────────────╯
Up to 4 Regression Clouds – Each Cloud is created from a top and bottom linear regression line over a configurable lookback window.
Slope Detection Engine – Identifies whether each band is rising, falling, or flat based on slope-to-ATR thresholds.
Spread Compression Heatmap – Highlights compressed zones using yellow intensity, derived from historical spread analysis.
Composite Trend Scoring – Aggregates directional signals from each Cloud using your chosen weighting model.
Color-Coded Candles – Optional candle coloring reflects the real-time composite score.
UI Table – A toggleable info table shows slopes, compression levels, percentile ranks, and direction scores for each Cloud.
Gradient Cloud Styling – Apply gradient coloring from Cloud 1 to Cloud 4 for visual slope intensity.
Weight Aggregation Options – Use equal weighting, inverse-length weighting, or max pooling across Clouds to determine composite trend strength.
────────────────────────────────────────────────────────────
╭──────────────────────────────────────────╮
🧪 How to Use the Indicator
1. Understand Trend Bias with Cloud Colors
╰──────────────────────────────────────────╯
Each Cloud changes color based on its current slope:
Green indicates a rising trend.
Red indicates a falling trend.
Gray indicates a flat slope — often seen during chop or transitions.
Cloud 1 typically reflects short-term structure, while Cloud 4 represents long-term directional bias. Watch for multi-Cloud alignment — when all Clouds are green or red, the trend is strong. Divergence among Clouds often signals a potential shift.
────────────────────────────────────────────────────────────
╭───────────────────────────────────────────────╮
2. Use Compression Heat to Anticipate Breakouts
╰───────────────────────────────────────────────╯
The space between each Cloud’s top and bottom regression lines is measured, normalized, and analyzed over time. When this spread tightens relative to its history, the script highlights the band with a yellow compression glow .
This visual cue helps identify squeeze zones before volatility expands. If you see compression paired with a changing slope color (e.g., gray to green), this may indicate an impending breakout.
────────────────────────────────────────────────────────────
╭─────────────────────────────────╮
3. Leverage the Optional Table UI
╰─────────────────────────────────╯
The indicator includes a dynamic, floating table that displays real-time metrics per Cloud. These include:
Slope direction and value , with historical Min/Max reference.
Top and Bottom percentile ranks , showing how price sits within the Cloud range.
Current spread width , compared to its historical norms.
Composite score , which blends trend, slope, and compression for that Cloud.
You can customize the table’s position, theme, transparency, and whether to show a combined summary score in the header.
────────────────────────────────────────────────────────────
╭─────────────────────────────────────────────╮
4. Analyze Candle Color for Composite Signals
╰─────────────────────────────────────────────╯
When enabled, the indicator colors candles based on a weighted composite score. This score factors in:
The signed slope of each Cloud (up, down, or flat)
The percentile pressure from the top and bottom bands
The degree of spread compression
Expect green candles in bullish trend phases, red candles during bearish regimes, and gray candles in mixed or low-conviction zones.
Candle coloring provides a visual shorthand for market conditions , useful for intraday scanning or historical backtesting.
────────────────────────────────────────────────────────────
╭────────────────────────╮
🧰 Configuration Guidance
╰────────────────────────╯
To tailor the indicator to your strategy:
Use Cloud lengths like 21, 34, 55, and 89 for a balanced multi-timeframe view.
Adjust the slope threshold (default 0.05) to control how sensitive the trend coloring is.
Set the spread floor (e.g., 0.15) to tune when compression is detected and visualized.
Choose your weighting style : Inverse Length (favor faster bands), Equal, or Max Pooling (most aggressive).
Set composite weights to emphasize trend slope, percentile bias, or compression—depending on your market edge.
────────────────────────────────────────────────────────────
╭────────────────╮
✅ Best Practices
╰────────────────╯
Use aligned Cloud colors across all bands to confirm trend conviction.
Combine slope direction with compression glow for early breakout entry setups.
In choppy markets, watch for Clouds 1 and 2 turning flat while Clouds 3 and 4 remain directional — a sign of potential trend exhaustion or consolidation.
Keep the table enabled during backtesting to manually evaluate how each Cloud behaved during price turns and consolidations.
────────────────────────────────────────────────────────────
╭───────────────────────╮
📌 License & Usage Terms
╰───────────────────────╯
This script is provided under the Creative Commons Attribution-NonCommercial 4.0 International License .
✅ You are allowed to:
Use this script for personal or educational purposes
Study, learn, and adapt it for your own non-commercial strategies
❌ You are not allowed to:
Resell or redistribute the script without permission
Use it inside any paid product or service
Republish without giving clear attribution to the original author
For commercial licensing , private customization, or collaborations, please contact Joshua Danford directly.

Auto Channel [SciQua]Auto Channel
Purpose
Auto Channel finds the single best parallel price channel from recent price action and keeps it updated in real time. It uses ZigZag pivots to build candidate channels, scores each candidate for quality, then plots the winner. When price closes outside the channel, the script flags a breakout and can fire alerts.
How it works
1. ZigZag pivots
The script uses TradingView’s TradingView/ZigZag/7 library to generate a stream of swing highs and lows based on a percentage reversal threshold and a leg depth. These pivots are the only points the channel logic evaluates, which keeps the search fast and focused on structure rather than noise.
2. Channel candidates
From the most recent pivots, the script forms all combinations of two swing highs and two swing lows.
It computes a slope for the high line and a slope for the low line and requires that they be nearly parallel within a user-defined tolerance.
3. Quality scoring and selection
For every valid candidate, the script checks the recent pivot segments against the trial channel and computes:
Inside ratio: fraction of tested pivots that sit fully inside the channel after applying the tolerance buffer.
Violation sum: total magnitude of the breaches for any pivots outside the channel.
Current width: distance between upper and lower lines at the current bar.
The “best” channel is chosen by:
1. highest inside ratio
2. then widest current width
3. then smallest violation sum
4. Plot and projection
The upper and lower lines are anchored to the chosen pivot pairs and extend to the left. The script also projects each line to the current bar to compute the live upper and lower channel prices. Those levels drive the breakout checks and alerts.
5. Breakouts and alerts
A breakout is detected when the bar closes above the projected upper line or closes below the projected lower line, after applying the tolerance buffer. Triangle markers highlight fresh breakouts, and you can enable alert conditions to automate notification or strategy handoff.
Inputs:
ZigZag
Price deviation for reversals (%)
Default 0.2. Larger values produce fewer, larger swings. Smaller values produce more, smaller swings.
Pivot legs
Default 2. Controls the lookback depth ZigZag uses to confirm pivots.
ZigZag Color
Visual only.
Tip: If you are not seeing a stable channel, increase the ZigZag percentage to reduce minor swings.
Channel search
Number of recent pivots to consider
Default 12. Higher values search more history and try more channel combinations. Lower values make the search faster and more reactive.
Max slope difference for parallel
Default 0.0005. Maximum allowed difference between the upper and lower line slopes. Smaller values enforce stricter parallelism.
Max price tolerance outside channel
Default 0.0. A buffer added to the channel boundaries during validation and breakout checks. Use this to ignore tiny wicks that poke the lines.
Minimum inside to outside pivots ratio for valid channel (0.00–1.00)
Default 1.00. Require that at least this fraction of checked pivots lie inside the channel. For a more permissive fit, try 0.60 to 0.85.
Styling
Upper Line Color
Lower Line Color
Breakout Above Color
Breakout Below Color
Plots and visuals
Upper channel line
Lower channel line
Triangle markers on the bar that first confirms a close outside the channel, above or below.
Lines extend left from their pivot anchors. Projection to the current bar is used internally to test for breakouts and to set alerts.
Alerts
The script defines two alert conditions:
Close Above Channel
Triggers when the bar closes above the projected upper line plus tolerance.
Close Below Channel
Triggers when the bar closes below the projected lower line minus tolerance.
Practical usage
Trend channels
In a steady trend, a high inside ratio with a moderate width often highlights the dominant channel. Consider trend entries near the lower line in an uptrend or near the upper line in a downtrend, with exits or stops beyond the opposite boundary.
Breakout trades
Combine the channel breakout alert with volume or a separate momentum filter. The tolerance input helps avoid false triggers from small wicks.
Tuning for timeframe and symbol
• Faster markets or lower timeframes usually benefit from a larger ZigZag percentage and a smaller pivot count.
• Slower markets or higher timeframes can use more pivots and a tighter slope difference to enforce cleaner geometry.
Notes and limitations
Channels are derived from ZigZag pivots. If your ZigZag settings change, the detected channel will also change.
The script plots only the single best channel at any time to keep the chart clean.
Breakout markers appear on confirmed bars. For historical bars, markers appear only where a breakout would have been confirmed at that time.
Lines extend left from their anchors. The script projects the lines internally to the current bar for checks and alerts.
License and attribution
License
Creative Commons Attribution-NonCommercial 4.0 International (CC BY-NC 4.0).
Open source for educational and personal use only. Commercial use requires written permission.
Attribution
© 2025 SciQua — Joshua Danford
Libraries
Uses TradingView/ZigZag/7.
Changelog
v1.0
Initial release. Automatic parallel channel detection from ZigZag pivots, quality scoring, live plotting, and close-based breakout alerts.
FAQ
Why do I not see any channel sometimes?
There may not be a valid pair of highs and lows that pass the slope, inside ratio, and tolerance checks. Loosen the constraints by increasing Max slope difference, lowering Minimum inside ratio, or increasing the ZigZag percentage.
The channel looks too narrow or too wide?
Adjust Number of recent pivots and Minimum inside ratio. A higher inside ratio tends to favor cleaner, sometimes wider channels. A lower ratio may admit narrower, more reactive channels.
How can I reduce false breakout alerts?
Increase Max price tolerance outside channel to ignore small wicks. Add a volume or momentum confirmation in your personal alert workflow.
Thank you for using Auto Channel . Feedback and improvements are welcome.

Circuit Breaker Table (NSE Style)🛡️ NSE Circuit Breaker Table – With Volatility-Based Band Support
This script displays a real-time circuit breaker table for any stock, showing the Upper and Lower circuit limits in a clean 2x2 grid. It’s especially useful for Indian traders monitoring NSE-listed stocks.
✅ Key Features:
📊 Upper & Lower Limits based on the previous day’s close
⚡ Optional ATR-based dynamic volatility band calculation
🎨 Customizable font sizes (Small / Medium / Large)
✅ Table neatly positioned on the top-right corner of your chart
🟢 Upper circuit shown in green, 🔴 lower circuit in red
Works on all NSE stocks and adapts automatically to charted symbols
⚙️ Customization Options:
Use static percentage bands (e.g., 10%)
Or enable ATR mode to reflect dynamic circuit potential based on recent volatility
This tool helps you stay aware of where a stock might get halted — useful for momentum traders, circuit breakout traders, and anyone monitoring volatility limits during intraday sessions.

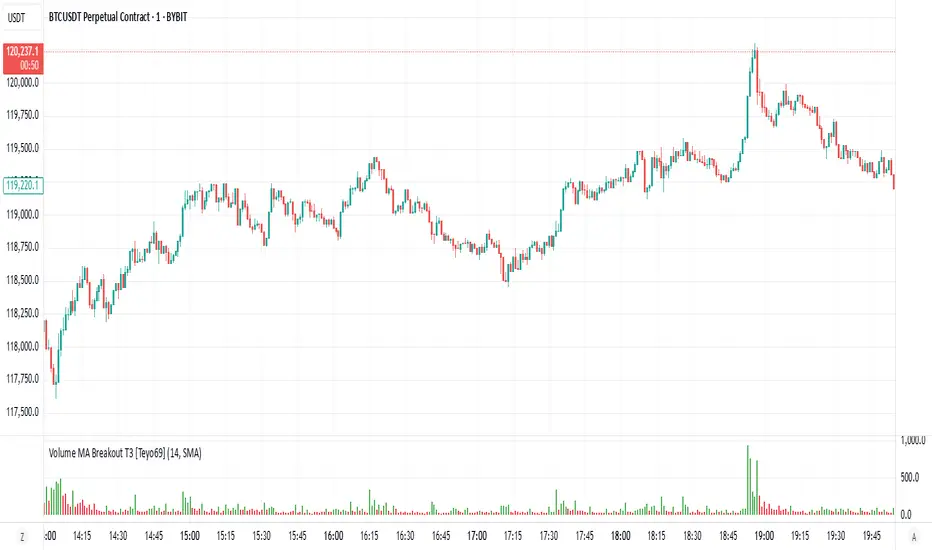
Volume MA Breakout T3 [Teyo69]🧭 Overview
Volume MA Breakout T3 highlights volume bars that exceed a dynamic moving average threshold. It helps traders visually identify volume breakouts—periods of significant buying or selling pressure—based on user-selected MA methods (SMA, EMA, DEMA).
🔍 Features
Volume Highlighting: Green bars indicate volume breakout above the MA; red bars otherwise.
Custom MA Options: Choose between SMA, EMA, or Double EMA for volume smoothing.
Dynamic Threshold: The moving average line adjusts based on user-defined length and method.
⚙️ Configuration
Length: Number of bars used for the moving average calculation (default: 14).
Method: Type of moving average to use:
"SMA" - Simple Moving Average
"EMA" - Exponential Moving Average
"Double EMA" - Double Exponential Moving Average
📈 How to Use
Apply to any chart to visualize volume behavior relative to its MA.
Look for green bars: These suggest volume is breaking out above its recent average—potential signal of momentum.
Red bars indicate normal/subdued volume.
⚠️ Limitations
Does not provide directional bias—use with price action or trend confirmation tools.
Works best with additional context (e.g., support/resistance, candle formations).
🧠 Advanced Tips
Use shorter MAs (e.g., 5–10) in volatile markets for more responsive signals.
Combine with OBV, MFI, or accumulation indicators for confluence.
📌 Notes
This is a volume-based filter, not a signal generator.
Useful for breakout traders and volume profile enthusiasts.
📜 Disclaimer
This script is for educational purposes only. Always test in a simulated environment before live trading. Not financial advice.
Support and Resistance Levels with BreaksThis indicator identifies dynamic support and resistance levels using pivot point analysis and provides clear trading signals when these levels are broken with volume confirmation. Enhanced version with improved signal clarity for better trading decisions.
## 🔧 Key Features
### Support & Resistance Detection
- Automatically identifies key pivot high and low levels
- Draws clear visual lines (red for resistance, blue for support)
- Configurable sensitivity with left/right bar settings
### Enhanced Trading Signals
- **BUY** signals when resistance is broken with volume confirmation
- **SELL** signals when support is broken with volume confirmation
- **Bull Wick** alerts for potential reversals at resistance
- **Bear Wick** alerts for potential reversals at support
### Volume Confirmation
- Built-in volume oscillator using 5 and 10-period EMAs
- Filters out low-volume false breakouts
- Adjustable volume threshold (default: 20%)
### Complete Alert System
- Support Broken alerts
- Resistance Broken alerts
- Bull Wick reversal alerts
- Bear Wick reversal alerts
## ⚙️ Settings
- **Show Breaks**: Toggle signal display
- **Left Bars**: Pivot detection lookback (default: 15)
- **Right Bars**: Pivot detection lookforward (default: 15)
- **Volume Threshold**: Minimum volume increase for valid signals (default: 20%)
## 📈 Best For
- Swing trading strategies
- Breakout confirmation
- Support/resistance trading
- Volume-based entry signals
## 🔍 How It Works
1. Identifies pivot highs/lows using configurable periods
2. Calculates volume oscillator for confirmation
3. Generates BUY signals on resistance breaks with volume
4. Generates SELL signals on support breaks with volume
5. Detects wick patterns for potential reversals
## 📋 Updates in This Version
- Enhanced BUY/SELL signal clarity (replaced generic "B" labels)
- Added Bull Wick and Bear Wick alert conditions
- Updated to Pine Script v6 compatibility
- Improved signal filtering and accuracy
## ⚠️ Disclaimer
This indicator is for educational and informational purposes only. Always conduct your own analysis and risk management before making trading decisions. Past performance does not guarantee future results.
---
**Original Script**: "Support and Resistance Levels with Breaks" by LuxAlgo
**License**: CC BY-NC-SA 4.0
**Enhanced by**: profitgang
**Version**: Pine Script v6
ORB Breakout Indicator - NQ1!The purpose of this indicator is to assist traders in rapidly identifying high-probability Opening Range Breakout (ORB) setups on the NQ1! 1-minute time frame (Nasdaq Futures)
Key Features:
Opening Range: Automatically plots the high and low of the 1st 15min of the (NYSE session) (09:30–09:45 EST)
Breakout Signals : Illustrates the first candle that breaks upward or downward and:
Green arrow for a bullish breakout
Red arrow for a bearish breakout
Clean Visuals: Dynamic lines show the high and low of the ORB window for easy reference.
(DON'T USE THIS ONLY FOR ENTRY SIGNALS, PAIR THIS WITH OTHER INFLUENCES TO GET HIGH PROBABILITY BREAKOUTS)
BOS mark-out (by Lumiere)Advanced BOS Detection with Strict Swing Confirmation
This indicator implements BOS detection with several unique features:
🔹 Dual-Candle Swing Validation - Unlike most BOS indicators that use single candle swings, this uses a two-candle confirmation for swing highs/lows, analyzing both the candle wicks and body transitions.
🔹 Directional Lock System - Implements a state machine that prevents duplicate signals until an opposite-direction BOS occurs, reducing noise.
🔹 Precision Wick Analysis - Compares wicks between the reversal candle and confirmation candle to identify the true swing point.
🔹 Real-Time Update & Live Market Adaptation – The indicator continuously monitors price action and instantly updates BOS signals as new candles form, ensuring you never miss a BOS.
How It Differs From Other BOS Indicators:
Most public BOS indicators use simple HH/HL or LH/LL detection.
Many don't implement the directional locking mechanism.
Few use the two-candle wick comparison approach.
Wick-Based Precision uses the extreme wicks of two candles (not just the body).
Strict Confirmation requires a close beyond the swing point (no "wick breaks" counted).
Usage Examples:
🟦 Bullish BOS:
A green candle closes, followed by a red candle. This will be the new high, and if the next candle closes above the highest wick of those two, it will be a BOS (only if we had a bearish BOS before)
🟥 Bearish BOS:
A red candle closes, followed by a green candle. This will be the new low, and if the next candle closes below the lowest wick of those two, it will be a BOS (only if we had a Bullish BOS before)

Intra_Candle_Welding by Chaitu50cIntra Candle Welding by Chaitu50c
This is a professional price action–based indicator designed to automatically detect and visualize *intra-candle reversal zones* using simple yet powerful logic. It highlights price levels where two consecutive opposite candles meet with a high probability of short-term market reaction.
Concept
The indicator identifies potential intraday support and resistance levels based on the "Intra Candle Welding" concept: when the close of one candle is very close to the open of the next candle, and the two candles have opposite directions (bullish followed by bearish, or bearish followed by bullish). These levels often attract market attention due to order flow imbalance created during such transitions.
How It Works
1. The indicator continuously monitors each new candle and checks if the current open is approximately equal to the previous close, within a configurable buffer.
2. It further ensures that the two candles form an opposite pair (green→red or red→green).
3. When a valid pair is detected, the indicator checks for existing active lines near this level. If no active line exists within the defined tolerance, it draws a new horizontal line at the detected level.
4. Each line is classified as either a potential resistance (from green→red pair) or support (from red→green pair).
5. Lines automatically extend rightward and update with each bar. If price breaks through the line beyond a configurable break buffer, the line stops extending and is visually marked as "broken."
6. The indicator intelligently manages the maximum number of lines on the chart by deleting the oldest ones when the limit is exceeded.
Use Case
Traders can use this tool to identify short-term reaction zones and potential intraday turning points. The highlighted levels act as temporary support and resistance areas where price frequently reacts. It is especially useful in fast-moving or volatile markets such as index futures or liquid stocks.
Features
* Automatically detects intra-candle reversal zones.
* Classifies zones as support (bottom) or resistance (top).
* Automatically updates and breaks lines when invalidated by price action.
* Adjustable parameters for flexibility:
* Equality Buffer
* Max Lines to Keep
* Line Suppression Tolerance
* Initial Extend Bars
* Break Buffer
* Line colors, widths, and styles (active and broken states)
* Efficient memory handling with capped line count.
* Minimalist and clean visual representation, suitable for overlay on any chart.
Recommended Settings
* Works best on intraday timeframes (1 min to 15 min).
* Tune the Equality Buffer and Tolerance parameters based on instrument volatility.
* Use conservative Break Buffer to avoid premature line invalidation.
Disclaimer
This is a tool to support discretionary trading decisions. It is not a standalone buy/sell signal generator. Users are advised to combine it with their own market context and risk management framework.
This indicator is released for the TradingView community for educational and practical trading use.
---

Low Volatility Breakout Detector)This indicator is designed to visually identify potential breakouts from consolidation during periods of low volatility. It is based on classic Bollinger Bands and relative volume. Its primary purpose is not to generate buy or sell signals but to assist in spotting moments when the market exits a stagnation phase.
Arrows appear only when the price breaks above the upper or below the lower Bollinger Band, the band width is below a specified threshold (expressed in percentage), and volume is above its moving average multiplied by a chosen multiplier (default is 1). This combination may indicate the start of a new impulse following a period of low activity.
The chart background during low volatility is colored based on volume strength—the lower the volume during stagnation, the less transparent the background. This helps quickly spot unusual market behavior under seemingly calm conditions. The background opacity is dynamically scaled relative to the range of volumes over a selected period, which can be set manually (default is 50 bars).
The indicator works best in classic horizontal consolidations, where price moves within a narrow range and volatility and volume clearly decline. It is not intended to detect breakouts from formations such as triangles or wedges, which may not always exhibit low volatility relative to Bollinger Bands.
Settings allow you to adjust:
Bollinger Band length and multiplier,
Volatility threshold (in %),
Background and arrow colors,
Volume moving average length and multiplier,
Bar range used for background opacity scaling.
Note: For reliable results, it’s advisable to tailor the volatility threshold and volume/background ranges to the specific market and timeframe, as different instruments have distinct dynamics. If you want the background color to closely match the color of breakout arrows, you should set the same volume analysis period as the volume moving average length.
Additional note: To achieve a cleaner chart and focus solely on breakout signals, you can disable the background and Bollinger Bands display in the settings. This will leave only the breakout arrows visible on the chart, providing a clearer and more readable market picture.

MTF Candle Direction Forecast + Breakdown🧭 MTF Candle Direction Forecast + Breakdown 🔥📈🔼
This script is a multi-timeframe (MTF) price action dashboard that helps traders assess real-time directional bias across five customizable timeframes — with a focus on candle behavior, trend alignment, and confidence strength.
📌 What It Does
For each timeframe, this dashboard summarizes:
Current direction → Bullish, Bearish, or Neutral
Confidence score (0–100) → How strongly price is likely to continue in that direction
Candle strength → 🔥 icon appears if the current candle has a large body relative to its range
Trend alignment:
📈 = EMA9 is above EMA20
🔼 = Price is above VWAP
Color-coded background to visually reinforce directional state
Each row gives you a visual “at-a-glance” readout of what price is doing right now — not in the past.
💡 Why It’s Useful
✅ Direction forecasting based on price action
Instead of lagging indicators, this script prioritizes:
Candle body-to-range ratio (momentum)
Real-time VWAP/EMA structure
Immediate price positioning
✅ Confidence is quantified
The score (0–100) helps you judge how reliable each directional signal is:
90+ → Strong conviction
50–70 → Mixed but potentially valid
<40 → Weak move or early signal
✅ Timeframe confluence at a glance
See whether multiple timeframes are aligning directionally — helpful for scalping, day trading, or waiting for multi-timeframe breakout setups.
✅ Visual & intuitive
Icons, colors, and layout make it easy to scan your dashboard instead of deciphering charts or code.
🛠️ Adjustable Settings
Setting Description
Timeframe 1–5 Choose any timeframes to monitor (e.g., 5m, 15m, 1h, 4h)
Candle Display Mode Show trend color via emoji (🟢/🔴) or background shading
Strong Candle Threshold Adjust the body-to-range % needed to trigger 🔥 strength
Bullish/Bearish Background Customize label color coding
Neutral Background (opacity) Set transparency or styling for flat/consolidating zones
Table Location Place the dashboard anywhere on the chart
🎯 Use Cases
Scalpers: Confirm trend across 1m/5m/15m before entering
Day Traders: Use confidence score to avoid low-momentum setups
Swing Traders: Monitor higher timeframes for trend shifts while tracking intraday noise
VWAP/EMA traders: Quickly see when price is reclaiming or losing critical trend levels
🧠 What Makes It Unique?
Unlike generic trend meters or mashups of standard indicators, this script:
Uses live candle dynamics (not just closes or lagging values)
Computes directional bias and confidence together
Visualizes strength and structure in a compact, readable interface
Let’s you filter by price action, not just indicator alignment
💥 Why Traders Love Will Love It
✅ Instant clarity on which timeframes agree
✅ No more guessing candle strength or trend health
✅ Confidence score keeps you out of weak trades
✅ Works with any strategy — trend following, VWAP reclaim, EMA scalps, even breakouts
✅ Keeps your chart clean — all the context, none of the clutter
⚠️ Transparency🧬 Under the Hood
Powered by live candle body analysis, trend structure (EMA9 vs EMA20), and VWAP placement.
All scores are generated in real-time — No repainting or lookahead bias: all values are computed with lookahead=barmerge.lookahead_on
Confidence scores reflect the current candle only — they do not predict future moves but measure momentum and alignment in real-time
Labels update per bar and respond to subtle shifts in candle structure and trend indicators
✅ MTF Trend Snapshot (Live Output Example Shown in Chart Above)
This dashboard gives you a fast, visual summary of market trend and momentum across 5 timeframes. Here's what it's telling you right now:
🕔 5 Minute (5m)
📉 EMA Trend: Down
🔼 Price: Above VWAP
Direction: Bearish (42)
🟥 Weak bearish bias. Short-term pullback against a stronger trend. Use caution — lower confidence and mixed structure.
⏱️ 15 Minute (15m)
📈 EMA Trend: Up
🔼 Price: Above VWAP
Direction: Bullish (73)
🟩 Clean bullish structure with growing momentum. Solid for intraday confirmation.
🕧 30 Minute (30m)
📈 EMA Trend: Up
🔼 Price: Above VWAP
Direction: Bullish (77)
🟩 Stronger trend forming. Above VWAP and EMAs — building conviction.
🕐 1 Hour (1h)
📈 EMA Trend: Up
🔼 Price: Above VWAP
Direction: Bullish (70)
🟩 Confident, clean trend. Good alignment across indicators. Ideal timeframe for swing entries.
🕓 4 Hour (4h)
🔥 Strong Candle
📈 EMA Trend: Up
🔼 Price: Above VWAP
Direction: Bullish (100)
🟩 Full trend alignment with max momentum. Strong body candle + structure — high confidence continuation.
🧠 Quick Takeaway
🔻 5m is pulling back short term
✅ 15m through 4h are fully aligned Bullish
🔥 4h has max confidence — big-picture trend is intact
📈 Ideal setup for momentum traders looking to ride trend with multi-timeframe confirmation
Try pinning this dashboard to your chart during live trading to read price like a story across timeframes, and filter out weak setups with low-confidence noise.

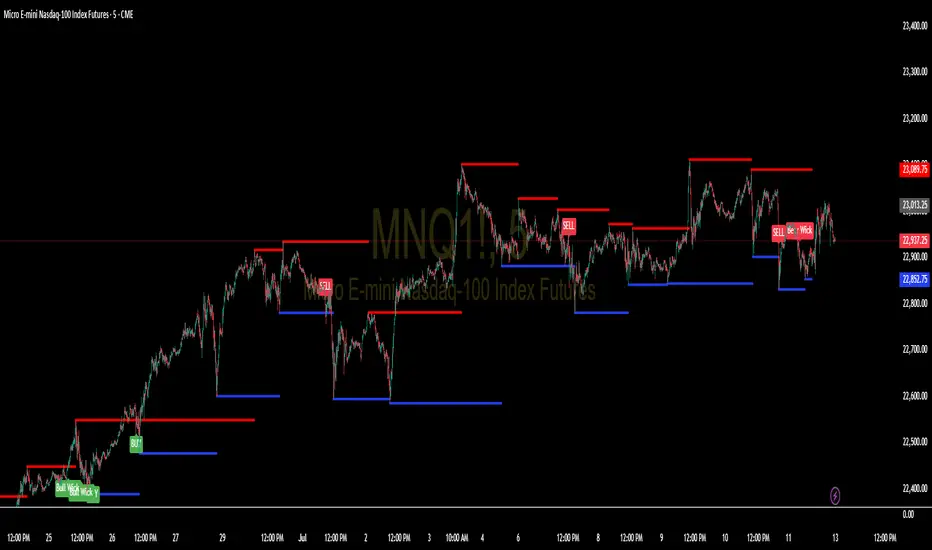
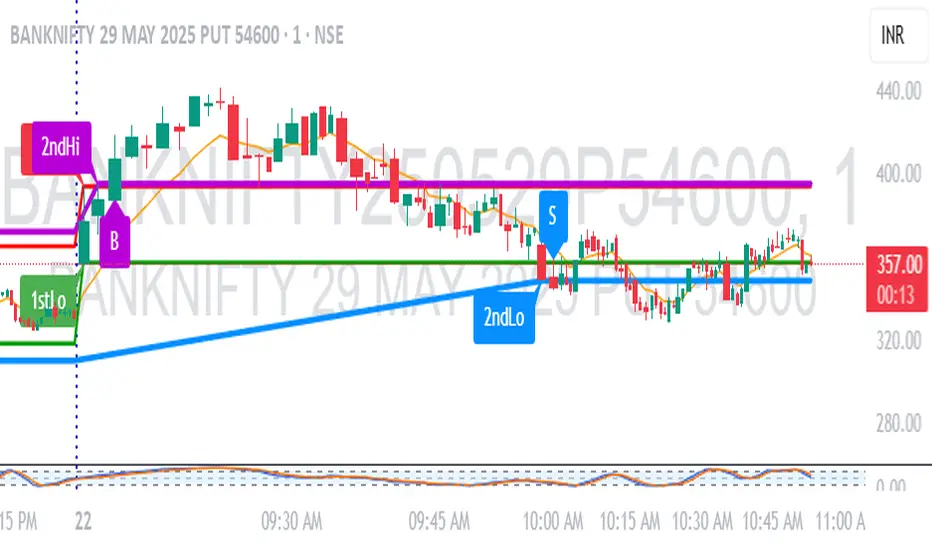
1M Scalp Setup – 2ndHi/2ndLo Breakout1M Scalp Setup – 2ndHi/2ndLo Breakout
This script is designed for 1-minute chart scalpers seeking high-probability intraday breakout setups based on early session price action. The strategy revolves around identifying the first high and low of the day, and then detecting the second breach (2nd high or 2nd low) to anticipate breakout entries.
🔍 Core Logic:
EMA Filter : A configurable EMA (default 8-period) is plotted for trend context.
1st High/Low Detection : Captures the very first high and low of each trading day.
2nd High/Low Markers : Identifies the second time price breaks the initial high or low, acting as a potential signal zone.
Breakout Signals :
A Buy Signal is triggered when price closes above the 2nd high.
A Sell Signal is triggered when price closes below the 2nd low.
Each signal is only triggered once per day to reduce noise and avoid overtrading.
🖌️ Visual Markers:
1stHi and 1stLo : Early session levels (red and green).
2ndHi and 2ndLo : Key breakout reference points (purple and blue).
B and S Labels : Buy and Sell triggers marked in real-time once breakouts occur.
⚙️ Inputs:
EMA Length (default: 8)
Customizable Colors for Buy/Sell signals and key markers
This tool is best used in fast-moving markets or during high-volume sessions. Combine with volume or higher-timeframe confirmation for improved accuracy.
BTC Breakout Alert📈 BTC Breakout & Fakeout Detector with Volume, RSI & MACD Filters
This script helps identify high-confidence breakout setups by combining price action, volume spikes, and optional momentum filters (RSI & MACD). It’s designed to alert you when Bitcoin (or any asset) breaks above a defined resistance level with strong conviction — and warns you if that move turns out to be a fakeout.
🔍 Features:
✅ Confirmed Breakout Alerts: Triggers when price closes above your set resistance level with volume ≥ 1.5× the 20-period average.
⚠️ Fakeout Detection: Highlights when price closes back below resistance within a few candles after breakout.
📊 Momentum Filters:
RSI > 50 for bullish confirmation
MACD line > signal line to support breakout momentum
🔔 Custom Alerts: Built-in alert conditions for both breakout and fakeout events.
🔼🔽 Visual Markers: Arrows plotted directly on the chart for clear entry and caution zones.
🕒 Works on all timeframes and any asset that includes volume data.
Ideal for breakout traders who want more than just a price spike — this tool ensures volume and momentum alignment, helping you reduce false signals and react with more confidence.
