Search in scripts for "breakout"


Hoffman A/D BreakoutStudy based on Rob Hoffman's Accumulation/Distribution Breakout strategy.
- Green circle on the top wick indicates a "Distribution" wick
- Red circle on the bottom wick indicates an "Accumulation" wick
- A distribution wick in an uptrend gets marked as a Key Resistance. This is marked with green crosses
- An Accumulation wick in a downtrend gets marked as a Key Support. This is marked with red crosses
- Breaking above the Key Resistance indicates a buy entry. This is marked by a green background.
- Breaking below the Key Support indicates a sell entry. This is marked by a red background

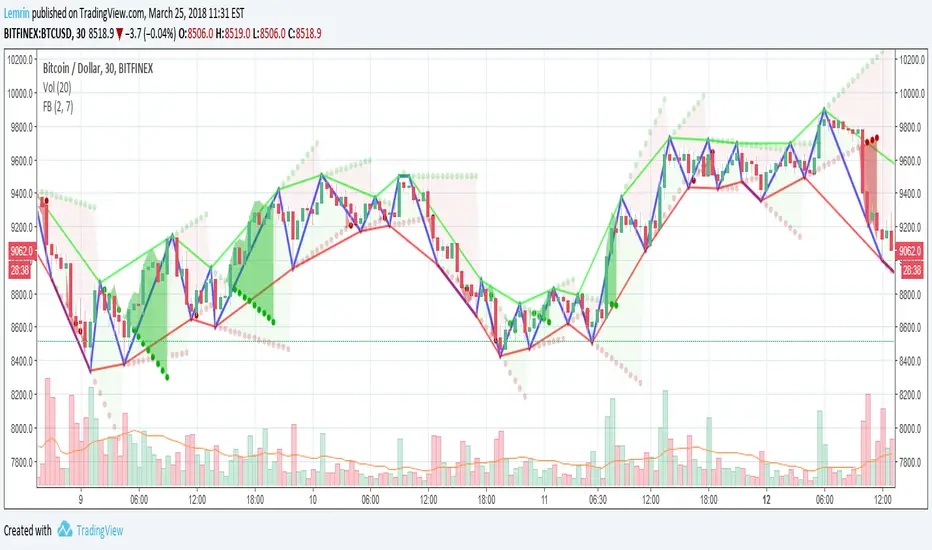
Fractal Breakout V2Version 2 of my fractal pattern aid ( Version 1 ).
I added a bouncing line between the high and low trend lines, connecting consecutive extreme points. I also chased down a pesky bug in the slope calculation...and for now I have disabled the ability to change resolution basis for extreme detection (e.g. 30m on a 1hr chart).
For fun, I added some shading to make it more apparent at a glance what is happening, but if you find it gimmicky, there's an option to turn that off.
I am inexperienced with pattern recognition, so please send feedback if you have any ideas that would make this more useful.
Thanks!
Lemrin
[STRATEGY][RS]Open Session Breakout TraderEXPERIMENTAL: use at your own discretion.
custom session breakout strategy, it uses a percentage of daily atr to set breakout limits. strategy only viable for intraday timeframes and is suggested under 1hour.

Breakout Range Short Strategy BacktestBreakout Range Short Strategy
You can change long to short in the Input Settings
Please, use it only for learning or paper trading. Do not for real trading.
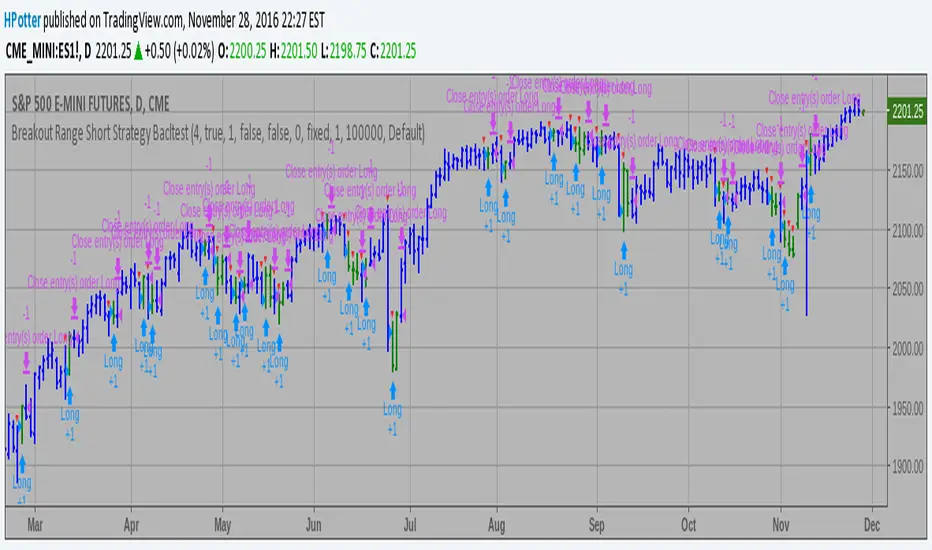
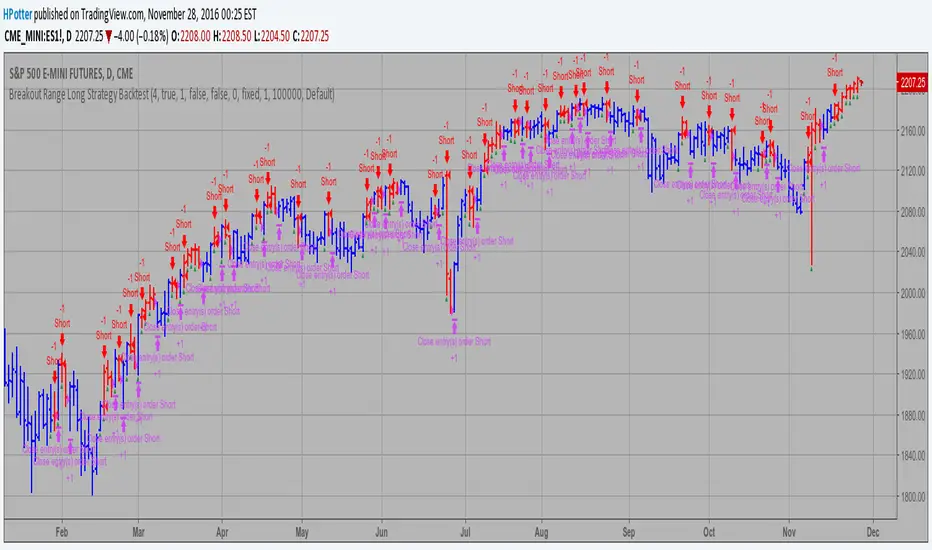
Breakout Range Long Strategy Backtest Breakout Range Long Strategy
You can change long to short in the Input Settings
Please, use it only for learning or paper trading. Do not for real trading.
Fractal Breakout Strategy (by ChartArt)This long only strategy determines the price of the last fractal top and enters a trade when the price breaks above the last fractal top. The strategy also calculates the average price of the last fractal tops to get the trend direction. The strategy exits the long trade, when the average of the fractal tops is falling (when the trend is lower highs as measured by fractals). And the user can manually set a time delay of this exit condition. The default setting is a long strategy exit always 3 bars after the long entry condition appeared.
In addition as gimmicks the fractals tops can be highlighted (the default is blue) and a line can be drawn based on the fractal tops.This fractal top line is colored by the fractal top average trend in combination with the fractal breakout condition.
This strategy works better on higher time-frames (weekly and monthly), but it also works on the daily and some other time-frames. This strategy does not repaint, no repainting.
P.S. I thank Tradingview user barracuda who helped me with the time based exit condition code. And user RicardoSantos for coding the definition of the fractal top, which he uses in his " Fractals" scripts.
All trading involves high risk; past performance is not necessarily indicative of future results. Hypothetical or simulated performance results have certain inherent limitations. Unlike an actual performance record, simulated results do not represent actual trading. Also, since the trades have not actually been executed, the results may have under- or over-compensated for the impact, if any, of certain market factors, such as lack of liquidity. Simulated trading programs in general are also subject to the fact that they are designed with the benefit of hindsight. No representation is being made that any account will or is likely to achieve profits or losses similar to those shown.

Inside Bar Breakout FailureSimple indicator to highlight Inside Bar Breakout Failure patterns on chart.

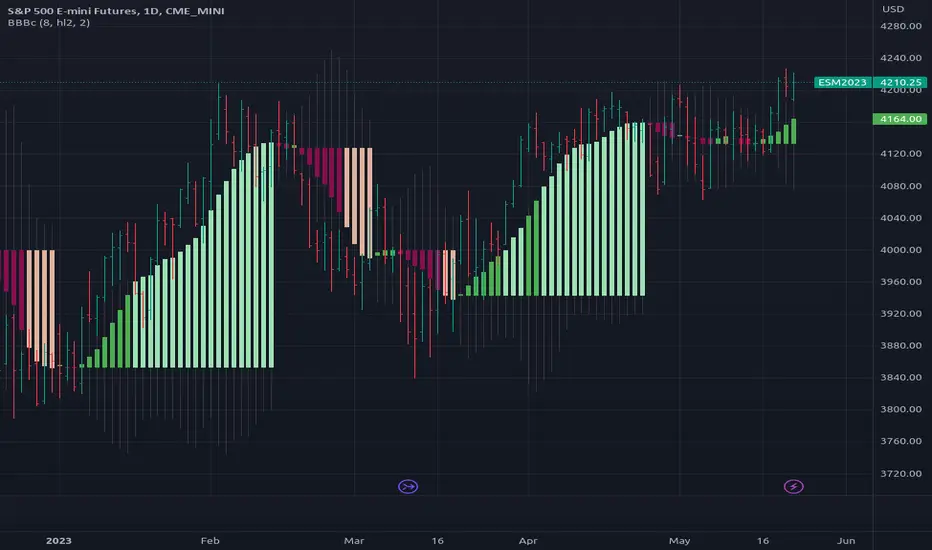
[JR] Multi Bollinger Heat Bands - EMA/Breakout optionsA little, yet hopefully useful update over my previous "Multi Bollinger Heat Bands". For those who like quick visual cue's.
In short: It's your Basic Bollinger Bands, but 3 of them, and some pointy things.
In full:
Three stacked SMA based Bollinger Bands designed just to give you a quick visual on the "heat" of movement.
Set inner band as you would expect, then set your preferred additional multiplier increments for the outer 2 bands.
Option to use EMA as alternative basis, rather than SMA.
Breakout indication shapes, which have their own multiplier (but still tied to same length/period as the BB's) so you can make them pop on their own separate "band".

[RS]Bollinger Bands Breakout Candles V0EXPERIMENTAL: a experiment using bollingers and directional momentum, Breakout detector.
Opening Range Breakout with 2 Profit Targets.Opening Range Breakout with 2 Profit Targets.
Updated Indicator now works on all Symbols with Many Different Session Options.
***Known PineScript Issue…While the Opening Range is being Formed the lines only adjust for that individual bar. Just reset Indicator after Opening Range Completes.
***All Times are Based on New York Time
Session Options Forex U.S. Banks Open (8:00), Gold U.S. Open (8:20), Oil U.S. Open (9:00), U.S. Cash Session - Stocks (9:30), NY Forex Open (17:00) , Europe Open (02:00), or if you choose Setting 0 the Session Runs from 00:00 to 00:00 (Midnight to Midnight).
***Ability to use 60 minute Opening Range, 30 minute, 15 minute, and many other options.
***However you can manually change the times in the Inputs Tab to adjust for any session you prefer. This is useful for Day Light Savings Adjustments. Also the default times work if your charts are set to EST Time. If you use A different time zone in your settings you need to Adjust the times in the inputs tab.
Initially Opening Range High and Low plot as Yellow Lines. If Price Goes Above Opening Range then Line Turns Green. If Price Goes Below Opening Range Line Turns Red.
By default the First Profit Target is 1/2 the Width of the Opening Range and the 2nd Profit Target is 1 Times the Opening Range. However these are Adjustable in the Inputs Tab.
By Default the Opening Range Length is 1 Hour. However, you can Change the Opening Range Length to 15 min, 30 min, 2 hours etc. in the Inputs Tab.
Plots a 1 Above or Below Candle when 1st Profit Target is Achieved, and a 2 when 2nd Profit Target is Achieved.

ATR Squeeze BackgroundThis simple but powerful indicator shades the background of your chart whenever volatility contracts, based on a custom comparison of fast and slow ATR (Average True Range) periods.
By visualizing low-volatility zones, you can:
* Identify moments of compression that may precede explosive price moves
* Stay out of choppy, low-momentum periods
* Adapt this as a component in a broader volatility or breakout strategy
🔧 How It Works
* A Fast ATR (default: 7 periods) and a Slow ATR (default: 40 periods) are calculated
* When the Fast ATR is lower than the Slow ATR, the background is shaded in blue
* This shading signals a contraction in volatility — a condition often seen before breakouts or strong directional moves
⚡️ Why This Matters
Many experienced traders pay close attention to volatility cycles. This background indicator helps visualize those cycles at a glance. It's minimal, non-intrusive, and easy to combine with your existing tools.
🙏 Credits
This script borrows core logic from the excellent “Relative Volume at Time” script by TradingView. Credit is given with appreciation.
⚠️ Disclaimer
This script is for educational purposes only.
It does not constitute financial advice, and past performance is not indicative of future results. Always do your own research and test strategies before making trading decisions.

MA Crossover Detector
The Moving Average Crossover Detector is a custom indicator that visually shows buy and sell signals clearly on the chart. based on the crossing of two moving averages — a popular and beginner-friendly tool in technical analysis.
It plots two moving averages — One fast (short period) and one slow (long period) — and highlights crossover points:
✅ Buy Signal (Golden Cross) – When the fast MA crosses above the slow MA.
❌ Sell Signal (Death Cross) – When the fast MA crosses below the slow MA.
✅ Features
Visual: Clearly shows crossovers on the chart.
Customizable: Choose periods, types, styles, etc.
Alert-ready: You can set alerts for crossovers.
The Moving Average (MA) Crossover Strategy is one of the simplest and most widely used strategies in technical analysis for trading stocks, forex, crypto, and other markets. It relies on the interaction between two moving averages to generate buy and sell signals.
Core Components
Short-Term Moving Average (Fast MA) : Reacts quickly to price changes (e.g., 9-period or 20-period).
Long-Term Moving Average (Slow MA) : Reacts more slowly to price changes (e.g., 21-period or 200-period).
How the Strategy Works
Bullish Crossover (Golden Cross):
Occurs when the fast MA crosses above the slow MA. Interpreted as a buy signal, indicating a potential uptrend.
Bearish Crossover (Death Cross):
Occurs when the fast MA crosses below the slow MA. Interpreted as a sell signal, indicating a potential downtrend.
Common Variants
Short-term trading
9 EMA
21 EMA
Swing trading
20 SMA
50 SMA
Long-term investing
50 SMA
200 SMA
Pros
Easy to understand and implement
Works well in trending markets
Can be automated for backtesting and execution
Cons
Lagging indicator: MAs are based on past prices, so signals come after the move has started.
Choppy markets = whipsaws: Generates false signals in sideways/range-bound conditions.
May underperform in volatile or mean-reverting environments
Tips for Improvement
Use confirmation tools : e.g., RSI, MACD, volume analysis, price action
Add filters : Trend filter (ADX), volatility filter (ATR), or time filter (session-based)
Combine with price structure : Support/resistance, breakouts, pullbacks

Breakout Confirmation🔍 Indicator Name: Breakout Confirmation (Body + Volume)
📌 Purpose:
This indicator is designed to detect high-probability breakout setups based on price structure and volume strength. It identifies moments when the market breaks through a key support or resistance level, confirmed by two consecutive strong candles with large real bodies and high volume.
⚙️ How It Works
1. Support and Resistance Detection
The indicator uses pivot points to identify potential horizontal support and resistance levels.
A pivot high or pivot low is considered valid if it stands out over a configurable number of candles (default: 50).
Only the most recent valid support and resistance levels are tracked and displayed as horizontal lines on the chart.
2. Breakout Setup
The breakout condition is defined as:
First Candle (Breakout Candle):
Large body (compared to the recent body average)
High volume (compared to the recent volume average)
Must close beyond a resistance or support level:
Close above resistance (bullish breakout)
Close below support (bearish breakout)
Second Candle (Confirmation Candle):
Also must have a large body and high volume
Must continue in the direction of the breakout (i.e., higher close in bullish breakouts, lower close in bearish ones)
3. Signal Plotting
If both candles meet the criteria, the indicator plots:
A green triangle below the candle for bullish breakouts
A red triangle above the candle for bearish breakouts
📈 How to Interpret the Signals
✅ Green triangle below a candle:
Indicates a confirmed bullish breakout.
The price has closed above a recent resistance level with strength.
The trend may continue higher — possible entry for long positions.
🔻 Red triangle above a candle:
Indicates a confirmed bearish breakout.
The price has closed below a recent support level with strength.
Potential signal to enter short or exit long positions.
⚠️ The plotted horizontal lines show the last key support and resistance levels. These are the zones being monitored for breakouts.
📊 How to Use It
Timeframe: Works best on higher timeframes (1H, 4H, Daily), but can be tested on any chart.
Entry: Consider entries after the second candle confirms the breakout.
Stop Loss:
For longs: Below the breakout candle or the broken resistance
For shorts: Above the breakout candle or broken support
Take Profit:
Based on previous structure, risk:reward ratios, or using trailing stops.
Filter with Trend or Other Indicators (optional):
You can combine this with moving averages, RSI, or market structure for confluence.
🛠️ Customization Parameters
lengthSR: How many candles to look back for identifying support/resistance pivots.
volLength: Length of the moving average for volume and body size comparison.
bodyMultiplier: Multiplier threshold to define a “large” body.
volMultiplier: Multiplier threshold to define “high” volume.
✅ Ideal For:
Price action traders
Breakout traders
Traders who use volume analysis
Anyone looking to automate the detection of breakout + confirmation setups

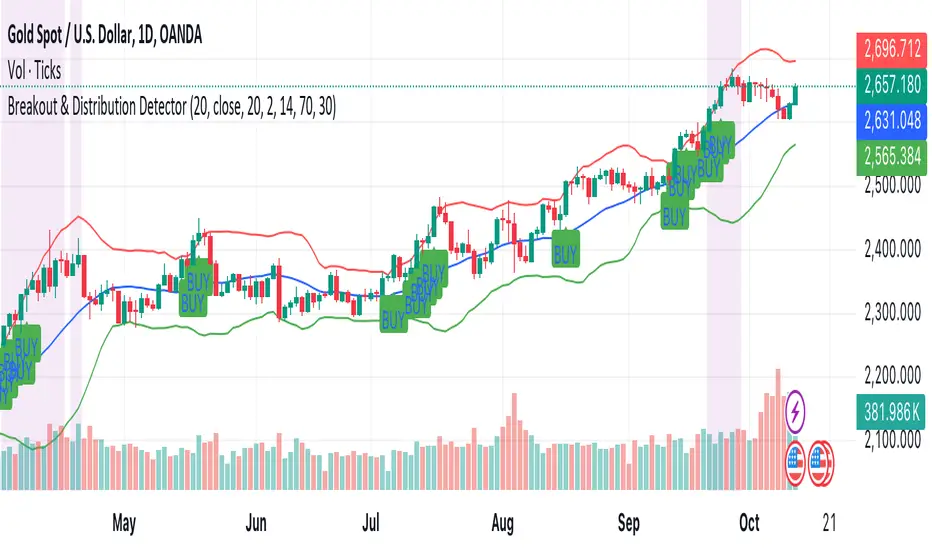
Breakout & Distribution DetectorHow the Script Works:
1. Bollinger Bands:
• The upper and lower Bollinger Bands are used to detect volatility and potential breakouts. When the price closes above the upper band, it’s considered a bullish breakout. When the price closes below the lower band, it’s a bearish breakout.
2. RSI (Relative Strength Index):
• The RSI is used for momentum confirmation. A bullish breakout is confirmed if the RSI is above 50, and a bearish breakout is confirmed if the RSI is below 50.
• If the RSI enters overbought (above 70) or oversold (below 30) levels, it signals a distribution phase, indicating the market may be ready to reverse or consolidate.
3. Moving Average:
• A simple moving average (SMA) of 20 periods is used to ensure we’re trading in the direction of the trend. Breakouts above the upper Bollinger Band are valid if the price is above the SMA, while breakouts below the lower Bollinger Band are valid if the price is below the SMA.
4. Signals and Alerts:
• BUY Signal: A green “BUY” label appears below the candle if a bullish breakout is detected.
• SELL Signal: A red “SELL” label appears above the candle if a bearish breakout is detected.
• Distribution Phase: The background turns purple if the market enters a distribution phase (RSI in overbought or oversold territory).
• Alerts: You can set alerts based on these conditions to get notifications for breakouts or when the market enters a distribution phase.
Breakouts & Pullbacks [Trendoscope®]🎲 Breakouts & Pullbacks - All-Time High Breakout Analyzer
Probability-Based Post-Breakout Behavior Statistics | Real-Time Pullback & Runup Tracker
A professional-grade Pine Script v6 indicator designed specifically for analyzing the historical and real-time behavior of price after strong All-Time High (ATH) breakouts. It automatically detects significant ATH breakouts (with configurable minimum gap), measures the depth and duration of pullbacks, the speed of recovery, and the subsequent run-up strength — then turns all this data into easy-to-read statistical probabilities and percentile ranks.
Perfect for swing traders, breakout traders, and anyone who wants objective, data-driven insight into questions like:
“How deep do pullbacks usually get after a strong ATH breakout?”
“How many bars does it typically take to recover the breakout level?”
“What is the median run-up after recovery?”
“Where is the current pullback or run-up relative to historical ones?”
🎲 Core Concept & Methodology
Indicator is more suitable for indices or index ETFs that generally trade in all-time highs however subjected to regular pullbacks, recovery and runups.
For every qualified ATH breakout, the script identifies 4 distinct phases:
Breakout Point – The exact bar where price closes above the previous ATH after at least Minimum Gap bars.
Pullback Phase – From breakout candle high → lowest low before price recovers back above the breakout level.
Recovery Phase – From the pullback low → the bar where price first trades back above the original breakout price.
Post-Recovery Run-up Phase – From the recovery point → current price (or highest high achieved so far).
Each completed cycle is stored permanently and used to build a growing statistical database unique to the loaded chart and timeframe.
🎲 Visual Elements
Yellow polyline triangle connecting Previous ATH / Pullback point(start), New ATH Breakout point (end), Recovery point (lowest pullback price), and extends to recent ATH price.
Small green label at the pullback low showing detailed tooltip on hover with all measured values
Clean, color-coded statistics table in the top-right corner (visible only on the last bar)
Powerful Statistics Table – The Heart of the Indicator
The table constantly compares the current situation against all past qualified breakouts and shows details about pullbacks, and runups that help us calculate the probability of next pullback, recovery or runup.
🎲 Settings & Inputs
Minimum Gap
The minimum number of bars that must pass between breaking a new ATH and the previous one.
Higher values = stricter filter → only the strongest, cleanest breakouts are counted.
Lower values = more data points (useful on lower timeframes or very trending instruments).
Recommendation:
Daily charts: 30–50
4H charts: 40–80
1H charts: 100–200
🎲 How to Use It in Practice
This indicator helps investors to understand when to be bullish, bearish or cautious and anticipate regular pullbacks, recovery of markets using quantitative methods.
The indicator does not generate buy/sell signals. However, helps traders set expectations and anticipate market movements based on past behavior.

Breakout Signals This indicator is a Pine Script tool for identifying potential trading opportunities using breakout signals. It provides two distinct types of breakout alerts and calculates a potential price target for one of them.
### Breakout Signal Types
* **Lowest Low Breakout:** This signal is triggered when the current bar closes above the high of the previous bar, and that previous bar had the lowest low within a user-defined lookback period. This indicates a potential bullish reversal after a short-term downtrend.
* **Highest High Breakout:** This signal occurs when the current bar's close price exceeds the highest high recorded within a specified lookback period. This pattern suggests strong bullish momentum and a potential continuation of an uptrend.
### Visuals and Alerts
The indicator helps visualize these signals on the chart by highlighting the background of entry candles. It uses a light green background for the Lowest Low Breakout and a light yellow for the Highest High Breakout. A table is displayed on the chart to show the details of the most recent Lowest Low Breakout and its calculated target. Additionally, it provides an alert feature to notify users in real time when either of the breakout conditions is met.

Breakout Detection using EMAs and Mansfield Relative StrengthThis script identifies breakout opportunities based on a combination of price action, volume, and relative strength. It is designed for daily timeframe charts and helps traders pinpoint strong bullish setups with the following criteria:
Price Action: Stock price is above both the 10-day EMA and 5-week EMA.
EMA Trends: The 10-day EMA is above the 20-day EMA, and the 5-week EMA is above the 10-week EMA, confirming bullish momentum.
Customizable Parameters: Customize the index for the Mansfield Relative Strength, the volume multiplier, and the price breakout look-back period.
Price Breakout: The price is at a 3-month high, indicating strength.
Volume Breakout: A volume spike occurs, surpassing the 20-day average volume by a user-defined multiplier.
Features:
Generates clear breakout signals with a green triangle below the bar.
Integrated Mansfield Relative Strength for relative performance analysis.
Alerts for when all conditions are met, ensuring you never miss an opportunity.
How to Use:
Add this script to a daily chart of your chosen stock.
Look for green triangle signals indicating a potential breakout.
Adjust the parameters to suit your trading strategy and preferred index for the Mansfield Relative Strength.
This tool is ideal for swing traders looking to combine technical analysis with relative strength metrics for high-conviction bullish setups.

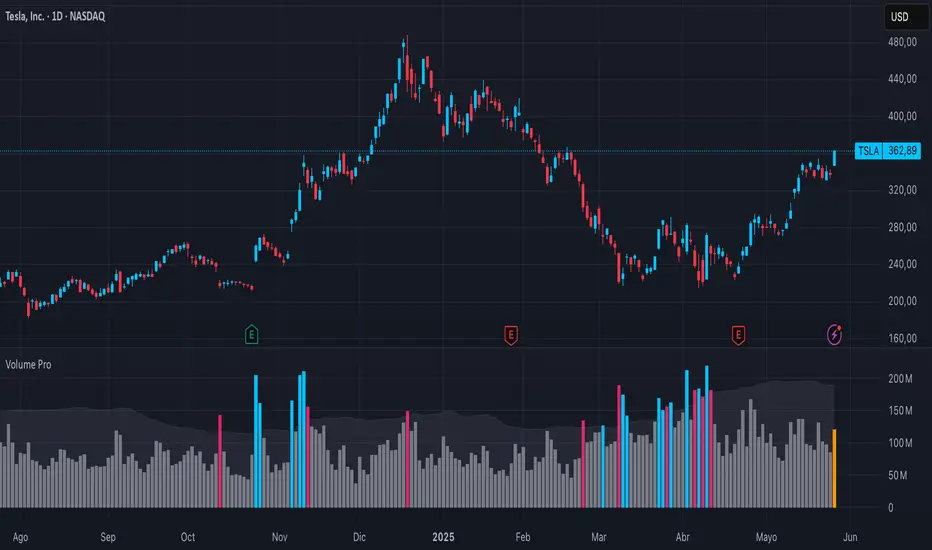
Breakout Volume PROBreakout Volume PRO
Real + Projected Volume Detection
This advanced volume indicator detects breakouts based on both actual and projected volume, allowing you to anticipate strong market moves before the current candle closes.
🔹 Key Features:
Volume breakout detection based on configurable moving average and multiplier.
Early signal when projected volume exceeds threshold before candle close.
Distinct coloring for bullish, bearish, and early breakout volume.
Customizable volume threshold area and base average.
Compatible with any timeframe, including daily and intraday.
Colors:
🔵 Blue: Bullish breakout
🔴 Red: Bearish breakout
🟠 Orange: Projected breakout in progress
⚪️ Gray: Normal volume
Perfect for identifying accumulation, distribution, or high-volume events that may precede price breakouts.
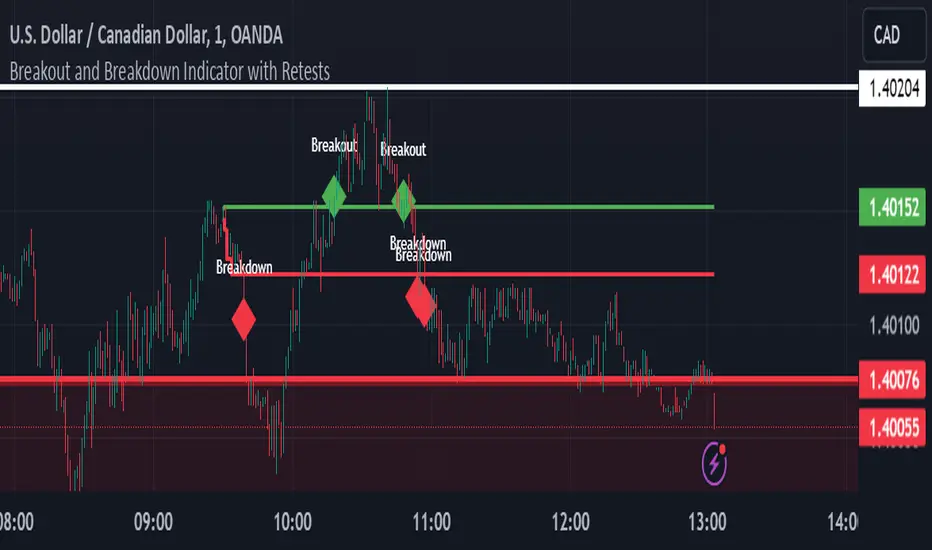
Breakout and Breakdown Indicator with RetestsThis indicator is designed to help traders identify high-probability breakout and breakdown points based on the first 5 minutes of market activity (9:30 am to 9:35 am). It works effectively on both the 1-minute and 5-minute timeframes, making it ideal for day traders and scalpers.
This indicator is a better indicator of my previous 5-Minute Opening Range Breakout indicator.
Key Features:
Dynamic Support and Resistance Lines: Automatically plots the highest and lowest price levels from 9:30 am to 9:35 am, providing essential support and resistance zones.
Breakout/Breakdown Detection: Identifies and marks successful breakout and breakdown points only after a confirmed retest, ensuring more accurate signals.
Visual Markers: Uses customizable green diamonds for successful breakouts and red diamonds for successful breakdowns, allowing easy identification on the chart.
Customization Options:
Change Colors: You can personalize the color of the breakout and breakdown markers, the label text, and the lines drawn from the 9:30 am to 9:35 am window.
Adapt to Your Chart: Adjust the indicator to match your preferred charting theme, ensuring it blends seamlessly with your trading setup.
How It Works:
Plots Key Levels: Identifies the highest and lowest prices during the first 5 minutes of trading (9:30 am to 9:35 am) and plots them on the chart.
Monitors Retests: Waits for a retest of these levels before confirming a breakout or breakdown.
Labels Breakouts/Breakdowns: After a retest, successful breakouts are marked with green diamonds and "Breakout" text, while breakdowns are marked with red diamonds and "Breakdown" text.
Why Use This Indicator?
Avoid False Signals: The retest requirement helps filter out false breakouts and breakdowns, offering more reliable trading signals.
Works Across Timeframes: Suitable for both 1-minute and 5-minute charts, allowing flexibility for different trading styles.
Some what Customizable: Adjust colors to fit your charting preferences and enhance visual clarity.
Recommended Use: Combine this indicator with other technical analysis tools, such as volume, candlestick patterns, or moving averages, for more informed trading decisions.