($ROSE Trader) Mean Multiple OscillatorThe ROSE Trader Mean Multiple Oscillator is an adaptation of The Mayer Multiple, using the 99-Day Simple Moving Average rather than the 200-Day (adjusted for ROSE's higher delta), setting distinct preset levels for ROSE overbought and oversold conditions.
Who is this indicator for?
While this indicator will function on any chart, it is setup for trading Oasis BINANCE:ROSEUSDT token specifically — the presets used are tailored to the ROSE chart.
While it is an open source public script, it has been released primarily for the ROSE community
What does this indicator offer?
This indicator follows the same concepts as the Mayer Multiple, popular with BTC. What makes it unique is that it the presets are setup specifically for the BINANCE:ROSEUSDT , based upon my trading experience.
About the Mayer Multiple:
The Mayer Multiple is a derivative of the 200-day MA, calculated by dividing the BTC market price by the 200-day MA. The 200-day MA is a widely recognised indicator for BTC in establishing macro bull or bear bias. The Mayer Multiple therefore represents a measure of distance away from this long-term average or mean price as a tool to gauge overbought and oversold conditions.
For BTC overbought, and oversold conditions, have historically coincided with Mayer Multiple values of 2.4, and 0.8 respectively.
Adapting this concept to the ROSE token:
The adaption of the Mayer Multiple offered here adjusts the 200-day MA to suit the higher delta or volatility of the BINANCE:ROSEUSDT token specifically. For ROSE I use the 99-day MA to establish macro bull or bear bias. The derived 'Mean Multiple', based on the 99-day MA therefore represents a measure of distance away from this long-term average or mean price as a tool to gauge overbought and oversold conditions.
For ROSE overbought, and oversold conditions, tend to coincide with values of 1.618, and 0.618 respectively. Further offsets have been preprogrammed to add nuance to the way this indicator may be used in different market conditions
The ROSE Trader Mean Multiple Oscillator:
The Oscillator version of this script is useful to determine possible levels that price is likely to reach overbought and over sold conditions by plotting the offsets and values directly on the price chart
Calculations:
99-Day Simple Moving Average (99D SMA) * by offset
This script is partnered with the "ROSE Trade Mean Multiple”: an adaptation of The Mayer Multiple, using the 99-Day Simple Moving Average rather than the 200-Day (adjusted for ROSE's higher delta), setting distinct preset levels for ROSE overbought and oversold conditions.
Note: this script is setup to work with any instrument, but the presets are built to provide actionable data on the Oasis BINANCE:ROSEUSDT token specifically. It is not a predicative model, it rather shows how price has behaved historically / statistically at these levels given past data.
Search in scripts for "btc走势预测"

($ROSE Trader) Mean MultipleThe ROSE Trader Mean Multiple is an adaptation of The Mayer Multiple, using the 99-Day Simple Moving Average rather than the 200-Day (adjusted for ROSE's higher delta), setting distinct preset levels for ROSE overbought and oversold conditions.
Who is this indicator for?
While this indicator will function on any chart, it is setup for trading Oasis BINANCE:ROSEUSDT token specifically — the presets used are tailored to the ROSE chart.
While it is an open source public script, it has been released primarily for the ROSE community
What does this indicator offer?
This indicator follows the same concepts as the Mayer Multiple, popular with BTC. What makes it unique is that it the presets are setup specifically for the BINANCE:ROSEUSDT , based upon my trading experience.
About the Mayer Multiple:
The Mayer Multiple is a derivative of the 200-day MA, calculated by dividing the BTC market price by the 200-day MA. The 200-day MA is a widely recognised indicator for BTC in establishing macro bull or bear bias. The Mayer Multiple therefore represents a measure of distance away from this long-term average or mean price as a tool to gauge overbought and oversold conditions.
For BTC overbought, and oversold conditions, have historically coincided with Mayer Multiple values of 2.4, and 0.8 respectively.
Adapting this concept to the ROSE token:
The adaption of the Mayer Multiple offered here adjusts the 200-day MA to suit the higher delta or volatility of the BINANCE:ROSEUSDT token specifically. For ROSE I use the 99-day MA to establish macro bull or bear bias. The derived 'Mean Multiple', based on the 99-day MA therefore represents a measure of distance away from this long-term average or mean price as a tool to gauge overbought and oversold conditions.
For ROSE overbought, and oversold conditions, tend to coincide with values of 1.618, and 0.618 respectively. Further offsets have been preprogrammed to add nuance to the way this indicator may be used in different market conditions
Calculations:
Mean Multiple is calculated by dividing the market price by the 99-Day Simple Moving Average (99D SMA). The indicator allows you to adjust the period if desired.
The indicator horizontals are set at regular offsets from Mean multiple (MM), these are calculated by multiplying the SMA from which the MM is derived by a set number to arrive at each offset, based upon historic price data.
The indicator horizontals may work as oversold and over bought levels, as they show the distance the price has moved from the mean, and how the Mean Multiple (as a derivation of price) has behaved at these levels historically
This script is partnered with the "ROSE Trade Mean Multiple Oscillator" which shows this data plotted on the price chart (This Oscillator is pictured in the chart but must be added separately, it can be found in my other public scripts)
Note: this script is setup to work with any instrument, but the presets are built to provide actionable data on the Oasis BINANCE:ROSEUSDT token specifically. It is not a predicative model, it rather shows how price has behaved historically / statistically at these levels given past data.

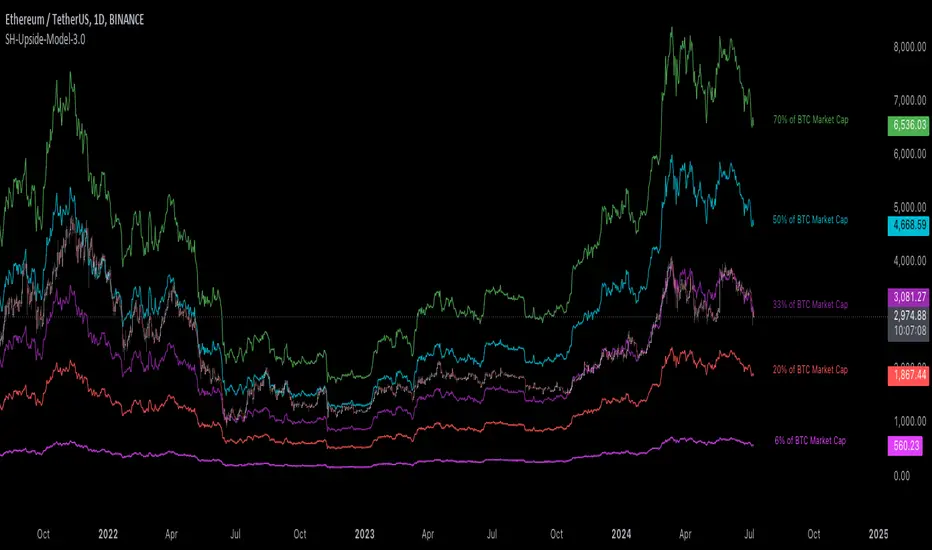
[Suitable Hope] Crypto Upside Model 3.0The "Crypto Upside Model 3.0" indicator dynamically calculates the potential price of any cryptocurrency based on various percentages of Ethereum or Bitcoin's market capitalization.
By fetching and analyzing marketcap data from TradingView sources, it allows traders to visualize potential price targets if their chosen cryptocurrency reaches specific market dominance levels. This tool is designed for daily timeframe analysis and can be used to set informed price expectations and strategic investment goals, providing valuable insights for long-term investment planning.
Why using the Crypto Upside Model 3.0?
Strategic Planning: Helps traders and investors set realistic price targets and investment goals by visualizing potential market cap scenarios.
Informed Decision-Making: Provides a data-driven approach to understanding how a cryptocurrency might perform relative to major assets like Bitcoin and Ethereum.
Customizable Analysis: Allows users to choose different comparison assets (ETH or BTC) and visualize various market cap dominance percentages, offering tailored insights.
Daily Timeframe Focus: Ideal for swing traders and long-term investors who operate on a daily analysis timeframe, providing relevant and actionable data.
Bull Markets: Identify potential price targets if your cryptocurrency's market cap increases significantly.
Bear Markets: Assess how much value could be retained relative to major cryptocurrencies.
Strategic Entry/Exit Points: Use the visualized targets to plan entry or exit points in your trading strategy.
Comparative Advantage
Dynamic Adaptation: Unlike fixed indicators, this tool adapts to any active chart, making it versatile for multiple cryptocurrencies.
Market Cap Insights: Provides a unique perspective by linking price targets to market cap dominance, a critical factor in the crypto market.
User Instructions
Setup: Add the " Upside Model 3.0" indicator to your TradingView chart.
Configuration: Use the input settings to select the comparison cryptocurrency (ETH or BTC) and enable the desired market cap percentage plots.
Analysis: The indicator will display potential price targets based on the selected market cap percentages, providing a visual guide for setting price expectations.
Limitations
Marketcap Data Availability: The indicator relies on marketcap data from TradingView, which may not be available for all cryptocurrencies. If the data is unavailable, the indicator will not function for that asset. This tool is more likely to work with older, established cryptocurrencies, as marketcap data for newer cryptocurrencies may not yet be available.
Daily Timeframe Restriction: The indicator is designed to work exclusively on the daily timeframe, limiting its applicability for intraday trading.
Assumptions of Market Dynamics: The calculations assume a direct correlation between market dominance and price, which may not account for other market dynamics and external factors influencing prices.
Data Accuracy: The accuracy of the indicator depends on the reliability of the data provided by TradingView, which may sometimes experience delays or inaccuracies.
Currently available cryptocurrencies: Bitcoin, Ethereum, Solana, Binance Coin, Cardano, Ripple, Polkadot, Avalanche, Chainlink, Litecoin, Dogecoin, Terra, Uniswap, VeChain, Stellar, Internet Computer, Hedera, Filecoin, Monero, Aave, TRON, NEAR Protocol, Compound, Maker,... For all compatible cryptocurrencies, please consult CRYPTOCAP's documentation.
Final notes
Although various sources ask a payment or user data for similar kind of private indicators, this one is entirely free and open source. "Uncanny" isn't it? I hope this indicator will provide you value. Feel free to leave a message if you have any questions or constructive feedback.
Examples of how I use this indicator
When using ETH's historical price as a reference compared to Bitcoin's marketcap, we can notice that price generally has been held between the +-30% and 50% lines of BTC's marketcap. If history is repeating again, we can expect major resistances around the 50% looking ahead into the future. This for me would be a great area to potentially reduce my ETH spot position.
When using SOL's historical price action, we can notice that the 15% line of ETH's marketcap has been a top in the previous cycle. Today SOL (July 2024), is back at this level. Could this be a top again or could price break this 15% level and head perhaps towards 30% which currently sits around $260? Time will tell.
These are 2 simple example of how I interpret the data. I'm keen to hear what other findings with other pairs you can find.
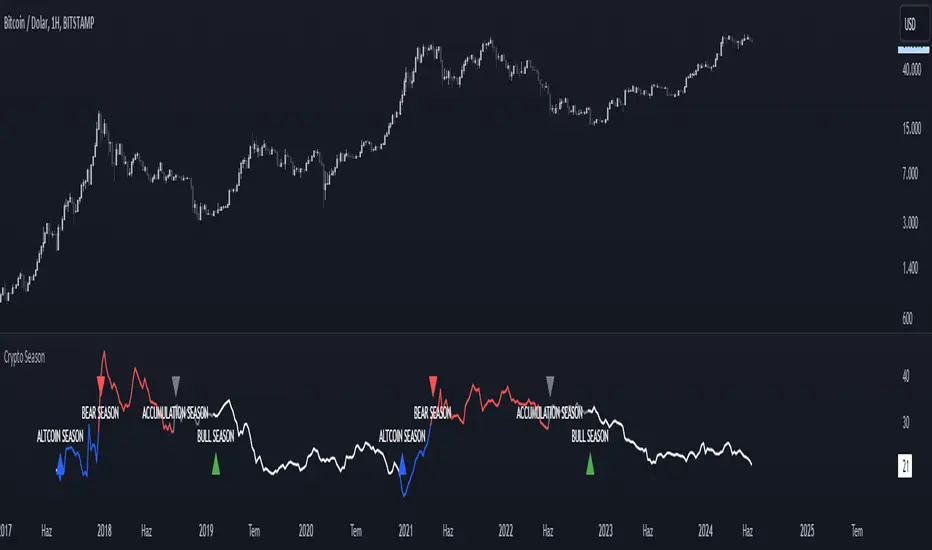
Crypto SeasonDefinition
This indicator is an informative indicator aiming to predict when the Altcoin season will start and when Bitcoin will enter the month season.
The average of the graph shows the dominance of altcoins other than BTC, ETH and USDT. If this value is over 30, the BTC says that the bull season is over. This value indicates that 20 to 30 BTC is in the bull season or accumulation. If this value is less than 20, it means that the subcoin season has begun.
Disclaimer
This indicator is for informational purposes only and should be used for educational purposes only. You may lose money if you rely on this to trade without additional information. Use at your own risk.
Version
v1.0
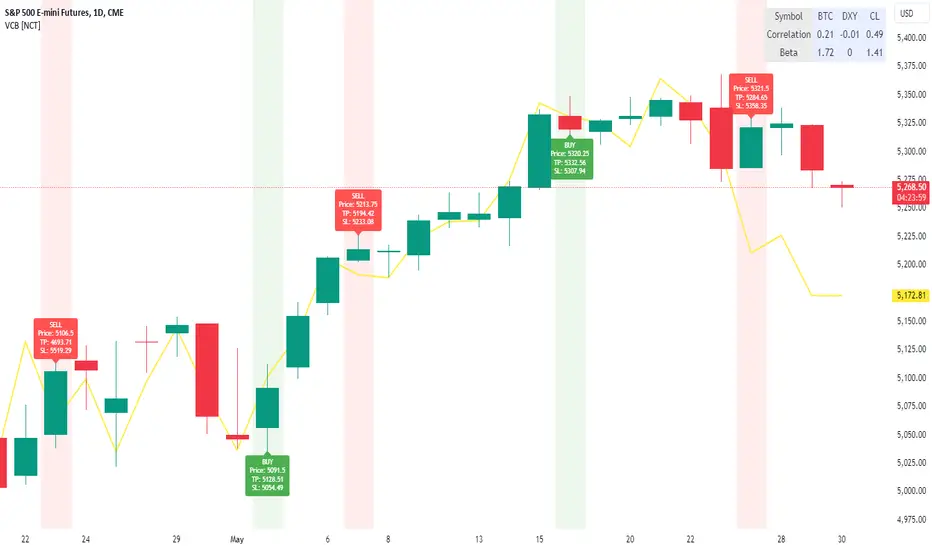
VolCorrBeta [NariCapitalTrading]Indicator Overview: VolCorrBeta
The VolCorrBeta indicator is designed to analyze and interpret intermarket relationships. This indicator combines volatility, correlation, and beta calculations to provide a comprehensive view of how certain assets (BTC, DXY, CL) influence the ES futures contract (I tailored this indicator to the ES contract, but it will work for any symbol).
Functionality
Input Symbols
BTCUSD : Bitcoin to USD
DXY : US Dollar Index
CL1! : Crude Oil Futures
ES1! : S&P 500 Futures
These symbols can be customized according to user preferences. The main focus of the indicator is to analyze how the price movements of these assets correlate with and lead the price movements of the ES futures contract.
Parameters for Calculation
Correlation Length : Number of periods for calculating the correlation.
Standard Deviation Length : Number of periods for calculating the standard deviation.
Lookback Period for Beta : Number of periods for calculating beta.
Volatility Filter Length : Length of the volatility filter.
Volatility Threshold : Threshold for adjusting the lookback period based on volatility.
Key Calculations
Returns Calculation : Computes the daily returns for each input symbol.
Correlation Calculation : Computes the correlation between each input symbol's returns and the ES futures contract returns over the specified correlation length.
Standard Deviation Calculation : Computes the standard deviation for each input symbol's returns and the ES futures contract returns.
Beta Calculation : Computes the beta for each input symbol relative to the ES futures contract.
Weighted Returns Calculation : Computes the weighted returns based on the calculated betas.
Lead-Lag Indicator : Calculates a lead-lag indicator by averaging the weighted returns.
Volatility Filter : Smooths the lead-lag indicator using a simple moving average.
Price Target Estimation : Estimates the ES price target based on the lead-lag indicator (the yellow line on the chart).
Dynamic Stop Loss (SL) and Take Profit (TP) Levels : Calculates dynamic SL and TP levels using volatility bands.
Signal Generation
The indicator generates buy and sell signals based on the filtered lead-lag indicator and confirms them using higher timeframe analysis. Signals are debounced to reduce frequency, ensuring that only significant signals are considered.
Visualization
Background Coloring : The background color changes based on the buy and sell signals for easy visualization (user can toggle this on/off).
Signal Labels : Labels with arrows are plotted on the chart, showing the signal type (buy/sell), the entry price, TP, and SL levels.
Estimated ES Price Target : The estimated price target for ES futures is plotted on the chart.
Correlation and Beta Dashboard : A table displayed in the top right corner shows the current correlation and beta values for relative to the ES futures contract.
Customization
Traders can customize the following parameters to tailor the indicator to their specific needs:
Input Symbols : Change the symbols for BTC, DXY, CL, and ES.
Correlation Length : Adjust the number of periods used for calculating correlation.
Standard Deviation Length : Adjust the number of periods used for calculating standard deviation.
Lookback Period for Beta : Change the lookback period for calculating beta.
Volatility Filter Length : Modify the length of the volatility filter.
Volatility Threshold : Set a threshold for adjusting the lookback period based on volatility.
Plotting Options : Customize the colors and line widths of the plotted elements.
TradingView.To Strategy Template (with Dyanmic Alerts)Hello traders,
If you're tired of manual trading and looking for a solid strategy template to pair with your indicators, look no further.
This Pine Script v5 strategy template is engineered for maximum customization and risk management.
Best part?
This Pine Script v5 template facilitates the dynamic construction of TradingView.TO alerts, sparing users the time and effort of mastering the TradingView.TO syntax and manually create alert commands.
This powerful tool gives much power to those who don't know how to code in Pinescript and want to automate their indicators' signals via TradingView.TO bot.
IMPORTANT NOTES
TradingView.TO is a trading bot software that forwards TradingView alerts to your brokers (examples: Binance, Oanda, Coinbase, Bybit, Metatrader 4/5, ...) for automating trading.
Many traders don't know how to create TradingView.TO dynamically-compatible alerts using the data from their TradingView scripts.
Traders using trading bots want their alerts to reflect the stop-loss/take-profit/trailing-stop/stop-loss to break options from your script and then create the orders accordingly.
This script showcases how to create TradingView.TO alerts dynamically.
TRADINGVIEW ALERTS
1) You'll have to create one alert per asset X timeframe = 1 chart.
Example: 1 alert for BTC/USDT on the 5 minutes chart, 1 alert for BTC/USDT on the 15-minute chart (assuming you want your bot to trade the BTC/USDT on the 5 and 15-minute timeframes)
2) Select the Order fills and alert() function calls condition
3) For each alert, the alert message is pre-configured with the text below
{{strategy.order.alert_message}}
Please leave it as it is.
It's a TradingView native variable that will fetch the alert text messages built by the script.
4) TradingView.TO uses webhook technology - setting a webhook URL from the alerts notifications tab is required.
KEY FEATURES
I) Modular Indicator Connection
* plug your existing indicator into the template.
* Only two lines of code are needed for full compatibility.
Step 1: Create your connector
Adapt your indicator with only 2 lines of code and then connect it to this strategy template.
To do so:
1) Find in your indicator where the conditions print the long/buy and short/sell signals.
2) Create an additional plot as below
I'm giving an example with a Two moving averages cross.
Please replicate the same methodology for your indicator, whether a MACD , ZigZag, Pivots , higher-highs, lower-lows or whatever indicator with clear buy and sell conditions.
//@version=5
indicator("Supertrend", overlay = true, timeframe = "", timeframe_gaps = true)
atrPeriod = input.int(10, "ATR Length", minval = 1)
factor = input.float(3.0, "Factor", minval = 0.01, step = 0.01)
= ta.supertrend(factor, atrPeriod)
supertrend := barstate.isfirst ? na : supertrend
bodyMiddle = plot(barstate.isfirst ? na : (open + close) / 2, display = display.none)
upTrend = plot(direction < 0 ? supertrend : na, "Up Trend", color = color.green, style = plot.style_linebr)
downTrend = plot(direction < 0 ? na : supertrend, "Down Trend", color = color.red, style = plot.style_linebr)
fill(bodyMiddle, upTrend, color.new(color.green, 90), fillgaps = false)
fill(bodyMiddle, downTrend, color.new(color.red, 90), fillgaps = false)
buy = ta.crossunder(direction, 0)
sell = ta.crossunder(direction, 0)
//////// CONNECTOR SECTION ////////
Signal = buy ? 1 : sell ? -1 : 0
plot(Signal, title = "Signal", display = display.data_window)
//////// CONNECTOR SECTION ////////
Important Notes
🔥 The Strategy Template expects the value to be exactly 1 for the bullish signal and -1 for the bearish signal
Now, you can connect your indicator to the Strategy Template using the method below or that one.
Step 2: Connect the connector
1) Add your updated indicator to a TradingView chart
2) Add the Strategy Template as well to the SAME chart
3) Open the Strategy Template settings, and in the Data Source field, select your 🔌Connector🔌 (which comes from your indicator)
Note it doesn’t have to be named 🔌Connector🔌 - you can name it as you want - however, I recommend an explicit name you can easily remember.
From then, you should start seeing the signals and plenty of other stuff on your chart.
🔥 Note that whenever you update your indicator values, the strategy statistics and visuals on your chart will update in real-time
II) BOT Risk Management:
- Max Drawdown:
Mode: Select whether the max drawdown is calculated in percentage (%) or USD.
Value: If the max drawdown reaches this specified value, set a value to halt the bot.
- Max Consecutive Days:
Use Max Consecutive Days BOT Halt: Enable/Disable halting the bot if the max consecutive losing days value is reached.
- Max Consecutive Days: Set the maximum number of consecutive losing days allowed before halting the bot.
- Max Losing Streak:
Use Max Losing Streak: Enable/Disable a feature to prevent the bot from taking too many losses in a row.
- Max Losing Streak Length: Set the maximum length of a losing streak allowed.
Margin Call:
- Use Margin Call: Enable/Disable a feature to exit when a specified percentage away from a margin call to prevent it.
Margin Call (%): Set the percentage value to trigger this feature.
- Close BOT Total Loss:
Use Close BOT Total Loss: Enable/Disable a feature to close all trades and halt the bot if the total loss is reached.
- Total Loss ($): Set the total loss value in USD to trigger this feature.
Intraday BOT Risk Management:
- Intraday Losses:
Use Intraday Losses BOT Halt: Enable/Disable halting the bot on reaching specified intraday losses.
Mode: Select whether the intraday loss is calculated in percentage (%) or USD.
- Max Intraday Losses (%): Set the value for maximum intraday losses.
Limit Intraday Trades:
- Use Limit Intraday Trades: Enable/Disable a feature to limit the number of intraday trades.
- Max Intraday Trades: Set the maximum number of intraday trades allowed.
Restart Intraday EA:
III) Order Types and Position Sizing
- Choose between market or limit orders.
- Set your position size directly in the template.
Please use the position size from the “Inputs” and not the “Properties” tab.
I know it's redundant. - the template needs this value from the "Inputs" tab to build the alerts, and the Backtester needs it from the "Properties" tab.
IV) Advanced Take-Profit and Stop-Loss Options
- Choose to set your SL/TP in either USD or percentages.
- Option for multiple take-profit levels and trailing stop losses.
- Move your stop loss to break even +/- offset in USD for “risk-free” trades.
V) Miscellaneous:
Retry order openings if they fail.
Order Types:
Select and specify order type and price settings.
Position Size:
Define the type and size of positions.
Leverage:
Leverage settings, including margin type and hedge mode.
Session:
Limit trades to specific sessions.
Dates:
Limit trades to a specific date range.
Trades Direction:
Direction: Specify the market direction for opening positions.
VI) Logger
The TradingView.TO commands are logged in the TradingView logger.
You'll find more information about it in this TradingView blog post .
WHY YOU MIGHT NEED THIS TEMPLATE
1) Transform your indicator into a TradingView.TO trading bot more easily than before
Connect your indicator to the template
Create your alerts
Set your EA settings
2) Save Time
Auto-generated alert messages for TradingView.TO.
I tested them all and checked with the support team what could/couldn’t be done.
3) Be in Control
Manage your trading risks with advanced features.
4) Customizable
Fits various trading styles and asset classes.
REQUIREMENTS
* Make sure you have your TradingView.TO account
* If there is any issue with the template, ask me in the comments section - I’ll answer quickly.
BACKTEST RESULTS FROM THIS POST
1) I connected this strategy template to a dummy Supertrend script.
I could have selected any other indicator or concept for this script post.
I wanted to share an example of how you can quickly upgrade your strategy, making it compatible with TradingView.TO.
2) The backtest results aren't relevant for this educational script publication.
I used realistic backtesting data but didn't look too much into optimizing the results, as this isn't the point of why I'm publishing this script.
This strategy is a template to be connected to any indicator - the sky is the limit. :)
3) This template is made to take 1 trade per direction at any given time.
Pyramiding is set to 1 on TradingView.
The strategy default settings are:
* Initial Capital: 100000 USD
* Position Size: 1%
* Commission Percent: 0.075%
* Slippage: 1 tick
* No margin/leverage used

Bullish Divergence Short-term Long Trade FinderThis script is a Bullish divergence trade finder built to find small periods where Bitcoin will likely rise from. It looks for bullish divergence followed by a higher low as long as the hour RSI value is below the 40 mark, if then it will enter an long. It marks out Buy signals on the RSI if the value dips below 'RSI Bull Condition Minimum' (Default 40) on the current time frame in view. It also marks out Sell signals found when the RSI is above the 'RSI Bearish Condition Minimum' (Default 50). The sell signals are bearish divergence that has occurred recently on the RSI. When a long is in play it will sell if it finds bearish divergence or the time frame in view reaches RSI value higher than the 'RSI Sell Value'(Default 75). You can set your stop loss value with the 'Stop loss Percentage' (default 5).
Available inputs:
RSI Period: relative strength measurement length(Typically 14)
RSI Oversold Level: the bottom bar of the RSI (Typically 30)
RSI Overbought Level: the top bar of the RSI (Typically 70)
RSI Bearish Condition Minimum: The minimum value the script will use to look for a pivot high that starts the Bearish condition to Sell (Default 50)
RSI Bearish Condition Sell Min: the minimum value the script will accept a bearish condition (Default 60)
RSI Bull Condition Minimum: the minimum value it will consider a pivot low value in the RSI to find a divergence buy (Default 40)
Look Back this many candles: the amount of candles thee script will look back to find a low value in the RSI (Default 25)
RSI Sell Value: The RSI value of the exit condition for a long when value is reached (Default 75)
Stop loss Percentage: Percentage value for amount to lose (Default 5)
The formula to enter a long is stated below:
If price finds a lower low and there is a higher low found following a lower low and price has just made another dip and price closes lower than the last divergence and Relative strength index hour value is less than 40 enter a long.
The formula to exit a long is stated below:
If the value drops below the stop loss percentage OR (the RSI value is greater than the value of the parameter 'RSI Sell Value' or bearish divergence is found greater than the parameter 'RSI Bearish Condition Minimum' )
This script was built from much strategy testing on BTC but works with alts (occasionally) also. It is most successful to my knowledge using the 15 min and 7 min time frames with default values. Hope it helps! Follow for further possible updates to this script or other entry or exit strategies.
snapshot:
I only have a Pro trading view account so I cannot share a larger data set about this script because the buy signals happen pretty rarely. The most amount that I could find within a view for me was 40 trades within a viewable time. The suggested/default parameters that I have do not occur very often so it limits the data set. Adjustments can be made to the parameters so that trades can be entered more often. The scripts success is dependent on the values of the parameters set by the user. This script was written to be used for BTC/USD or BTC/USDT trading. I am unable to share a larger dataset without putting out results that are intended to fail or having a premium account so reaching the 100 trade minimum is not possible with my account.

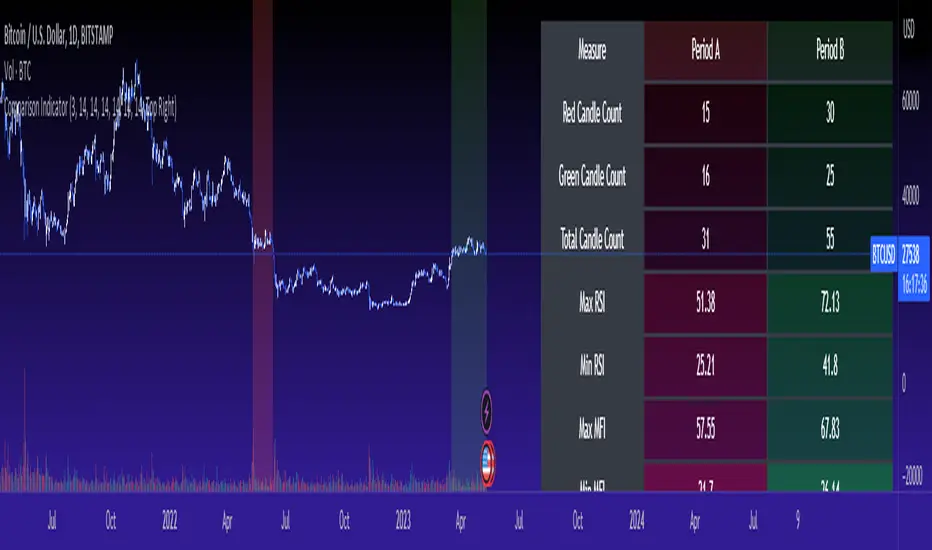
Cross Period Comparison IndicatorReally excited to be sharing this indicator!
This is the cross-period comparison indicator, AKA the comparison indicator.
What does it do?
The cross-period comparison indicator permits for the qualitative assessment of two points in time on a particular equity.
What is its use?
At first, I was looking for a way to determine the degree of similarity between two points, such as using Cosine similarity values, Euclidean distances, etc. However, these tend to trigger a lot of similarities but without really any context. Context matters in trading and thus what I wanted really was a qualitative assessment tool to see what exactly was happening at two points in time (i.e. How many buyers were there? What was short interest like? What was volume like? What was the volatility like? RSI? Etc.)
This indicator permits that qualitative assessment, displaying things like total buying volume during each period, total selling volume, short interest via Put to Call ratio activity, technical information such as Stochastics and RSI, etc.
How to use it?
The indicator is fairly self explanatory, but some things require a little more in-depth discussion.
The indicator will display the Max and Min technical values of a period, as well as a breakdown in the volume information and put to call information. The user can then make the qualitative determination of degrees of similarity. However, I have included some key things to help ascertain similarity in a more quantitative way. These include:
1. Adding average period Z-Score
2. Adding CDF probability distributions for each respective period
3. Adding Pearson correlations for each respective period over time
4. Providing the linear regression equation for each period
So let us discuss these 4 quantitative measures a bit more in-depth.
Adding Period Z-Score
For those who do not know, Z-Score is a measure of the distance from a mean. It generally spans 0 (at the mean) to 3 (3 standard deviations away from the mean). Z-Score in the stock market is very powerful because it is actually our indicator of volatility. Z-Score forms the basis of IV for option traders and it generally is the go to, to see where the market is in relation to its overall mean.
Adding Z-Score lets the user make 2 big determinations. First and foremost, it’s a measure of overall volatility during the period. If you are getting a Z-Score that is crazy high (1.5 or greater), you know there was a lot of volatility in that period marked by frequent deviations from its mean (since on average it was trading 1.5 standard deviations away from its mean).
The other thing it tells you is the overall sentiment of that time. If the average Z Score was 1.5 for example, we know that buying interest was high and the sentiment was somewhat optimistic, as the stock was trading, on average, + 1.5 SDs away from its mean.
If, on the other hand, the average was, say, - 1.2, then we know the sentiment was overall pessimistic. There was frequent selling and the stock was frequently being pushed below its mean with heavy selling pressure.
We can also check these assumptions of buying / selling buy verifying the volume information. The indicator will list the Buy to Sell Ratio (number of Buyers to Sellers), as well as the total selling volume and total buying volume. Thus, the user can see, objectively, whether sellers or buyers led a particular period.
Adding CDF Probability
CDF probabilities simply mean the extent a stock traded above or below its normal distribution levels.
To help you understand this, the indicator lists the average close price for a period. Directly below that, it lists the CDF probabilities. What this is telling you, is how often and how likely, during that period, the stock was trading below its average. For example, in the main chart, the average close price for BTC in Period A is 29869. The CDF probability is 0.51. This means, during Period A, 51% of the time, BTC was trading BELOW 29869. Thus, the other 49% of the time it was trading ABOVE 29869.
CDF probabilities also help us to assess volatility, similar to Z-Score. Generally speaking, the CDF should consistently be reading about 0.50 to 0.51. This is the point of an average value, half the values should be above the average and half the values should be below. But in times of heightened volatility, you may actually see the CDF creep up to 0.54 or higher, or 0.48 or lower. This means that there was extremely extensive volatility and is very indicative of true “whipsaw” type price action history where a stock refuses to average itself out in one general area and frequently jumps up and down.
Adding Pearson Correlation
Most know what this is, but just in case, the Pearson correlation is a measure of statistical significance. It ranges from 0 (not significant) to 1 (very significant). It can be positive or negative. A positive signifies a positive relationship (i.e. as one value increases so too does the other value being compared). If it is a negative value, it means an inverse relationship (i.e. one value increases proportionately to the other’s decline).
In this indicator, the Pearson correlation is measured against time. A strong positive relationship (a value of 0.5 or greater) indicates that the stock is trading positive to time. As time goes by, the stock goes up. This is a normal relationship and signifies a healthy uptrend.
Inversely, if the Pearson correlation is negative, it means that as time increases, the stock is going down proportionately. This signifies a strong downtrend.
This is another way for the user to interpret sentiment during a specific period.
IF the Pearson correlation is less than 0.5 or -0.5, this signifies an area of indecision. No real trend formed and there was no real strong relationship to time.
Adding Linear Regression Equation
A linear regression equation is simply the slope and the intercept. It is expressed with the formula y= mx + b.
The indicator does a regression analysis on each period and presents this formula accordingly. The user can see the slope and intercept.
Generally speaking, when two periods share the same slope (m value) but different intercept (b value), it can be said that the relationship to time is identical but the starting point is different.
If the slope and intercept are different, as you see in the BTC chart above, it represents a completely different relationship to time and trajectory.
Indicator Specific Information:
The indicator retains the customizability you would expect. You can customize all of your lengths for technical, change and Z-Score. You can toggle on or off Period data, if you want to focus on a single period. You can also toggle on a difference table that directly compares the % difference between Period A to Period B (see image below):
You will also see on the input menu a input for “Threshold” assessments. This simply modifies the threshold parameters for the technical readings. It is defaulted to 3, which means when two technical (for example Max Stochastics) are within +/- 3 of each other, the indicator will light these up as green to indicate similarities. They just clue the user visually to areas where there are similarities amongst the qualitative technical data.
Timeframes
This is best used on the daily timeframe. You can use it on the smaller timeframe but the processing time may take a bit longer. I personally like it for the Daily, Weekly and 4 hour charts.
And this is the indicator in a nutshell!
I will provide a tutorial video in the coming day on how to use it, so check back later!
As always, leave your comments/questions and suggestions below. I have been slowly modifying stuff based on user suggestions so please keep them coming but be patient as it does take some time and I am by no means a coder or expert on this stuff.
Safe trades to all!
Typical Price Difference - TPD © with reversal zones and signalsv1.0 NOTE: The maths have been tested only for BTC and weekly time frame.
This is a concept that I came through after long long hours of VWAP trading and scalping.
The idea is pretty simple:
1) Typical Price is calculated by (h+l+c) / 3. If we take this price and adjust it to volume we get the VWAP value. The difference between this value and the close value, i call it " Typical Price Difference - TPD ".
2) We get the Historical Volatility as calculated by TradingView script and we add it up to TPD and divide it by two (average). This is what I call " The Source - TS ".
3) We apply the CCI formula to TS .
4) We calculate the Rate of Change (roc) of the CCI formula.
5) We apply the VIX FIX of Larry Williams (script used is from ChrisMoody - CM_Williams_Vix_Fix Finds Market Bottoms) *brilliant script!!!
How to use it:
a) When the (3) is over the TPD we have a bullish bias (green area). When it's under we have a bearish bias (red area).
b) If the (1) value goes over or under a certain value (CAUTION!!! it varies in different assets or timeframes) we get a Reversal Zone (RZ). Red/Green background.
c) If we are in a RZ and the VIX FIX gives a strong value (look for green bars in histogram) and roc (4) goes in the opposite direction, we get a reversal signal that works for the next week(s).
I applied this to BTC on a weekly time frame and after some corrections, it gives pretty good reversal zones and signals. Especially bottoms. Also look for divergences in the zones/signals.
As I said I have tested and confirmed it only on BTC/weekly. I need more time with the maths and pine to automatically adjust it to other time frames. You can play with it in different assets or time frames to find best settings by hand.
Feel free to share your thoughts or ideas on this.
P.S. I realy realy realy try to remember when or how or why I came up with the idea to combine typical price with historical volatility and CCI. I can't! It doesn't make any sense LOL

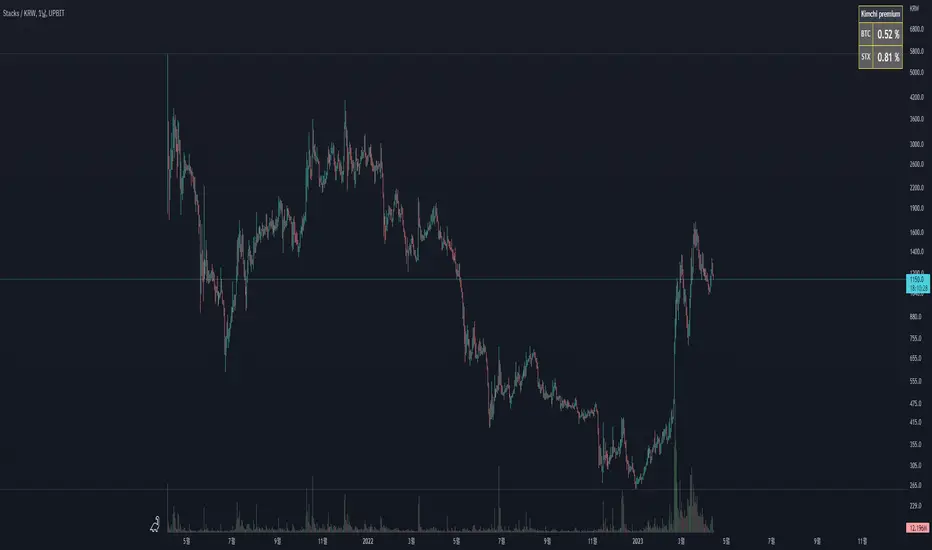
Kimchi Premium watchThis indicator provides easy-to-see Kimchi premium information.
It provides three pieces of information.
1. Current premium
2. The highest value of the premium over the last 240 candlesticks in the current timeframe.
3. The highest value of the premium over the last 240 candlesticks in the current timeframe.
I think this script is a very simple indicator.
It is usually recommended to get value in a large time frame.
The basic operation formula is as follows.
premium(percent) = ( BTC KRW - ( BTC USDT x USD KRW ) / ( BTC USDT x USDT USD x USD KRW )) x 100
Thank you.
Price Divergence IndicatorThis Price Divergence Indicator indicator modifies the standard Divergence Indicator to look for price divergences between the current chart and any other selected TradingView chart.
The thesis that this indicator is built upon:
Prices on assets or indices that are normally correlated move in lock step. Where there are deviations between the confirmed highs or lows of two assets or indices it is likely that they will "catch up" in the near future.
By default it will load the price data for the SPX and look for price divergences on the current chart timeframe. Any TradingView Symbol can be selected as the 'Comparison Source' and any timeframe. Some of the options I've been trying out include:
SPX vs NDQ
XAO vs SPX
UK100 vs NDQM
MSFT vs NDQM
GOOG vs NDQM
AMZN vs MSFT
BTC vs ETH
BTC vs NDQ
BTC vs DXY
I've found looking for divergences on a longer timeframe can be useful and don't expect any meaningful results if you set it to shorter than chart timeframes.
Alerts can be created based on any of the divergences and the 'Backtest Buy Signal' can be used to send notification to a backtester (bull = 2, hidden bull = 1, neutral = 0, hidden bear = -1, bear = -2), this is plotted to display.none, so enable it in Settings - Style and disable all other plots to see it.
Divergences are measured between the CONFIRMED peaks of the two charts. The confirmation timeframe is set using 'Pivot Lookback Right'. The lower the lookback the quicker the signal and the more likely it is to not have hit an actual peak, a higher lookback will give a much more dependable signal but the move may be finished by the time the alert actually fires. The "Plot When Alerts Fire" option should give you an idea (top and bottom triangles) of what to expect, but you should watch bar replays to understand how your setting will impact when alerts are created and potential false positives.

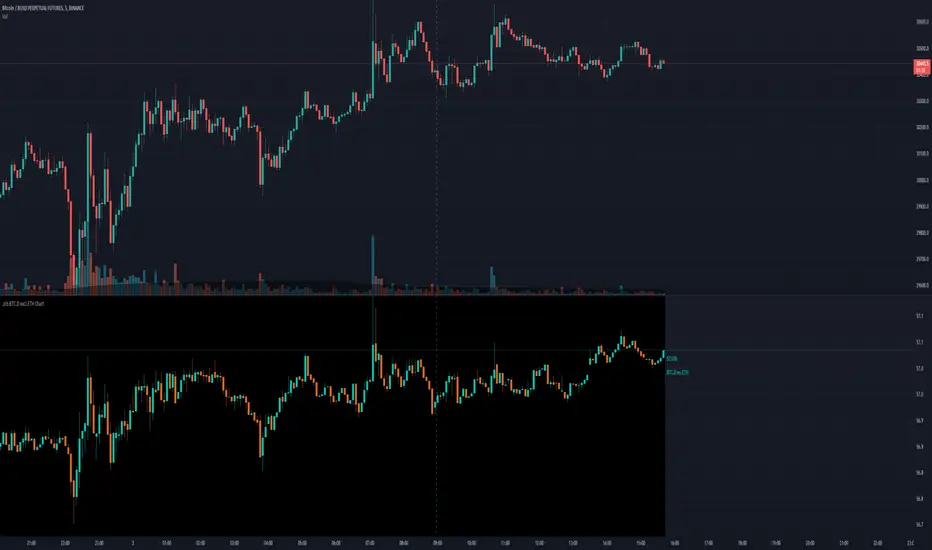
.srb BTC.D excl.ETH Chart.srb BTC dominance excl.ETH Chart
Thanks for BTC dominance excl.ETH Idea to @BLUE43 on tradingview.
The script (originaly .srb) may be freely distributed under the MIT license.
Basic calc :
BTC.D excl.ETH = ( CRYPTOCAP:BTC / ( CRYPTOCAP:TOTAL - CRYPTOCAP:ETH )) * 100
You can switch Candle - Line
On/Off Tracking line
On/Off Last Price Label
On/Off BTC.D excl.ETH <----> regular BTC.D
Everything Bitcoin [Kioseff Trading]Hello!
This script retrieves most of the available Bitcoin data published by Quandl; the script utilizes the new request.security_lower_tf() function.
Included statistics,
True price
Volume
Difficulty
My Wallet # Of Users
Average Block Size
api.blockchain size
Median Transaction Confirmation Time
Miners' Revenue
Hash Rate
Cost Per Transaction
Cost % of Transaction Volume
Estimated Transaction Volume USD
Total Output Volume
Number Of Transactions Per Block
# of Unique BTC Addresses
# of BTC Transactions Excluding Popular Addresses
Total Number of Transactions
Daily # of Transactions
Total Transaction Fees USD
Market Cap
Total BTC
Retrieved data can be plotted as line graphs; however, the data is initially split between two tables.
The image above shows how the requested Bitcoin data is displayed.
However, in the user inputs tab, you can modify how the data is displayed.
For instance, you can append the data displayed in the floating statistics box to the stagnant statistics box.
The image above exemplifies the instance.
You can hide any and all data via the user inputs tab.
In addition to data publishing, the script retrieves lower timeframe price/volume/indicator data, to which the values of the requested data are appended to center-right table.
The image above shows the script retrieving one-minute bar data.
Up arrows reflect an increase in the more recent value, relative to the immediately preceding value.
Down arrows reflect a decrease in the more recent value relative to the immediately preceding value.
The ascending minute column reflects the number of minutes/hours (ago) the displayed value occurred.
For instance, 15 minutes means the displayed value occurred 15 minutes prior to the current time (value).
Volume, price, and indicator data can be retrieved on lower timeframe charts ranging from 1 minute to 1440 minutes.
The image above shows retrieved 5-minute volume data.
Several built-in indicators are included, to which lower timeframe values can be retrieved.
The image above shows LTF VWAP data. Also distinguished are increases/decreases for sequential values.
The image above shows a dynamic regression channel. The channel terminates and resets each fiscal quarter. Previous channels remain on the chart.
Lastly, you can plot any of the requested data.
The new request.security_lower_tf() function is immensely advantageous - be sure to try it in your scripts!

[CP]Pivot Boss Multi Timeframe CPR Inception with MACD and EMAINTRODUCTION:
This indicator combines multi-timeframe CPR bands with MACD Momentum and EMA trend, all projected on the candlestick chart through a novel visualization.
If you have seen my other indicators on TradingView, you would know that I use floor pivots a lot and “Secrets of a Pivot Boss” is my favorite book. While using floor pivots, time and again I have noticed an interesting price behavior,
Trending moves in price typically start from around the Central Pivot Range (CPR). The CPR could be from ANY timeframe. These moves can easily be caught using simple momentum and trend indicators like MACD and EMA crossovers.
Yes, it is that simple. Follow along to understand how to use this indicator.
INDICATOR SETTINGS:
RANGEBOUND MACD AND EMA MARKINGS:
TradingView limits the max number of labels that can be shown on a chart to 500. Therefore, if you go far back enough, you won't see any markings for the MACD or EMA setups. If you are looking to test the efficacy of this indicator in the past, change the start and end dates to your desired timeframe and then select the ‘Mark MACD and EMA Setups in Range?’ option.
MULTI TIMEFRAME CENTRAL PIVOT RANGE:
Here you can select CPRs and their bands from which timeframes are shown on the chart. I will share my favorite settings later in this description.
CPR CONFIGURATION:
Show CPR Labels: CPRs markings can carry labels, so that you don’t confuse between which line is what. Use this setting to toggle them On/Off.
Show Next Time Period Pivots: Check this option if you want to see the CPR of the next time period. This is typically done to figure out the ’Two Day CPR Relationship’ . Read the book, “Secrets of a Pivot Boss”, to understand more.
EMA TREND:
Show EMA on the Chart: EMAs will be plotted on the chart. Standard stuff.
Mark EMA Crossovers on Chart: EMA crossovers will be marked on the chart in diamond shapes. If you are using EMA crossovers, I recommend setting this option to True.
Rest of the EMA settings are fairly obvious.
MACD MOMENTUM:
Projecting MACD parameters directly on the candlesticks is surely going to give you a new perspective about price action and MACD.
Also, in order to better understand the MACD projections on the chart, you can add a standard MACD indicator on the chart with default settings to figure out what my indicator is actually showing you.
Marking MACD Crossovers on Chart: Marks the MACD signal crossovers on the chart. This visualization was a game changer for me.
Show MACD Histogram on Chart: Projects the complete MACD Histogram in a novel fashion (Try it!). You will be able to visually see the ebbs and flow of momentum in the charts.
Mark MACD Histogram Peaks on Chart: Marks only the MACD peaks instead of the complete histogram. Peaks are a great way to enter an ongoing trend and to play an intraday rangebound market.
Rest of the settings are just the standard settings that you will find in a typical MACD indicator.
ALERTS:
Not shown in the settings panel, but I have added alerts for EMA and MACD Crossovers so that you don’t have to sit in front of the charts or constantly check the price all day long.
If you don’t know how to set alerts in TradingView, then please Google it.
INDICATOR USAGE EXAMPLES:
This indicator can be used in intraday as well as in higher timeframes.
There are quite a few variations possible, I personally prefer to use the EMA crossovers in intraday (5m) and MACD on Daily timeframes.
This is just a matter of personal preference, some people might prefer using EMAs only or MACD only in all timeframes.
Here are my personal settings for the intraday 5-minute timeframe:
Turn on all the CPR pivots starting from Yearly all the way to Daily. You can turn on 6 hourly and 4 hourly as well if you want.
Hourly CPR is mostly used when the price is in a strong trend and you missed the entry and don’t know when to enter. Price will typically experience pullbacks towards the Hourly CPR, before resuming in the direction of the trend. That is your chance to hop onto the bandwagon.
For Intraday, I keep the Bands off. Just a personal preference here.
You can turn ON the Show CPR Labels , if you want.
Turn ON both the options in the EMA TREND section. You would want to see the EMA crossovers marked on the chart as well as the EMAs themselves, as the distance between the two EMAs will give you an idea about the strength of the trend.
Keep rest of the settings in the EMA section as default (you can change the colors if you wish). I keep the same EMAs as the ones kept in the MACD indicator. I like to keep things simple.
In the MACD MOMENTUM section, turn ON Mark MACD Histogram Peaks on Chart and all the other options turned OFF. Leave the other settings as default. By the way, these are the default settings of the standard MACD Indicator.
You can set up EMA Bullcross and Bearcross alarms if you like.
Before checking out the examples, remember one super simple rule:
SOME OF THE BEST TRENDING MOVES IN THE MARKET, BE IT INTRADAY OR OTHERWISE, ORIGINATE IN THE VICINITY OF A LARGER TIMEFRAME PIVOT/CPR.
Look for price settling above/below a pivot, and then a move away from the pivot in any direction is typically a trending move.
You can use hourly pivots or MACD Histogram peaks marked on the chart to enter an existing trend, or add to your positions.
Let’s have a look at a few recent intraday examples from the Crypto, Indian, and US equity markets.
I have added my comments in the charts to make you easily understand what is going on.
Understand that both, moving average crossover and MACD, will give out a lot of signals (chop) every day. But almost 70% of them are going to be fake signals. It is the signals that you get when the price is near a Pivot, that tend to convert into gorgeous trending moves that last.
BTC 5m Charts
NIFTY Futures 5m Charts (good intraday trends are hard to find here, as the market is very efficient)
TSLA 5m Charts
Some important points for using this indicator in higher timeframes:
For higher timeframes, my personal preference is to go with the MACD indicator. I personally find MACD to be lethal on daily and weekly timeframes, if you know how to use it well.
The default settings of the indicator are the settings I use for both, Daily and Weekly, timeframes. Additionally, I turn off the CPR labels.
In theory large trending moves still have a big probability to start near an important pivot level, however, in larger timeframes, trending moves can start from anywhere. They need not start in the vicinity of any important pivot (but they often do!).
Weekly pivots can act as great pullback levels when the price is in strong momentum, when trading on the daily timeframe.
Quarterly Pivots act as great pullback levels when the price is in strong momentum, when trading on the weekly timeframe.
BTC Weekly Chart
BTC Daily Chart
Nifty Weekly Chart
Nifty Daily Chart
NASDAQ Weekly Chart
NASDAQ Daily Chart
FINAL WORDS:
Please understand that I have Cherry Picked the examples to showcase the capability of the indicator and its usage.
DO NOT conflate the accuracy of examples with the accuracy of this indicator.
Biggest catch is the fact that this indicator, like every other indicator out there, will have whipsaws. Some I have also marked in the example charts.
You need to come up with your own technique to avoid whipsaws, one technique I have shared here…… big moves typically start near pivots.
Work on avoiding whipsaws and finding you own edge in the markets.
If you really want to learn how to use Pivots, read the book ’Secrets of a Pivot Boss’ . This book can change your life.

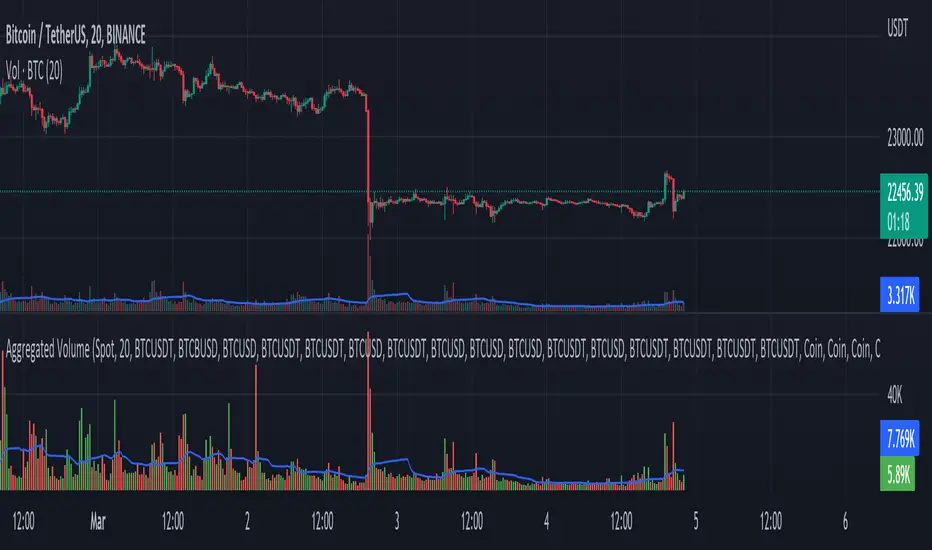
Aggregated Volume - By InFinitoVolume indicator that works like a normal Volume indicator with the following additional features:
- Aggregates Volume across different exchanges and Market Types - *Original Aggregation Code By Crypt0rus*
- Displays data by Market Type and combinations of Market Types (Spot, Futures , Perpetuals, Futures+Perpetuals & All Volume )
- Allows for the user to select the exchanges from which to aggregate Volume (This allows for the aggregation of any other pair i.e ETH, SOL, LUNA)
- Normalizes the Volume reported through TradingView by every exchange in order to homogenize the data (i.e Binance reports Bitcoin Volume in BTC terms BUT FTX reports Bitcoin Volume in USD)
- Allows for manual input of how Volume is reported in a particular Pair/Exchange (i.e If you want to aggregate data from the BTCEUR pair, you can select 'Other' and introduce the Value of EUR in USD terms)
COIN: Select this option if the volume is reported in terms of the asset traded ( BTC , ETH, SOL, etc....)
USD: Select this option if the Volume is reported in terms of the USD amount traded
OTHER: Select this option in case the Volume is reported in another currency (EUR, ETH, etc....)
NOTE: *ALL VOLUME IS AGGREGATED IN TERMS OF THE ASSET TRADED, FOR EXAMPLE IN THIS CASE: BTC . BUT IF YOU'RE AGGREGATING BNB PAIRS, VOLUME WILL BE CALCULATED TO BE DISPLAYED IN BNB TERMS*
Feel free to leave suggestions/questions in the comments or to message them directly to me
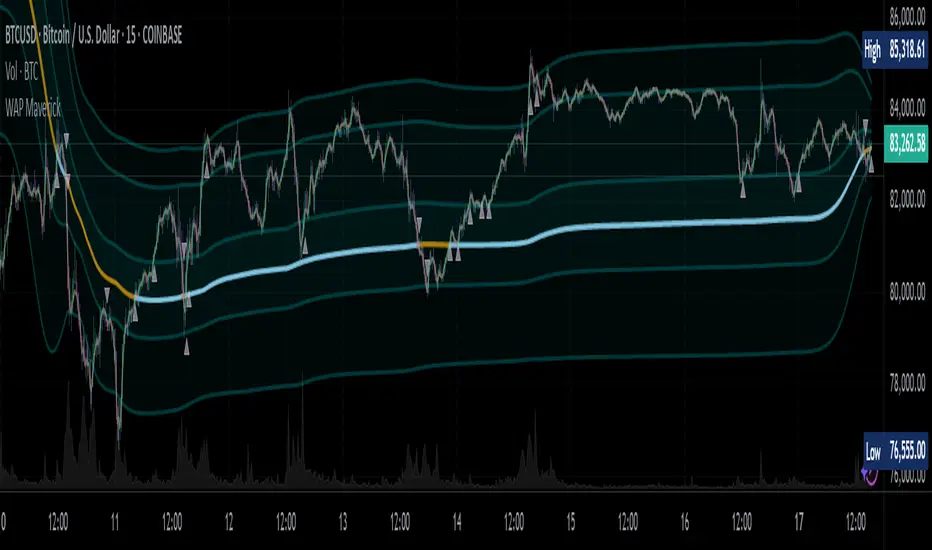
WAP Maverick - (Dual EMA Smoothed VWAP) - [mutantdog]Short Version:
This here is my take on the popular VWAP indicator with several novel features including:
Dual EMA smoothing.
Arithmetic and Harmonic Mean plots.
Custom Anchor feat. Intraday Session Sizes.
2 Pairs of Bands.
Side Input for Connection to other Indicator.
This can be used 'out of the box' as a replacement VWAP, benefitting from smoother transitions and easy-to-use custom alerts.
By design however, this is intended to be a highly customisable alternative with many adjustable parameters and a pseudo-modular input system to connect with another indicator. Well suited for the tweakers around here and those who like to get a little more creative.
I made this primarily for crypto although it should work for other markets. Default settings are best suited to 15m timeframe - the anchor of 1 week is ideal for crypto which often follows a cyclical nature from Monday through Sunday. In 15m, the default ema length of 21 means that the wap comes to match a standard vwap towards the end of Monday. If using higher chart timeframes, i recommend decreasing the ema length to closely match this principle (suggested: for 1h chart, try length = 8; for 4h chart, length = 2 or 3 should suffice).
Note: the use of harmonic mean calculations will cause problems on any data source incorporating both positive and negative values, it may also return unusable results on extremely low-value charts (eg: low-sat coins in /btc pairs).
Long version:
The development of this project was one driven more by experimentation than a specific end-goal, however i have tried to fine-tune everything into a coherent usable end-product. With that in mind then, this walkthrough will follow something of a development chronology as i dissect the various functions.
DUAL-EMA SMOOTHING
At its core this is based upon / adapted from the standard vwap indicator provided by TradingView although I have modified and changed most of it. The first mod is the dual ema smoothing. Rather than simply applying an ema to the output of the standard vwap function, instead i have incorporated the ema in a manner analogous to the way smas are used within a standard vwma. Sticking for now with the arithmetic mean, the basic vwap calculation is simply sum(source * volume) / sum(volume) across the anchored period. In this case i have simply applied an ema to each of the numerator and denominator values resulting in ema(sum(source * volume)) / ema(sum(volume)) with the ema length independent of the anchor. This results in smoother (albeit slower) transitions than the aforementioned post-vwap method. Furthermore in the case when anchor period is equal to current timeframe, the result is a basic volume-weighted ema.
The example below shows a standard vwap (1week anchor) in blue, a 21-ema applied to the vwap in purple and a dual-21-ema smoothed wap in gold. Notably both ema types come to effectively resemble the standard vwap after around 24 hours into the new anchor session but how they behave in the meantime is very different. The dual-ema transitions quite gradually while the post-vwap ema immediately sets about trying to catch up. Incidentally. a similar and slower variation of the dual-ema can be achieved with dual-rma although i have not included it in this indicator, attempted analogues using sma or wma were far less useful however.
STANDARD DEVIATION AND BANDS
With this updated calculation, a corresponding update to the standard deviation is also required. The vwap has its own anchored volume-weighted st.dev but this cannot be used in combination with the ema smoothing so instead it has been recalculated appropriately. There are two pairs of bands with separate multipliers (stepped to 0.1x) and in both cases high and low bands can be activated or deactivated individually. An example usage for this would be to create different upper and lower bands for profit and stoploss targets. Alerts can be set easily for different crossing conditions, more on this later.
Alongside the bands, i have also added the option to shift ('Deviate') the entire indicator up or down according to a multiple of the corrected st.dev value. This has many potential uses, for example if we want to bias our analysis in one direction it may be useful to move the wap in the opposite. Or if the asset is trading within a narrow range and we are waiting on a breakout, we could shift to the desired level and set alerts accordingly. The 'Deviate' parameter applies to the entire indicator including the bands which will remain centred on the main WAP.
CUSTOM (W)ANCHOR
Ever thought about using a vwap with anchor periods smaller than a day? Here you can do just that. I've removed the Earnings/Dividends/Splits options from the basic vwap and added an 'Intraday' option instead. When selected, a custom anchor length can be created as a multiple of minutes (default steps of 60 mins but can input any value from 0 - 1440). While this may not seem at first like a useful feature for anyone except hi-speed scalpers, this actually offers more interesting potential than it appears.
When set to 0 minutes the current timeframe is always used, turning this into the basic volume-weighted ema mentioned earlier. When using other low time frames the anchor can act as a pre-ema filter creating a stepped effect akin to an adaptive MA. Used in combination with the bands, the result is a kind of volume-weighted adaptive exponential bollinger band; if such a thing does not already exist then this is where you create it. Alternatively, by combining two instances you may find potential interesting crosses between an intraday wap and a standard timeframe wap. Below is an example set to intraday with 480 mins, 2x st.dev bands and ema length 21. Included for comparison in purple is a standard 21 ema.
I'm sure there are many potential uses to be found here, so be creative and please share anything you come up with in the comments.
ARITHMETIC AND HARMONIC MEAN CALCULATIONS
The standard vwap uses the arithmetic mean in its calculation. Indeed, most mean calculations tend to be arithmetic: sma being the most widely used example. When volume weighting is involved though this can lead to a slight bias in favour of upward moves over downward. While the effect of this is minor, over longer anchor periods it can become increasingly significant. The harmonic mean, on the other hand, has the opposite effect which results in a value that is always lower than the arithmetic mean. By viewing both arithmetic and harmonic waps together, the extent to which they diverge from each other can be used as a visual reference of how much price has changed during the anchored period.
Furthermore, the harmonic mean may actually be the more appropriate one to use during downtrends or bearish periods, in principle at least. Consider that a short trade is functionally the same as a long trade on the inverse of the pair (eg: selling BTC/USD is the same as buying USD/BTC). With the harmonic mean being an inverse of the arithmetic then, it makes sense to use it instead. To illustrate this below is a snapshot of LUNA/USDT on the left with its inverse 1/(LUNA/USDT) = USDT/LUNA on the right. On both charts is a wap with identical settings, note the resistance on the left and its corresponding support on the right. It should be easy from this to see that the lower harmonic wap on the left corresponds to the upper arithmetic wap on the right. Thus, it would appear that the harmonic mean should be used in a downtrend. In principle, at least...
In reality though, it is not quite so black and white. Rarely are these values exact in their predictions and the sort of range one should allow for inaccuracies will likely be greater than the difference between these two means. Furthermore, the ema smoothing has already introduced some lag and thus additional inaccuracies. Nevertheless, the symmetry warrants its inclusion.
SIDE INPUT & ALERTS
Finally we move on to the pseudo-modular component here. While TradingView allows some interoperability between indicators, it is limited to just one connection. Any attempt to use multiple source inputs will remove this functionality completely. The workaround here is to instead use custom 'string' input menus for additional sources, preserving this function in the sole 'source' input. In this case, since the wap itself is dependant only price and volume, i have repurposed the full 'source' into the second 'side' input. This allows for a separate indicator to interact with this one that can be used for triggering alerts. You could even use another instance of this one (there is a hidden wap:mid plot intended for this use which is the midpoint between both means). Note that deleting a connected indicator may result in the deletion of those connected to it.
Preset alertconditions are available for crossings of the side input above and below the main wap, alongside several customisable alerts with corresponding visual markers based upon selectable conditions. Alerts for band crossings apply only to those that are active and only crossings of the type specified within the 'crosses' subsection of the indicator settings. The included options make it easy to create buy alerts specific to certain bands with sell alerts specific to other bands. The chart below shows two instances with differing anchor periods, both are connected with buy and sell alerts enabled for visible bands.
Okay... So that just about covers it here, i think. As mentioned earlier this is the product of various experiments while i have been learning my way around PineScript. Some of those experiments have been branched off from this in order to not over-clutter it with functions. The pseudo-modular design and the 'side' input are the result of an attempt to create a connective framework across various projects. Even on its own though, this should offer plenty of tweaking potential for anyone who likes to venture away from the usual standards, all the while still retaining its core purpose as a traders tool.
Thanks for checking this out. I look forward to any feedback below.
robotrading body-limitThis is a very simple and universal strategy. Good for crypto. For BTC/USD, shitcoin/BTC .
Strategy
Long positions only. If the candle is falling and the candle body is 3 or more times the average candle body, then open a long position by limit order.
If the candle is rising, we should close a long position.
Short positions are not used.
This is a counter-trend strategy.
The average body of a candlestick is the arithmetic average of the bodies of the previous 100 bodies.
Parameters
The multiplier is the number of times the candlestick body should be bigger than the average candlestick body to get a signal to open a long position.
Recommended
- A timeframe of 4 hours to 1 day
- Cryptocurrencies with large market capitalization
- you can use coin/USD, coin/USDT, coin/BTC , coin/ETH, etc

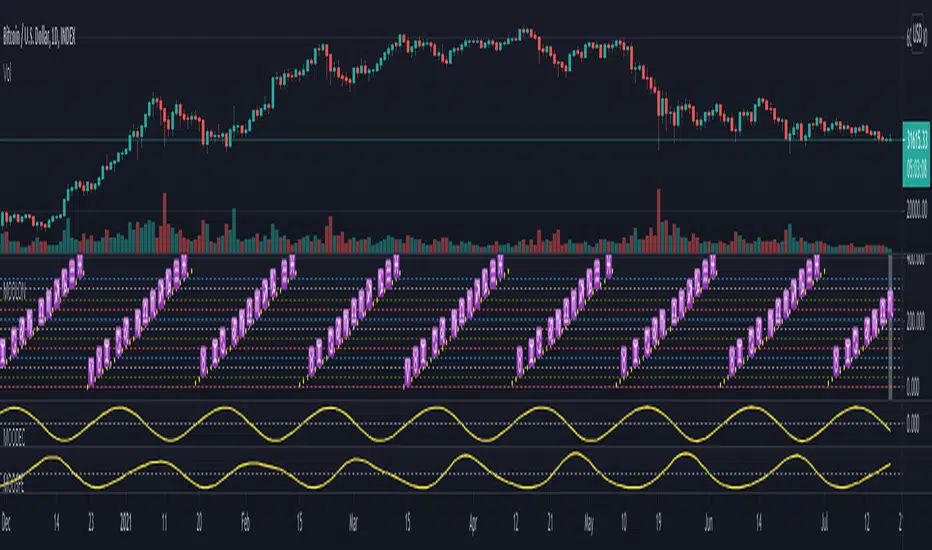
Ripple (XRP) Model PriceAn article titled Bitcoin Stock-to-Flow Model was published in March 2019 by "PlanB" with mathematical model used to calculate Bitcoin model price during the time. We know that Ripple has a strong correlation with Bitcoin. But does this correlation have a definite rule?
In this study, we examine the relationship between bitcoin's stock-to-flow ratio and the ripple(XRP) price.
The Halving and the stock-to-flow ratio
Stock-to-flow is defined as a relationship between production and current stock that is out there.
SF = stock / flow
The term "halving" as it relates to Bitcoin has to do with how many Bitcoin tokens are found in a newly created block. Back in 2009, when Bitcoin launched, each block contained 50 BTC, but this amount was set to be reduced by 50% every 210,000 blocks (about 4 years). Today, there have been three halving events, and a block now only contains 6.25 BTC. When the next halving occurs, a block will only contain 3.125 BTC. Halving events will continue until the reward for minors reaches 0 BTC.
With each halving, the stock-to-flow ratio increased and Bitcoin experienced a huge bull market that absolutely crushed its previous all-time high. But what exactly does this affect the price of Ripple?
Price Model
I have used Bitcoin's stock-to-flow ratio and Ripple's price data from April 1, 2014 to November 3, 2021 (Daily Close-Price) as the statistical population.
Then I used linear regression to determine the relationship between the natural logarithm of the Ripple price and the natural logarithm of the Bitcoin's stock-to-flow (BSF).
You can see the results in the image below:
Basic Equation : ln(Model Price) = 3.2977 * ln(BSF) - 12.13
The high R-Squared value (R2 = 0.83) indicates a large positive linear association.
Then I "winsorized" the statistical data to limit extreme values to reduce the effect of possibly spurious outliers (This process affected less than 4.5% of the total price data).
ln(Model Price) = 3.3297 * ln(BSF) - 12.214
If we raise the both sides of the equation to the power of e, we will have:
============================================
Final Equation:
■ Model Price = Exp(- 12.214) * BSF ^ 3.3297
Where BSF is Bitcoin's stock-to-flow
============================================
If we put current Bitcoin's stock-to-flow value (54.2) into this equation we get value of 2.95USD. This is the price which is indicated by the model.
There is a power law relationship between the market price and Bitcoin's stock-to-flow (BSF). Power laws are interesting because they reveal an underlying regularity in the properties of seemingly random complex systems.
I plotted XRP model price (black) over time on the chart.
Estimating the range of price movements
I also used several bands to estimate the range of price movements and used the residual standard deviation to determine the equation for those bands.
Residual STDEV = 0.82188
ln(First-Upper-Band) = 3.3297 * ln(BSF) - 12.214 + Residual STDEV =>
ln(First-Upper-Band) = 3.3297 * ln(BSF) – 11.392 =>
■ First-Upper-Band = Exp(-11.392) * BSF ^ 3.3297
In the same way:
■ First-Lower-Band = Exp(-13.036) * BSF ^ 3.3297
I also used twice the residual standard deviation to define two extra bands:
■ Second-Upper-Band = Exp(-10.570) * BSF ^ 3.3297
■ Second-Lower-Band = Exp(-13.858) * BSF ^ 3.3297
These bands can be used to determine overbought and oversold levels.
Estimating of the future price movements
Because we know that every four years the stock-to-flow ratio, or current circulation relative to new supply, doubles, this metric can be plotted into the future.
At the time of the next halving event, Bitcoins will be produced at a rate of 450 BTC / day. There will be around 19,900,000 coins in circulation by August 2025
It is estimated that during first year of Bitcoin (2009) Satoshi Nakamoto (Bitcoin creator) mined around 1 million Bitcoins and did not move them until today. It can be debated if those coins might be lost or Satoshi is just waiting still to sell them but the fact is that they are not moving at all ever since. We simply decrease stock amount for 1 million BTC so stock to flow value would be:
BSF = (19,900,000 – 1.000.000) / (450 * 365) =115.07
Thus, Bitcoin's stock-to-flow will increase to around 115 until AUG 2025. If we put this number in the equation:
Model Price = Exp(- 12.214) * 114 ^ 3.3297 = 36.06$
Ripple has a fixed supply rate. In AUG 2025, the total number of coins in circulation will be about 56,000,000,000. According to the equation, Ripple's market cap will reach $2 trillion.
Note that these studies have been conducted only to better understand price movements and are not a financial advice.

SNL Popular Moving Averages MTFSNL△ Popular Moving Averages MTF
Short title: PopMAs
These are popular moving averages used by various traders and they are multi-timeframe, i.e. you can see
the 200 day SMA on a 15 minute chart.
Four moving averages are also included for the current timeframe (20, 50, 100 and 200 EMA).
Not all moving averages are enabled by default. You can turn individual moving averges on or off in the
"Style" tab of the indicator's settings.
The way I see moving averages is that they do not represent a magic mathematical truth, but are simply the
result of many people agreeing on the same parameters. I guess the origin were five working days in a week
and therefore a month would be four times five, i.e. a 20 day SMA. 200 days are probably an estimate of
the work days in a year and the 50 day SMA represents a quarter year.
There are many indicators on TradingView that offer various adjustable moving averages, including
combinations and multi-timeframe. But my interest was to have an indicator with the most popular moving
averages and it should be multi-timeframe capable. By design I did not want to make the periods adjustable,
but you could add this easily if you like.
Here are some examples of poplular moving averages:
20 unit EMA : support on 4h BTC chart, Carl the Moon
20, 50, 100, 200 day SMA : classic trading all charts, Benjamin Cowen, Tone Vays
20, 50, 100, 200 week SMA: Benjamin Cowen
21 week EMA: well known BTC support, Benjamin Cowen
800 hour EMA: Traders Reality -> not possible in TradingView, represented as 33 day EMA
Known problems:
- I have not found a way to turn off floating labels according to a plot's state chosen in the "Style"
tab. So you will still see the label floating around even if you have turned off the moving average's
line. But you can always turn of all the floating labels in the settings.
- I have observed unexpected differences on multi-timeframe values: For example, looking at the true 20
week SMA on a weekly BTC chart showed a present time value of 43821 USD, but the value was 43908 USD
for the result of this call used in this script: security(syminfo.tickerid, "W", sma(close, 20))
The difference went away when switching my chart to weekly and back to 15 minutes.
Please comment if you know of other moving averages that are often and successfully used or if you find
that one of the included moving averages is irrelevant and should be removed from this script.
And I would very much appreciate any input regarding the mentioned known problems.

Financial Astrology Moon LongitudeMoon energy represent the masses, crowds, public places, children and emotions. The transit of the Moon through the zodiacal signs will color the crowd emotional responses that fluctuate based on the elemental qualities of the signs: fire (energetic and impulsive), earth (rigid, static, patient), water (assimilation, transformation, humor fluctuations), air (expansion, fervent, germination).
The daily average speed of the Moon is 13 degrees, for this reason the emotional elemental energy is transforming in average every 2 days and few hours, this mood fluctuations produces the short term instinctive and emotional actions performed by traders that forget the precise mathematical / statistical approach in favor of irrational and emotional impulses.
Based on statistical buy/sell frequency analysis we discovered that for BTC-USD, the Moon is usually bullish in zodiac signs: Aries, Libra, Scorpio, Aquarius and Pisces, the most relevant bullish sign is "Aquarius", from 206 observations in all the BTC-USD price history where Moon was in this sign the 60% of those days the price increased compared to the previous day. The bearish zodiac signs for BTC-USD are: Taurus, Cancer, Leo, Sagittarius and Capricorn, the most relevant bearish sign is "Capricorn".
Interestingly this zodiac sign locations tends to fluctuate during some periods of time and from the last 10 observations of the Moon transiting through Aries we noted that 7 of the 10 observations coincide with a dip, sometimes the Moon in Aries indicate the reversal of the short term trend, this is kind of expected considering that when Moon approaches Taurus the fall becomes more likely due to the fact that Moon in Taurus is a bearish signal.
With this indicator there is unlimited possibilities to explore across different markets and complementing with Moon phases this may be the perfect financial astrology indicator for those intraday traders that keep positions only for few hours.
We encourage you to analyze the Moon zodiac sign cycles in different markets and share with us your observations, leave us a comment with your research outcomes. Happy trading!
Note: The Moon longitude indicator is based on an ephemeris array that covers years 2010 to 2030, prior or after this years the longitude is not available, this daily ephemeris are based on UTC time so in order to align properly with the price bars times you should set UTC as your chart reference timezone.
Hopper Trigger - Free Cryptohopper WidgetWelcome to our Tradingview cryptohopper trigger widget.
We designed this script to give Cryptohopper users the possibility to set up an alarm when btc is trending down. Cause of the BTCs behavior as the supertrend coin for the market it is better to turn your hopper off or be extremly careful when BTC is trending down. We implemented to types of alarms, because atm its not possible to automate using them to deactivate your hopper. On Alarm setup could be used to send signals every minute to trigger a push notification on your App or to trigger your Alexa. The other type of alarm only sends one single signal for normal purposes.
We recommend using this indicator in the 30 minute or 1 hour timeframe and to deactivate your hopper and deleting all positions when a alarm is signaling. The risk of a larger drop is very high in this marketphase. Never take an drop again using this approach. Little drawdown in bearish or ranging times but high reward in bullish times.
Smartgrow-Trading is a community project with the aim of developing the best and most successful trading strategies and sharing them with the community.
The basic idea of this script is to calculate how far an coin is away from its ATH , to gave warning signals for deactivating coins after they reached there ATH . So it could also be used for other coins and pairs.
If there are questions, write them into the comments or contact us directly over the direct message or social media. Happy Trading!

All Time High Warning - Free Cryptohopper WidgetWelcome to our Tradingview coin prediction filter.
We designed this script to give Cryptohopper users the possibility to set up an alarm when btc is close to All Time High. Cause of the BTCs behavior as the supertrend coin for the market it is better to turn your hopper off or be extremly careful when BTC is close to ATH.
We recommend deactivating the hopper and deleting all positions. The risk of a larger drop is very high in this marketphase.
Smartgrow-Trading is a community project with the aim of developing the best and most successful trading strategies and sharing them with the community.
The basic idea of this script is to calculate how far an coin is away from its ATH, to gave warning signals for deactivating coins after they reached there ATH. So it could also be used for other coins and pairs.
If there are questions, write them into the comments or contact us directly over the direct message or social media. Happy Trading!

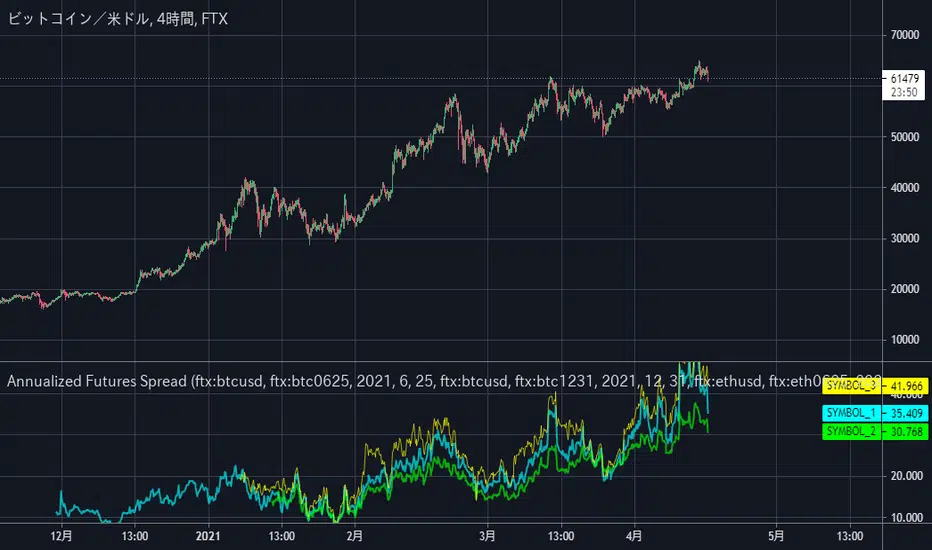
Annualized Futures Spread2つの銘柄間のスプレッドを年率換算してオシレーターの枠に表示するスクリプトです。
(BTCUSD現物とBTC-0625先物契約のような2銘柄間で使用することを想定しています。)
設定で年率換算していない生の乖離率の表示に切り替えることも可能です。
初期設定ではFTXの BTCUSDとBTCUSD-0624、BTCUSDとBTC-1231、ETHUSDとETH-0625 が指定されています。
そのまま使用しても構いませんし、設定やソースコードを編集して活用してくださって構いません。
ーーーーーーーーーーーーー
This custom script can be used to display the annualized spread rate between two specified symbols like BTCUSD and BTC-0625.
It is also possible to display raw spreads that are not annualized. (Just simply clicking the checkbox in setting.)
The default settings are BTC0625 and BTCUSD, BTC1231 and BTCUSD, and ETH0625 and ETHUSD on FTX Exchange.
You may use it as-is, or edit the settings or modify the source code as you like.
(This script was removed due to a violation of the English-Only house rule once, so this is a repost with a revised title and text.)