Generalized Black-Scholes-Merton w/ Analytical Greeks [Loxx]Generalized Black-Scholes-Merton w/ Analytical Greeks is an adaptation of the Black-Scholes-Merton Option Pricing Model including Analytical Greeks and implied volatility calculations. The following information is an excerpt from Espen Gaarder Haug's book "Option Pricing Formulas". The options sensitivities (Greeks) are the partial derivatives of the Black-Scholes-Merton (BSM) formula. Analytical Greeks for our purposes here are broken down into various categories:
Delta Greeks: Delta, DDeltaDvol, Elasticity
Gamma Greeks: Gamma, GammaP, DGammaDSpot/speed, DGammaDvol/Zomma
Vega Greeks: Vega, DVegaDvol/Vomma, VegaP
Theta Greeks: Theta
Rate/Carry Greeks: Rho, Rho futures option, Carry Rho, Phi/Rho2
Probability Greeks: StrikeDelta, Risk Neutral Density
(See the code for more details)
Black-Scholes-Merton Option Pricing
The BSM formula and its binomial counterpart may easily be the most used "probability model/tool" in everyday use — even if we con- sider all other scientific disciplines. Literally tens of thousands of people, including traders, market makers, and salespeople, use option formulas several times a day. Hardly any other area has seen such dramatic growth as the options and derivatives businesses. In this chapter we look at the various versions of the basic option formula. In 1997 Myron Scholes and Robert Merton were awarded the Nobel Prize (The Bank of Sweden Prize in Economic Sciences in Memory of Alfred Nobel). Unfortunately, Fischer Black died of cancer in 1995 before he also would have received the prize.
It is worth mentioning that it was not the option formula itself that Myron Scholes and Robert Merton were awarded the Nobel Prize for, the formula was actually already invented, but rather for the way they derived it — the replicating portfolio argument, continuous- time dynamic delta hedging, as well as making the formula consistent with the capital asset pricing model (CAPM). The continuous dynamic replication argument is unfortunately far from robust. The popularity among traders for using option formulas heavily relies on hedging options with options and on the top of this dynamic delta hedging, see Higgins (1902), Nelson (1904), Mello and Neuhaus (1998), Derman and Taleb (2005), as well as Haug (2006) for more details on this topic. In any case, this book is about option formulas and not so much about how to derive them.
Provided here are the various versions of the Black-Scholes-Merton formula presented in the literature. All formulas in this section are originally derived based on the underlying asset S follows a geometric Brownian motion
dS = mu * S * dt + v * S * dz
where t is the expected instantaneous rate of return on the underlying asset, a is the instantaneous volatility of the rate of return, and dz is a Wiener process.
The formula derived by Black and Scholes (1973) can be used to value a European option on a stock that does not pay dividends before the option's expiration date. Letting c and p denote the price of European call and put options, respectively, the formula states that
c = S * N(d1) - X * e^(-r * T) * N(d2)
p = X * e^(-r * T) * N(d2) - S * N(d1)
where
d1 = (log(S / X) + (r + v^2 / 2) * T) / (v * T^0.5)
d2 = (log(S / X) + (r - v^2 / 2) * T) / (v * T^0.5) = d1 - v * T^0.5
Inputs
S = Stock price.
X = Strike price of option.
T = Time to expiration in years.
r = Risk-free rate
b = Cost of carry
v = Volatility of the underlying asset price
cnd (x) = The cumulative normal distribution function
nd(x) = The standard normal density function
convertingToCCRate(r, cmp ) = Rate compounder
gImpliedVolatilityNR(string CallPutFlag, float S, float x, float T, float r, float b, float cm , float epsilon) = Implied volatility via Newton Raphson
gBlackScholesImpVolBisection(string CallPutFlag, float S, float x, float T, float r, float b, float cm ) = implied volatility via bisection
Implied Volatility: The Bisection Method
The Newton-Raphson method requires knowledge of the partial derivative of the option pricing formula with respect to volatility ( vega ) when searching for the implied volatility . For some options (exotic and American options in particular), vega is not known analytically. The bisection method is an even simpler method to estimate implied volatility when vega is unknown. The bisection method requires two initial volatility estimates (seed values):
1. A "low" estimate of the implied volatility , al, corresponding to an option value, CL
2. A "high" volatility estimate, aH, corresponding to an option value, CH
The option market price, Cm , lies between CL and cH . The bisection estimate is given as the linear interpolation between the two estimates:
v(i + 1) = v(L) + (c(m) - c(L)) * (v(H) - v(L)) / (c(H) - c(L))
Replace v(L) with v(i + 1) if c(v(i + 1)) < c(m), or else replace v(H) with v(i + 1) if c(v(i + 1)) > c(m) until |c(m) - c(v(i + 1))| <= E, at which point v(i + 1) is the implied volatility and E is the desired degree of accuracy.
Implied Volatility: Newton-Raphson Method
The Newton-Raphson method is an efficient way to find the implied volatility of an option contract. It is nothing more than a simple iteration technique for solving one-dimensional nonlinear equations (any introductory textbook in calculus will offer an intuitive explanation). The method seldom uses more than two to three iterations before it converges to the implied volatility . Let
v(i + 1) = v(i) + (c(v(i)) - c(m)) / (dc / dv (i))
until |c(m) - c(v(i + 1))| <= E at which point v(i + 1) is the implied volatility , E is the desired degree of accuracy, c(m) is the market price of the option, and dc/ dv (i) is the vega of the option evaluaated at v(i) (the sensitivity of the option value for a small change in volatility ).
Things to know
Only works on the daily timeframe and for the current source price.
You can adjust the text size to fit the screen
Search in scripts for "cm"

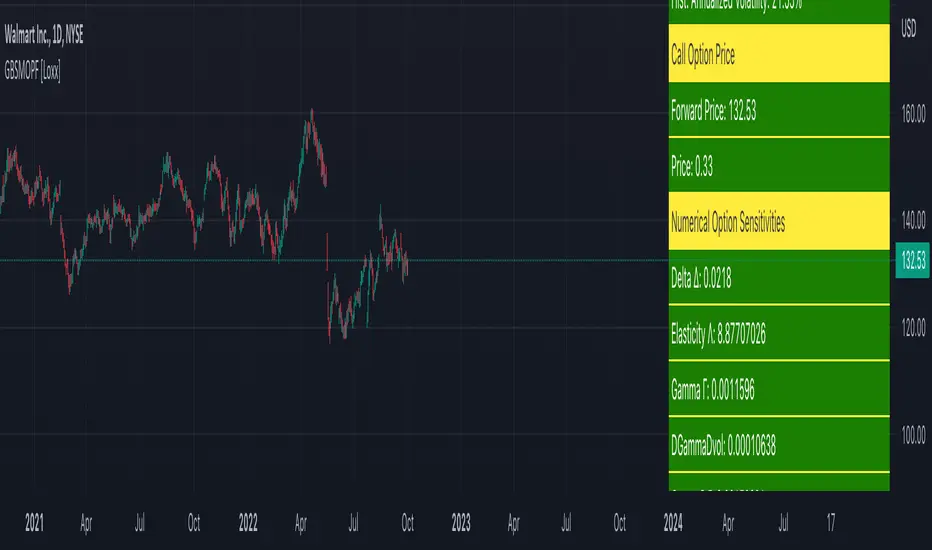
Generalized Black-Scholes-Merton Option Pricing Formula [Loxx]Generalized Black-Scholes-Merton Option Pricing Formula is an adaptation of the Black-Scholes-Merton Option Pricing Model including Numerical Greeks aka "Option Sensitivities" and implied volatility calculations. The following information is an excerpt from Espen Gaarder Haug's book "Option Pricing Formulas".
Black-Scholes-Merton Option Pricing
The BSM formula and its binomial counterpart may easily be the most used "probability model/tool" in everyday use — even if we con- sider all other scientific disciplines. Literally tens of thousands of people, including traders, market makers, and salespeople, use option formulas several times a day. Hardly any other area has seen such dramatic growth as the options and derivatives businesses. In this chapter we look at the various versions of the basic option formula. In 1997 Myron Scholes and Robert Merton were awarded the Nobel Prize (The Bank of Sweden Prize in Economic Sciences in Memory of Alfred Nobel). Unfortunately, Fischer Black died of cancer in 1995 before he also would have received the prize.
It is worth mentioning that it was not the option formula itself that Myron Scholes and Robert Merton were awarded the Nobel Prize for, the formula was actually already invented, but rather for the way they derived it — the replicating portfolio argument, continuous- time dynamic delta hedging, as well as making the formula consistent with the capital asset pricing model (CAPM). The continuous dynamic replication argument is unfortunately far from robust. The popularity among traders for using option formulas heavily relies on hedging options with options and on the top of this dynamic delta hedging, see Higgins (1902), Nelson (1904), Mello and Neuhaus (1998), Derman and Taleb (2005), as well as Haug (2006) for more details on this topic. In any case, this book is about option formulas and not so much about how to derive them.
Provided here are the various versions of the Black-Scholes-Merton formula presented in the literature. All formulas in this section are originally derived based on the underlying asset S follows a geometric Brownian motion
dS = mu * S * dt + v * S * dz
where t is the expected instantaneous rate of return on the underlying asset, a is the instantaneous volatility of the rate of return, and dz is a Wiener process.
The formula derived by Black and Scholes (1973) can be used to value a European option on a stock that does not pay dividends before the option's expiration date. Letting c and p denote the price of European call and put options, respectively, the formula states that
c = S * N(d1) - X * e^(-r * T) * N(d2)
p = X * e^(-r * T) * N(d2) - S * N(d1)
where
d1 = (log(S / X) + (r + v^2 / 2) * T) / (v * T^0.5)
d2 = (log(S / X) + (r - v^2 / 2) * T) / (v * T^0.5) = d1 - v * T^0.5
Inputs
S = Stock price.
X = Strike price of option.
T = Time to expiration in years.
r = Risk-free rate
b = Cost of carry
v = Volatility of the underlying asset price
cnd (x) = The cumulative normal distribution function
nd(x) = The standard normal density function
convertingToCCRate(r, cmp ) = Rate compounder
gImpliedVolatilityNR(string CallPutFlag, float S, float x, float T, float r, float b, float cm, float epsilon) = Implied volatility via Newton Raphson
gBlackScholesImpVolBisection(string CallPutFlag, float S, float x, float T, float r, float b, float cm) = implied volatility via bisection
Implied Volatility: The Bisection Method
The Newton-Raphson method requires knowledge of the partial derivative of the option pricing formula with respect to volatility (vega) when searching for the implied volatility. For some options (exotic and American options in particular), vega is not known analytically. The bisection method is an even simpler method to estimate implied volatility when vega is unknown. The bisection method requires two initial volatility estimates (seed values):
1. A "low" estimate of the implied volatility, al, corresponding to an option value, CL
2. A "high" volatility estimate, aH, corresponding to an option value, CH
The option market price, Cm, lies between CL and cH. The bisection estimate is given as the linear interpolation between the two estimates:
v(i + 1) = v(L) + (c(m) - c(L)) * (v(H) - v(L)) / (c(H) - c(L))
Replace v(L) with v(i + 1) if c(v(i + 1)) < c(m), or else replace v(H) with v(i + 1) if c(v(i + 1)) > c(m) until |c(m) - c(v(i + 1))| <= E, at which point v(i + 1) is the implied volatility and E is the desired degree of accuracy.
Implied Volatility: Newton-Raphson Method
The Newton-Raphson method is an efficient way to find the implied volatility of an option contract. It is nothing more than a simple iteration technique for solving one-dimensional nonlinear equations (any introductory textbook in calculus will offer an intuitive explanation). The method seldom uses more than two to three iterations before it converges to the implied volatility. Let
v(i + 1) = v(i) + (c(v(i)) - c(m)) / (dc / dv(i))
until |c(m) - c(v(i + 1))| <= E at which point v(i + 1) is the implied volatility, E is the desired degree of accuracy, c(m) is the market price of the option, and dc/dv(i) is the vega of the option evaluaated at v(i) (the sensitivity of the option value for a small change in volatility).
Numerical Greeks or Greeks by Finite Difference
Analytical Greeks are the standard approach to estimating Delta, Gamma etc... That is what we typically use when we can derive from closed form solutions. Normally, these are well-defined and available in text books. Previously, we relied on closed form solutions for the call or put formulae differentiated with respect to the Black Scholes parameters. When Greeks formulae are difficult to develop or tease out, we can alternatively employ numerical Greeks - sometimes referred to finite difference approximations. A key advantage of numerical Greeks relates to their estimation independent of deriving mathematical Greeks. This could be important when we examine American options where there may not technically exist an exact closed form solution that is straightforward to work with. (via VinegarHill FinanceLabs)
Things to know
Only works on the daily timeframe and for the current source price.
You can adjust the text size to fit the screen
T3 Super GuppyA Tillson T3 moving average implemented variation of the CM Super Guppy indicator by @FritzMurphy
The T3 moving average was developed by Tom Tilson which combines multiple EMAs into a single moving average. it is smoother and more responsive compared to traditional moving averages. The disadvantage is that it can overshoot price.
█ Description
T3 Super Guppy consists of 20 T3 moving averages:
• 7 fast T3 MAs
• 13 slow T3 MAs
Visuals:
• Compact view available for chart minimalists
• In compact view only 10 of the fastest T3 moving averages will be displayed
• Compact view will not affect how the colour scales with trend movement
• Ribbon transparency will automatically scale based on the display mode chosen
Colour Gradient
• The more T3 MAs that cross above or below their slower counterparts will result in how deep the chosen upTrend(Blue) or downTrend(Red) colour is displayed
• Helps to spot weakening trends or reversal signals when indicator colour starts converging into the opposite colour
• Single colour mode is available if you find the colour gradient distracting
█ Credits
@ChrisMoody original guppy idea:
@FritzMurphy super guppy format:
█ Examples
compact view:
full view:

Approved Engulfing - Confirmed Close Triggerengulfing tak respek atau king CMS, guna cs sebelum engulfing ni sebagai area entry, bila prce kembali ke area ini, tunggu rejection baru boleh entry, andai tak ada rejection tak boleh entry
the Engulfing is not respected or fails to hold (King CMS), use the candle prior to this engulfing as your entry area. When price returns to this zone, wait for a clear rejection before entering. If there is no rejection, do not enter the trade."

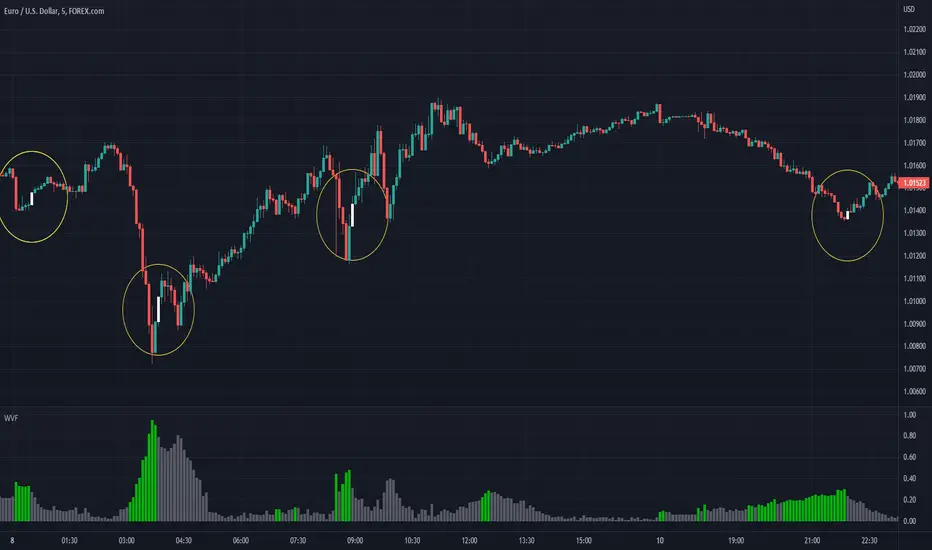
WVF - OscillatorAnother attempt on making use of CM-Williams-Vix-Fix-Finds-Market-Bottoms from Chris Moody - which is arguably one of the best indicator available on pine and tradingview platform. Every time I revisit this, I get new ideas on applying this method.
I have slightly altered formula to
highest(source)-source/highest(source)
from the original formula
highest(close)-low/highest(close)
Process is simple:
Calculate WVF for OHLC values separately
Calculate momentum on each of the WVF values based on distance from moving average
Plot the candles based on OHLC momentum.
Candle color depends on whether close, open and previous close. If close is higher than open and previous close, we get green coloured candles. If close is lower than previous close and open then we get red coloured candles. In all other cases, we will have silver candles.
High/Low bands are calculated based on median of highest and lowest values of VixFix. We also plot median of close which can be used in some cases.
How to use this to find market bottom. Look for one of the below conditions:
First red candle above high band - which signals momentum of vix fix is about to fall.
First red candle above median line - can be used only if upward momentum of wvf candles are trending well.
Crossunder of wvf candles under high band.
Possible exit scenarios
Green WVF candle formed above WVF high line
Entry is taken on first red candle above median line - but, candles turned green before WVF crossing under median line - may signal our thesis is wrong and price may drop further.
Some examples.

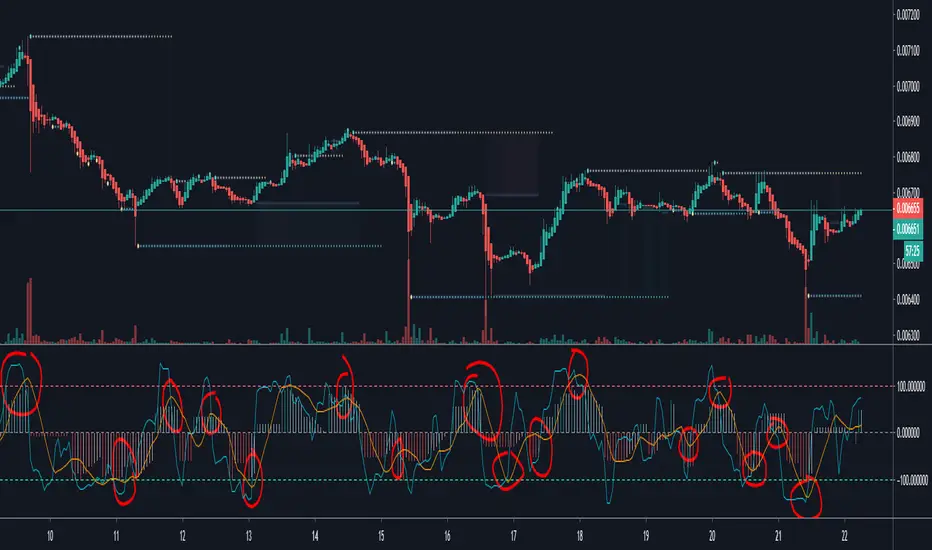
Aroon Histogram + CMO [ChuckBanger]This is a combination of Aroon and Chande Momentum Oscillator . I made a histogram of Aroon , aqua line is Chande Momentum and the orange line are a simple moving average of Chande Momentum as a signal line.
One strategy you can use this for is to buy or sell when the signal line crosses the CM line or you can buy and sell when CM line is highest or lowest
You should also study how the indicators work separately:
Aroon Oscillator
www.investopedia.com
Chande Momentum Oscillator
www.investopedia.com
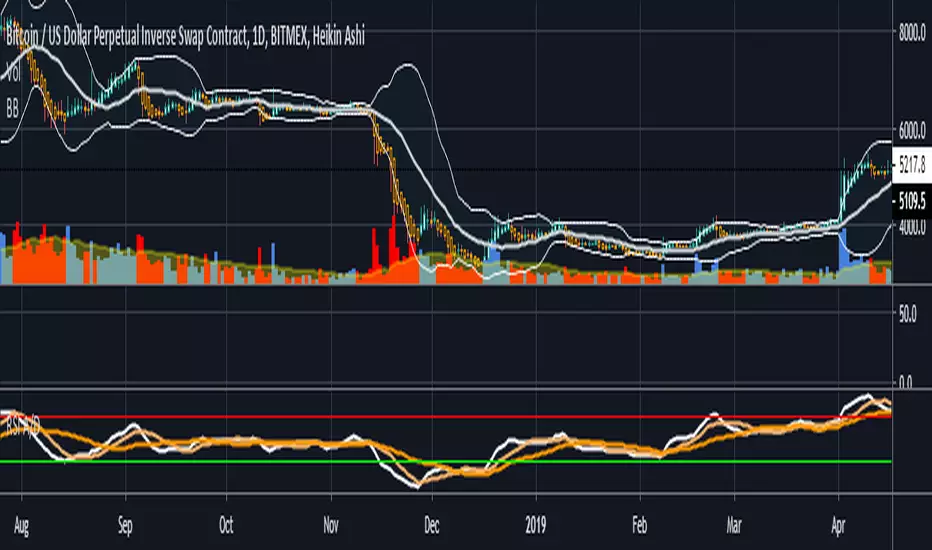
RSI and A/D StrengthThis is an edit of Chris Moody's EMA of RSI script see the original here:
The edited version has an accumulation distribution line as well as well as two SMAs
If you want a detailed look at how I use ADX and DI along with it to enter/exit please see the following video and article
youtu.be
bitcointradingtoday.com
PPSRMA -COMPILATION OF 2 GREAT SCRIPTS AND DOUBLE MAFirst of all I just did the compilation so this is not my idea, it is just a miscellany.
This script has been compiled for authors who have just been introduced to scripts : for unloading and leaving room for other indicators especially:non-pro users needs space for indicators and users seeking best technical combination. This script says thousands of comments.
It's the best combination I've ever try and see everything about future. All efforts belongs to ChrisMoody.
( And fernandofurtado for double moving average codes)
--------------- INGREDIENTS ------------------
1-) Price Action Bars - Price Patterns - CM_Price-Action-Bars-Price Patterns That Work! ( by ChrisMoody )
Original :
2-) Oldschool Projected High & Lows - CM_OldSchool_Projected_high_Low ( by ChrisMoody )
Original :
3-) Multiple Moving Averages - ( by fernandofurtado )
Original :
---------- SETTINGS- -----------
- Use dark theme
- Select SMA fast : 25 SMA slow : 50 ( Inputs)
- Tick all inputs and see price action bars ( Inputs)
FOR FLOW TRADERS :
** Use 30 mins graphs with - Weekly Projected High & Lows
*** Choose high liquidity stocks ( Bank stocks etc.)
FOR MEDIUM - LONG TERM TRADERS AND INVESTORS
** Use 4 hour graphs with - Quarterly Projected High & Lows OR
** 1 day graphs with - Yearly Projected High &Lows ( OR Quarterly Projected High & Lows )
------------------- SUGGESTIONS --------------------
* Add MACD (12,26) and RSI (14) in your empty slots.
* Use mostly on stock markets.
* Be careful about stocks under red breakout line are dangerous same as above green breakout levels.
* Always consider with all indicators and patterns (especially price patterns), get confirmed from Volume.
* Consider with financial analysis ( mostly for medium-long term )
NOTE : The authors' codes are specified on scripts source codes.

Super Guppy LogGeometric mean is introduced to the moving averages better capture parabolic, long lasting trends.
Options to plot hlc3 of price, switch off log, and switch to Hull MA.
How to trade Guppy: www.investopedia.com
Original Guppy by ChrisMoody:
Super Guppy by FritzMurphy:
Log-space ideas by fskrypt: tradingview.com/u/fskrypt
Log-space EMAs:
Regular EMAs:

SB_CM_RSI_2_Strategy_Version 2.0(New: Profit booking present which is not present in the previous indicator)
The strategy is based on the indicator posted by @ChrisMoody "CM RSI-2 Strategy Lower Indicator" which is based on "Larry Connors RSI-2 Strategy - Lower RSI"
In this strategy, the longs are placed when a green color is encountered in the rsi in the previous candle and short when the red color is encountered in the rsi.
Although the profits are booked when the rsi crossover the 10 level mark or crossunder the 90 level mark.
Just message in the script if you have any different idea regarding this indicator.
For the original indicator you can refer to :
For Tips to continue :) -
BTC: 1BjswGcRR6c23pka7qh5t5k56j46cuyyy2
ETH: 0x64fed71c9d6c931639c7ba4671aeb6b05e6b3781
LTC: LKT2ykQ8QSzzfTDB6Tnsf12xwYPjgq95h4

SB_CM_RSI_2_Strategy_Version 1.0The strategy is based on the indicator posted by @ChrisMoody "CM RSI-2 Strategy Lower Indicator" which is based on "Larry Connors RSI-2 Strategy - Lower RSI"
In this strategy the longs are placed when a green color is encountered in the rsi and short when red color is encountered in the rsi.
Although the profits can be booked at different interval.
Just message in the script if you have any different idea regarding this indicator.
For the original indicator you can refer to :
For Tips to continue :) :
BTC: 1BjswGcRR6c23pka7qh5t5k56j46cuyyy2
ETH: 0x64fed71c9d6c931639c7ba4671aeb6b05e6b3781
LTC: LKT2ykQ8QSzzfTDB6Tnsf12xwYPjgq95h4

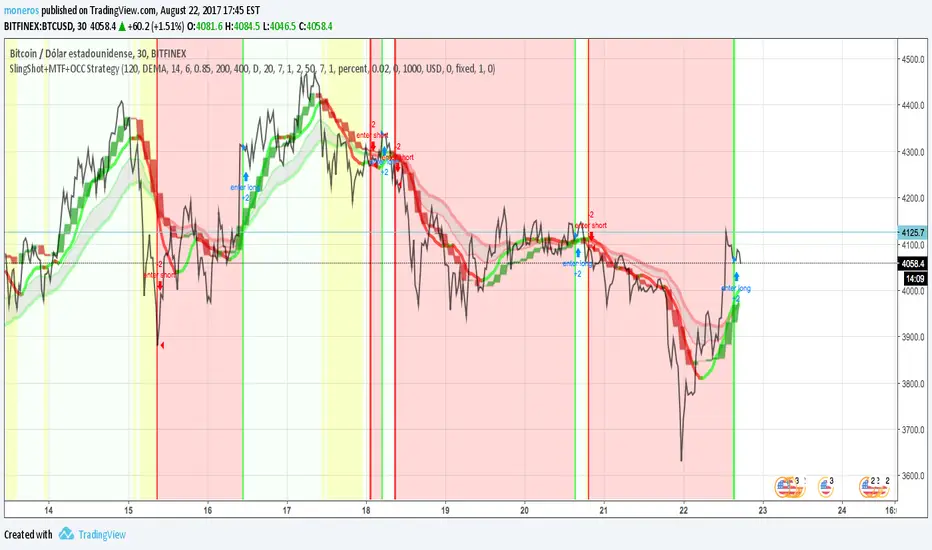
SlingShot + MTF + Open Close Cross StrategyIt's a merge of three really good scripts CM sling shot, CM MTC and Open Close Cross
Indicates open and close with Sling shot and shots after peaks by MTC and OCC.
Yellow zones before drop prices, green bar, red bar for open and close.
imgur.com
Flux AI PullBack System (Hybrid Pro)Flux AI PullBack System (Hybrid Pro)
//Session-Aware | Adaptive Confluence | Grace Confirm Logic//
Overview:
The Flux AI PullBack System (Hybrid Pro v5) is an adaptive, session-aware pullback indicator designed to identify high-probability continuation setups within trending markets. It automatically adjusts between “Classic” and “Enhanced” logic modes based on volatility, volume, and ATR slope, allowing it to perform seamlessly across different market sessions (Asian, London, and New York).
Core Features:
Hybrid Auto Mode — Dynamically switches between Classic (fast-moving) and Enhanced (strict) modes.
Session-Aware Context — Optimized for intraday trading in ES, NQ, and SPY.
Grace Confirmation Logic — Validates pullbacks with a follow-through condition to reduce noise.
Adaptive EMA Zone (38/62) — Highlights pullback areas with dynamic aqua fill and transparency linked to trend strength.
Noise Suppression Filter — Prevents false pullbacks during EMA crossovers or unstable transitions.
Weighted Confluence Model — Combines trend, ATR, volume, and swing structure for confirmation strength.
Pine v6 Compliant Alerts — Constant-string safe, ready for webhooks and automation.
Visual Elements:
Aqua EMA Zone: Displays the “breathing” pullback band (tightens during volatility spikes).
PB↑ / PB↓ Markers: Confirmed pullbacks with subtle transparency and fixed label size.
Bar Highlights: Yellow for pullbacks; ice-blue for confirmed continuation.
Use Cases
Perfect for:
Intraday trend traders
0DTE SPX / ES scalpers
Futures traders (NQ, MNQ, MES)
Algorithmic strategy builders using webhooks
Recommended Timeframes:
1–15 minute charts (scalping / intraday)
Higher timeframes for swing confirmations.
Attribution:
This open-source script was inspired by Chris Moody’s “CM Slingshot System” and JustUncleL’s Pullback Tools, but it was built from scratch using AI-assisted code refinement (ChatGPT).
All logic and enhancements are original, not derived from proprietary software.
License: MIT (Open Source)
© 2025 Ken Anderson — You may modify, use, or redistribute with credit.
Keywords:
Pullback, Reversal, AI Trading, EMA Zone, Session Aware, Futures Trading, SPX, ES, NQ, ATR Filter, Volume Confirmation, Flux System, Pine Script v6, Non-Repainting, Adaptive Trading Indicator.

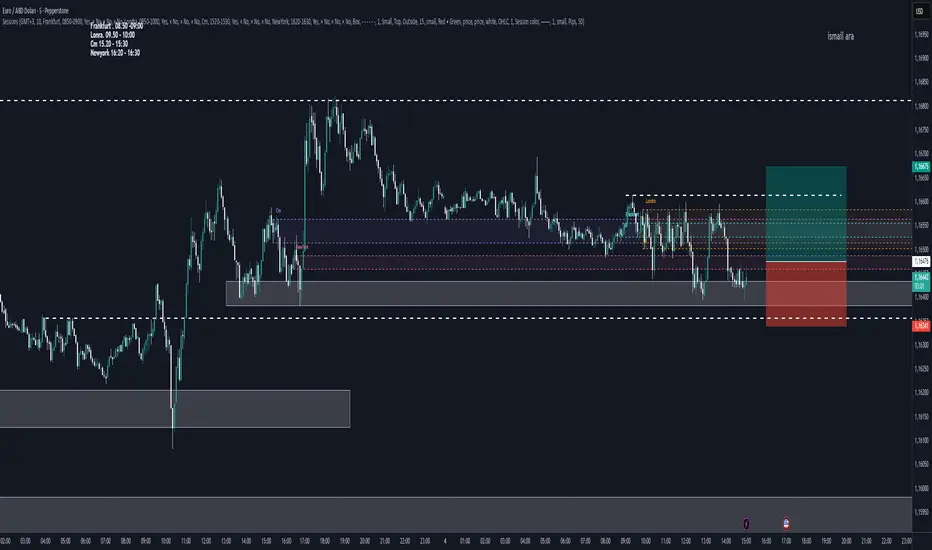
FX Market Sessions serkanMarket stock market opening and closing indicators
Opening and closing time ranges
Frankfurt
London
CM
New York opening and closing time ranges
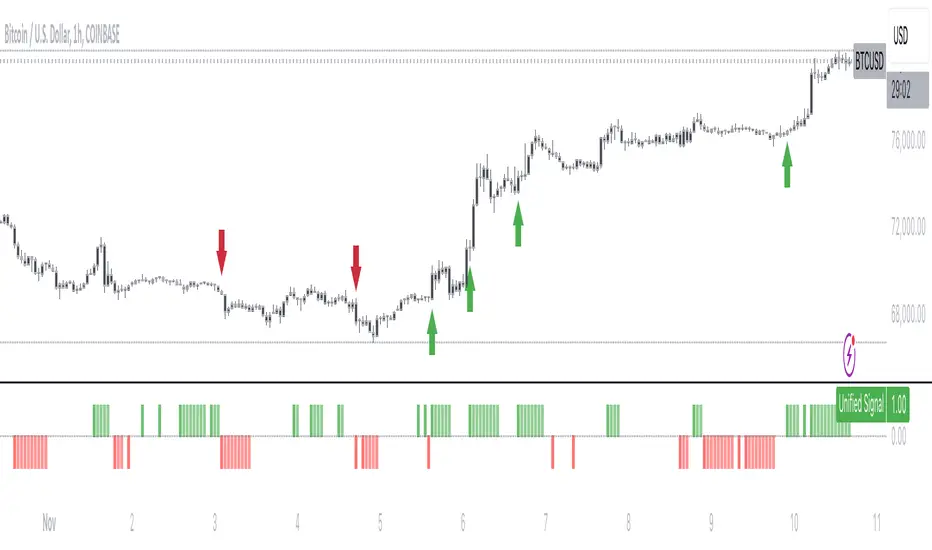
Volume Flow ConfluenceVolume Flow Confluence (CMF-KVO Integration)
Core Function:
The Volume Flow Confluence Indicator combines two volume-analysis methods: Chaikin Money Flow (CMF) and the Klinger Volume Oscillator (KVO). It displays a histogram only when both indicators align in their respective signals.
Signal States:
• Green Bars: CMF is positive (> 0) and KVO is above its signal line
• Red Bars: CMF is negative (< 0) and KVO is below its signal line
• No Bars: When indicators disagree
Technical Components:
Chaikin Money Flow (CMF):
Measures the relationship between volume and price location within the trading range:
• Calculates money flow volume using close position relative to high/low range
• Aggregates and normalizes over specified period
• Default period: 20
Klinger Volume Oscillator (KVO):
Evaluates volume in relation to price movement:
• Tracks trend changes using HLC3
• Applies volume force calculation
• Uses two EMAs (34/55) with a signal line (13)
Practical Applications:
1. Signal Identification
- New colored bars after blank periods show new agreement between indicators
- Color intensity differentiates new signals from continuations
- Blank spaces indicate lack of agreement
2. Trend Analysis
- Consecutive colored bars show continued indicator agreement
- Transitions between colors or to blank spaces show changing conditions
- Can be used alongside other technical analysis tools
3. Risk Considerations
- Signals are not predictive of future price movement
- Should be used as one of multiple analysis tools
- Effectiveness may vary across different markets and timeframes
Technical Specifications:
Core Algorithm
CMF = Σ(((C - L) - (H - C))/(H - L) × V)n / Σ(V)n
KVO = EMA(VF, 34) - EMA(VF, 55)
Where VF = V × |2(dm/cm) - 1| × sign(Δhlc3)
Signal Line = EMA(KVO, 13)
Signal Logic
Long: CMF > 0 AND KVO > Signal
Short: CMF < 0 AND KVO < Signal
Neutral: All other conditions
Parameters
CMF Length = 20
KVO Fast = 34
KVO Slow = 55
KVO Signal = 13
Volume = Regular/Actual Volume
Data Requirements
Price Data: OHLC
Volume Data: Required
Minimum History: 55 bars
Recommended Timeframe: ≥ 1H
Credits:
• Marc Chaikin - Original CMF development
• Stephen Klinger - Original KVO development
• Alex Orekhov (everget) - CMF script implementation
• nj_guy72 - KVO script implementation
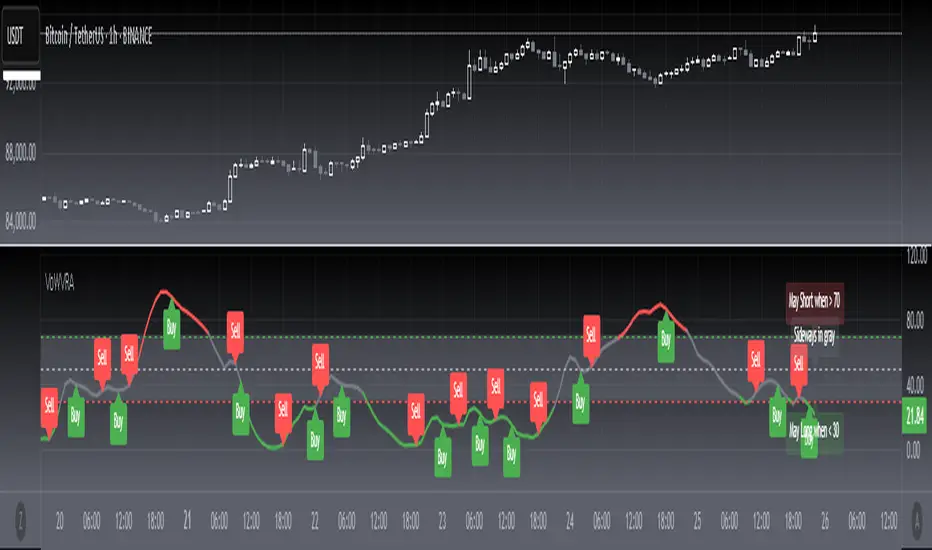
[blackcat] L2 Votatility of Williams VixFix Risk AssessmentHey there! I previously wrote an article about the Larry Williams ViX Fix technical indicator. Soon after, friends from the TradingView community told me that this indicator could be combined with the Risk Assessment indicator I wrote about earlier to determine when to go long or short. At the time, I found it a bit cumbersome to use both indicators together, so I came up with a solution: to merge them. This way, we can use one technical indicator to visually see whether we should go long or short. Isn't that cool? The indicator has a very common name: ** L2 Votatility of Williams VixFix Risk Assessment, or VoWVRA for short.**
This TradingView Pine Script is a custom indicator based on the Larry Williams ViX Fix technical indicator, designed to help traders with risk assessment and trading decisions. The Larry Williams ViX Fix indicator is derived from the volatility of the S&P 500 index and is mainly used to display changes in current market sentiment. The indicator determines market volatility by calculating the distance between the highest price, the lowest price, and the closing price. The higher the value of the indicator, the more tense the market sentiment, and the higher the market volatility; conversely, the lower the value, the more stable the market sentiment and the lower the market volatility.
The VoWVRA indicator is based on the Larry Williams ViX Fix indicator, combined with technical indicators such as Bollinger Bands and EMA, to assess market risk. The indicator can be customized with input parameters to suit different markets and investor needs. Using the VoWVRA indicator can help traders make wiser choices in risk control and trading decisions.
In addition, this TradingView Pine Script also includes a risk assessment indicator. The indicator calculates a series of values and then applies the exponential moving average (EMA) to the percentage change between the closing price and the highest and lowest prices within a certain range to determine the safety level. The safety level is then compared to different thresholds to determine the market's risk level. The risk assessment indicator can be customized with input parameters such as risk length, safety length, and EMA length to suit different market conditions and investor preferences. Using the risk assessment indicator can help traders make wiser decisions in risk management and trading strategies.
By using the VoWVRA and risk assessment indicators, traders can more accurately assess market risk and make wiser choices in trading decisions.
CM_Williams_Vix_Fix - Market Top and Bottom with multi-timeframeThis is a modification of CM_Williams_Vix_Fix indicator to include both market tops and bottoms with multi-timeframe support. The original indicator only finds market bottoms.
All credits go to the original author ChrisMoody.
Original script link
Working:
The histogram above 0 signifies the trend of market going UP and the histogram below 0 signifies the trend of market going DOWN.
The histogram bar is calculated using "LookBack Period Standard Deviation High" number of candles. A threshold is calculated using bollinger bands and based on percentile of "Look Back Period Percentile High" number of candles.
If the histogram bar above 0 crosses the up threshold then we have market top which is signified by histogram bar having the color green. If the histogram bar below 0 crosses the down threshold then we have market bottom which is signified by histogram bar having the color red.
The market tops and bottoms can also be calculated across multiple timeframes.
Sample usage:
Suppose the market is in an uptrend and the indicator displays red market bottom bar, this might be an indication that the market has reached the end of a pullback. We can use additional indicators like stochastic or rsi to get additional confluence.
This indicator does not repaint but you need to wait for the candle to close.

Current Market StrengthThe **CMS** allows people to understand the current market strength by looking at the last candles and creating an analysis alongside the RSI (Relative Strength Index).
It works by looking at x amount of candles. Default 10.
Then checks how high the current open candle is in comparison to the last candles. Checking through all those candles. Creating a placement.
Once the placement has been found then this indicator will get the RSI / 10, and add that onto the placement.
The end result will look similar to the RSI, just more volatile to detect more precise scalping points.
Feel free to change the value of 'x' stated in above in the setting menu.

Williams Vix Fix Bottoms and TopsThis indicator uses the very popular Williams Vix Fix for Bottoms by Chris Moody but not only does it search for bottoms, it can also be switch to work for tops for those who look to short the market. I've also added in a few options like flipping the indicator, color adjustments on the settings page, as well as cut a few of the options I feel did not need to be in which cluttered the screen when the settings were opened. In his later revisions of the Williams Vix Fix, CM took out the functions which draw the high/low ranges as well as the standard deviation which is what this indicator uses to show entry points. I have added options back on to draw these, I think it's useful. To be honest, I have not messed around with the number settings much so I am not sure how adjusting the look back range or going for smaller / bigger percentage changes would change how well the indicator works. It seems to work very well at its default settings.
With the Bollinger Band deviation, you have to remember that it looks back at the set amount of candles (20 by default) and uses those for the standard deviation: 1 dev = 68%, 2 dev = 95%, 3 dev = 99.7%
These percentages mean that at 2 dev, 95% of the last 20 candles will remain within the boundaries of the Bollinger Bands. Three tends to be too high, one is usually too low. Two is pretty good.
The lowest percentile option probably won't change much other than bring up the bottom line which doesn't effect the alerts or signals, just something to observe.
The highest percentile option makes a difference similar to the stand deviation and Bollinger Band. The higher you put it, the less likely it will get triggered but the more reliant it of a signal it should be.
As always, I have left notes throughout the code and I did leave in the code that was original but commented it out as I don't believe it's worth having.
I like to have the high/lows drawn, as well as the standard deviation. Then I find that the filtered entries are most accurate signals to follow. Simple entry is hit or miss, Aggressive entry is always early but sometimes that's not a great thing.
Vix FIX / StochRSI Strategy
Updated to Pine V5
Enter upon a filtered or aggressive entry
If there are multiple entry signals, allow pyramiding
Exit when there is Stochastic RSI crossover above 80
Work with some futures and futures timeframes
Based on Chris Moody's Vix Fix
Crypto Volume/Strength ComparatorHello Traders,
Here is an attempt to perform comparative analysis between top cryptos based on strength (oscillator) and volume. Methodology used here is similar to Magic Number formula described in the post : Enhanced Magic Formula for fundamental analysis . But, instead of using fundamentals, we are making use of few technicals to derive similar outcome. Usage of the available stats will not be same as Magic number since we are using technicals.
⬜ Process
▶ Get crypto exchange based on prefix of instrument being used.
▶ For the given exchange, get data for all the tickers available in input fields.
▶ Calculate Oscillator, Momentum based on price for each tickers.
▶ Calculate Oscillator, Momentum based on volume for each tickers.
▶ Calculate Volatility for each tickers.
▶ Rank Price-Oscillator, Price-Momentum, Volume-Oscillator, Volume-Momentum, Volatility for each tickers.
▶ Calculate combined rank by adding up individual ranks.
▶ Calculate movement of rankings from bar to bar
▶ Sort tickers based on rank and populate them on table. Display direction of rankings.
⬜ Components
Display components are as follows:
⬜ Settings
Settings are pretty simple and straightforward
⬜ Calculations
▶ Oscillators : High values of oscillators are considered as ideal as the process is intended towards finding trend.
▶ Momentum : Momentum is calculated on the basis of Squeeze Momentum Indicator by @LazyBear.
▶ Volatility : Volatility is calculated on the basis of Williams Vix Fix by @ChrisMoody. Here too since we are in trend following mode, lower vix fix is considered ideal.
⬜ Few Notes
Tickers will show data only if selected exchange has them. Some tickers are not available in all exchanges. In that case, it will show NAN. This is kind of unavoidable as we need to have fixed size arrays for any calculations.
Indicator works only on crypto tickers which has valid exchange.
Tickers move through the rankings in real time. Background of all stats are based on gradient from green to red.
Tickers on top may not always have better long opportunity or tickers at bottom may not always be optimal for shorting. We need to consider how long the instrument may stay in the position or how fast it is moving in opposite direction. Hence, directions of the ranking movement are also shown on the table.

Williams Vix Fix + Inverse [Alorse]The VIX Fix measures how close the current market price is to the lowest price of the last X candles. When prices are in uptrends, the close is usually near the high. But prices close near the low in downtrends.
It works because it’s based on how traders behave. The calculation fixes some of the problems with the VIX.
This indicator is based on CM_Williams_Vix_Fix Finds Market Bottoms and its great difference is that it adds the inverse functionality, also showing the possible highest areas of the market.

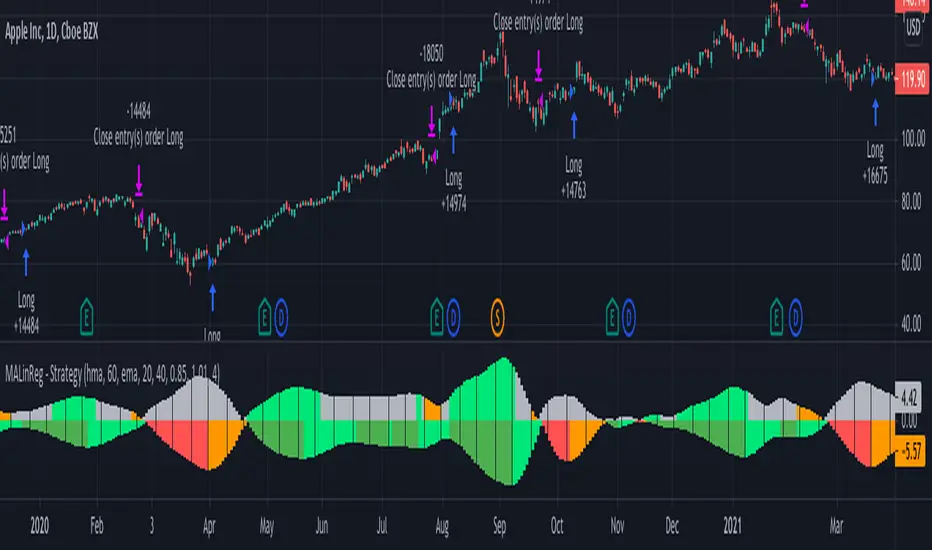
MACandles-LinearRegression-StrategyThis is combination of multiple indicators and strategies. Mainly useful for indexes and to time the entry and exits of indexes. No stoploss used - makes it less desirable for leveraged trades or trading individual stocks.
Let us rewind and look back at some of the indicators/strategies published earlier.
1. Moving Average Candles - this is one of my favourite tool for general trend filtering. Applying supertrend on moving average candles is one of the easiest ways to find reversal in trending market without exiting positions too early. Few scripts published on this basis are:
MA Candles Supertrend
MA Candles Supertrend Strategy
2. VixFix and Linear Regression - this itself is combination of two indicators.
Williams-Vix-Fix-Finds-Market-Bottoms - by @ChrisMoody
Squeeze-Momentum-Indicator - by @LazyBear
I have combined these two indicators to derive VIX-Fix linear regression to find absolute market bottoms. More description here:
VixFixLinReg-Strategy
VixFixLinReg-Indicator
Now, in this strategy, we combine all these together.
Derive moving average candles
Derive momentum of moving average candles
Derive Linear regression on momentum
Optionally, also calculate VIX Fix and Linear regression on VixFix momentum
To find market bottom:
There are two options
1. Use when momentum of MA candles hit bottom (red) and slowly turn up (orange). In aggressiveLong mode, signals are also generated when momentum starts going positive from negative.
2. Use Vix Fix linear regression of MA candles as described in the original script of VixFixLinReg-Strategy
To find market top
Here only Ma candles momentum decreasing is used as signal. If looking for longTrades , exit signal is generated only when momentum is turning negative extreme(orange). Or else, exit signal is generated when momentum has turned neutral.
At this stage, it is very much experimental - use it with caution :)