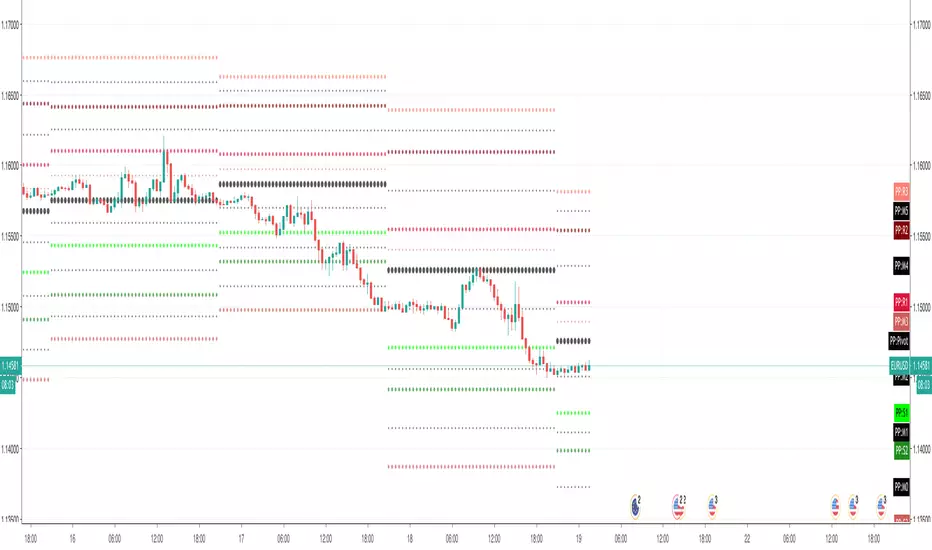
Pivot Points (with Mid-Pivots)Brief Description
Pivot points are horizontal support and resistance lines placed on a price chart. They make strong levels of support and resistance because banks, financial institutions and many traders use them.
The indicator is set to the Daily Pivot Range by default (no support for weekly, monthly, quarterly, or yearly Pivots).
Indicator Settings
Show Mid-Pivots?
Show R3 and S3 levels?
Search in scripts for "daily"
ADR - Average Daily Range [@treypeng] [v2]
This is an intraday indicator.
Average Daily Range provides an upper and lower level around the daily open. It is calculated by taking an EMA/SMA average of a given number of previous days' True Range.
It can be useful for helping guide support and resistance, for taking profits and for placing stops.
It's a similar idea to the ATR indicator, but calculated on a daily timeframe only.
Settings:
Length: number of days to take an average from
Offset: Set this to 0 to include today's range. Set to 1 to exclude today. Set to 2 to exclude today and yesterday.....and so on.
The other settings should be self explanatory :)

5 EMAS e 50% body candle by Blackwolf dailyScript to visualize 5 EMAS at period 5, 13, 50, 200, 800 for Daily timeframe and also it shows 50% bodycandle.
Use it to understand the trend and domand/supply zone.

Key Levels [@treypeng]Draws horizontal lines for Daily, Hourly (1) and Weekly levels. Really handy to switch on quickly when scalping.
Light blue: Previous hour OHLC
Thick light blue: Previous hour Close / current hour Open
Dark blue: Yesterday OHLC
Thick dark blue: Yesterday Close / today Open
Purple: Weekly Open
It's a bit ugly, I'd prefer horizontal rays instead of lines stretching back across the chart but I couldn't figure out how to do this in PineScript. If I get it sorted, I'll publish an update.

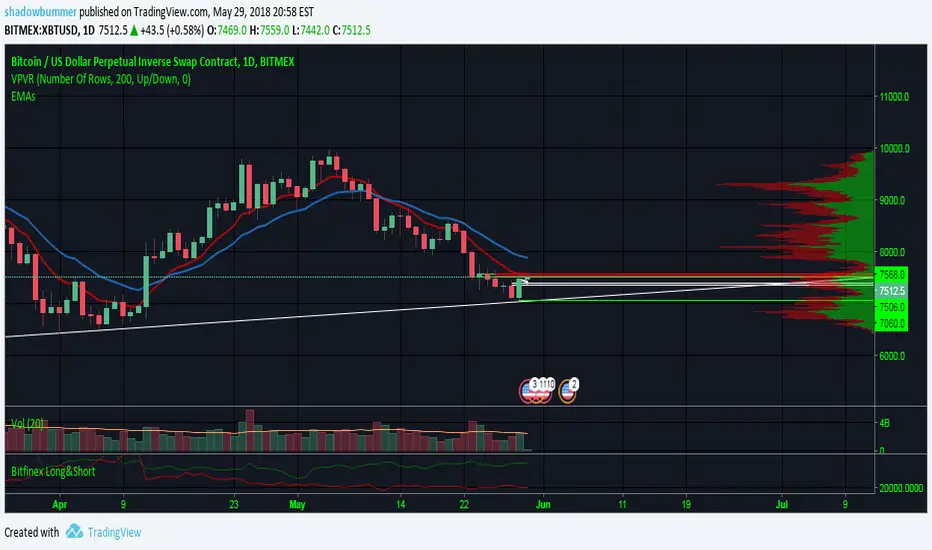
XBT Volatility Weighted Bottom Finder. [For Daily Charts]An update to:
Made it into and indicator.
v. 0.0.1
DESIGNED FOR DAILY CHARTS

Bitcoin Daily Buy & Sell SignalBitcoin Top Secret Found!
Trying to find potential Buy & Sell points.
It's pretty helpful and accurate in daily chart.
You could even use it on NASDAQ:NDX !
Invite only for valuation now.

Session RangeSimple script for showing the high/low/midrange of a session. By default configured to do the Daily range using the "regular" session. But it's configurable. For example on this chart I am showing the Weekly range.


BTCUSD - Previous Monthly and Daily Resistances [by JQBS]This indicator will plot the previous month's open/close and the last daily's high, low, close.

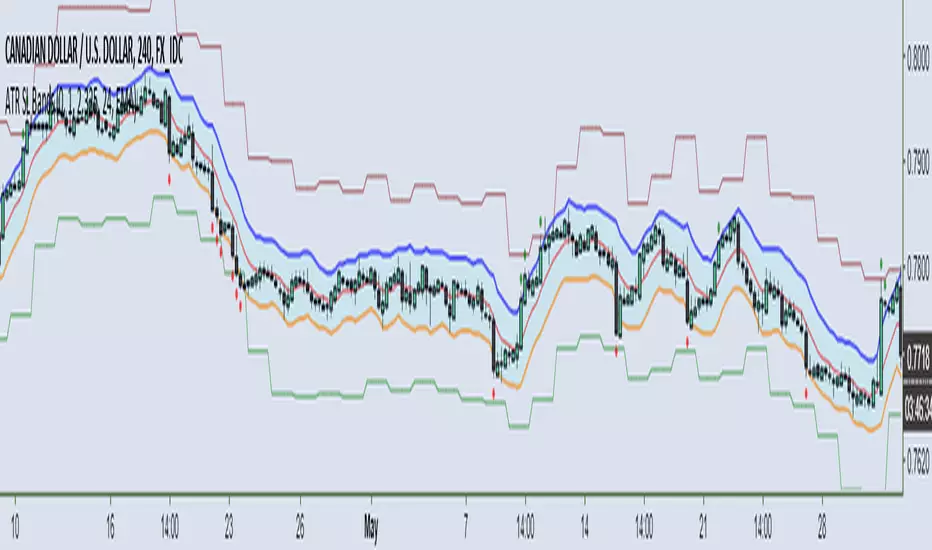
ATR Trailing Stop Bands [NeoButane]These ATR bands and trailing stops can be used as a way to manage risk, enter breakout trades, or as support/resistance.
Please see here for information about payment and access: medium.com
ATR Bands Features:
Shape plotted for closes out of bands
Custom resolution
Bands multiplier: useful for reducing size to increase signal
Band smoothing type: EMA, Hull MA, or no moving average smoothing
Calculated in geometric mean (log scaling) to resolve issues with flash dumps or pumps
Alerts for closing outside of bands
ATR Trailing Stop Features:
Based on daily resolution timeframe
Trailing stop multiplier: useful for curve-fitting to your instrument's normal trading range. Recommended multiplier between 1.5-3
Can be used as trading range (>3) or for breakout trading (<1.5)
Alerts for price touching stops
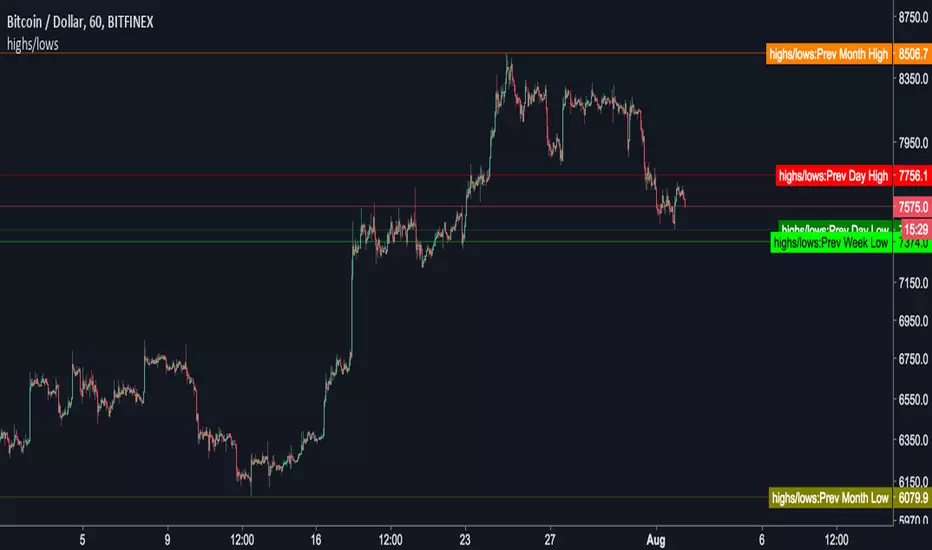
Instabots previous highs and lowsAdds previous daily, weekly and monthly highs and lows to the chart.
By default it just adds the price line to the chart. Change the default option to plot the highs and lows onto the chart, like below...
Peso Pros Daily DineroSignature indicator for use with the Peso Pros Daily Dinero strategy for the USDMXN. How to use the indicator is explained in detail in the members section of your online course.
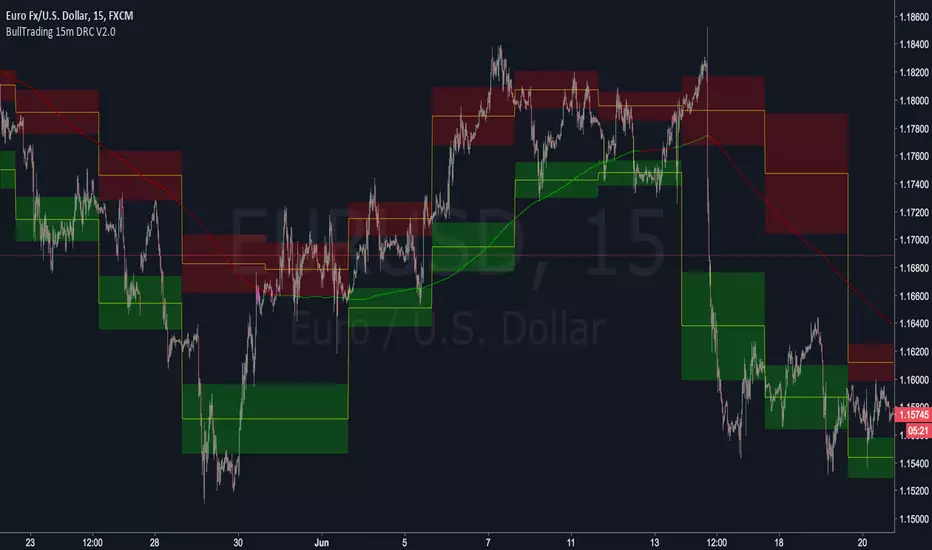
BullTrading 15 Min Daily Retracement Channel V2.0Hi Traders, I have been received tons of private messages asking me access to my previous scripts. Please let me apologize for not being able to answer all messages. Once you publish a script in Tradingview you can manage individual access to the script but there is no option to open the script after being published.
For that reason I decided to open this script for you, this indicator implements many of the best features contained in previous "invite only scripts". It is designed to display alerts for day trading and short term swings using the 15m Timeframe.
How to use "BullTrading 15 Min Daily Retracement Channel V2.0" indicator?
This indicator is experimental but works if the trader applies good judgment and risk management. Neither myself or BullTrading Asset Management is or will be responsible for any live trading loss using this script, so please use it on Demo.
ALWAYS USE PENDING ORDERS!! It is always much better to wait price using your Fibonacci Retracement tool or the indicator reference lines.
Set Buy signals AT THE CLOSE of yellow candlesticks.
Set Sell signals AT THE CLOSE of fuchsia candlesticks.
Most of the time Buy/Sell signals will react with too much anticipation so you can wait for the price to form enough fractals in order to analyze your entry levels, risk management, SL's and TP's.
AVOID AT ALL COSTS to enter the market immediately after a signal. WAIT for fractal formations to confirm reversals. I will say it AGAIN: Use only pending orders and AVOID market execution orders!
If your order is already filled and the moving average changes color or the price consolidates in your entry level it is better to trail tight your SL, exit the trade with small loss or Break Even instead of waiting for a full Stop Loss exit (this conditions usually indicate trend continuations against the indicator signals).
If the market goes against the signal, THINK and use the indicator lines and channels to match a level using your Fib retracement tool. Applying this criteria will lead for better entry levels in the opposite direction.
Feel free to comment suggestions.
Best Regards
GustavoRubi


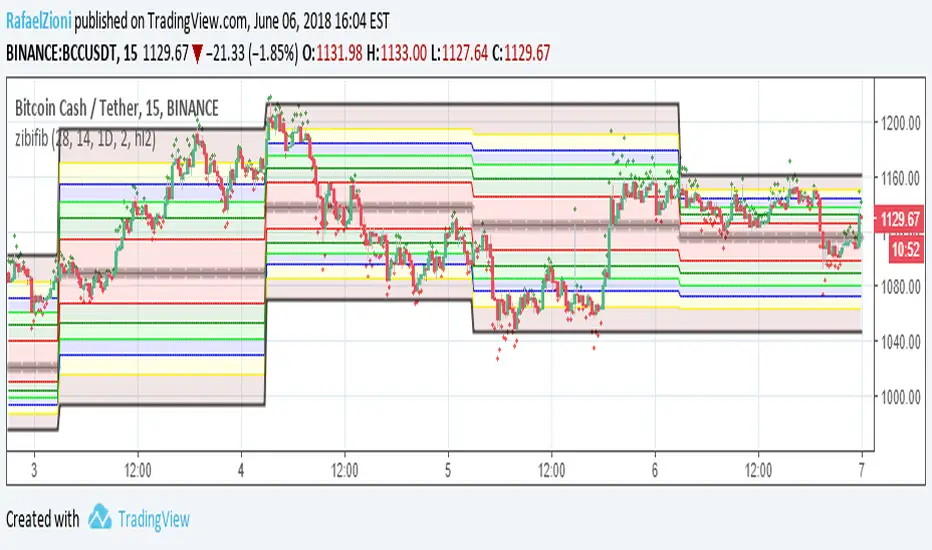
zibi fib smart way to use daily fib the idea based on using zibi indicator which is hipotecal price based on volume and to apply it to daily fib chart. zibi is preeceding the real price candle as it sense the volume changes not the actual price. buy is when zibi bellow -100 and sell when zibi above +100 . can be set to any fib that you choose. signal is easy to set via trading view. also the movment of zibi will tell you where the price will go as volume preceds price:)
the daily fib based on the work of justuncle
RSI: Daily + current TimeFrame
It plots the RSI of the current timeframe + the Daily RSI
it hihlights in green (or red) when they are both in oversold (or overbought)


Fibonacci Pivots Enhanced Levels (daily)Fibonacci pivot point levels
multiply the previous day’s range with its corresponding Fibonacci level.
Tradingview Standard Pivot Template includes S/R Levels 1 – 3 only .
I take into account additional Fibonacci pivot levels (S/R 4 – 7) on daily basis (no need for higher timeframes - weekly, monthly).

SMA's for Daily (7 Week//49MA, 30Week//210MA, 55SMA)SMA's for Daily (7 Week//49MA, 30Week//210MA, 55SMA)

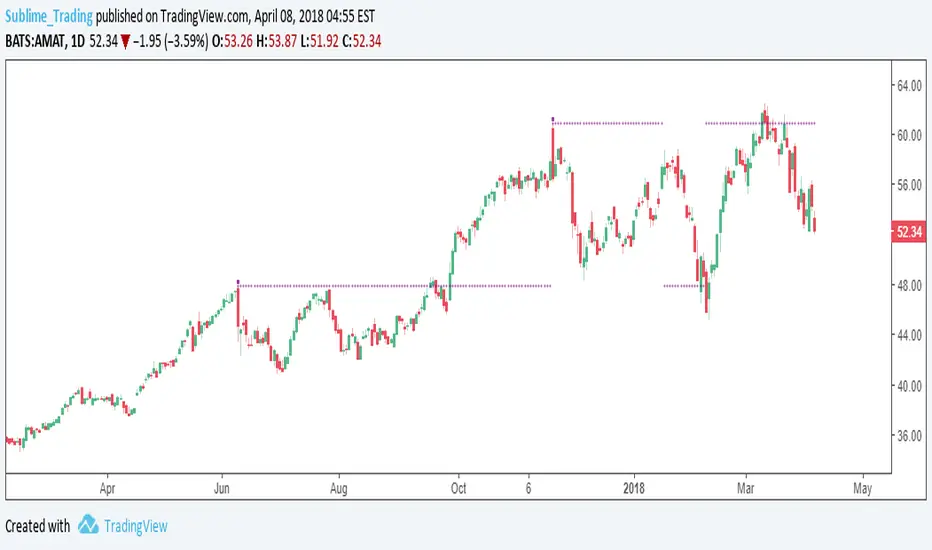
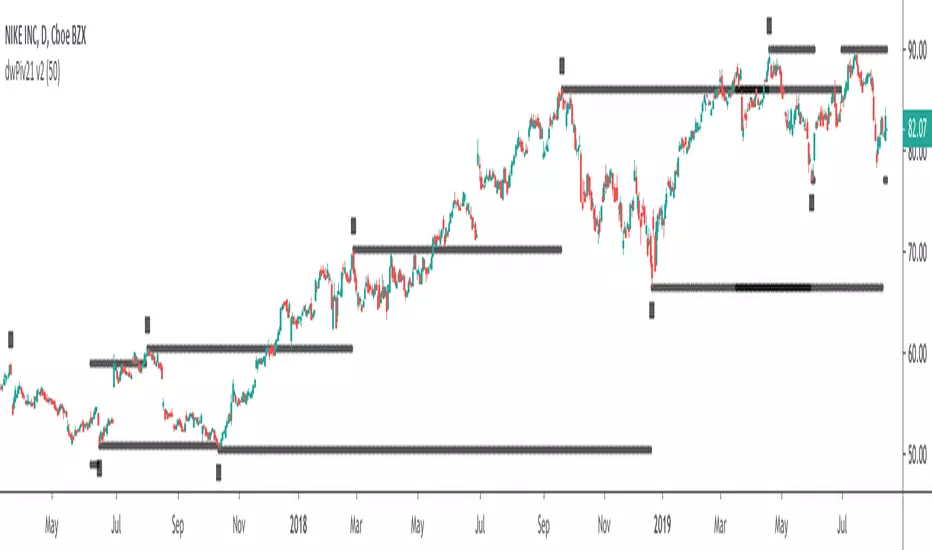
dwPiv21This is a customised indicator highlighting key levels of support and resistance on the daily time frame.
dwPiv11This is a customised indicator highlighting key levels of support and resistance on the daily time frame.