Ichimoku V5 by ChrisMoody - Daily Kijun Mod by JDNIchimoku V5 by ChrisMoody with Daily Kijun-Sen Mod by JDN
This indicator has been modified to allow you to display the Daily Kijun-Sen on all time frames.
Search in scripts for "daily"

DAPD - Daily Average Price Delta This indicator is similar to Bollinger Bands. It based on DAPD - Daily
Average Price Delta. DAPD is based upon a summation for each of the
highs (hod) for the 21 days prior to today minus the summation for
each of the lows (lod) for the last 21 days prior to today. The result
of this calculation would then be divided by 21.

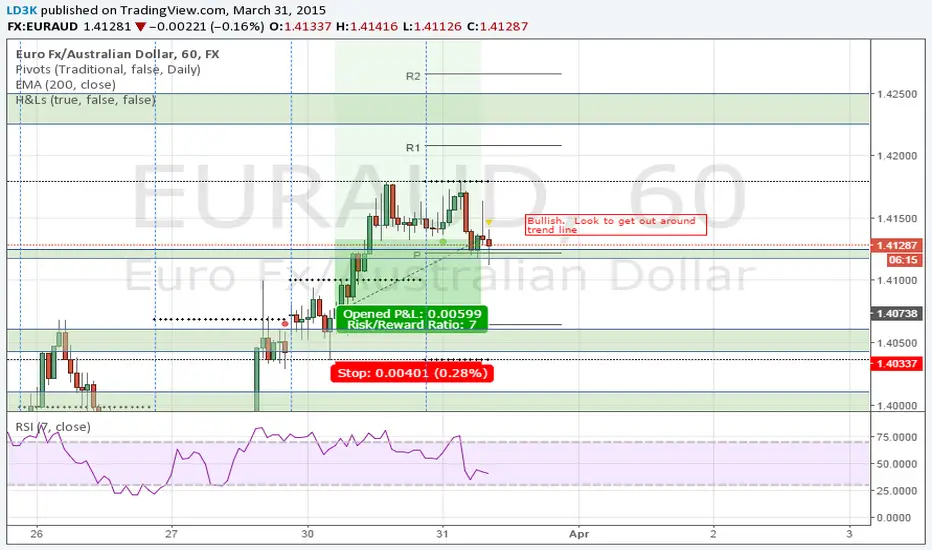
Code Plots - High, Low, Open, Close—Daily, Weekly, & Monthly!!!Custom Code Plots High, Low, Open, Close
Plots Today And/Or Previous Day
Daily, Weekly, & Monthly TimeFrames
Default Settings:
Green = High
Silver = Open
Fuchsia = Close
Red = Low
Current D-W-M = Circles as Plots
Previous D-W-M = Cross as Plots
By Default The Current Days High, Low, Open, Close Plots. There are Check boxes On The Inputs Tab To Turn All Options On And Off.
***Tip - For Intra-Day Trades…I Find It Useful To Plot Previous Days High, Low, Open, Close For Support/Resistance, & Breakout Levels. Plotting the Current Weekly and Monthly Levels Is Also Very Useful.
***If You Trade Daily Charts The Previous Months Levels Are Very Useful as Support/Resistance, & Breakout Levels….
Code For High, Low, Open, Close
pastebin.com
Video On Importing Custom Indicators from PasteBin:
videos.tradingview.com

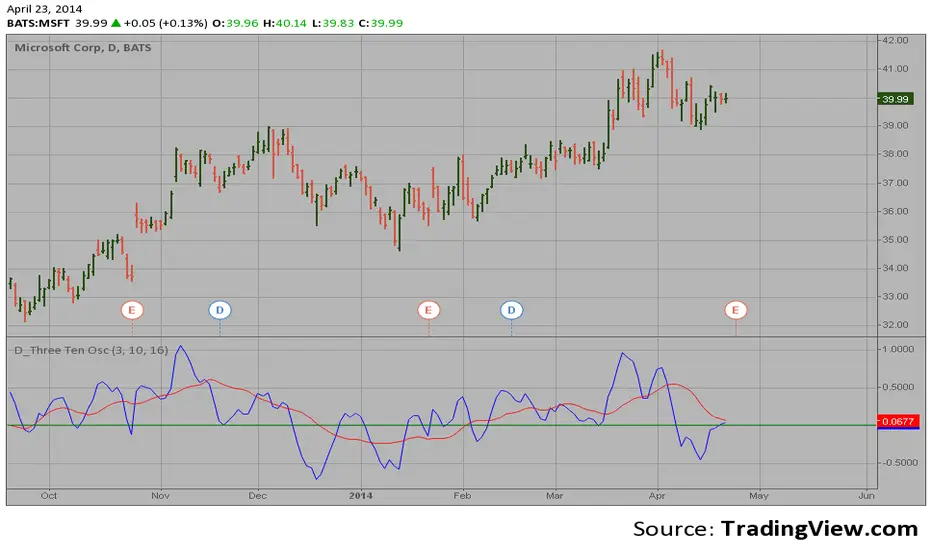
D_Three Ten Osc on the DailyHi
Let me introduce my D_Three Ten Osc script.
This indicator allows the
user to plot a daily 3-10 Oscillator on a Tick Bar Chart or any intraday interval.
Walter Bressert's 3-10 Oscillator is a detrending oscillator derived
from subtracting a 10 day moving average from a 3 day moving average.
The second plot is an 16 day simple moving average of the 3-10 Oscillator.
The 16 period moving average is the slow line and the 3/10 oscillator is
the fast line.
For more information on the 3-10 Oscillator see Walter Bressert's book
"The Power of Oscillator/Cycle Combinations"
trend&strengthwhen strength > 0, it's a bullish signal. more the strength value bigger ,more bullish.

Timeframe Overlay 24HrDaily High–Low Box (00:00–23:59)
This indicator highlights each trading day with a shaded box spanning from 00:00 to 23:59 (based on the selected timezone) and covering the day’s highest and lowest price.
• Green box when the day closes above its open
• Red box when the day closes below its open
• Historical days are fully drawn for easy comparison
• Current day box builds dynamically as new candles form
Useful for visualising daily range, market bias, and intraday structure across all timeframes.

OFM Key LevelsDaily and Weekly Levels Only
Daily Levels Calculated from RTH Sessions
Weekly Levels Calculated ETH

Renko SR VolumeDaily ATR Renko SR Levels with Volume Analysis is a technical indicator that combines Renko-based support/resistance levels with volume analysis. It dynamically calculates Renko boxes using the ATR (Average True Range) of daily data and identifies key price levels. The indicator:
- Uses daily ATR to determine Renko box size.
- Draws support/resistance levels based on Renko price structure.
- Analyzes volume between levels to assess their strength.
- Colors levels based on relative volume activity:
- Red – strongest level (high volume activity).
- Orange – strong level.
- Yellow – moderate level.
- Green – weakest level (low volume activity).
- Detects daily Renko-based trends.
This tool helps traders visualize key price zones with volume confirmation, improving decision-making in trend and range markets.

AP Index - Geomagnetic disturbancesDaily AP index back to 2015-01-01.
Geomagnetic disturbances can be monitored by ground-based magnetic observatories recording the three magnetic field components. The global Kp index is obtained as the mean value of the disturbance levels in the two horizontal field components, observed at 13 selected, subauroral stations . The name Kp originates from "planetarische Kennziffer" ( = planetary index).
The three-hour index ap and the daily indices Ap, Cp and C9 are directly related to the Kp index. In order to obtain a linear scale from Kp, J. Bartels gave the following table to derive a three-hour equivalent range, named ap index.
Geomagnetic Ap Index: The daily index Ap is obtained by averaging the eight values of ap for each day.
Based on the data from Helmholtz Centre Potsdam GFZ German Research Centre for Geosciences.

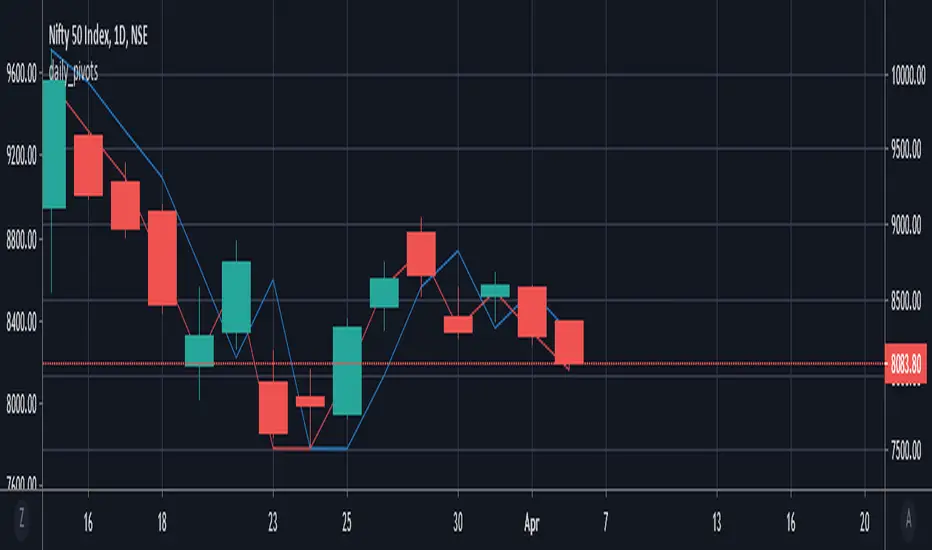
daily_pivots_beta_persistenttraderDaily central pivots for today and tomorrow are plotted. This is strictly BETA version.
Irrespective of timeframe chosen for the charts, it's DAILY pivots that are plotted.
Pls note that this is made available as-is and I make it clear that I am not responsible for any profilt or loss or any other outcome directly or indirectly arising out of use of this formula.
Trader X BotDaily Trend Strategy by Trader X
This bot should be used on the Daily timeframe in order to reveal the macro trend of the market. It is advisable to take swing trades in the direction that the bot is showing. In order to achieve maximum results set alerts to identify the shift in trend and find entries when the alert goes off.
Ideal Take Profit areas are the areas that the previous signal was given. Stop should be adjusted bellow major swing lows or above major swing highs.
Trade with cautious
-Trader X

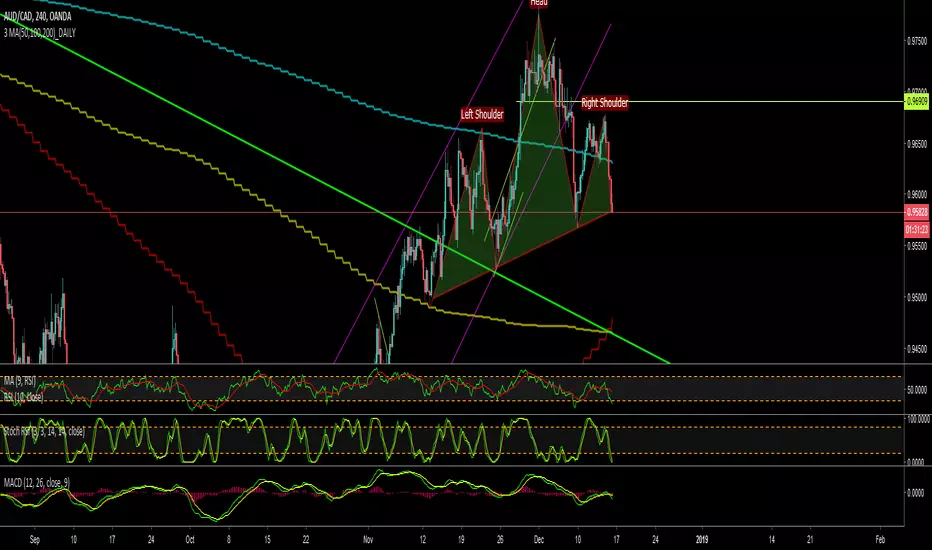
3 MA(50,100,200)_DAILYDaily Moving Average (50, 100, 200) in one code, indicates daily MA values in all time frames
Daily Candle Bias Backtesting Stats @MaxMaserati This indicator, is a powerful backtesting and probability tool designed to quantify the "follow-through" of specific candle types across different market sessions.
It identifies specific price action setups and tracks whether price hits a "Target" (continuation) or an "Invalidation" (reversal) first, providing real-time win rates for your favorite sessions.
The Candle Bias Stats indicator automatically categorizes every candle based on the MMM candle bias and tracks their historical success rate. It calculates how often a candle's high/low is broken before its opposite end is touched. By breaking this data down into sessions (Asian, London, NY), it identifies high-probability "time-of-day" windows where specific price action setups are most reliable.
MMM CANDLE LOGIC
Bullish Expansion & Breakout Signatures
Bullish Body Close Plus (BuBC Plus): Represents strong bullish momentum where price closes above the previous high and near its own top, signaling that buyers are in complete control.
Bullish Body Close Minus (BuBC Minus): Indicates weak bullish momentum; while the price closes above the previous high, a long top wick shows sellers pushed back, suggesting a potential retest of the previous high.
Bearish Expansion & Breakout Signatures
Bearish Body Close Plus (BeBC Plus): A very strong bearish signal where price closes below the previous low and near its own bottom, indicating sellers are dominant.
Bearish Body Close Minus (BeBC Minus): Signifies weak bearish momentum; the price breaks the previous low but finishes with a long bottom wick as buyers push back, often leading to a retest of the old ceiling.
Bullish Reversal & Trap Signatures (Affinity)
Bullish Affinity Plus (BuAF Plus): A strong bullish reversal where a new low is made, but sellers hit a wall and get trapped, causing price to finish near its top with a long bottom wick.
Bullish Affinity Minus (BuAF Minus): A weak bullish bounce where a new low is made and price finishes back inside the previous range, but buyers lack the energy for a significant move.
Bearish Reversal & Trap Signatures (Affinity)
Bearish Affinity Plus (BeAF Plus): A strong bearish reversal; buyers are trapped after making a new high, and price finishes near its bottom with a long top wick.
Bearish Affinity Minus (BeAF Minus): A weak bearish drop where sellers stop the rise but lack the energy to push price significantly lower.
Neutral & Volatility Signatures
Close Inside Bullish (CI•BuAF): Bullish neutral state where price stays inside the previous candle’s range but finishes in the top half, indicating buyers are slightly more active.
Close Inside Bearish (CI•BeAF): Bearish neutral state where price remains inside the previous box and finishes in the bottom half.
Seek & Destroy Bullish (S&D•BuAF): Bullish volatility characterized by price moving above and below the previous candle before buyers win the battle and close price near the top.
Seek & Destroy Bearish (S&D•BeAF): Bearish volatility where sellers win a high-chaos battle, closing price near the bottom after sweeping both sides of the previous candle.
H4 CANDLE EXAMPLE
Deep Dive: Analysis of the 4H Statistics
The image presents a comprehensive backtest of 4,999 total candles from September 2022 to December 2025. Here is the breakdown of what the interface is telling us:
1. The Strategy: Target vs. Invalidation
The indicator tracks BuBC (Bullish Body Close) and BeBC (Bearish Body Close).
The Target: For a Bullish candle, the target is the High. For a Bearish candle, it is the Low.
The Invalidation: The opposite end of the candle (the Low for Bullish, the High for Bearish).
The Goal: To see which level is touched first in the subsequent bars.
2. Global Performance (The Top Right Table)
Looking at the BuBC (1402 samples) section:
Target First (67.8%): In nearly 7 out of 10 cases, once a 4H candle closes "bullish" (breaking the previous high), the price continues higher to break its own high before it ever returns to take out its own low.
Both Hit (17.7%): This is a critical metric. It represents "Stop Runs" or "Wicks" where price hits the target but also hits the invalidation within the same tracking period.
Efficiency (1.3 Bars): This tells us the "follow-through" is almost immediate. If the trade doesn't work within 1 or 2 candles, the statistical edge drops off significantly.
3. The Session Breakdown (The Bottom Left Table)
This is where the "Edge" is found. Not all hours of the day are created equal.
Asian Late (02:00-06:00) – The "Star" Performer: With a 72.9% Target rate, this is labeled "BEST." It has the lowest "Both%" (6.5%), meaning moves during these hours are incredibly "clean." If a setup forms here, price usually moves directly to the target without looking back.
London Open & Overlap (06:00-14:00): These sessions maintain a high win rate (approx. 70%). This suggests that the European session provides reliable trend continuation for the S&P 500.
NY Session (14:00-18:00) – The "Trap" Zone: This is labeled "WORST" for a reason. While the win rate is basically a coin flip (49.6%), the Both% spikes to 36.7%. This means that even if you are right about the direction, the market is highly likely to "sweep" your stop loss before going to the target. It is the most volatile and "fake-out" prone time for this specific setup.
Summary of the Data
The statistics show that the S&P 500 4H Candle Bias is a highly reliable trend-following indicator, provided you trade it at the right time.
The data suggests a clear three-step logic:
Directional Edge: Both Bullish and Bearish body closes have a natural ~67% probability of continuation.
Timing is Everything: Trading during the Late Asian and London sessions increases your probability of success to over 70% with very low risk of a "fake-out."
Risk Warning: Avoid "Body Close" breakout strategies during the NY Mid-day (14:00-18:00). The statistics prove that this window is dominated by "Seek and Destroy" price action, where price is mathematically likely to hit both your target and your stop, usually hitting the stop first.

Daily Quarters by (Pecurtoo)This indicator divides each trading day into four configurable time blocks using vertical lines plotted directly on the chart. Each session boundary is fully customizable, allowing traders to adapt the schedule to any market, strategy, or timezone.
Key Features
Four independent session start times (editable from settings)
Optional global hour offset (+/−) for timezone or DST adjustments
Individual color control for each session line
Adjustable line style (solid, dashed, dotted) and line width
Automatically updates every day
Designed for intraday trading and session-based analysis
Cases use
Market session visualization (Asia, London, New York, custom sessions)
Time-based trading strategies
Killzone and liquidity window tracking
Day structure and rhythm analysis
Notes
Uses the chart’s exchange timezone by default
Best suited for intraday timeframes

Daily SMA 20/50/100/200Simple Moving Averages indicator displaying four commonly used trend lines on the price chart. Plots the 20, 50, 100, and 200 period SMAs to help identify short-, medium-, and long-term trend direction, dynamic support and resistance, and overall market structure. Color-coded for clarity: 20 SMA in green, 50 SMA in blue, 100 SMA in orange, and 200 SMA in red, with uniform line thickness for clean visual consistency.

Daily SMA 20/50/100/200Simple Moving Averages indicator displaying four commonly used trend lines on the price chart. Plots the 20, 50, 100, and 200 period SMAs to help identify short-, medium-, and long-term trend direction, dynamic support and resistance, and overall market structure. Color-coded for clarity: 20 SMA in green, 50 SMA in blue, 100 SMA in orange, and 200 SMA in red, with uniform line thickness for clean visual consistency.

Daily SMA 20/50/100/200Simple Moving Averages indicator displaying four commonly used trend lines on the price chart. Plots the 20, 50, 100, and 200 period SMAs to help identify short-, medium-, and long-term trend direction, dynamic support and resistance, and overall market structure. Color-coded for clarity: 20 SMA in green, 50 SMA in blue, 100 SMA in orange, and 200 SMA in red, with uniform line thickness for clean visual consistency.

Daily & Pre-Market Key Levels (v5)Plots:
- Today's high/low
- Pre-market High/Low
- Yesterday's high/low/close
- Day before yesterday high/low

Daily OpenThis is a protected/private script. To request access, please provide:
TradingView username (required)
Your main market(s) and timeframe(s)
Intended use (education / backtesting / live trading)
(Optional) Any proof of eligibility if applicable
Once your request is reviewed, access will be granted to the username provided.
Usage Terms:
No copying, modifying, distributing, publishing, or reselling of this script or its logic
Access is granted to approved accounts only
This script is a tool for analysis and not financial advice; you assume all trading risks
The author reserves the right to update the script or revoke access at any time

Daily Vertical Linesadjust the time hour and minute base on ur timeframe.
please note that for asian beijing time you will need to deduct 1 hour

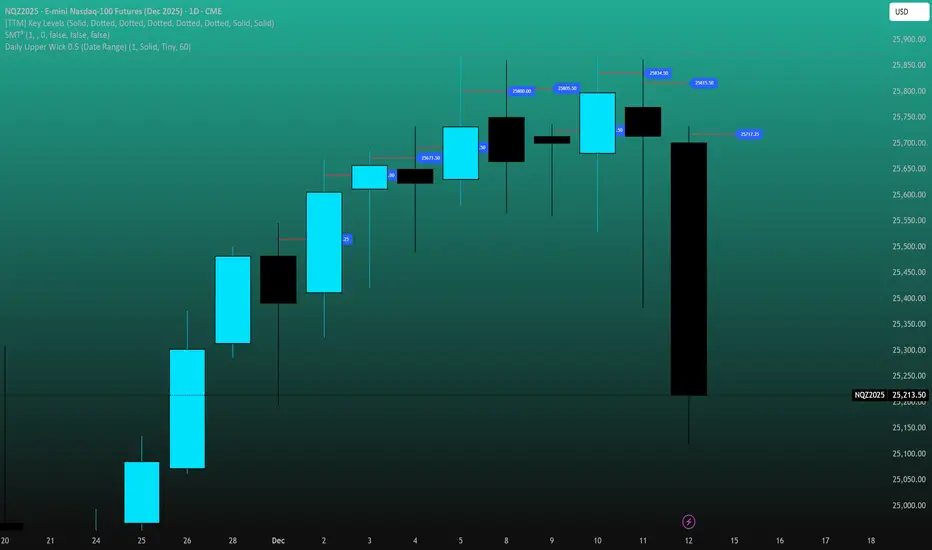
Daily Upper Wick 0.5 (Date Range)Appearance settings modified: Extend lines OFF, level color, Date Range filter, line thickness, Prices labeled and resized tiny, plot lines OFF.
Daily Lower Wick 0.5 (Date Range)Appearance settings modified: Extend lines OFF, level color, Date Range filter, line thickness, Prices labeled and resized tiny, plot lines OFF.
