RedK_Supply/Demand Volume Viewer v1Background
============
VolumeViewer is a volume indicator, that offers a simple way to estimate the movement and balance (or lack of) of supply & demand volume based on the shape of the price bar. i put this together few years ago and i have a version of this published for another platform under different names (Directional Volume, BetterVolume) in case you come across them
what is V.Viewer
=====================
The idea here is to find a "simple proxy" for estimating the demand or supply portions of a volume bar - these 2 forces have the potential to affect the current price trend so we want an easy way to track them - or to understand if a stock is in accumulation or distribution - we want to do this without having access to Level II or bid/ask data, and without having to get into the complexity of exploring the lower timeframe price & volume data
- to achieve that, we depend on a simple assumption, that the volume associated with an up move is "demand" and the volume associated with a down move is "Supply". so we basically extrapolate these supply and demand values based on how the bar looks like - a full "green" price bar / candle will be considered 100% demand, and a full "red" price bar will be considered 100% supply - a bar that opens and closes at the same level will be 50/50 split between supply & demand.
- you may say this is a "too simple" of an assumption to make, but believe me, it works :) at least at the basic scenario we need here: i'm just exploring the volume movement and finding key levels - and it provides a good improvement compared to the classic way we see volume on a chart - which is still available here in VolumeViewer.
in all cases, i consider this to be work in progress, so i'd welcome any ideas to improve (without getting too complicated) - there's already a host of great volume-based indicators that will do the multi timeframe drill down, but that's not my scope here.
Technical Jargon & calculation
===========================
1. first we calculate a score % for the volume portion that is considered demand based on the bar shape
skip this part if it sounds too technical => if you're into coding indicators, you would probably know there are couple of different concepts for that algorithm - for example, the one used in Balance Of Power formula - which i'm a big fan of - but the one i use here is different. (how?) this is my own, ant it simply applies double weight for the "wick" parts of a price bar compared to the "body of the bar" -- i did some side-by-side comparison in past and decided this one works better. you can change it in the code if you like
2. after calculating the Bull vs Bears portion of volume, we take a moving average of both for the length you set, to come up with what we consider to be the Demand vs Supply - as usual, i use a weighted moving average (WMA) here.
3. the balance or net volume between these 2 lines is calculated, then we apply a final smoothing and that's the main plot we will get
4. being a very visual person, i did my best to build up the visuals in the correct order - then also to ensure the "study title" bar is properly organized and is simple and useful (Full Volume, Supply, Demand, Net Volume).
- i wish there was a way in Pine to hide a value that i still need to visually plot but don't want it showing its value on the study title bar, but couldn't find it. so the last plot value is repeated twice.
How to use
===========
- V.Viewer is set up to show the simplified view by default for simplicity. so when you first add it to a chart, you will get only the supply vs demand view you can see in the middle pane in the above chart
- Optional / detailed mode: go into the settings, and expose all other plots, you will be able to add the classic volume histogram, and the Supply / Demand lines - note these 2 lines will be overlay-ed on top of each other - this provides an easy way to see who is in control - especially if you change the display of these 2 lines into "area" style. This is what is showing in the lower pane in the above chart.
** Exploring Key Price Levels
- the premise is, at spots where there's big lack of balance, that's where to expect to find key price levels (support / resistance) and these price levels will come into play in future so can be used to set entry / exit targets for our trades - see the example in the AAPL chart where you can easily locate these "balance or reversal levels" using the tops/bottoms/zero-crossings from the Net Volume line
** Use for longer-term Price Analysis
- we can also use this simple indicator to gain more insights (at a high level) of the price in terms of accumulation vs distribution and if the sellers or buyers are in control - for example, in the above AAPL chart, V.Viewer tells us that buyers have been in control since October 19 - even during the recent drop, demand continued to be in play - compare that to DIS chart below for the same period, where it shows that the market was dumping DIS thru the weakness. DIS was bleeding red most of the time
Final thoughts
=============
- V.Viewer is an attempt to enhance the way we see and use Volume by leveraging the shape of the price bar to estimate volume supply & demand - and the Net between the 2
- it will work for stocks and other instruments as long as there's volume data
- note that V.Viewer does not track trend. each bar is taken in isolation of prior bars - the price may be going down and V.Viewer is showing supply going up (absorption scenario?) - so i suggest you do not use it to make decisions without consulting other trend / momentum indicators - of course this is a possible improvement idea, or can be implemented in another indicator, add in trend somehow, or maybe think of making this a +100 / -100 Oscillator .. feel free to play with these thoughts
- all thoughts welcome - if this is useful to you in your trading, please share with other trades here to learn from each other
- the code is commented - please feel free to use it as you like, or build things on top of it - but please continue to credit the author of this code :)
good luck!
-
Search in scripts for "demand"

DuoBlocks - ICT Order Block detectorDuoBlocks (ICT Order Block Detector)
(An ICT(Inner Circle Trading)-style Order Block(OB) tool that highlights only the most relevant and recent Demand/Supply zones using FVG and Engulfing based OB sources.)
Overview
DuoBlocks is an ICT-inspired Order Block detector that uses the mostly used two major order block types: FVG(Fair Value Gap) or Engulfing. There are many Order Block indicators out there, but I couldn’t find one that consistently highlights the most relevant, most recent OB relative to the current price without making the chart a mess and that's why so I built this script.
FVG-based OB (FVG-OB): OBs derived from 3-candle fair value gap logic.
Engulfing-based OB (Engulfing-OB): OBs derived from strong 2-candle reversal/displacement (engulf) logic.
Usage
FVG-OB (Fair Value Gap Order Blocks)
This script finds bullish/bearish FVGs and draws an Order Block zone from the candle that created the move. Think of these zones as your potential next support (bullish) and resistance (bearish) levels.
Engulfing-OB (Engulfing Order Blocks)
This script also finds strong bullish/bearish engulfing candles and draws an Order Block zone from the candle that got engulfed.
Same idea: treat them as potential next support (bullish) and resistance (bearish) levels.
**Use these zones like “next level” support/resistance areas. Don’t blindly buy/sell—wait for your own confirmation and manage risk properly.
Settings
Show FVG-OB
Toggle display of the selected FVG-based bullish/bearish OB (one per side).
Show Engulfing-OB
Toggle display of the selected Engulfing-based bullish/bearish OB (one per side).
Max Invalidation Attempts (FVG OB or Engulf OB)
Controls how many separate breach events a stored OB can absorb before it is marked invalid (discarded). The counting happens when either of below occurs.
Bullish OB: price prints a low below the OB bottom.
Bearish OB: price prints a high above the OB top.
Each time this happens, the OB’s invalidation counter increments by +1.
Once the counter reaches your Max Attempts, that OB is flagged as no longer live, so it will stop being eligible for selection. Then the script automatically falls through to the next best/next nearest valid OB in memory.
Right Extend (bars)
How far to extend the selected OB boxes to the right.
Lookback bars
Maximum historical bars scanned for detection. Lower values = faster/cleaner, higher values = more history retained.
Max stored OB per side
Maximum stored bullish and bearish OBs in memory (per source).
Bullish/Bearish OB Color
Controls border/midline coloring for bullish and bearish zones.
Disclaimer
This script is for educational and informational purposes only and does not constitute financial advice or investment recommendations. Trading cryptocurrencies and other financial instruments involves significant risk, and you are solely responsible for your own decisions based on your financial situation, objectives, and risk tolerance. The author assumes no liability for losses arising from the use of this indicator.

VPSA-VTDDear Sir/Madam,
I am pleased to present the next iteration of my indicator concept, which, in my opinion, serves as a highly useful tool for analyzing markets using the Volume Spread Analysis (VSA) method or the Wyckoff methodology.
The VPSA (Volume-Price Spread Analysis), the latest version in the family of scripts I’ve developed, appears to perform its task effectively. The combination of visualizing normalized data alongside their significance, achieved through the application of Z-Score standardization, proved to be a sound solution. Therefore, I decided to take it a step further and expand my project with a complementary approach to the existing one.
Theory
At the outset, I want to acknowledge that I’m aware of the existence of other probabilistic models used in financial markets, which may describe these phenomena more accurately. However, in line with Occam's Razor, I aimed to maintain simplicity in the analysis and interpretation of the concepts below. For this reason, I focused on describing the data using the Gaussian distribution.
The data I read from the chart — primarily the closing price, the high-low price difference (spread), and volume — exhibit cyclical patterns. These cycles are described by Wyckoff's methodology, while VSA complements and presents them from a different perspective. I will refrain from explaining these methods in depth due to their complexity and broad scope. What matters is that within these cycles, various events occur, described by candles or bars in distinct ways, characterized by different spreads and volumes. When observing the chart, I notice periods of lower volatility, often accompanied by lower volumes, as well as periods of high volatility and significant volumes. It’s important to find harmony within this apparent chaos. I think that chart interpretation cannot happen without considering the broader context, but the more variables I include in the analytical process, the more challenges arise. For instance, how can I determine if something is large (wide) or small (narrow)? For elements like volume or spread, my script provides a partial answer to this question. Now, let’s get to the point.
Technical Overview
The first technique I applied is Min-Max Normalization. With its help, the script adjusts volume and spread values to a range between 0 and 1. This allows for a comparable bar chart, where a wide bar represents volume, and a narrow one represents spread. Without normalization, visually comparing values that differ by several orders of magnitude would be inconvenient. If the indicator shows that one bar has a unit spread value while another has half that value, it means the first bar is twice as large. The ratio is preserved.
The second technique I used is Z-Score Standardization. This concept is based on the normal distribution, characterized by variables such as the mean and standard deviation, which measures data dispersion around the mean. The Z-Score indicates how many standard deviations a given value deviates from the population mean. The higher the Z-Score, the more the examined object deviates from the mean. If an object has a Z-Score of 3, it falls within 0.1% of the population, making it a rare occurrence or even an anomaly. In the context of chart analysis, such strong deviations are events like climaxes, which often signal the end of a trend, though not always. In my script, I assigned specific colors to frequently occurring Z-Score values:
Below 1 – Blue
Above 1 – Green
Above 2 – Red
Above 3 – Fuchsia
These colors are applied to both spread and volume, allowing for quick visual interpretation of data.
Volume Trend Detector (VTD)
The above forms the foundation of VPSA. However, I have extended the script with a Volume Trend Detector (VTD). The idea is that when I consider market structure - by market structure, I mean the overall chart, support and resistance levels, candles, and patterns typical of spread and volume analysis as well as Wyckoff patterns - I look for price ranges where there is a lack of supply, demand, or clues left behind by Smart Money or the market's enigmatic identity known as the Composite Man. This is essential because, as these clues and behaviors of market participants — expressed through the chart’s dynamics - reflect the actions, decisions, and emotions of all players. These behaviors can help interpret the bull-bear battle and estimate the probability of their next moves, which is one of the key factors for a trader relying on technical analysis to make a trade decision.
I enhanced the script with a Volume Trend Detector, which operates in two modes:
Step-by-Step Logic
The detector identifies expected volume dynamics. For instance, when looking for signs of a lack of bullish interest, I focus on setups with decreasing volatility and volume, particularly for bullish candles. These setups are referred to as No Demand patterns, according to Tom Williams' methodology.
Simple Moving Average (SMA)
The detector can also operate based on a simple moving average, helping to identify systematic trends in declining volume, indicating potential imbalances in market forces.
I’ve designed the program to allow the selection of candle types and volume characteristics to which the script will pay particular attention and notify me of specific market conditions.
Advantages and Disadvantages
Advantages:
Unified visualization of normalized spread and volume, saving time and improving efficiency.
The use of Z-Score as a consistent and repeatable relative mechanism for marking examined values.
The use of colors in visualization as a reference to Z-Score values.
The possibility to set up a continuous alert system that monitors the market in real time.
The use of EMA (Exponential Moving Average) as a moving average for Z-Score.
The goal of these features is to save my time, which is the only truly invaluable resource.
Disadvantages:
The assumption that the data follows a normal distribution, which may lead to inaccurate interpretations.
A fixed analysis period, which may not be perfectly suited to changing market conditions.
The use of EMA as a moving average for Z-Score, listed both as an advantage and a disadvantage depending on market context.
I have included comments within the code to explain the logic behind each part. For those who seek detailed mathematical formulas, I invite you to explore the code itself.
Defining Program Parameters:
Numerical Conditions:
VPSA Period for Analysis – The number of candles analyzed.
Normalized Spread Alert Threshold – The expected normalized spread value; defines how large or small the spread should be, with a range of 0-1.00.
Normalized Volume Alert Threshold – The expected normalized volume value; defines how large or small the volume should be, with a range of 0-1.00.
Spread Z-SCORE Alert Threshold – The Z-SCORE value for the spread; determines how much the spread deviates from the average, with a range of 0-4 (a higher value can be entered, but from a logical standpoint, exceeding 4 is unnecessary).
Volume Z-SCORE Alert Threshold – The Z-SCORE value for volume; determines how much the volume deviates from the average, with a range of 0-4 (the same logical note as above applies).
Logical Conditions:
Logical conditions describe whether the expected value should be less than or equal to or greater than or equal to the numerical condition.
All four parameters accept two possibilities and are analogous to the numerical conditions.
Volume Trend Detector:
Volume Trend Detector Period for Analysis – The analysis period, indicating the number of candles examined.
Method of Trend Determination – The method used to determine the trend. Possible values: Step by Step or SMA.
Trend Direction – The expected trend direction. Possible values: Upward or Downward.
Candle Type – The type of candle taken into account. Possible values: Bullish, Bearish, or Any.
The last available setting is the option to enable a joint alert for VPSA and VTD.
When enabled, VPSA will trigger on the last closed candle, regardless of the VTD analysis period.
Example Use Cases (Labels Visible in the Script Window Indicate Triggered Alerts):
The provided labels in the chart window mark where specific conditions were met and alerts were triggered.
Summary and Reflections
The program I present is a strong tool in the ongoing "game" with the Composite Man.
However, it requires familiarity and understanding of the underlying methodologies to fully utilize its potential.
Of course, like any technical analysis tool, it is not without flaws. There is no indicator that serves as a perfect Grail, accurately signaling Buy or Sell in every case.
I would like to thank those who have read through my thoughts to the end and are willing to take a closer look at my work by using this script.
If you encounter any errors or have suggestions for improvement, please feel free to contact me.
I wish you good health and accurately interpreted market structures, leading to successful trades!
CatTheTrader

Supply and demandHi all!
This is my take on supply/demand. The gist is that it creates a zone if there is a big enough reaction. This is configurable in settings as "Minimum range (ATR factor)" (the Average True Length of length 14) that is the distance that the price must travel and "Reaction bars" that is the maximum number of bars that price must travel this distance. The zones that are shown are the ones that have a retest, break and retest or is unmitigated (untouched). If a zone is mitigated (entered) or broken it is temporarily hidden. For a zone to be created it needs to have this reaction and the previous bar does not.
So this script will show you zones that are fresh (unmitigated), retested or broken and retested. This means that the zones that are shown have "proven" that they are good zones through this. Basically it means that the script creates a bunch of zones and then picks the good once. This makes the script have some latency, but will hopefully give you good zones. A zone is completely removed if it's broken twice (it's okay if it's broken once and can still have a retest after it has flipped from previous supply (or resistance) into demand (or support)).
Here is a zone (the one that has the lowest opacity) that is broken and retested that could have resulted in a good long trade (the settings are default but has a stop in the beginning of 2024):
You have a setting to remove zones that are pierced (broken by price wicks). The following zone is pierced by price (in the beginning of May) that will not be shown after the start of May if you have "Pierced" checked (the indicator has default settings but a stop in the middle of April):
You have a trend section. Zones that create a reaction upwards can only be created if the trend is considered to be up, and vice versa. The options here are "SMA50" (the current price needs to be over the Simple Moving Average of length 50) and "SMA50, SMA200" (price needs to be over the Simple Moving Average of length 50 and the Simple Moving Average of length 50 needs to be over the Simple Moving Average of length 200). If these conditions are met the trend is considered to be up, otherwise it's down. You can disable this by choosing "No detection".
The zones that are shown also need to be within a limit (of the current price). This limit is 10 (factor of the Average True Range if length 14) by default. Set this to 0 to deactivate. This is useful for not showing zones that are far away from current price and therefore unlikely to be interacted with.
You can stop the calculation of zones (through the "Stop" value in the settings). This is useful to see if previous zones were any good. I used it in my testing of the script but left it because it can be nice to have.
The zones created by the script have different transparency based upon the zone's interaction. The clearest zones are the ones that are unmitigated, the second clearest ones are the ones having a retest and lastly the zones which are most unclear are the ones having a break and then a retest.
You can see the concept of this script to be a mix of supply/demand and support/resistance, having zones being unmitigated (untouched) as the most important but also show the zones having an interaction (in the form of a retest or a break and retest).
This is from a previous supply (or resistance) zone that has flipped into demand (or support) and has shown to be a good zone through a retest followed by a rally (default settings):
This zone has multiple retest and then rallies that could have given a good long trades (it has the default settings but a "Stop" time at 2022-01-14):
TODO:
- Create zones based on pivots
- Handle overlapping zones
- Incorporate volume in the creation and/or interaction with zones
- Add alerts
- Add ability to set maximum zone width
- Add ability to set the maximum number of retest bars
- ...?
The example for this publication has the default settings bit a "Stop" and a tighter "Limit" of 4.
I hope this explanation makes sense, let me know otherwise. Also let me know if you have any suggestions on improvements.
Best of trading luck!

Indecisive and Explosive CandlesThe Explosive & Base Candle with Gaps Identifier is an indicator designed to enhance your market analysis by identifying critical candle types and gaps in price action. This tool aids traders in pinpointing zones of significant buyer-seller interaction and potential institutional activity, providing valuable insights for strategic trading decisions.
Main Features:
Base Candle Identification: This feature detects Base candles, also known as indecisive candles, within the price action. A Base candle is characterized by a body (the difference between the close and open prices) that is less than or equal to 50% of its total range (the difference between the high and low prices). These candles mark zones where buyers and sellers are evenly matched, highlighting areas of potential support and resistance.
Explosive Candle Identification: The indicator identifies Explosive candles, which are indicative of strong market moves often driven by institutional activity. An Explosive candle is defined by a body that is greater than 70% of its total range. Recognizing these candles helps traders spot significant momentum and potential breakout points.
Supply and Demand Zone Identification: Both Base and Explosive candles are essential for identifying supply and demand zones within the price action. These zones are crucial for traders to place their trades based on the likelihood of price reversals or continuations.
Gap Detection: The indicator also detects gaps, defined as the difference between the close price of one candle and the open price of the next. Gaps are significant because prices often return to these levels to "fill the gap," providing opportunities for traders to predict price movements and place strategic trades.
Visual Markings and Alerts: The indicator visually marks Base and Explosive candles as well as gaps directly on the chart, making them easily identifiable at a glance. Traders can also set customizable alerts to notify them when these key candle types and gaps appear, ensuring they never miss an important trading opportunity.
Customizable Settings: Tailor the indicator’s settings to match your trading style and preferences. Adjust the criteria for Base and Explosive candles, as well as how gaps are detected and displayed, to suit your specific analysis needs.
How to Use:
Add the Indicator: Apply the Explosive & Base Candle with Gaps Identifier to your TradingView chart.
Analyze Identified Zones: Observe the marked Base and Explosive candles and gaps to identify key areas of support, resistance, and potential price reversals or continuations.
Set Alerts: Customize and set alerts for the detection of Base candles, Explosive candles, and gaps to stay informed of critical market movements in real-time.
Integrate with Your Strategy: Use the insights provided by the indicator to enhance your existing trading strategy, improving your entry and exit points based on the identified supply and demand zones.
The Explosive & Base Candle with Gaps Identifier is an invaluable tool for traders aiming to refine their market analysis and make more informed trading decisions. By identifying critical areas of price action, this indicator supports traders in navigating the complexities of the financial markets with greater precision and confidence.
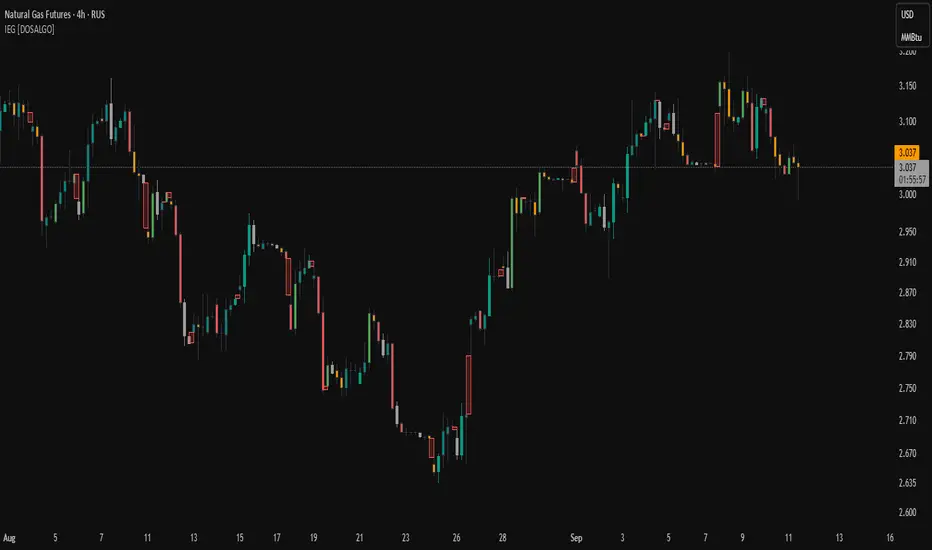
RMIRMI is a combination of RSI and MFI oscillators which considers money flow and strength of supply or demand together.
It estimates that the money of which side is being ran out.
So the power of trends can be predictable approximately.
Where the green columns appear, it means demand is very high and it can fall because buyers may withdraw and sell their assets.
And when red columns appear, it means supply is very high and sellers or new buyers may enter into new deals which may increase the price of a asset.
I would be glad if I hear your feedbacks.
Institutional PointOverview Institutional Point is a sophisticated data-mining indicator designed to identify and track "institutional footprints" by isolating the single candle with the highest volume relative to a specific time anchor. Unlike traditional volume profiles that aggregate data into price bins, this script pinpoints the exact temporal origin of massive liquidity injections.
Core Methodology The script operates on a multi-timeframe analysis engine (MTF). It scans sub-chart data (2-minute or 15-minute intervals) to find the absolute maximum volume peak within a defined period. Once the "Institutional Point" is identified:
Source Identification: The origin candle is highlighted in white, signaling a high-conviction entry or exit by large-scale market participants.
Zone Projection: A borderless "Institutional Zone" is projected forward from the spike’s high/low range.
Dynamic Interaction: The zone remains active until the price revisits the area (mitigation) or until the time-based expiration is reached.
Anchor Modes & Precision
8-Hour Cycle: Optimized for high-frequency scalping. Anchors reset at 00:00, 08:00, and 16:00. Utilizes ultra-precise 2-minute volume detection.
Daily Session: Designed for intraday and swing traders. Anchors to the Daily Open. Utilizes 2-minute volume detection to isolate precise institutional orders.
Weekly Cycle: Built for identifying major structural pivots. Anchors to the Weekly Open. Utilizes 15-minute volume detection for macro-liquidity analysis.
Key Features
Naked Level Tracking: Zones automatically stop extending the moment they are "hit" by price action, providing a clean visual of unmitigated liquidity.
Anti-Noise Filter: Automatically excludes Saturday and Sunday data to maintain statistical integrity across global markets.
Minimalist Interface: High-contrast visual design focused on scannability and professional chart aesthetics.
Use Cases
Data Science & Backtesting: Ideal for measuring the "Z-Score" or "Percentile Distance" from institutional peaks.
Supply & Demand Trading: Automated identification of the "Origin of the Move."
Magnet Analysis: Tracking "Naked" volume spikes as high-probability magnets for future price mean reversion.

Hidden Zone Detector AI - Crypto/Forex/StockHidden Zone Detector AI - Crypto Forex Stock
Hidden Zone Detector AI is a professional TradingView indicator designed to find hidden supply and demand zones across markets — crypto, forex and stocks — and surface high-probability areas earlier than classical pivot-only methods. It combines price structure analysis, volatility/ATR sizing, volume profiling and multi-mode AI heuristics (Fast / Balanced / Accurate) to generate prediction zones, highlight tested areas, and visually mark zone breakouts. Built with practical trader workflow in mind: configurable anti-repaint options, adaptable Light/Dark UI, clear labels, and candle-coloring for immediate visual context.
How it works
• Detects hidden zones by scanning pivot formations and finding internal “hidden” bars that represent real institutional activity (not just visible swing points).
• Scores zones by size (ATR-relative), volume, and touch characteristics to produce a strength percentage (Weak/Medium/Strong).
• AI heuristics aggregate price, momentum, moving averages, RSI/MACD signals and volume patterns to propose prediction zones — adjustable for speed vs. accuracy.
• Zones are drawn as persistent boxes with optional midlines, labels, and tailored styling when broken or tested.
Main advantages
• Early edge: finds hidden zones that often act before obvious pivots.
• Actionable visuals: labeled zones, color-coded candles, and breakout styling speed decision-making.
• Flexible AI modes: choose Fast for responsiveness, Balanced for day-to-day use, or Accurate for stricter signals.
• Anti-repaint controls: require confirmed bars for predictions to improve signal reliability.
• Multi-market ready: tuned for crypto, forex and stock chart behavior.
• Light/Dark friendly: UI color handling ensures labels remain readable on any chart background.
• Open & reusable: released under Mozilla Public License 2.0 (MPL-2.0) — use and adapt freely with attribution.
Best practices & tips
• Start with Balanced mode and sensitivity ~5; increase sensitivity for earlier but noisier predictions.
• Use prediction confirmation (Require AI Prediction Confirmation) for lower repaint risk.
• Combine zone reads with higher-timeframe context and orderflow/volume tools for stronger entries.
• Adjust max active zones and opacity to keep charts clean on lower timeframes.
License & author
Mozilla Public License 2.0 (MPL-2.0).
Author: a_jabbaroff — created with care for the TradingView community and fellow traders.

Odds Enhancer: Volume + RSI DivHow it Works: This flags potential demand zones where price hits a 20-bar low with a volume spike and bullish RSI divergence. Customize for supply zones by flipping logic.

Impulse Zones | Flux Charts💎 GENERAL OVERVIEW
Introducing our new Impulse Zones indicator, a powerful tool designed to identify significant price movements accompanied by strong volume, highlighting potential areas of support and resistance. These Impulse Zones can offer valuable insights into market momentum and potential reversal or continuation points. For more information about the process, please check the "HOW DOES IT WORK ?" section.
Impulse Zones Features :
Dynamic Zone Creation : Automatically identifies and plots potential supply and demand zones based on significant price impulses and volume spikes.
Customizable Settings : Allows you to adjust the sensitivity of zone detection based on your trading style and market conditions.
Retests and Breakouts : Clearly marks instances where price retests or breaks through established Impulse Zones, providing potential entry or exit signals.
Alerts : You can set alerts for Bullish & Bearish Impulse Zone detection and their retests.
🚩 UNIQUENESS
Our Impulse Zones indicator stands out by combining both price action (impulsive moves) and volume confirmation to define significant zones. Unlike simple support and resistance indicators, it emphasizes the strength behind price movements, potentially filtering out less significant levels. The inclusion of retest and breakout visuals directly on the chart provides immediate context for potential trading opportunities. The user can also set up alerts for freshly detected Impulse Zones & the retests of them.
📌 HOW DOES IT WORK ?
The indicator identifies bars where the price range (high - low) is significantly larger than the average true range (ATR), indicating a strong price movement. The Size Sensitivity input allows you to control how large this impulse needs to be relative to the ATR.
Simultaneously, it checks if the volume on the impulse bar is significantly higher than the average volume. The Volume Sensitivity input governs this threshold.
When both the price impulse and volume confirmation criteria are met, an Impulse Zone is created in the corresponding direction. The high and low of the impulse bar define the initial boundaries of the zone. Zones are extended forward in time to remain relevant. The indicator manages the number of active zones to maintain chart clarity and can remove zones that haven't been touched for a specified period. The indicator monitors price action within and around established zones.
A retest is identified when the price touches a zone and then moves away. A break occurs when the price closes beyond the invalidation point of a zone. Keep in mind that if "Show Historic Zones" setting is disabled, you will not see break labels as their zones will be removed from the chart.
The detection of Impulse Zones are immediate signs of significant buying or selling pressure entering the market. These zones represent areas where a strong imbalance between buyers and sellers has led to a rapid price movement accompanied by high volume. Bullish Impulse Zones act as a possible future support zone, and Bearish Impulse Zones act as a possible future resistance zone. Retests of the zones suggest a strong potential movement in the corresponding direction.
⚙️ SETTINGS
1. General Configuration
Show Historic Zones: If enabled, invalidated or expired Impulse Zones will remain visible on the chart.
2. Impulse Zones
Invalidation Method: Determines which part of the candle (Wick or Close) is used to invalidate a zone break.
Size Sensitivity: Controls the required size of the impulse bar relative to the ATR for a zone to be detected. Higher values may identify fewer, larger zones. Lower values may detect more, smaller zones.
Volume Sensitivity: Controls the required volume of the impulse bar relative to the average volume for a zone to be detected. Higher values require more significant volume.
Labels: Toggles the display of "IZ" labels on the identified zones.
Retests: Enables the visual highlighting of retests on the zones.
Breaks: Enables the visual highlighting of zone breaks.

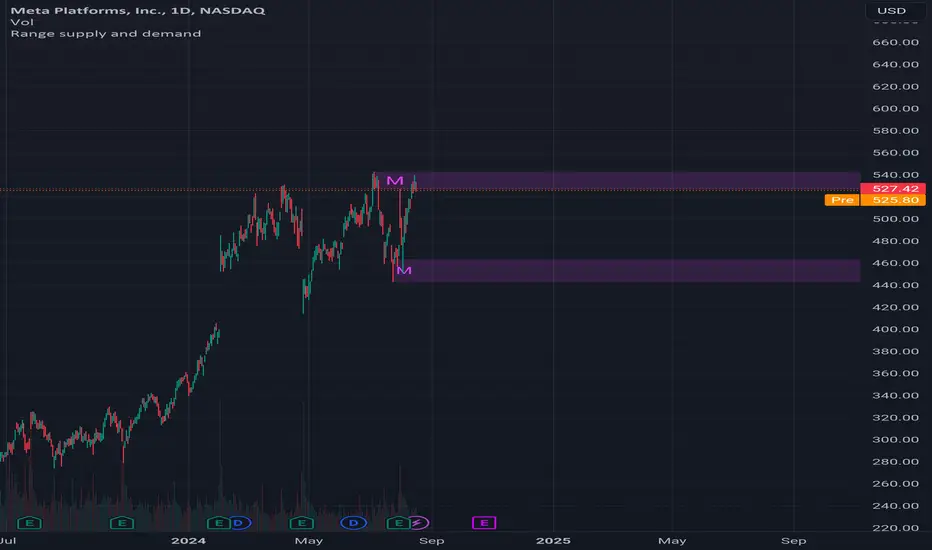
Range supply and demandHi all!
This is a very simple indicator. It plots the high timeframe (configurable via the "Timeframe" setting) high/low current timeframe bars (that has the same high/low as the higher timeframe) as supply/demand. The higher timeframe bar that's chosen is the one that's next last. As of now one high and one low zone is plotted.
The defaults are based on useful zones when on daily candles.
You can choose to display the higher timeframe within the zone via the "Show" option.
Hope this is clear enough, let me know otherwise.
Best of luck trading!
Intraday Intensity ModesIntraday Intensity Index was created by David Bostian and its use was later featured by John Bollinger in his book "Bollinger on Bollinger Bands" . It is categorically a volume indicator and considered to be a useful tool for analyzing supply and demand dynamics in the market. By measuring the level of buying and selling pressure within a given trading session it attempts to provide insights into the strength of market participants' interest and their aggressiveness in executing trades throughout the day. It can be used in conjunction with Bollinger Bands® or other envelope type indicators as a complimentary indicator to aid in trying to identify potential turning points or trends.
Intraday intensity is calculated based upon the relationship between the price change and the volume of shares traded during each daily interval. It aims to capture the level of buying or selling activity relative to the overall volume. A high intraday intensity value suggests a higher level of buying or selling pressure, indicating a more active and potentially volatile market. Conversely, a low intraday intensity value indicates less pronounced trading activity and a potentially quieter market. Overall, intraday intensity provides a concise description of the intensity of trading activity during a particular trading session, giving traders an additional perspective on market dynamics. Note that because the calculation uses volume this indicator will only work on symbols where volume is available.
While there are pre-existing versions within community scripts, none were found to have applied the calculations necessary for the various modes that are presented within this version, which are believed to be operating in the manner originally intended when first described by Bostian and again later by Bollinger. When operating in default modes on daily or lower chart timeframes the logic used within this script tracks the intraday high, low, close and volume for the day with each progressing intraday bar.
The BB indicator was included on the top main chart to help illustrate example usage as described below. The Intraday Intensity Modes indicator is pictured operating in three different modes beneath the main chart:
• The top pane beneath the main chart shows the indicator operating as a normalized 21 day II% oscillator. A potential use while in this mode would be to look for positive values as potential confirmation of strength when price tags the upper or lower Bollinger bands, and to look for negative values as potential confirmation of weakness when price tags the upper or lower Bollinger bands.
• The middle pane shows the indicator operating as an "open ended" cumulative sum of II. A potential use while in this mode would be to look for convergence or divergence of trend when price is making new highs or lows, or while price is walking the upper or lower Bollinger bands.
• The bottom pane shows the indicator operating in standard III mode, which provides independent values per session.
Indicator Settings: Inputs tab:
Osc Length : Set to 1 disables oscillation, values greater than 1 enables oscillation for II% (Intraday Intensity percent) mode.
Tootip : Hover mouse over (i) to show recommended example Settings for various modes.
Cumulative : When enabled values are cumulatively summed for the entire chart and indicator operates in II mode.
Normalized : When enabled a rolling window of Osc Length values are summed and normalized to the rolling window's volume.
Intrabar : When enabled price range and volume are evaluated for intensity per bar instead of per day which is a departure from the original
concept. Whenever this setting is enabled the indicator should be regarded as operating in an experimental mode.
Colors For Up Down : Sets the plot colors used, may be overridden in Settings:Style tab.
Styles / Width : Sets the plot style and width used, may be overridden in Settings:Style tab.
This indicator is designed to work with any chart timeframe, with the understanding that when used on timeframes higher than daily the indicator becomes "IntraPeriod" intensity, for example on weekly bars it would be "IntraWeek" intensity. On Daily or lower timeframes the indicator operates as "IntraDay" intensity and is being updated on each bar as each day progresses. If the experimental setting Intrabar is enabled then the indicator operates as "IntraBar" intensity and is no longer constrained to daily or higher evaluations, for example with Intrabar enabled on a 4H timeframe the indicator would operate as "Intra4H" intensity.
NOTICE: This is an example script and not meant to be used as an actual strategy. By using this script or any portion thereof, you acknowledge that you have read and understood that this is for research purposes only and I am not responsible for any financial losses you may incur by using this script!

SSR - Stablecoin Supply Ratio - Bitcoin - CryptocurrencyThe Stablecoin Supply Ratio (SSR) is the ratio between Bitcoin supply and the supply of stablecoins, denominated in BTC.
When the SSR is low, the current stablecoin supply has more "buying power" to purchase BTC. It serves as a proxy for the supply/demand mechanics between BTC and USD.

Coin support [Supply/Demand]The idea here is to input the appropriate benchmark tickerid to the asset class you're trading and to paint zones according to the price activity of the selected tickerid. This works very well trying to paint meaningful zones against noisy stocks, currencies, commodities etc. Use a correlation coefficient to determine the best benchmark for your asset class.

Volume Based S/RI got a question if it would be possible to Automatically draw S/R levels based on Volume rather than RSI as I had earlier done in this script;
Well it certainly is and it looks as though it might even be tradeable.
The indicator compares the size of volume bars so that if there is a noticeable increase in volume (noticeable here meaning above the indicator threshold) it marks the bar high and low prior to the bigger volume candle.

Supply and Demand Zones [Clean v6]Overview
The Supply and Demand Zones indicator is an automated market structure tool designed to identify high-probability Points of Interest (POI) on any asset or timeframe. Built using Pine Script v6, this script focuses on clarity and performance, providing traders with a clutter-free view of where institutional buying and selling pressure has previously occurred.
Unlike crowded indicators that overwhelm the chart, this script dynamically manages zones—drawing new ones as structure forms and automatically removing invalid zones as price breaks through them.
Key Features
Automated Zone Detection: Automatically identifies Supply (Resistance) and Demand (Support) zones based on Swing Highs and Swing Lows.
Dynamic Zone Management: Active zones extend to the right until price interacts with them.
Break of Structure (BOS) Logic: When price violates a zone (closes beyond the invalidation level), the zone is automatically removed and marked as "Broken" to keep the chart clean.
Zig Zag Structure: Includes an optional Zig Zag overlay to visualize market flow, Higher Highs, and Lower Lows.
ATR-Based Sizing: Zone width is calculated using the Average True Range (ATR), ensuring zones adapt to the asset's current volatility.
Pine Script v6: Optimized using the latest array and method functions for speed and stability.
How It Works
Zone Creation: The script looks for Pivot Highs and Lows based on your defined Swing Length.
Supply Zones: Created at Swing Highs.
Demand Zones: Created at Swing Lows.
Zone Width: The height of the box is determined by the ATR multiplied by your Zone Width setting. This ensures the zone covers the "wick" area or the volatility range of the pivot.
Invalidation: If the price closes past the outer edge of a zone (the top of a Supply zone or bottom of a Demand zone), the script detects a break, removes the filled box, and leaves a subtle trace of the broken structure.
How to Use
Trend Following: Use the Zig Zag lines to identify the trend direction. Look for Long entries in Demand zones during an uptrend, and Short entries in Supply zones during a downtrend.
Reversals: Watch for price to react at older, unfilled zones (POIs) that align with major support/resistance levels.
Stop Loss Placement: The outer edge of the zone acts as a natural invalidation point. If price closes beyond it, the setup is typically invalidated.
Settings Guide
Swing Length: Determines the sensitivity of the pivot detection. Lower numbers find more local zones (scalping); higher numbers find major structural zones (swing trading).
Max Zones to Keep: Limits the number of historic zones displayed to prevent chart clutter.
Zone Width (ATR): Adjusts how thick the zones are. Increase this value if you want to capture wider wicks.
Visual Settings: Fully customizable colors for Supply, Demand, Borders, and Zig Zag lines.
Disclaimer
This tool is for informational and educational purposes only. It visualizes past price action and does not guarantee future performance. Always manage your risk appropriately.

Supply & Demand ZonesThis indicator detects high-probability supply and demand zones using a multi-step smart money concept approach:
Liquidity Sweep Detection: Identifies when price sweeps above a pivot high (supply setup) or below a pivot low (demand setup), capturing liquidity grabs by institutional traders.
Displacement Confirmation: Requires a strong displacement candle (measured by ATR and body percentage) or fair value gap (FVG/imbalance) in the opposite direction after the sweep.
Volume Confirmation: Optional filter ensures zones form only when volume exceeds the user-defined threshold, indicating institutional participation.
Smart Filtering: Built-in logic prevents overlapping zones, enforces minimum spacing between signals, and requires confirmation bars to eliminate false signals.
Zone Lifecycle Management: Zones are automatically removed when price closes through them with momentum. Breached zones can optionally "flip" to the opposite type when re-tested with strong displacement.
✨ Key Features
Clean Visual Display: Small "D" (Demand) and "S" (Supply) labels with shaded zone boxes
Non-Repainting: All signals use confirmed historical data—no lookahead or repainting
Volume Filter: Optional confirmation using volume spike detection
Zone Flip Logic: Breached demand zones can become supply (and vice versa) when violated
Overlap Prevention: Smart algorithm prevents clustered or duplicate zones
Confirmation Delay: Configurable wait period after sweep to confirm genuine setups
Customizable Inputs: Adjust pivot sensitivity, displacement thresholds, volume filters, and more
Alert Ready: Built-in alert conditions for new supply and demand zone formations
🎯 How to Add to Your Chart
Favorite the Indicator: Click the star icon to add this script to your favorites
Open Your Chart: Navigate to the asset and timeframe you want to trade (works best on 5m-1H intraday charts)
Add Indicator: Click "Indicators" at the top, search for "Supply & Demand Zones (Smart Filtered)", and add to chart
Customize Settings: Click the gear icon ⚙️ to adjust inputs based on your trading style and instrument volatility
Set Alerts: Right-click the indicator name → "Add alert" → Select "Supply Zone" or "Demand Zone" conditions
📖 How to Use
Demand Zones (Green "D" Labels):
Price swept below a swing low (liquidity grab)
Strong bullish displacement or imbalance followed
Trading Action: Look for LONG entries when price returns to the zone or on immediate continuation
Stop Loss: Place just below the zone or sweep low
Target: Next resistance level, supply zone, or risk-reward ratio target
Supply Zones (Red "S" Labels):
Price swept above a swing high (liquidity grab)
Strong bearish displacement or imbalance followed
Trading Action: Look for SHORT entries when price returns to the zone or on immediate continuation
Stop Loss: Place just above the zone or sweep high
Target: Next support level, demand zone, or risk-reward ratio target
Flipped Zones (Orange Labels):
Previous demand/supply zone was broken with strong momentum
Zone has flipped polarity and may now act as the opposite type
Trading Action: Exercise caution—wait for additional confirmation before trading flipped zones
🔍 What to Look For
High-Quality Setups:
Zone forms with above-average volume (check volume filter is enabled)
Clear liquidity sweep visible on the chart
Strong displacement candle with large body percentage
Zone aligns with overall market trend or key structure levels
Multiple timeframe confirmation (check higher timeframe for context)
Avoid These Setups:
Zones forming in choppy, low-volume conditions
Multiple overlapping zones in the same area (indicator filters these automatically)
Zones that appear immediately after news events (set confirmation bars higher)
Counter-trend zones without additional confluence
⚙️ Recommended Settings by Timeframe
5-Minute Charts (Scalping):
Pivot Lookback: 3/3
Min Displacement ATR: 0.9
Confirmation Bars: 1
Min Zone Spacing: 3-5 bars
Volume Threshold: 1.2x
15-Minute Charts (Intraday):
Pivot Lookback: 4/4 (default)
Min Displacement ATR: 1.0 (default)
Confirmation Bars: 2 (default)
Min Zone Spacing: 5-8 bars
Volume Threshold: 1.2x
1-Hour Charts (Swing Trading):
Pivot Lookback: 5/5
Min Displacement ATR: 1.2-1.5
Confirmation Bars: 3
Min Zone Spacing: 8-12 bars
Volume Threshold: 1.3x
💡 Trading Tips & Best Practices
Combine with Price Action: Use this indicator alongside candlestick patterns, support/resistance, and trendlines for confirmation
Multiple Timeframe Analysis: Check higher timeframes for overall bias and major zones
Volume is Key: Enable volume filter to focus on institutional-backed moves
Risk Management: Always use stop losses and proper position sizing
Backtesting: Test settings on your preferred instruments and timeframes before live trading
Context Matters: Consider market conditions, news events, and session times
Wait for Confirmation: Don't rush entries—wait for price reaction at the zone
⚠️ Important Disclaimers
Educational Purpose Only: This indicator is provided for educational and informational purposes. It does not constitute financial advice, investment recommendations, or trading signals.
No Guarantees: Past performance and backtested results do not guarantee future results. Trading involves substantial risk of loss.

Quantura - Supply & Demand Zone DetectionIntroduction
“Quantura – Supply & Demand Zone Detection” is an advanced indicator designed to automatically detect and visualize institutional supply and demand zones, as well as breaker blocks, directly on the chart. The tool helps traders identify key areas of market imbalance and potential reversal or continuation zones, based on price structure, volume, and ATR dynamics.
Originality & Value
This indicator provides a unique and adaptive method of zone detection that goes beyond simple pivot or candle-based logic. It merges multiple layers of confirmation—volume sensitivity, ATR filters, and swing structure—while dynamically tracking how zones evolve as the market progresses. Unlike traditional supply and demand indicators, this script also detects and plots Breaker Zones when previous imbalances are violated, giving traders an extra layer of market context.
The key values of this tool include:
Automated detection of high-probability supply and demand zones.
Integration of both volume and ATR filters for precision and adaptability.
Dynamic zone merging and updating based on price evolution.
Identification of breaker blocks (invalidated zones) to visualize market structure shifts.
Optional bullish and bearish trade signals when zones are retested.
Clear, visually optimized plotting for efficient chart interpretation.
Functionality & Core Logic
The indicator continuously scans recent price data for swing highs/lows and combines them with optional volume and ATR conditions to validate potential zones.
Demand Zones are formed when price action indicates accumulation or a strong bullish rejection from a low area.
Supply Zones are created when distribution or strong bearish rejection occurs near local highs.
Breaker Blocks appear when existing zones are invalidated by price, helping traders visualize potential market structure shifts.
Bullish and bearish signals appear when price re-enters an active zone or breaks through a breaker block.
Parameters & Customization
Demand Zones / Supply Zones: Enable or disable each individually.
Breaker Zones: Activate breaker block detection for invalidated zones.
Volume Filter: Optional filter to only confirm zones when volume exceeds its long-term average by a user-defined multiplier.
ATR Filter: Optional filter for volatility confirmation, ensuring zones form under strong momentum conditions.
Swing Length: Controls the number of bars used to detect structural pivots.
Sensitivity Controls: Adjustable ATR and volume multipliers to fine-tune detection responsiveness.
Signals: Toggle for on-chart bullish (▲) and bearish (▼) signal plotting when price interacts with zones.
Color Customization: User-defined bullish and bearish colors for both standard and breaker zones.
Core Calculations
Zones are detected using pivot highs and lows with a defined lookback and lookahead period.
Additional filters apply if ATR and volume are enabled, requiring conditions like “ATR > average * multiplier” and “Volume > average * multiplier.”
Detected zones are merged if overlapping, keeping the chart clean and logical.
When price breaks through a zone, the original box is closed, and a new breaker zone is plotted automatically.
Bullish and bearish markers appear when zones are retested from the opposite side.
Visualization & Display
Demand zones are shaded in semi-transparent bullish color (default: blue).
Supply zones are shaded in semi-transparent bearish color (default: red).
Breaker zones appear when previous imbalances are broken, helping to spot structural shifts.
Optional arrows (▲ / ▼) indicate potential buy or sell reactions on zone interaction.
Use Cases
Identify institutional areas of accumulation (demand) or distribution (supply).
Detect potential breakout traps and market structure shifts using breaker zones.
Combine with other tools such as volume profile, EMA, or liquidity indicators for deeper confirmation.
Observe retests and reactions of zones to anticipate possible reversals or continuations.
Apply multi-timeframe analysis to align higher timeframe zones with lower timeframe entries.
Limitations & Recommendations
The indicator does not predict future price movement; it highlights structural imbalances only.
Performance depends on chosen swing length and sensitivity—users should optimize parameters for each market.
Works best in volatile markets where supply and demand imbalances are clearly expressed.
Should be used as part of a broader trading framework, not as a standalone signal generator.
Markets & Timeframes
The “Quantura – Supply & Demand Zone Detection” indicator is suitable for all asset classes including cryptocurrencies, Forex, indices, commodities, and equities. It performs reliably across multiple timeframes, from intraday scalping to higher timeframe swing analysis.
Author & Access
Developed 100% by Quantura. Published as a Open-source script indicator. Access is free.
Important
This description complies with TradingView’s Script Publishing and House Rules. It clearly explains the indicator’s originality, underlying logic, functionality, and intended use without unrealistic claims or performance guarantees.

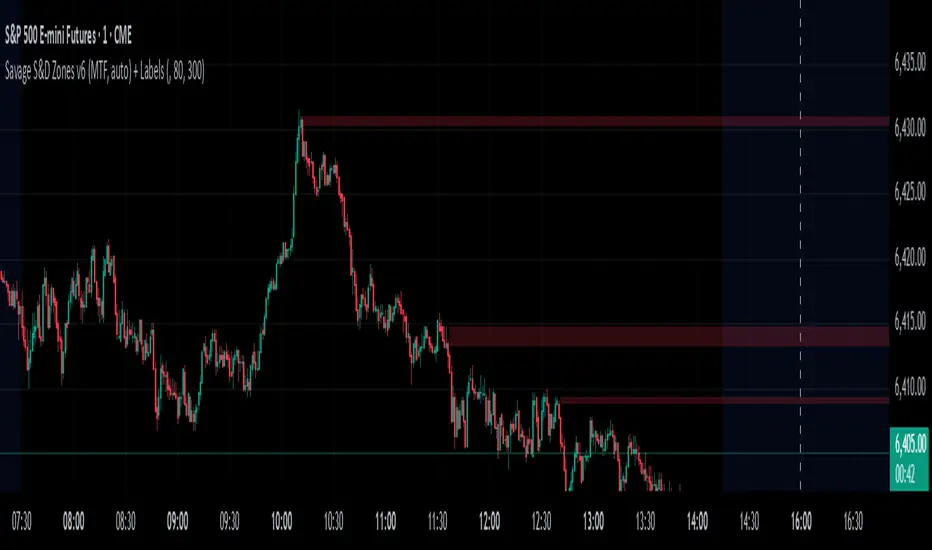
Savages Supply and Demand LevelsThis supply and demand indicator in my opinion is one of the best S&D indicators on trading view. It is clean, organized and just simple. I have spent thousands of hours determining the best and most reliable ways to identify supply and demand, on every time frame! I am going to explain exactly what I look for.
When looking for a supply level meaning, there is potential for more supply of the following stock to hit the marker, what does that mean? People are going to sell. SO, it represents possible sell ordered at that supply level. So lets get into the grit of this, there are two candles that form when a supply level is formed. The first candle needs to be green, it will have a high, a low , an open and a close. The specifics come into play with the next candle which needs to be red, that candle can NOT break the previous green candles high, and needs to close below the previous candles low. THATS IT! That is a supply level. Now, for a demand level, its the same thing just switched, we need a red candle, that will have a high,low, open and a close. Same thing now, the next candle is going to be green, that green candle can NOT break that previous red candles low and needs to close above that previous red candles high. THATS A DEMAND!
I have spent countless hours back testing and studying this, I am extremely confident that this will be a game changer for whoever uses this. I have marked different types of opening and closes and highs and lows and this specific type of setup has worked countless times for me, the only time it will not work is when there is a liquidity sweep or some sort of news where it causes the price action to swing several points. Also do not use only one time frame and only this indicator, try to use some fair value gap levels and break of structure indicators, there are really good ones on here. I have also built the indicator to get rid of supply and demand levels that have already been hit so you always have a clean and fresh supply and demand level that has not been eaten into yet. I also threw some clean labels on there so it is easy to identify. So once price action hits that supply or demand level, it goes away, it either worked or it gets invalidated.
I hope you enjoy!
Not financial advice
-Savage
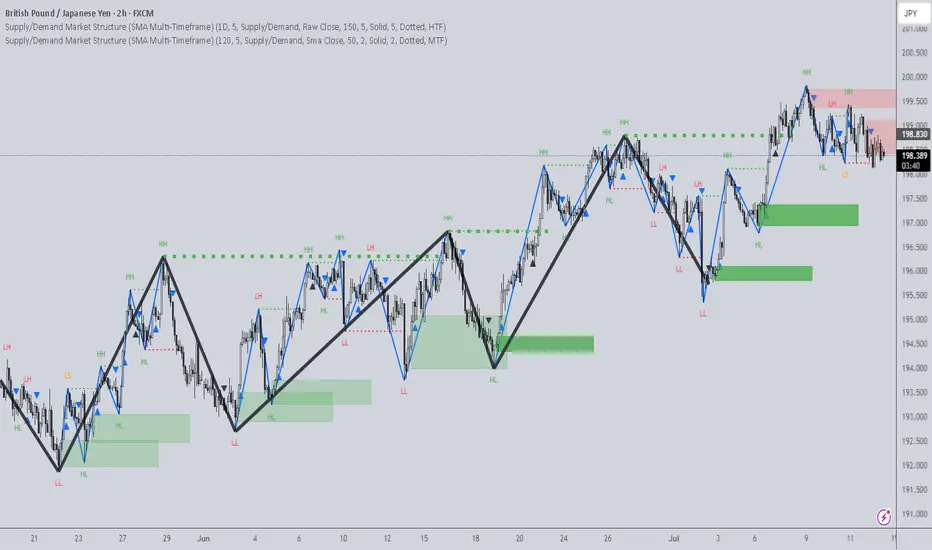
Supply/Demand Market Structure (SMA Multi-Timeframe)Supply/Demand Based Market Structure
Structure + Order Blocks from Synthetic SMA Candles
Overview:
The SMA Supply/Demand Market Structure indicator combines market structure analysis with supply/demand logic, powered by SMA-based synthetic candles . Instead of relying on raw candle data, this tool generates smoothed higher-timeframe candles using simple moving averages to identify more stable zones and cleaner structure shifts.
It detects bullish and bearish breaks of structure (BoS) , highlights swing points like HH, HL, LH, LL , and plots institutional-style supply and demand zones formed from aggressive rallies or drops. The result is a precise and noise-filtered view of market intent, perfect for trend-following or smart money strategies.
How It Works:
- Synthetic candles are created using SMA of OHLC values on your selected timeframe (HTF).
- A bullish break occurs when price closes above the high of the last bearish synthetic candle.
- A bearish break occurs when price closes below the low of the last bullish synthetic candle.
- Upon break confirmation:
- A demand zone is drawn using the last bearish candle.
- A supply zone is drawn using the last bullish candle.
- Each zone is extended forward for a user-defined number of bars and optionally deleted upon mitigation.
- Zigzag-based internal structure connects valid swing points and classifies them as HH, HL, LH, LL , including Liquidity Sweeps (LS) .
- BoS levels are highlighted with lines that automatically reset when new structure forms.
Key Features:
- Synthetic SMA Candles : Smooth and reliable structure from average-based HTF candles
- Break Modes : Choose between raw HTF closes or SMA closes for break logic
- Custom Timeframe Selection : Analyze structure across any HTF you choose
- Dynamic Supply/Demand Zones : Auto-plot boxes from valid rallies/drops
- Mitigation Detection : Optionally fade or delete zones when price trades through
- Zigzag Structure Mapping : Automatically connect structural highs/lows
- BoS Detection : Real-time breakout of swing points with visual confirmation
- Smart Labels : Marks HH, HL, LH, LL, and LS directly on the chart
- Multi-timeframe Alert System : Notify for all structural changes, BoS, and new zones
How to Use:
- Set your desired HTF and SMA Length for synthetic candle smoothing.
- Use SMA=1 for raw candles
- Select a Break Mode :
- Raw Close : Uses standard HTF close values
- SMA Close : Uses smoothed closes from SMA
- Watch for bullish or bearish breaks — zones are plotted when price confirms breakout structure.
- Use demand zones as long entry areas and supply zones as short setups on retests.
- Rely on internal shifts and zigzag swings to monitor structure continuity.
- Enable alerts for swing formations, BoS, and liquidity sweeps to trade hands-free.
Recommended Strategies:
- Smart Money & ICT Models : Use synthetic demand/supply + BoS for mitigation or continuation plays
- Swing Trading : Align with higher timeframe structure and use zones for entry triggers
- Trend Trading : Confirm structure alignment and wait for pullbacks into zones
- Reversal Entries : Trade structure breaks when zones fail and a BoS confirms the shift
Customization Options:
- Timeframe input for custom HTF control
- SMA Length to adjust candle smoothing
- Zone Style : Control zone color, transparency, and duration
- Structure Display : Toggle swing labels and zigzag visuals
- Alert Mode : Choose between LTF, MTF, or HTF alerts
Summary:
SMA Supply/Demand Market Structure provides a clean, flexible view of price structure and institutional intent by fusing market structure with SMA-based synthetic candles. It’s ideal for anyone seeking reduced noise, visually guided entries, and rule-based trading based on structural shifts and real-time demand/supply dynamics.
Stephis Supply & Demand Zones v3
📉 Support
Definition: Support is a price level where a downtrend can be expected to pause or reverse due to a concentration of buying interest.
Why it matters: When the price of an asset falls to a support level, traders expect buyers to step in, preventing the price from falling further.
Visual clue: On a chart, support often appears as a horizontal line where the price has bounced up multiple times.
📈 Demand
Definition: Demand refers to the willingness and ability of buyers to purchase an asset at a given price.
In trading context: High demand typically pushes prices up, while low demand can lead to price drops.
Relation to support: A support level exists because of demand—buyers are willing to buy at that price, creating a floor.
🧠 How They Work Together
When price approaches a support level, traders watch to see if demand increases—if it does, the price may bounce.
If the support level is broken, it may signal that demand has weakened, and the price could fall further.
🔁 Opposite Concept: Resistance & Supply
Resistance is the opposite of support—it's a level where selling pressure (supply) may stop a price from rising.
Just like demand creates support, supply creates resistance.

Supply/Demand Zones + Engulfment-based ExecutionSupply/Demand Zones + Engulfment-Based Execution
Strategy Overview
This strategy combines institutional trading concepts—supply/demand zones and engulfing candle patterns—to generate high-probability long and short trade setups. The system uses aggregated price action to identify potential reversal zones and confirms entries with engulfing candle patterns, ensuring trades are only taken when market structure shows commitment in the direction of the trade.
Core Concepts
• Supply & Demand Zones: These are automatically detected by analyzing aggregated bullish and bearish candle structures over user-defined intervals. Supply zones are formed after bearish continuation patterns; demand zones appear after bullish continuation patterns.
• Engulfing Entries: Once price enters a zone, the strategy waits for a bullish engulfing pattern (in a demand zone) or a bearish engulfing pattern (in a supply zone) before executing a trade. This adds confirmation and reduces false signals.
• Risk Management: Stop-loss is placed at the low (for long trades) or high (for short trades) of the engulfed candle. Take-profit can be calculated using a fixed R-multiple (risk-to-reward ratio) or a user-defined target price.
Key Features
Fully customizable aggregation factor for zone detection
Visual zone boxes, entry/SL/TP boxes, and engulfing pattern labels
Optional removal of mitigated zones for cleaner charting
Configurable trade mode (Long only, Short only, or Both)
Support for trading sessions and date filtering
Alerts for price entering supply or demand zones
How to Use
Select Aggregation Factor: Choose how many candles to group together for identifying key zones (e.g., 4x timeframe).
Enable Zones: Turn on supply and/or demand zones as needed.
Set Execution Parameters:
– Choose R-multiple (e.g., 2:1 risk-reward)
– Or use a fixed take-profit price
Define Trade Time Window:
– Set the date and time ranges to restrict execution
– Use Start Hour and End Hour to limit trades to specific sessions (e.g., London/New York)
Run on Desired Timeframe: Typically used on 15m–4H charts, depending on your strategy and the asset’s volatility.
Ideal For
• Traders using Smart Money Concepts (SMC)
• Those who value high-confluence entries
• Intraday to swing traders looking for structure-based automation
⚠️ Important Notes
• The strategy requires engulfing confirmation within the zone to enter a position.
• This script does not repaint and executes trades on a bar close basis.
• Backtest results may vary based on session filters and aggregation factor.
© Attribution
This strategy was developed by The_Forex_Steward and is licensed under the Mozilla Public License 2.0.
You are free to use, modify, and distribute it under the terms of that license.

CoffeeShopCrypto Supply Demand PPO AdvancedCoffeeShopCrypto PPO Advanced is a structure-aware momentum oscillator and price-trend overlay designed to help traders interpret momentum strength, exhaustion, and continuation across evolving market conditions. It’s not a “buy/sell” signal tool — it's a momentum context tool that helps confirm trend intent.
Original Code derived from the Price Oscillator Indicators (PPO) found in the TradingView Technical Indicators categories. You can view the info and calculation for the original PPO here
www.tradingview.com
Much like the MACD, the PPO uses a couple lagging indicators to present Momentum as a percentage. But it lacks context to market structure.
What It’s Based On
This tool is based on a dual-moving-average PPO oscillator structure (Percentage Price Oscillator) enhanced by:
Oscillator pivot structure: detection of Lower Highs (LH) and Higher Lows (HL) inside the oscillator.
Detection of Supply and Demand Trends via Market Absorption
Ability to transfer its average plots to price action
Detection of Trend Exhaustion
Real-time price-based exhaustion levels: projecting potential future supply and demand using trendlines from weakening momentum.
Integrated fast and slow Moving Averages on price using the same inputs as the oscillator, to visualize alignment between short- and long-term trends.
These elements combine momentum context with price action in a visual, intuitive system.
How It Works
1. Oscillator Structure
LHs (above zero): momentum weakening in uptrends.
HLs (below zero): momentum strengthening in downtrends.
Only valid pivots are shown (e.g., an LH must be preceded by a valid LL).
2. Exhaustion Levels
Green demand lines: price is making new lows, but oscillator prints HL → potential exhaustion.
Red supply lines: price is making new highs, but oscillator prints LH → potential exhaustion.
These lines are future-facing, projecting likely reaction zones based on momentum weakening.
3. Moving Averages on Price
Two MAs are drawn on the price chart:
Fast MA (same length as PPO short input)
Slow MA (same length as PPO long input)
These are not signal lines — they're visual guides for trend alignment.
MA crossover = PO crosses zero. This indicates short- and long-term momentum are syncing — a powerful signal of trend conviction.
When price is above both MAs, and the PO is rising above zero, bullish momentum is dominant.
When price is below both MAs, and the PO is falling below zero, bearish momentum dominates.
How Traders Can Use It
✅ Spot Trend Initiation
Wait for clear trend confirmation in price.
Use PPO Momentum+ to confirm momentum structure is aligned (e.g., HH/HL in oscillator + price above both MAs).
🔁 Track Continuations
In uptrends, look for oscillator HH and HL sequences with price holding above both MAs.
In downtrends, seek LL and LH sequences with price below both MAs.
⚠️ Watch for Exhaustion
Price breaking below red (supply) lines after oscillator LH = bearish exhaustion signal.
Price breaking above green (demand) lines after oscillator HL = bullish exhaustion signal.
These levels act like pre-mapped S/R zones, showing where momentum previously failed and price may react.
Why This Is Different
Momentum tools often lag or mislead when used blindly. This tool visualizes structural failure in momentum and maps potential outcomes. The integration of oscillator and price-based tools ensures traders are always reading context, not just raw signals.
Demand Trendlines
Demand trendlines show us Wykoff's law of "Absorbed Supply Reversal" In real time.
When aggressive selling pressure is persistently absorbed by passive buying interest without significant downward price continuation, and supply becomes exhausted, the market structure shifts as demand regains control—resulting in a directional reversal to the upside.
This commonly happens in a 3 phase interaction of price.
1. Selling pressure is absorbed quickly by buyers.
This PPO tool will calculate the trend of this absorption process
2. After there is a notable Bearish Exhaustion of price action, the PPO tool will draw a trendline of this absorption showing us the potential future prices where aggressive buyers will want to step in at lower prices.
3. After higher lows are defined in the oscillator, you'll see prices react in a strong bullish pattern at this trendline where aggressive buyers stepped in to reverse price action to the upside.
Supply Trendlines
Supply trendlines show us Wykoff's law of "Absorbed Demand Reversal" In real time.
When aggressive buying pressure is persistently absorbed by passive selling interest without significant downward price continuation, and demand becomes exhausted, the market structure shifts as supply regains control—resulting in a directional reversal to the downside.
This commonly happens in a 3 phase interaction of price.
1. Buying pressure is absorbed quickly by sellers.
This PPO tool will calculate the trend of this absorption process.
2. After there is a notable Bullish Exhaustion of price action, the PPO tool will draw a trendline of this absorption showing us the potential future prices where aggressive sellers will want to step in at higher prices.
3. After lower highs are defined in the oscillator, you'll see prices react in a strong bearish pattern at this trendline where aggressive sellers stepped in to reverse price action to the downside.
Lower High and Higher Low Signals
When the oscillator signals Lower Highs or High Lows its only noting that momentum in that trend direction is slowing. THis indicates a coming pause in the market and the proceeding longs of an uptrend or shorts of a downtrend should be taken with caution.
**These LH and HL markers are not reading as divergences in price vs momentum.**
They are simply registering against the highs and lows of itself..
Moving Averages on Price Action
The Oscillator will cross over its ZERO level the same time your Short and Long MAs cross each other. This will indicate that the short term average trend is moving ahead of the long term.
Crossovers are not an entry signal. It's a method in determining you current timeframe trend strength. Always observe price action as it passes through each of your moving averages and compare it to the positioning and direction of the oscillator.
If price dips in between the moving averages while the oscillator still shows a strong trend strength, you can wait for price to move ahead of your fast moving average.
Bar Colors and Signal Line for Trend Strength
Good Bullish Trend = Oscillator above zero + Signal rising below Oscillator
Weak Bullish Trend = Oscillator above zero + Signal above Oscillator
Good Bearish Trend = Oscillator below zero + Signal falling above Oscillator
Weak Bearish Trend = Oscillator below zero + Signal below Oscillator
Bar Colors
Bars are colored to match Oscillator Momentum Strength. Colors are set by user.
Why alter the known PPO (Percentage Price Oscillator) in this manner?
The PPO tool is great for measuring the strength as percentage of price action over and average amount of candles however, with these changes,
you know have the ability to correlate:
Wycoff theory of supply and demand,
Measure the depth of reversals and pullback by price positioning against moving averages,
Project potential reversal and exhaustion pricing,
Visibly note the structure of momentum much like you would note market structure,
Its not enough to know there is momentum. Its better to know
A) Is it enough
B) Is there something in the way which will cause price to push back
C) Does this momentum correlate to the prevailing trend
