RSI + MA StrategyHello, everyone!
We have just released an innovative strategy for TradingView. It allows you to facilitate the trading process when you have to use both indicators.
This strategy is:
User-friendly
Configurable
Equipped with the combination of Relative Strength Index (RSI) and Moving Average (MA) indicators
Designed with all required functions to manage positions
Features
The RSI+MA strategy can:
Identify entry points for Long and Short positions.
Depict RSI and MA values concerning each other.
Reduce visual congestion and import usability thanks to using a combo of 2 indicators.
Allow using pivot trading. The RSI+MA strategy will enter a Long position according to the Short position conditions. And vice versa.
Note! If you want to open a Long position, the RSI line should cross MA from top to bottom. If you want to open a Short position, RSI has to cross MA from bottom to top.
Parameters
We have equipped our strategy with more than 14 additional parameters. So, you can configure the EA according to your needs!
Inputs :
Use Reverse Trade — allows swapping Long and Short positions opening conditions.
Resolution — allows you to view an indicator with data on a higher or lower timeframe on the current chart.
RSI Length
RSI Source: Open, High, Low, Close, HL2, HLC3, OHLC4
Show MA — allows you to enable or disable MA displaying.
MA Length
MA Offset
Style:
RSI — RSI indicator line color and style settings.
MA — MA indicator line color and style configuration.
Upper Band — allows customizing line style, color, and RSI upper bound value.
Lower Band — allows you to customize line style, color, and RSI lower bound value.
Background — background color setting within the RSI upper and lower borders.
Precision — number of decimals for RSI values.
Note! Try RSI+MA on your demo account first before going live.
Search in scripts for "entry"

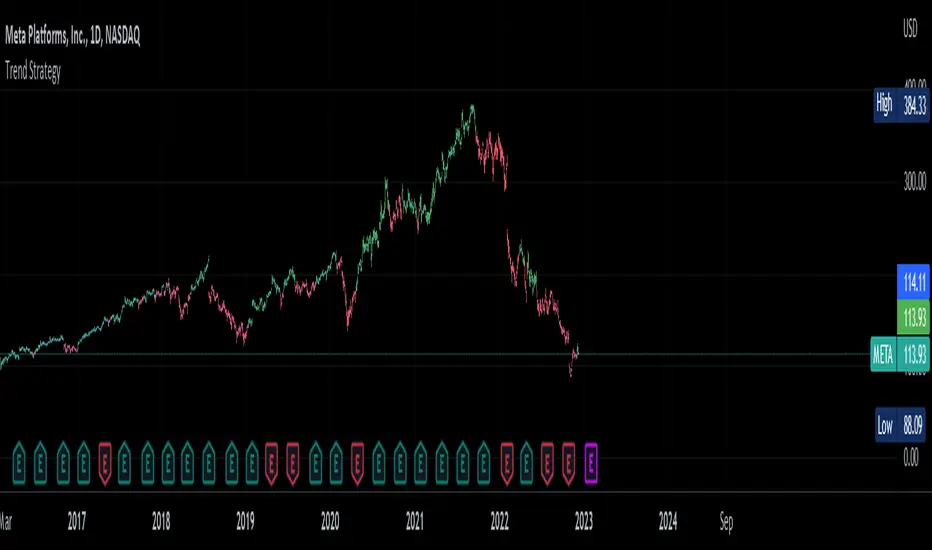
Trend Strategy by zdmreThis Strategy is a trend following indicator. It is plotted on price and the current trend can be determined by its placement vis-a-vis price. It is constructed with just three parameters: Period, Multiplier and Entry/Exit Point with Superformula.
The default parameters are 14 for Average True Range (ATR) and 4 for its multiplier. The average true range (ATR) plays a key role in ‘Trend’ as the indicator uses ATR to compute its value and it signals the degree of price volatility. You should note that any changes to these numbers can affect the use of the Trend indicator.
While you using this indicator, you should not avoid putting your stop loss.
For a long position, you can put stop loss right at the red indicator line. For a short position, you can put it at the green indicator line. You can insert your own settings as well.
Using Trend Strategy along with a stop loss pattern is the best way for earning the best wealth in trading.
There is no best setting for any trading indicator.
[DS]Bitcoin BTC ETH and others cryptos==DESCRIPTION - English version
The purpose of this script is to show information on graph that can help your decision to buy and sell cryptos.
The script is indicated for Position Trade (Long Term - Holder) and Swing Trade (Medium term).
Position Trade it is recommended to use the Weekly (W) and Daily (D) charts, Swing trade to use the 4H and 2H charts.
It is not advisable to use this indicator with graphic time frame less than 2 hours because the noise levels of information are very high.
An alert function has been inserted in the indicator and to activate this function you will need configure it in the Tradingview.
This alert will indicate the likely points of entry and exit of the asset.
**DESCRIÇÃO - Versão em Português
A proposta deste script é mostrar no gráfico informações que possam auxiliar a sua decisão de compra e venda de cryptos.
Este script é indicado para negociação Position Trade (Longo Prazo - Holders) e Swing Trade (Médio prazo).
Para Position Trade (Holders) é indicado utilizar os gráficos Semanal (W) e Diário (D), para Swing trade utilizar os gráficos 4H e 2H.
Não é aconselhável utilizar este indicador com tempos gráficos menores que 2hs pois os níveis de ruídos nas informação são muito altos.
Foi inserido no indicador uma função de alerta e para ativar esta função, você precisará configurá-la no seu Tradingview.
Este alerta irá indicar os provaveis pontos de entrada e saída do ativo.
====================================================================================================
** English Version
====================================================================================================
█ SETUP applied to Indicator
The setup is based on the average 8, 21 and 56 of the weekly chart (taught on youtube channel: Augusto Backes)
Price above the average 8 on the weekly, indicates that the market is UP trend, below the average 8 on the weekly that the market is DOWN trend
RSI greater than 60% the market is UP trend
RSI greater than 40% and lower 60% the market is in ACCUMULATION
RSI less than 40% the market DOWN trend
The weekly average 8 is represented in GREEN (Upward Trend) and RED (Downward Trend).
The weekly average 21 is represented in LIGHT ORANGE
The weekly average 56 is represented in LIGHT PURPLE
The crossing of weekly averages 8 and 21 is represented with a GREEN (HIGH trend) and RED (LOW trend) cross - this signal is disabled on the graph but you can enable it by clicking on the graph setup
█ FUNCTION USE
(1) Average 8, 21 and 56 on Weekly - show the average 8, 21, 56 weekly on graphic (Average 8 in color red and green, 21 - light orange, 56 light purple)
(2) Crossing of averages 8 and 21 Weekly - is not active but you can activate
(3) Calculation of RSI
(4) barcolor() - mark the candles with the green color (High market) and red color (Dow market)
(5) alertcondition() - you can active this alert on Tadingview
█ BUY AND SELL POINTS - likely points
The indication of the BUY position is shown by a green arrow pointing upwards and the sell position by a red arrow pointing downwards. Buy and sell indications are obtained from the divergence in the market trend.
█ THANK TO
PineCoders for everything they do, all the tools and help they provide, and their involvement in making a better community. All PineCoders, Pine Pros and Pine Wizards, people who share their work and knowledge because of it and helping others, I am so happy and so grateful.
█ NOTE
This indicator is not a buy and sell recommendation, it indicates the most likely buy and sell points. Every purchase and sale decision is your responsibility
*****************************************************************************************************
** Versão em Português
*****************************************************************************************************
█ SETUP aplicado no Indicador
O setup está baseado na média 8, 21, e 56 do gráfico semanal
Preço acima da média 8 no semanal indica que o mercado esta em tendência de ALTA, abaixo da média 8 no semanal que o mercado está em tendência de BAIXA
RSI maior que 60% o mercado está em ALTA
RSI maior que 40% e menor 60% o mercado está em ACUMULAÇÃO
RSI menor que 40% o mercado está em BAIXA
A média 8 semanal está representadas nas cores VERDE (Tendência de Alta) e VERMELHA (Tendência de Baixa).
A média 21 semanal está representada na cor laranja claro
A média 56 semanal está representada na cor roxa claro
O cruzamento das médias 8 e 21 semanal esta representado com uma cruz VERDE (Tendência de ALTA) e VERMELHA (Tendência de BAIXA) - este sinal esta desativado no gráfico mas você pode ativá-lo clicando no setup do gráfico
█ FUNÇÕES UTILIZADAS
(1) Média 8, 21 e 56 no Semanal - mostra a média 8, 21, e 56 no gráfico
(2) Cruzamento das médias 8 e 21 Semanal - não está ativo mas você pode ativá-lo
(3) Cálculo do RSI
(4) barcolor() - marca a vela (Candle) com a cor verde (Mercado em Alta) e a cor vermelha (Mercado em Baixa)
(5) alertcondition () - você pode ativar o alerta no Tradingview
█ PONTOS DE COMPRA E VENDA - prováveis pontos
A indicação da posição de COMPRA é apresentada por uma seta na cor verde apontada para cima e a posição de VENDA por uma seta na cor vermelha apontada para baixo. As indicações de compra e venda são obtidas a partir da divergência na tendência do mercado.
█ OBRIGADO PARA
PineCoders por tudo o que fazem, todas as ferramentas e ajuda que fornecem, e seu envolvimento em fazer uma comunidade melhor. Todos os PineCoders, Pine Pros e Pine Wizards, pessoas que compartilham seu trabalho e conhecimento por causa dele e ajudando os outros, estou muito feliz e muito grato.
█ NOTA
Este indicador não é uma recomendação de compra e venda ele indica os pontos mais prováveis de compra e venda. Toda decisão de compra e venda é de sua responsabilidade

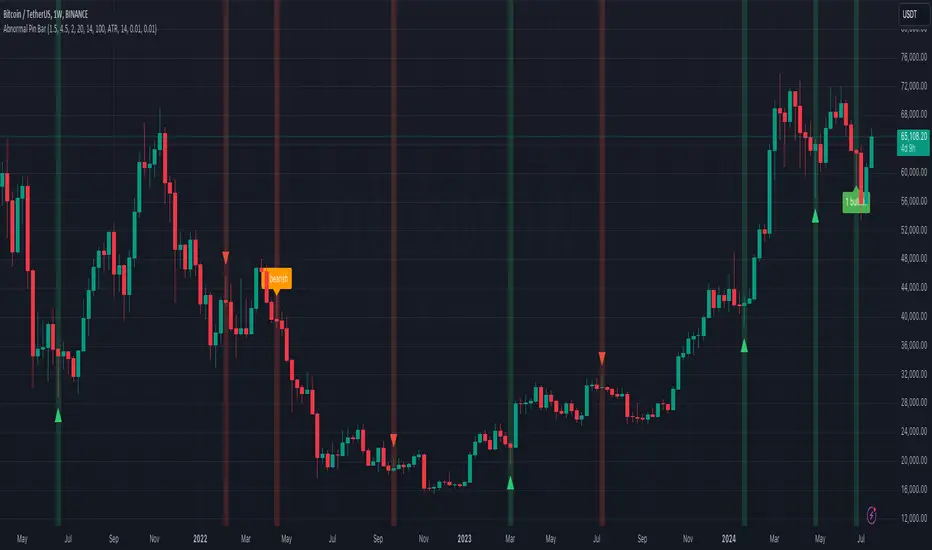
Abnormal Pin BarPin Bar is one of the most important candlestick patterns. Almost every time you see a pin bar, you can expect the price to turn in the opposite direction.
You should pay more attention to the abnormal ones among the pin bars. What I mean by abnormal pin bar is that the long leg is at least 3 times larger than the body.
With this indicator, you can set your own abnormal pin bar settings. The indicator will highlight abnormal pin bars according to the settings you specified.
The indicator uses the following three factors to indicate abnormal pin bar:
- Minimum body ratio in the pattern in percent
- Minimum ratio of the long shadow to the body
- Minimum ratio of the long shadow to the short shadow
Also, there is a volume strength check to confirm the pin bar. If the volume where the pin bar is formed is greater than the 20 volume average, it indicates that the pin bar is more important. Of course, confirming the pin bar with the volume is optional and you can disable it in settings if you wish.
You can use the highlights of this indicator as an entry signal if the pin bar appears at the trend key levels or in support or resistance zones.
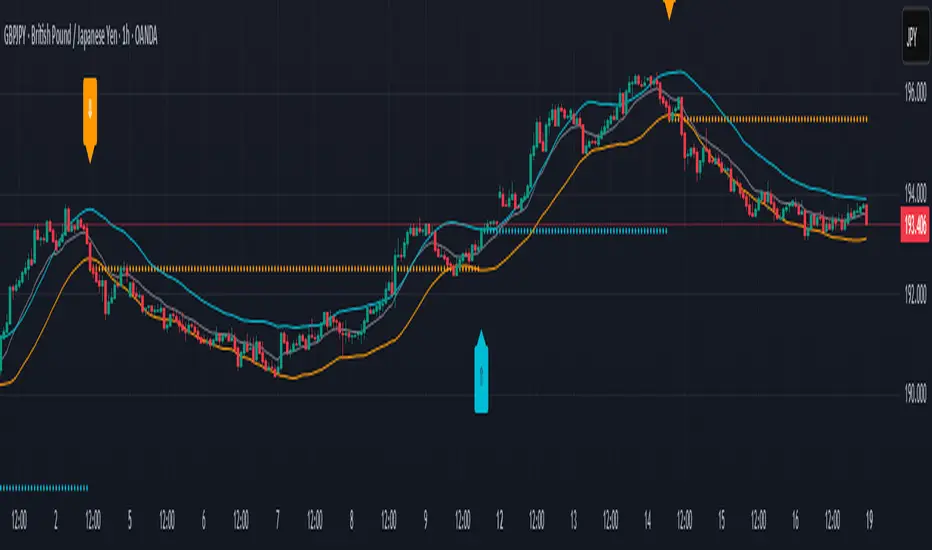
Ultimate Buy/Sell IndicatorAn Indicator based on the William Alligator, helping to find suitable entry and exit points.

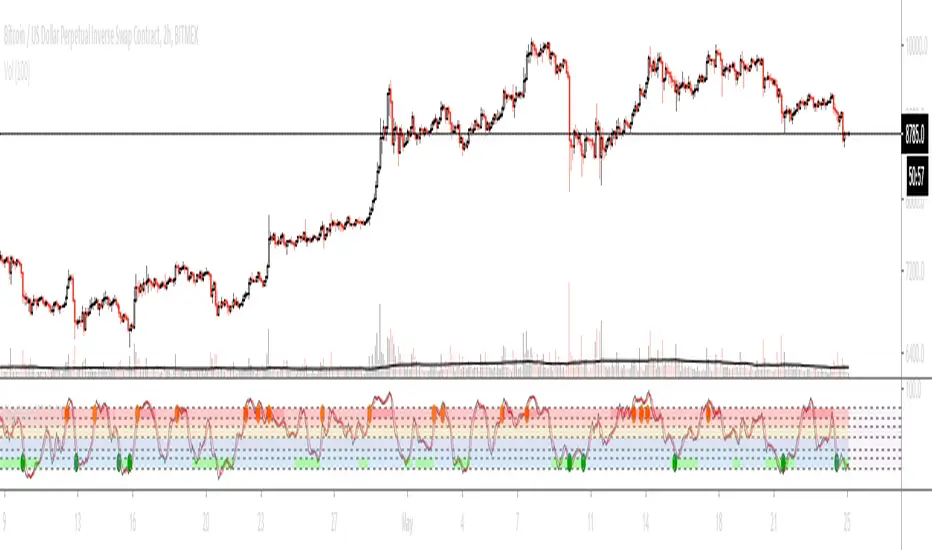
Slow Stochastic + ADX exhaustationSlow stochastic with ADX exhaustation and sell/entry points as orange/green circles.
This is a script I remade from Marco Valente's "RSI Combo" and Oshri17 "Slow stochastic".
Credits and thanks to them for sharing, I just expanded the diversity ^^
Hope you enjoy phit! ;D
Market + Direction + Entry + Hold + Exit v1.5 FINALOverview
This script is a complete trend-based trading framework designed to filter market conditions, determine directional bias, detect high-quality pullback entries, manage active trades, and identify trend-weakening exit points.
It is optimized for NQ futures, Gold (XAUUSD), and Bitcoin, with adaptive parameters for each asset.
The logic focuses on trading only when conditions are favorable, aligning entries with the primary trend, and avoiding low-probability setups.
1. Market Condition Filter
Before any signal appears, the script checks whether the market is active using three conditions:
ATR compared to ATR moving average (volatility condition)
Volume compared to average volume (liquidity condition)
Price distance from VWAP (suppression of mean-reversion environments)
A trade environment is considered active when at least two of these three conditions are positive.
2. Trend Direction Filter
Directional bias is defined by:
EMA21 relative to EMA55
Price relative to VWAP
Heikin-Ashi structure
When these conditions align, the script switches into long-only or short-only mode.
No counter-trend signals are displayed.
3. Entry Logic (L, L2, L3 and S, S2, S3)
The system identifies pullback entries within a confirmed trend.
Long entries require:
Uptrend confirmation
Price dipping toward EMA21 or EMA55
A constructive Heikin-Ashi candle
Market environment active
Short entries mirror the same structure in bearish conditions.
Re-entries (L2, L3, S2, S3) are given only if the trend remains intact after the first entry.
4. Hold Logic
A hold signal appears if momentum remains aligned with the trend.
Momentum is evaluated using the Stochastic indicator (K and D lines).
5. Exit Logic
An exit signal appears when:
The recent structural low (for longs) or high (for shorts) is broken, and
The EMA slope indicates weakening trend strength
This combination identifies high-probability trend exhaustion.
How to Use
Add the script to your chart.
Select an asset preset (NQ, GOLD, BTC).
Wait for the market to be active.
Follow the entry signals (L, L2, L3 or S, S2, S3).
Hold signals help confirm continuation.
Exit signals indicate potential trend reversal or weakness.
Feature Summary
Market environment filter
Trend direction filter
Pullback-based entry system
Multi-stage re-entry framework
Momentum-based hold signal
Structure-based exit
Asset-adaptive parameters
Clean chart visualization
Disclaimer
This script is for research and educational use.
It does not constitute financial advice.
Always backtest before using in live markets.
개요
이 스크립트는 시장 상태 필터링, 추세 방향 판단, 고품질 눌림목 진입, 보유 판단, 추세 약화 기반 청산까지 모두 포함하는 완전한 트레이딩 프레임워크입니다.
NQ, 골드(XAUUSD), 비트코인에 맞게 최적화되어 있습니다.
1. 시장 필터
다음 세 가지 중 두 가지 이상이 충족될 때만 매매 환경을 ‘활성’으로 판단합니다.
ATR 기준 변동성 체크
거래량 활성도 체크
가격의 VWAP 거리 체크
2. 방향(추세) 필터
다음 조건을 기반으로 상승·하락 추세를 결정합니다.
EMA21 vs EMA55
가격 vs VWAP
Heikin-Ashi 구조
이 조건이 일치할 때만 롱 전용 또는 숏 전용 모드로 진입합니다.
3. 진입 로직
추세가 유지되는 상태에서 EMA21 또는 EMA55까지 눌림이 나올 때
L 또는 S 신호를 제공합니다.
추세가 유지되면 L2/L3, S2/S3 재진입 신호가 추가로 발생합니다.
4. 보유(Hold)
모멘텀이 추세 방향과 일치할 때 보유 신호를 제공합니다.
5. 청산(Exit)
다음 두 조건이 동시에 나타날 때 청산 신호가 표시됩니다.
직전 구조(스윙)가 붕괴될 때
EMA 기울기가 약화될 때
사용 방법
차트에 스크립트를 추가합니다.
자산 프리셋(NQ, GOLD, BTC)을 선택합니다.
시장이 활성일 때만 신호를 참고합니다.
L/S 진입 신호와 보유/청산 신호를 활용해 매매 흐름을 관리합니다.

Final Scalping Strategy - RELAXED ENTRY, jangan gopoh braderEMA Scalping System (MTF) Guide (1HR direction, 15 min entry)
Objective
To capture small, consistent profits by entering trades when 15-minute momentum aligns with the 1-hour trend.
Trades are executed only during high-liquidity London and New York sessions to increase the probability of execution and success.
Strategy Setup
Chart Timeframe (Execution): 15-Minute (M15).
Trend Filter (HTF): 1-Hour (H1) chart data is used for the long-term EMA.
Long-Term Trend Filter: 50-Period EMA (based on H1 data).
Short-Term Momentum Signal: 20-Period EMA (based on M15 data).
Risk
Metric: 14-period ATR for dynamic Stop Loss calculation.
✅ Trading Rules🟢
Long (Buy) Entry Conditions
Session: Must be within the London (0800-1700 GMT) or New York (1300-2200 GMT) sessions.
HTF Trend: Current price must be above the 1-Hour EMA 50.
Momentum Signal: Price crosses above the 15-Minute EMA 20.
Confirmation: The bar immediately following the crossover must close above the 15-Minute EMA 20.
Ent
ry: A market order is executed on the close of the confirmation candle.
🔴 Short (Sell) Entry Conditions
Session: Must be within the London (0800-1700 GMT) or New York (1300-2200 GMT) sessions.
HTF Trend: Current price must be below the 1-Hour EMA 50.
Momentum Signal: Price crosses below the 15-Minute EMA 20.
Confirmation: The bar immediately following the crossover must close below the 15-Minute EMA 20.
Entry: A market order is executed on the close of the confirmation candle.
🛑 Trade Management & Exits
Stop Loss (SL): Placed dynamically at 2.0 times the 14-period ATR distance from the entry candle's low (for Buys) or high (for Sells).
Take Profit (TP): Placed dynamically to achieve a 1.5 Risk-Reward Ratio (RR) (TP distance = 1.5 x SL d
istance).
📊 On-Chart Visuals
Detailed Labels: A box appears on the entry bar showing the action, SL/TP prices, Risk/Reward in Pips, and the exact R:R ratio.
Horizontal Lines: Dashed lines display the calculated SL (Red) and TP (Green) levels while the trade is active.
Background: The chart background is shaded to highlight the active London and New York tradi
ng sessions.

ICT Sweep + FVG Entry (v6) • Pro Pack 📌 ICT Sweep + FVG Entry Pro Pack
This indicator combines key ICT price action concepts with practical execution tools to help traders spot high-probability setups faster and more objectively. It’s designed for scalpers and intraday traders who want to keep their chart clean but never miss critical market structure events.
🔑 Features
Liquidity Pools (HTF)
• Auto-detects recent swing highs/lows from higher timeframes (5m/15m).
• Draws both lines and optional rectangles/zones for clear liquidity areas.
Liquidity Sweeps (BSL/SSL)
• Identifies when price sweeps above/below liquidity pools and rejects back.
• Optional Grade-A sweep filter (wick size + strong re-entry).
Fair Value Gaps (FVGs)
• Highlights bullish/bearish imbalances.
• Optional midline (50%) entry for precision.
• Auto-invalidation when price fully closes inside the gap.
Killzones (New York)
• Highlights AM (9:30–11:30) and PM (14:00–15:30) killzones.
• Option to block signals outside killzones for higher strike rate.
Bias Badge (DR50)
• Displays if price is trading in a Bull, Bear, or Range context based on displacement range midpoint.
SMT Assist (NQ vs ES)
• Detects simple divergences between indices:
Bearish SMT → NQ makes HH while ES doesn’t.
Bullish SMT → NQ makes LL while ES doesn’t.
SL/TP Helper & R:R Label
• Automatically draws stop loss (at sweep extreme) and target (opposite pool or recent swing).
• Displays expected Risk:Reward ratio and blocks entries if below your chosen minimum.
Filters
• ATR filter ensures signals only appear in sufficient volatility.
• Sweep quality filter avoids weak wicks and fake-outs.
🎯 How to Use
Start on HTF (5m/15m) → Identify liquidity zones and bias.
Drop to LTF (1m) → Wait for a liquidity sweep confirmation.
Check for FVG in the sweep’s direction → Look for retest entry.
Use the SL/TP helper to validate your risk/reward before taking the trade.
Focus entries during NY Killzones for maximum effectiveness.
✅ Why this helps
This tool reduces screen time and hesitation by automating repetitive ICT concepts:
Liquidity pools, sweeps, and FVGs are marked automatically.
Killzone timing and SMT divergence are simplified.
Clear visual signals for entries with built-in RR filter help keep your trading mechanical.
⚠️ Disclaimer: This script is for educational purposes only. It does not provide financial advice or guarantee results. Always use proper risk management.

DP_ORB Entry & Exit IndicatorDisclaimer:
This indicator is for educational purposes only. It does not constitute financial advice. Always do your own research and manage your risk. Also, I cannot take full credit for 'ORB' as its a well known strategy amongst many traders, but I do need to give a special shout out to @TheBigDaddyMax for putting me on to this.
DP_ORB Entry & Exit Indicator
Description:
The DP_ORB Entry & Exit Indicator is a powerful tool designed for traders who utilize the Opening Range Breakout (ORB) strategy on the NYSE session. This indicator visually identifies the initial volatility window of the trading day, by marking the 15m High, and 15m Low into a ORB Box, & then tracks breakout opportunities, and provides clear, dynamic trade management levels—all directly on your chart.
Key Features:
Automatic Opening Range (ORB) Box:
Identifies and plots the high and low of the user-defined opening range (default 9:30–9:45 NYSE) for visual reference and strategy foundation.
Breakout Entry Signals:
Automatically detects and marks long or short breakout entries when price closes above or below the ORB range, with additional momentum confirmation.
Dynamic Stop Loss:
Stop loss is intelligently set to the previous bar’s low for long trades (or high for shorts), adapting to market structure at entry.
Take Profit Targets:
Up to three fully adjustable take-profit levels are plotted, calculated as percentages from entry, supporting progressive trade management.
Visual Trade Management:
Entry, stop loss, and take profit levels are displayed as extending dashed lines from entry point to the current bar, with labels always shown just to the right of price for clarity on all timeframes.
Automatic Reset and Cleanup:
Visuals and logic reset daily and upon exit, ensuring a clean, uncluttered chart experience.
How to Use:
Set your preferred opening range time and take profit levels in the settings.
Wait for a breakout and confirmation during the NYSE session.
Use the on-chart lines and labels to manage your trade according to your risk and strategy plan.
Best For:
Day traders and scalpers seeking a disciplined, visual, and fully-automated approach to opening range breakout trading.

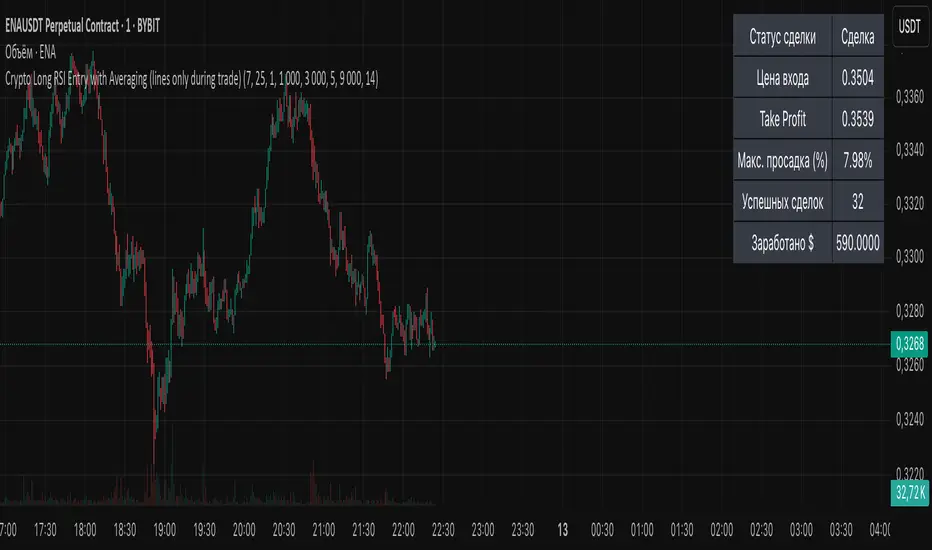
Crypto Long RSI Entry with AveragingIndicator Name:
04 - Crypto Long RSI Entry with Averaging + Info Table + Lines (03 style lines)
Description:
This indicator is designed for crypto trading on the long side only, using RSI-based entry signals combined with a multi-step averaging strategy and a visual information panel. It aims to capture price rebounds from oversold RSI levels and manage position entries with two staged averaging points, optimizing the average entry price and take-profit targets.
Key Features:
RSI-Based Entry: Enters a long position when the RSI crosses above a defined oversold level (default 25), with an optional faster entry if RSI crosses above 20 after being below it.
Two-Stage Averaging: Allows up to two averaging entries at user-defined price drop percentages (default 5% and 14%), increasing position size to improve average entry price.
Dynamic Take Profit: Adjusts take profit targets after each averaging stage, with customizable percentage levels.
Visual Signals: Marks entries, averaging points, and exits on the chart using colored labels and lines for easy tracking.
Info Table: Displays current trade status, averaging stages, total profit, number of wins, and maximum drawdown percentage in a table on the chart.
Graphical Lines: Shows horizontal lines for entry price, take profit, and averaging prices to visually track trade management.
Q Impulse EntryQ Impulse Entry
A directional entry system combining impulse breakouts, Elder's momentum confirmation, and ADX trend validation. Designed for clean trade setups with multi-step filtering, entry markers, and real-time alerts.
🔧 Core Logic
This is not a basic mashup — each filter plays a distinct technical role:
1. Impulse Breakout Engine
• Detects sharp directional price breaks using ATR-adjusted dynamic zones
• Impulse window controls sensitivity to local highs/lows
2. Elder Momentum Filter
• Confirms signal using MACD histogram and EMA alignment
• Blocks entries when internal momentum contradicts price move
3. ADX Trend Strength Filter
• Uses threshold-based ADX logic to validate trend power
• Filters out noise in flat or weak markets
The system requires all three filters to agree before confirming an entry.
📈 Visual Feedback
• ⇑ / ⇓ arrows mark confirmed entry signals
• Colored entry dots plotted at signal price help confirm timing and aid in multi-position layering
• Impulse breakout zones and EMA are displayed for directional context
• Clean layout, no repainting, designed for real-time use
⚙️ Configurable Inputs
• Impulse Window — controls breakout signal sensitivity
• ATR Multiplier — defines width of impulse breakout zones
(Elder and ADX filters are embedded and fine-tuned)
✨ Highlights
• Triple-filter signal logic = fewer false positives
• Entry dots + arrows for visual clarity and scaling in
• Lightweight, non-repainting, and alert-ready
• Best suited for Forex and all timeframes
• Ideal for breakout, trend-following, or hybrid systems
• Built-in alerts and customizable zones
• Always apply risk management suited to your capital and strategy
Trade with clarity — stay for quality.
Spread Entry Balance of PowerThis is a bar chart showing the strength of a potential option spread entry using 8 conditions for each side of a trade, bull or bear.
In theory, if the SE Strength (Spread Entry Strength) is at one of the extremes of the Bear or Bull side, then a spread is prime for entry.
To calculate this, the 8 conditions receive a 1 or zero dependent on whether the condition is true (1) or false (0), and then all of those are summed. The primary gist of the strength comes from Nishant's book, or my interpretation thereof, with some additives that limits what I need to review (such as condition 8 below.)
The 8 Bull Conditions are:
1) Bollinger Bands are outside of the Keltner Channels
2) ADX is trending up
3) RSI is trending up
4) -DI is trending down
5) RSI is under 30
6) Price is below the lower Keltner Channel
7) Price is between the lower Bollinger Band and the Bollinger basis.
8) Price at one point within the last 5 bars was below the lower Bollinger Band
The 8 Bear Conditions are the inverse conditions (except the first), and the conditions are given a negative disposition (meaning they sum to -8 :)):
1) Bollinger Bands are outside of the Keltner Channels
2) ADX is trending down
3) RSI is trending down
4) +DI is trending up
5) RSI is over 70
6) Price is above the upper Keltner Channel
7) Price is between the upper Bollinger Band and the Bollinger basis.
8) Price at one point within the last 5 bars was above the upper Bollinger Band

Experimental Entry Interface (Buy Arrows with TP & SL)This script provides high probability entry points and includes Take Profit and Stop Loss targets.
It attempts to predict when the market conditions are set to move up, and prints long positions.
In addition to Long Entry Arrows, it will print Take Profit / Stop Loss targets.
This indicator is highly adjustable. Hence the name 'Experimental' in the title. Experiment with it to find the results you want.
Designed for use on the 1H timeframe in Forex, but could possibly be useful elsewhere. Do your own testing.
This indicator can repaint. It is best used with alerts set for once per bar close, so that your alerts do not repaint and your trades are solid.
Not ever signal is a winner. Backtest thoroughly. Adjust accordingly.
Arrows
Four sets of colored arrows are included.
💵 💶 Green and Blue Entry Arrows are formed when the market is in an uptrend, and has a momentary pullback.
💴 💷 Yellow and Purple Entry Arrows are formed when the market is just starting to recover from being severely oversold.
Backtest Mode
Turn on Backtest Mode to easily see if an entry ended up as a winner or loser. A Take Profit and Stop Loss line will be drawn to show results.
Take Profit & Stop Loss Targets
You have two options for this.
Price will show you where your TP/SL exits should be placed. These values will show up under the arrow, based on your Risk/Reward ratio.
Pips are much more simple, and will only show you the market entry point and how many pips up/down to place your SL/TP. Warning: This is fixed at a 1:1 RRR .
Risk/Reward Adjustment
Each entry arrow color allows custom risk/reward ratio adjustment.
Dollar Amounts Displayed
Change your account value and leverage to see how much you would have won on each trade.
How to trade with it?
(Forex, 1H) Open the settings, and turn on all the arrow entries. Turn on Backtest mode to see how past trades would have played out. Turn on TakeProfit/StopLoss Targets to see where to set your targets, for each arrow. Set an alert to notify you once per candle close when there is an Entry. Trade happy!
Bill Williams Alligators are also included, if you want. Not necessary though. Some of the calculations depend on them for trend direction analysis.

Pro Volume & Momentum Dashboard [CONFIRMED ENTRY v2.1]🎯 Key Upgrades in This Version:
1. 10-Point Confluence Scoring System
# Factor Description
1 Volume Spike RVOL ≥ threshold with directional candle
2 Volume Delta Buy vs Sell pressure analysis
3 VWAP Position Institutional fair value
4 200 EMA Macro trend alignment
5 EMA Stack 9 > 21 > 50 alignment
6 ADX Trend strength + direction
7 RSI Momentum confirmation
8 MACD Histogram momentum
9 HTF Trend Higher timeframe alignment
10 Candle Quality Strong body, minimal wicks
2. Confirmed Entry Logic
✅ Requires minimum 7/10 confluence score (adjustable)
✅ Waits for candle close to avoid fakeouts
✅ 5-bar cooldown prevents duplicate signals
✅ Potential setups warned when score is 5-6/10
3. Risk Management
Auto-calculated Stop Loss (ATR-based)
Two Take Profit levels (TP1 & TP2)
Visual risk zones on chart
Risk/Reward ratio displayed
4. Higher Timeframe Confirmation
Checks 1H (or custom) timeframe trend
Ensures trade aligns with bigger picture
📌 How to Use:
Wait for ◆ CONFIRMED BUY/SELL label (not triangles)
Check dashboard for 7+/10 score
Entry: On signal candle close
Stop Loss: Red line below/above
Take Profit: Green lines (scale out at TP1, full exit TP2)
🕯️ Candlestick Patterns Added
Bullish Patterns (11 Total)
Pattern Description Strength
Bullish Engulfing Green candle engulfs prior red ⭐⭐⭐ Strong
Hammer Long lower wick at bottom ⭐⭐ Medium
Morning Star 3-candle reversal pattern ⭐⭐⭐ Strong
Bullish Harami Small green inside large red ⭐⭐ Medium
Piercing Line Opens gap down, closes above mid ⭐⭐ Medium
Three White Soldiers 3 consecutive strong green candles ⭐⭐⭐ Strong
Dragonfly Doji Long lower wick, no body ⭐⭐ Medium
Tweezer Bottom Equal lows at support ⭐⭐ Medium
Bullish Marubozu Full body, no wicks ⭐⭐⭐ Strong
Rising Three Continuation after pullback ⭐⭐ Medium
Bearish Patterns (11 Total)
Pattern Description Strength
Bearish Engulfing Red candle engulfs prior green ⭐⭐⭐ Strong
Shooting Star Long upper wick at top ⭐⭐ Medium
Evening Star 3-candle reversal pattern ⭐⭐⭐ Strong
Bearish Harami Small red inside large green ⭐⭐ Medium
Dark Cloud Cover Opens gap up, closes below mid ⭐⭐ Medium
Three Black Crows 3 consecutive strong red candles ⭐⭐⭐ Strong
Gravestone Doji Long upper wick, no body ⭐⭐ Medium
Tweezer Top Equal highs at resistance ⭐⭐ Medium
Bearish Marubozu Full body, no wicks ⭐⭐⭐ Strong
Falling Three Continuation after pullback ⭐⭐ Medium
Hanging Man Long lower wick at top ⭐⭐ Medium

McMillan Volatility Bands (MVB) – with Entry Logic// McMillan Volatility Bands (MVB) with signal + entry logic
// Author: ChatGPT for OneRyanAlexander
// Notes:
// - Bands are computed using percentage volatility (log returns), per the Black‑Scholes framing.
// - Inner band (default 3σ) and outer band (default 4σ) are configurable.
// - A setup occurs when price closes outside the outer band, then closes back within the inner band.
// The bar that re‑enters is the "signal bar." We then require price to trade beyond the signal bar's
// extreme by a user‑defined cushion (default 0.34 * signal bar range) to confirm entry.
// - Includes alertconditions for both setups and confirmed entries.

GOLD Volume-Based Entry StrategyShort Description:
This script identifies potential long entries by detecting two consecutive bars with above-average volume and bullish price action. When these conditions are met, a trade is entered, and an optional profit target is set based on user input. This strategy can help highlight momentum-driven breakouts or trend continuations triggered by a surge in buying volume.
How It Works
Volume Moving Average
A simple moving average of volume (vol_ma) is calculated over a user-defined period (default: 20 bars). This helps us distinguish when volume is above or below recent averages.
Consecutive Green Volume Bars
First bar: Must be bullish (close > open) and have volume above the volume MA.
Second bar: Must also be bullish, with volume above the volume MA and higher than the first bar’s volume.
When these two bars appear in sequence, we interpret it as strong buying pressure that could drive price higher.
Entry & Profit Target
Upon detecting these two consecutive bullish bars, the script places a long entry.
A profit target is set at current price plus a user-defined fixed amount (default: 5 USD).
You can adjust this target, or you can add a stop-loss in the script to manage risk further.
Visual Cues
Buy Signal Marker appears on the chart when the second bar confirms the signal.
Green Volume Columns highlight the bars that fulfill the criteria, providing a quick visual confirmation of high-volume bullish bars.
Works fine on 1M-2M-5M-15M-30M. Do not use it on higher TF. Due the lack of historical data on lower TF, the backtest result is limited.

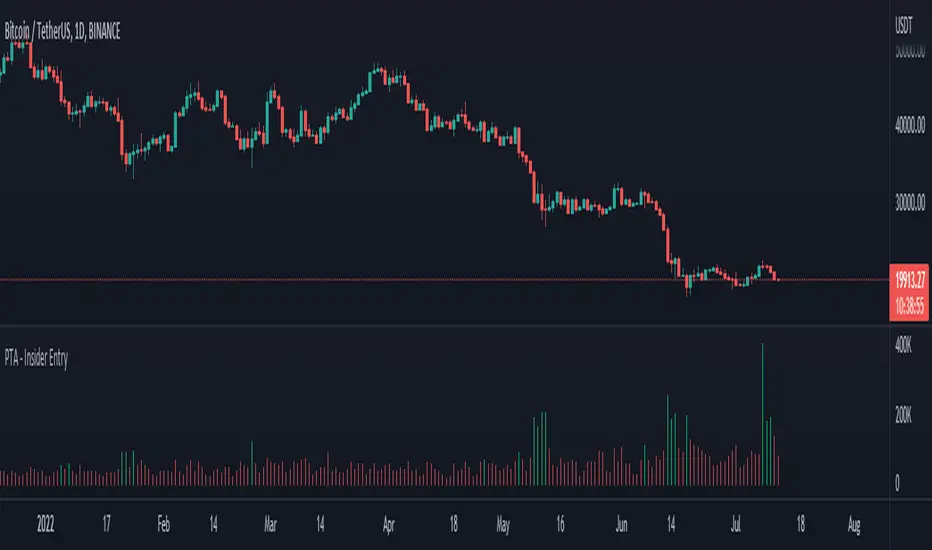
Pro Trading Art - Insider Entry with alertThis indicator is based on volume and ma. This will help you to detect higher volume on chart. You can create alert to stay updated. I am using Fibonacci golden ratio to multiply the current volume. My logic is if volume comes greater than factor of Fibonacci number and current volume then consider it as a insider entry.
Boom Hunter ProBoom Hunter Pro is the ultimate indicator for targeting perfect long entries and epic shorts. Boom Hunter comes with a super fast oscillator that uses Ehlers Early Onset Trend (EOT). This is the Center Of Gravity Oscillator (COG) with a super smoothing filter and a roofing filter. This indicator is tuned for 1 hour charts but can be used on any time frame.
Colored bars can be turned on to assist in finding an entry. Purple signifies a drag and potential dump.
Fibonacci lines can be turned on to track price action and find entries/exit.
This indicator follows the same rules as COG. For more information please see my COG HOWTO here:

Boom HunterEvery "boom" begins with a pullback... This indicator will help traders find bottoms and perfect entries into a pump. It combines two indicators, Dr. John Ehlers Early Onset Trend (EOT) and the infamous Stochastic RSI. The indicator features a built in dump and dip detector which usually picks up signals a few candles before it happens. The blue wave (EOT) shows trend, when waves travel up so does the price. Likewise for the opposite. Low points are revealed when EOT bottoms out and flat lines. Traders can then use the Stochastic RSI crossover to enter a trade. As the EOT lines get closer together there is more movement in price action, so as they get wider traders can expect sideways action. This indicator works on all timeframes but has had excellent results on hourly chart.
Entry zones are marked with a green dot at top of indicator. This signals a bottom is being formed and traders should look for an entry.
Exit points are marked with a red dot at top of indicator. This signals a peak and great time to exit.
Dips and dumps are indicated in red at bottom of indicator.

Spread Entry StrengthThis is an overlay indicator showing a strong potential for entry into an option spread trade.
2 background shadings will occur:
The background will shade blue if the ticker is prime for a Bullish Call spread.
The background will shade purple if the the ticker is prime for a Bearish Put spread.
In theory, if the SE Strength is at one of the extremes of the Bear or Bull side, then a spread is prime for entry.
To calculate this, 8 conditions receive a 1 or zero dependent on whether the condition is true (1) or false (0), and then all of those are summed. The primary gist of the strength comes from Nishant's book, or my interpretation thereof, with some additives that limits what I need to review (such as condition 8 below.)
The 8 Bull Conditions are:
1) Bollinger Bands are outside of the Keltner Channels
2) ADX is trending up
3) RSI is trending up
4) -DI is trending down
5) RSI is under 30
6) Price is below the lower Keltner Channel
7) Price is between the lower Bollinger Band and the Bollinger basis.
8) Price at one point within the last 5 bars was below the lower Bollinger Band
The 8 Bear Conditions are the inverse conditions (except the first):
1) Bollinger Bands are outside of the Keltner Channels
2) ADX is trending down
3) RSI is trending down
4) +DI is trending up
5) RSI is over 70
6) Price is above the upper Keltner Channel
7) Price is between the upper Bollinger Band and the Bollinger basis.
8) Price at one point within the last 5 bars was above the upper Bollinger Band
There is a "market noise" filter that will filter out shading when another market move is considered, i.e. if you don't want to see the potential trade when QQQ moves more than 1% then do the following in the settings:
Check "Market Filter"
Enter QQQ in the "Market Ticker To Use"
Enter 1 in the "Market Too Hot Level"
Press Ok
Obviously, the same holds true for the "Market Too Cool Filter."

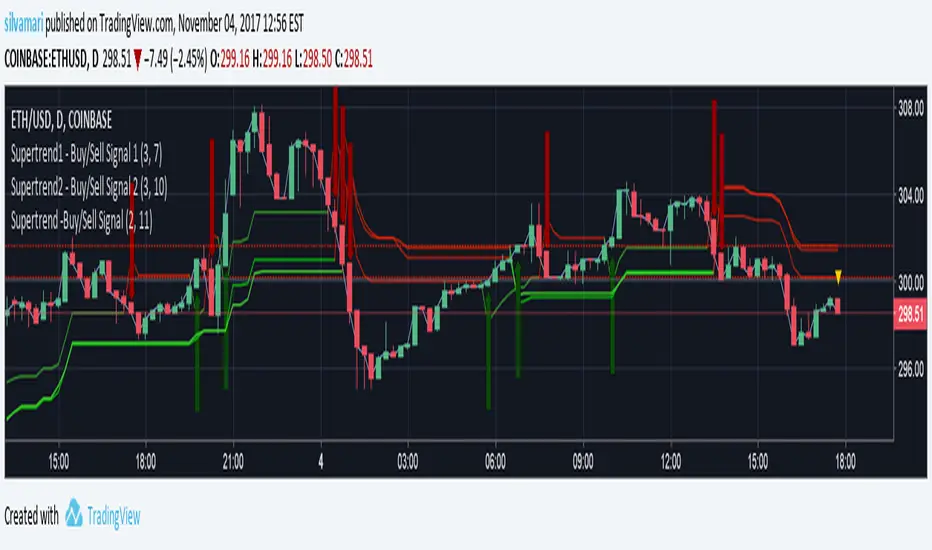
Supertrend - 3 signal settings - (Long/Short entry tool)Using SuperTrend lines to indicate a good time for entering on long or short; 3 supertrend settings together. All 3 lines must agree in order to confirm entry. Works like magic!
Feel free to combine with any other of your trusted tools in making decisions.
--------------
Disclaimer:
Above stated is only my personal method, and should not be seen or used as trading advise. Be sure to do further analysis in order to make your decisions in trading. Your trading decisions and methods of are at your own risk.
Minervini TT + IBD RS + ENTRY What this script does (overall)
This indicator implements a Minervini-style stock selection and entry system with mechanical risk control:
Trend Template (TT)
Uses 50 / 150 / 200 SMA alignment
Requires price to be above key moving averages
Ensures the stock is sufficiently above its 52-week low and not too far from its 52-week high
Relative Strength (IBD-style proxy vs TOPIX)
Compares the stock’s performance against TOPIX
Requires RS to be rising and making new relative highs
Detects RS breakdowns as “no-add / exit watch” warnings
ENTRY conditions (Pivot + Volume + VCP)
Breakout above a pivot high
Volume expansion on breakout
Volatility contraction using ATR% (VCP-like behavior)
Visual signals
BUY label: quality conditions pass
ENTRY label: valid breakout entry
RS BREAK label: relative strength deterioration
What was newly added / updated (important)
🔴 Mechanical stop-loss logic (NEW)
After each ENTRY signal, the script now:
Draws two horizontal stop-loss lines
SL -5% from the ENTRY bar’s high
SL -8% from the ENTRY bar’s high
Lines extend to the right automatically
Detects stop-loss touches
When price (low or close, configurable) crosses below:
SL -5% → SL5 trigger
SL -8% → SL8 trigger
Displays an upward arrow on the bar where each SL is touched
Sends alerts with fixed (const) messages
Handles multiple trades cleanly
If a stop-loss was hit and a new ENTRY appears later:
The previous SL lines are grayed out and dotted
Past exit markers (arrows) remain visible
Prevents inconsistent calculations by evaluating crossunders on every bar
👉 This enables fully mechanical, Minervini-style loss control without discretionary judgment.
