ZenLibraryLibrary "ZenLibrary"
A collection of custom tools & utility functions commonly used with my scripts.
getDecimals() Calculates how many decimals are on the quote price of the current market
Returns: The current decimal places on the market quote price
truncate(float, float) Truncates (cuts) excess decimal places
Parameters:
float : _number The number to truncate
float : _decimalPlaces (default=2) The number of decimal places to truncate to
Returns: The given _number truncated to the given _decimalPlaces
toWhole(float) Converts pips into whole numbers
Parameters:
float : _number The pip number to convert into a whole number
Returns: The converted number
toPips(float) Converts whole numbers back into pips
Parameters:
float : _number The whole number to convert into pips
Returns: The converted number
av_getPositionSize(float, float, float, float) Calculates OANDA forex position size for AutoView based on the given parameters
Parameters:
float : _balance The account balance to use
float : _risk The risk percentage amount (as a whole number - eg. 1 = 1% risk)
float : _stopPoints The stop loss distance in POINTS (not pips)
float : _conversionRate The conversion rate of our account balance currency
Returns: The calculated position size (in units - only compatible with OANDA)
getMA(int, string) Gets a Moving Average based on type
Parameters:
int : _length The MA period
string : _maType The type of MA
Returns: A moving average with the given parameters
getEAP(float) Performs EAP stop loss size calculation (eg. ATR >= 20.0 and ATR < 30, returns 20)
Parameters:
float : _atr The given ATR to base the EAP SL calculation on
Returns: The EAP SL converted ATR size
barsAboveMA(int, float) Counts how many candles are above the MA
Parameters:
int : _lookback The lookback period to look back over
float : _ma The moving average to check
Returns: The bar count of how many recent bars are above the MA
barsBelowMA(int, float) Counts how many candles are below the MA
Parameters:
int : _lookback The lookback period to look back over
float : _ma The moving average to reference
Returns: The bar count of how many recent bars are below the EMA
barsCrossedMA(int, float) Counts how many times the EMA was crossed recently
Parameters:
int : _lookback The lookback period to look back over
float : _ma The moving average to reference
Returns: The bar count of how many times price recently crossed the EMA
getPullbackBarCount(int, int) Counts how many green & red bars have printed recently (ie. pullback count)
Parameters:
int : _lookback The lookback period to look back over
int : _direction The color of the bar to count (1 = Green, -1 = Red)
Returns: The bar count of how many candles have retraced over the given lookback & direction
getBodySize() Gets the current candle's body size (in POINTS, divide by 10 to get pips)
Returns: The current candle's body size in POINTS
getTopWickSize() Gets the current candle's top wick size (in POINTS, divide by 10 to get pips)
Returns: The current candle's top wick size in POINTS
getBottomWickSize() Gets the current candle's bottom wick size (in POINTS, divide by 10 to get pips)
Returns: The current candle's bottom wick size in POINTS
getBodyPercent() Gets the current candle's body size as a percentage of its entire size including its wicks
Returns: The current candle's body size percentage
isHammer(float, bool) Checks if the current bar is a hammer candle based on the given parameters
Parameters:
float : _fib (default=0.382) The fib to base candle body on
bool : _colorMatch (default=false) Does the candle need to be green? (true/false)
Returns: A boolean - true if the current bar matches the requirements of a hammer candle
isStar(float, bool) Checks if the current bar is a shooting star candle based on the given parameters
Parameters:
float : _fib (default=0.382) The fib to base candle body on
bool : _colorMatch (default=false) Does the candle need to be red? (true/false)
Returns: A boolean - true if the current bar matches the requirements of a shooting star candle
isDoji(float, bool) Checks if the current bar is a doji candle based on the given parameters
Parameters:
float : _wickSize (default=2) The maximum top wick size compared to the bottom (and vice versa)
bool : _bodySize (default=0.05) The maximum body size as a percentage compared to the entire candle size
Returns: A boolean - true if the current bar matches the requirements of a doji candle
isBullishEC(float, float, bool) Checks if the current bar is a bullish engulfing candle
Parameters:
float : _allowance (default=0) How many POINTS to allow the open to be off by (useful for markets with micro gaps)
float : _rejectionWickSize (default=disabled) The maximum rejection wick size compared to the body as a percentage
bool : _engulfWick (default=false) Does the engulfing candle require the wick to be engulfed as well?
Returns: A boolean - true if the current bar matches the requirements of a bullish engulfing candle
isBearishEC(float, float, bool) Checks if the current bar is a bearish engulfing candle
Parameters:
float : _allowance (default=0) How many POINTS to allow the open to be off by (useful for markets with micro gaps)
float : _rejectionWickSize (default=disabled) The maximum rejection wick size compared to the body as a percentage
bool : _engulfWick (default=false) Does the engulfing candle require the wick to be engulfed as well?
Returns: A boolean - true if the current bar matches the requirements of a bearish engulfing candle
timeFilter(string, bool) Determines if the current price bar falls inside the specified session
Parameters:
string : _sess The session to check
bool : _useFilter (default=false) Whether or not to actually use this filter
Returns: A boolean - true if the current bar falls within the given time session
dateFilter(int, int) Determines if this bar's time falls within date filter range
Parameters:
int : _startTime The UNIX date timestamp to begin searching from
int : _endTime the UNIX date timestamp to stop searching from
Returns: A boolean - true if the current bar falls within the given dates
dayFilter(bool, bool, bool, bool, bool, bool, bool) Checks if the current bar's day is in the list of given days to analyze
Parameters:
bool : _monday Should the script analyze this day? (true/false)
bool : _tuesday Should the script analyze this day? (true/false)
bool : _wednesday Should the script analyze this day? (true/false)
bool : _thursday Should the script analyze this day? (true/false)
bool : _friday Should the script analyze this day? (true/false)
bool : _saturday Should the script analyze this day? (true/false)
bool : _sunday Should the script analyze this day? (true/false)
Returns: A boolean - true if the current bar's day is one of the given days
atrFilter(float, float) Checks the current bar's size against the given ATR and max size
Parameters:
float : _atr (default=ATR 14 period) The given ATR to check
float : _maxSize The maximum ATR multiplier of the current candle
Returns: A boolean - true if the current bar's size is less than or equal to _atr x _maxSize
fillCell(table, int, int, string, string, color, color) This updates the given table's cell with the given values
Parameters:
table : _table The table ID to update
int : _column The column to update
int : _row The row to update
string : _title The title of this cell
string : _value The value of this cell
color : _bgcolor The background color of this cell
color : _txtcolor The text color of this cell
Returns: A boolean - true if the current bar falls within the given dates
Search in scripts for "fib"
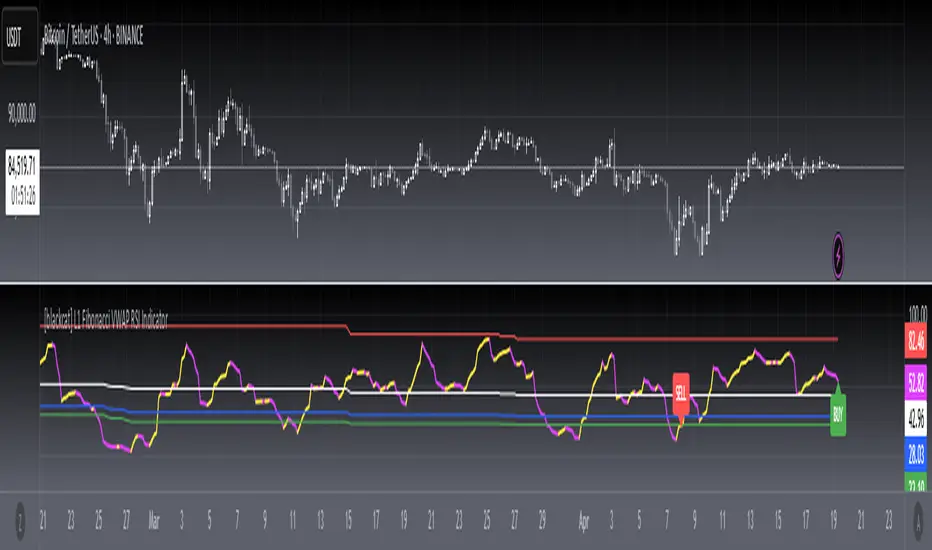
[blackcat] L1 Fibonacci VWAP RSI IndicatorLevel: 1
Background
Ingo Bucher proposed "Fibonacci RSI" in March,2003. It describes the advantages of considering Fibonacci retracement levels for use with the classic RSI indicator. Bucher reviews six charts, each displaying Fibonacci retracement levels for the RSI associated with each chart. The pine code given here will allow you to automatically recreate these charts for any security available in Tradingview. BTW, i enhanced it by changing RSI into VWAP RSI with hl2.
Function
For this Fib VWAP RSI indicator, it also applicable for original Bucher's fib concept. Bucher calculated his retracement levels by picking the RSI high and low for a given time window. In his examples, these were generally six months to a year's worth of data. Once the high and low were picked, he calculated retracement levels based on the well-known Fibonacci numbers (23.6%, 38.2%, 50%, 61.8%). This script here does the same thing. I use a "LookbackLength" (default: 400 bars), which represents a sliding data window that is used to determine the VWAP RSI high and low. The second input value controls the VWAP RSI period (default: 14 bars). The next three inputs select the retracement levels.
A total of eight different lines need to be drawn: the RSI itself, the 50% line, two retracements above the 50% point, two retracements below, and the zero and 100% lines. Pine script will create four plotlines per indicator, so I advise inserting the Fibonacci RSI twice. The first time it is inserted, leave the PlotRSI input with its default value, true. True tells pine script to plot the VWAP RSI itself. The second copy should have the input "Plot RSI" set to false. This will put the 50% line on your chart.
Inputs
LookbackLength --> Look Back Length.
RSILength --> RSI Length.
Fib1 and Fib2 --> Fibonacci lengths.
Key Signal
RawVWAPRSI --> Raw VWAP RSI output signal
Remarks
This is a Level 1 free and open source indicator.
Feedbacks are appreciated.
MA Strategy Emperor insiliconotThe Script offers 9 different EMAs with 14 different MA types.
The make use of the script is to find the entry on the 1-4 hour altcoins while using the in-built 13/21 crossover strategy to be used in sync with Heikin Ashi cross-over with Fib levels of 0.236 Fib level.
How to use it.
Entry is to be made when the
1. Cross over gives a P(Positive Sign) and the candle completely closes above the cross-over
2. When the Heikin Ashi turns green and the next green HA candle goes above the previous green HA candle.
3. The price should be at-least above the 0.236 Level from the Swing high.
All the Best.
EmperorBTC

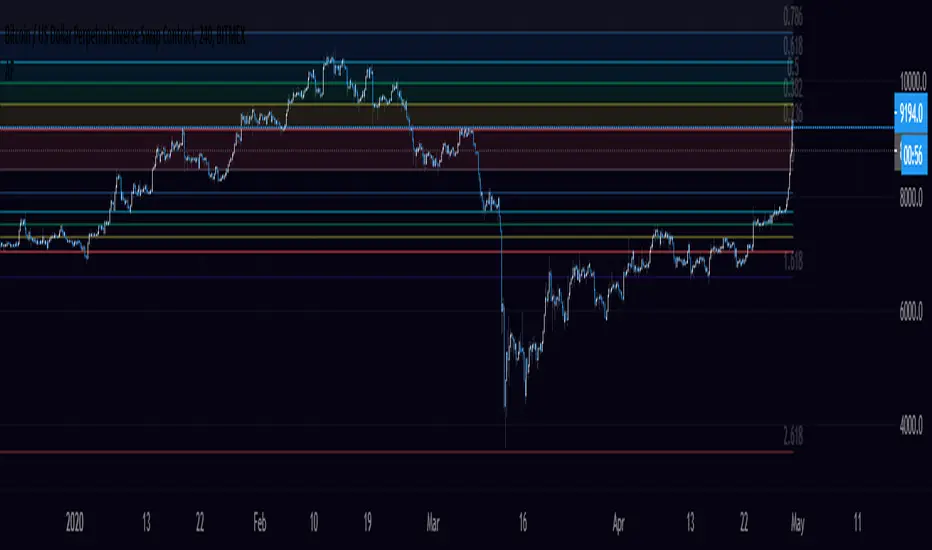
Fibonacci Extension / Retracement / Pivot Points by DGTFɪʙᴏɴᴀᴄᴄɪ Exᴛᴇɴᴛɪᴏɴ / Rᴇᴛʀᴀᴄᴍᴇɴᴛ / Pɪᴠᴏᴛ Pᴏɪɴᴛꜱ
This study combines various Fibonacci concepts into one, and some basic volume and volatility indications
█ Pɪᴠᴏᴛ Pᴏɪɴᴛꜱ — is a technical indicator that is used to determine the levels at which price may face support or resistance. The Pivot Points indicator consists of a pivot point (PP) level and several support (S) and resistance (R) levels. PP, resistance and support values are calculated in different ways, depending on the type of the indicator, this study implements Fibonacci Pivot Points
The indicator resolution is set by the input of the Pivot Points TF (Timeframe). If the Pivot Points TF is set to AUTO (the default value), then the increased resolution is determined by the following algorithm:
for intraday resolutions up to and including 5 min, 4HOURS (4H) is used
for intraday resolutions more than 5 min and up to and including 45 min, DAY (1D) is used
for intraday resolutions more than 45 min and up to and including 4 hour, WEEK (1W) is used
for daily resolutions MONTH is used (1M)
for weekly resolutions, 3-MONTH (3M) is used
for monthly resolutions, 12-MONTH (12M) is used
If the Pivot Points TF is set to User Defined, users may choose any higher timeframe of their preference
█ Fɪʙ Rᴇᴛʀᴀᴄᴇᴍᴇɴᴛ — Fibonacci retracements is a popular instrument used by technical analysts to determine support and resistance areas. In technical analysis, this tool is created by taking two extreme points (usually a peak and a trough) on the chart and dividing the vertical distance by the key Fibonacci coefficients equal to 23.6%, 38.2%, 50%, 61.8%, and 100%. This study implements an automated method of identifying the pivot lows/highs and automatically draws horizontal lines that are used to determine possible support and resistance levels
█ Fɪʙᴏɴᴀᴄᴄɪ Exᴛᴇɴꜱɪᴏɴꜱ — Fibonacci extensions are a tool that traders can use to establish profit targets or estimate how far a price may travel AFTER a retracement/pullback is finished. Extension levels are also possible areas where the price may reverse. This study implements an automated method of identifying the pivot lows/highs and automatically draws horizontal lines that are used to determine possible support and resistance levels.
IMPORTANT NOTE: Fibonacci extensions option may require to do further adjustment of the study parameters for proper usage. Extensions are aimed to be used when a trend is present and they aim to measure how far a price may travel AFTER a retracement/pullback. I will strongly suggest users of this study to check the education post for further details, where to use extensions and where to use retracements
Important input options for both Fibonacci Extensions and Retracements
Deviation, is a multiplier that affects how much the price should deviate from the previous pivot in order for the bar to become a new pivot. Increasing its value is one way to get higher timeframe Fib Retracement Levels
Depth, affects the minimum number of bars that will be taken into account when building
█ Volume / Volatility Add-Ons
High Volatile Bar Indication
Volume Spike Bar Indication
Volume Weighted Colored Bars
This study benefits from build-in auto fib retracement tv study and modifications applied to get extentions and also to fit this combo
Disclaimer:
Trading success is all about following your trading strategy and the indicators should fit within your trading strategy, and not to be traded upon solely
The script is for informational and educational purposes only. Use of the script does not constitute professional and/or financial advice. You alone have the sole responsibility of evaluating the script output and risks associated with the use of the script. In exchange for using the script, you agree not to hold dgtrd TradingView user liable for any possible claim for damages arising from any decision you make based on use of the script

Fibonacci levels alerted as Support and Resistance lvlsThis script is another Fibonacci script however this script gives select signals indicating when a resistance level is hit aswell as a support level.
A resistance level is calculated by price action failing to close or open above a fib level yet its high crossing the level. This essentially means price action was too weak to break this level.
The same goes for support levels where the price open and closes above the fib level yet the price low was below. This means the bears where unable to break the support level and may potentially rebound.
This script uses the 0.764, 0.618, 0.5, 0.382 and 0.236 levels. More can be added to script if asked.
From personal use I use the script to help guide the entry and exit for potential trades aswell as helping mark price targets and exit levels. However i never use this script alone and actively ensure it is used alongside other technical indicators.
Within the script there is also a plotted Fibonacci retracement chart which can help visually aid the trader.

(Custom)Bollingers Bands Fibonacci ratiosThis is a modified Bollinger bands that uses EMA,with ATH to get a main average and then takes Standard Deviations by Fib ratios outwards. It is very useful for Entries and exits. I Typically use it to exit longs or shorts, entries are a bit harder. Generally the price will wick just barely or briefly into the end of one of the bands and then leave, it PINGs it and that is your exit. It is a little hard to predict in real time and set a Take profit at any exact point because it is always moving, but because it constantly adjust it is pretty damn accurate at nailing it. They sorta work at any timeframe, so its up to you, though for Crypto it doesnt do so well above 4hr because it can pump really hard or dump hard and super stretch the bands. Best numbers for the Average are Fib numbers. Stick to using 13, 21, and 34. 34 is my favorite and works best for me, But its up to you. Sometimes its benificial to use 34 on lower timeframes and maybe a smaller number on larger ones IE 21 or 2 or 4hr charts.
Once again it is up to you how to use it. I dont have credit for the original version of it. It is someone else's who I think modified another person's version lol. Ill try and find their name and post a comment though for who I took the original code from.

Padovan RetracementsAlternative to Fibonacci levels. There are actually many such ratios besides the golden ratio and the Fib sequence. This is based on the plastic ratio or the Padovan sequence.
If you wish to use the ratios in the fib tool, the following are the corresponding alternate values :
0.245
0.325
0.430
0.570
0.755
1.000
1.325
1.755
2.325
3.080
4.080

Auto FibonacciA series of Fibonacci sequences using a variety of triggers to base highs and lows off.
High and low look back length can be altered, fibs and fib extensions can be shown or hidden and the background can be filled or transparent.
VPTbollfib & Camarilla (Danarilla)I do not own the original indicators. This is just a combination of the two because of their nature to work in a similar way.
Camarilla Pivots run on the basis of intraday range trading. Usually after daily open you look the fade whatever move happened before. by shorting R3/H3 levels or longing R3/L3. Targeting the other side of the range. This is the infamous PivotBoss level calculations and you would want to activate camarilla and turn off the normal pivots. They use the previous days volatility to plot the next days levels.
But what about some confirmation?
Well RafaelIzoni (who made it open source for improvement) threw together this VPTbollfib. It is volume price trend crossing down a fib line using bollinger bands as price envelope. The beauty of this is that It will signal usually counter to current price action based on selling into uptrends or vise versa. Meaning you get signals to counter price. Which is what you might be looking for on range day trade scalps for camarilla. A wick reversal or engulfing + volume based signal is a very happy pairing together. And those signals are usually suitable for the target of the range you are day trading. Hourly time frame works quite well for both. And camarilla should also be on daily settings.
Special Thanks to Nanda (who published the pivotboss indicator AND) Helped to merge the scripts together.
This indicator alone is an entire trade system. Camarilla already is. If you know the rules. it can be used for entries, exits, risk management to trade the range on TREND, COUNTER TREND, and BREAKOUT plays. The bollinger band fibs add confirmation to the trends levels. And the VPT adds a secondary confirmation to take a camarilla trade.
Try it out. I think you will find both the levels on camarilla and the VPT signals quite suprising.

system yUsing The donchiam fib system and modification of linear regresion bands in which i put the central fib band insted of close
to create it.
we can detect sweet entry and exit points as marked by the arrow (blue =entry) red(exit(
if the cabdles above the bands it very bullish
bellow the bands -very bearish

Fibonacci RSI Ribbon (UO)All levels and RSIs are calculated using Fib numbers. RSI hitting a Fib level is more useful than just hitting 70 or 30

Rumpy's D/W AutofibsUses yesterday's & last week's high/low to plot auto fibs.
You can toggle them on/off separately as it does become a bit cluttered with both enabled.
--------------------------------------
If you find it useful please consider a tip/donation :
BTC - 3BMEXEDyWJ58eXUEALYPadbn1wwWKmf6sA
--------------------------------------
Weekly fibs
--------------------------------------
Daily fibs

The 6 Line Death PunchIf you are looking to discover what trend you are in, you need to first what direction the price is going in...
I've been using and testing a mixture of EMA's and SMA's for a long time and I've found that these ones are by far the best.
EMA 3
EMA 8
MA 20
EMA 55
MA 100
MA 200
EMA 3 & 8 Crossover is a good method for confirming a coin going to the upside or to the downside.
EMA 8 is known as the Trigger Line (trademarked brand) as one of the fib numbers it shows good support or resistance of a trend.
MA 20 universal way of seeing trend direction in the stock market, works well with crypto too.
EMA 55, another trusty fib number. Works very well and could trade off that alone as support and resistance.
MA 100 and MA 200. Long ranged moving averages which govern the overall longer-term trend.
LONG ENTRY
Option 1 - 3/8 crossover
Option 2 - Candles above EMA 8
Option 3 - Candles above MA 20
Option 4 - Candles Above EMA 55.
SHORT ENTRY
Option 1 - 3/8 crossover
Option 2 - Candles below EMA 8
Option 3 - Candles below MA 20
Option 4 - Candles below EMA 55.

Bollingers Bands Fibonacci ratios modifybased on the study of
I just make the fibs bollinger to look slight diffrent( i think in this way its more easy to see the fib bands )
so nothing special about it...

Logarithmic Fibonacci RetraceThis script will allow you to use Logarithmic (instead of linear) Fibonacci retrace.
Please see excellent write up here: www.elliottwavetrader.net
explaining why logarithmic is preferred, especially over large price movement and long timeframes.
All TradingView fib tools use linear math, and will show incorrect long-term levels because of this.
HOW TO USE:
* Enter your points for Wave 0 and 1. Example: 1810.10 and 2872.87 in the SPX chart shown.
* Turn on "show lines" and "show labels". These are OFF by default because the chart will usually get warped
if you display the lines before entering the actual values you want.
* Change the "label offset" if the fib labels are too close or too far from the chart.
Please be aware that this is considered an "INDICATOR" script and so will not save the values separately
for each chart. You will need to enter new values each time you change to a different symbol.

Logarithmic Fibonacci ExtensionThis script will allow you to use Logarithmic (instead of linear) Fibonacci extensions.
Please see excellent write up here: www.elliottwavetrader.net
explaining why logarithmic is preferred, especially over large price movement and long timeframes.
All TradingView fib tools use linear math, and will show incorrect long-term levels because of this.
HOW TO USE:
* Enter your points for Wave 0, 1, and 2. Example: 666.79, 1219.80, 1010.91 in the SPX chart shown.
* Turn on "show lines" and "show labels". These are OFF by default because the chart will usually get warped
if you display the lines before entering the actual values you want.
* Change the "label offset" if the fib labels are too close or too far from the chart.
* Select up to 2.000, 3.000, and 4.000 to display higher-power fibs.
Please be aware that this is considered an "INDICATOR" script and so will not save the values separately
for each chart. You will need to enter new values each time you change to a different symbol.

Fractals V9 ModifiedSo taking Ricardo Santos script for fractals V9 -I change the time function of the high TF fractal to non repainting one
adding daily fib levels
This hybrid seems to look nice . I have to admit that all credit to Ricardo Santos for his exelent script.
thi work it hybrid work and not so much original work....
The main improvment is the signals which are not reapinting as we remove security from that.
Security function exist for daily fib but it has nothing to do wih signal generation so i did not touch it

Hullfib-trailingso I add a trialing function based on volume pf the bars
this will ,ake the system more easy for the trader
1. Hull mean avreage with color changes (green -red that show the trend )
2. signal prouduce by Hull and bollinger fibs
3.signal prouduce by trailing volume bars (B , S)
4. upper and lower daily fibs
togetther you can make good combination when you bet on bitmex
have fun

RSX FracticalityA little project I was working on to avoid studying for finals. Using LazyBear's RSX code for a smoother RSI, then taking the RSX of fib number lengths. Take the average of that, then the JMA of that from the same fib numbers. The average of that is then treated as the trend, take the average of the trend values from the main time frames, the script calls pretty far back so adding a W or M TF I think would throw the calculations off. Then I smoothed that value using the jma's to create the overall trend. I got the idea from Ehler's Empirical Mode Decomposition about identifying peaks and valleys and creating an average of that to create a range. The idea is that if the trend is above the Average Peak then it is a bull trend, less than the average valley it's a bear trend, in between it's ranging. It looks like it turned out alright, I'll be working on this idea of fractals a lot this summer to see if I can improve it or build something better off of the idea.

Fibonacci Commodity Stenth IndexFibonacci Commodity Strength Value tells us about the strength and weakness of bull or bear market.
The main focus in this is too be done at reversal. It can also be used for identifying fake ups/downs.
If all the 4 lines moves upward after a huge up spike, then notice the values of all 4 values. If red fib is smaller than green fib then it is a fake trend. If its more then its uptrend and same for bear movement. ;)
It also represents cci (in terms of values) and rsi (in terms of waves).
Enjoy !!!!!

Automatic Daily Fibonacci v0.3 by JustUncleLThis update is a correction on the way the Fib Zero line is calculated. Previously it was just based on the source of the previous day, which is Ok as long as the Fiblength was set to 2. The new version calculates the Fib Zero from the average of the specified source over the Fiblength, so if Fiblength is now something other than 2 the Fibonacci Zero and other support and resistant levels should calculate correctly.

Everyday 0003 _ MAC Pullback I recently posted a Moving Averge Crossover strategy for my Everyday project - a project I've given myself where I try to create one strategy everyday in between 15 minutes and 2 hours.
In the comments of my last published idea, user SignalTradersUK was very kind and suggested I try the following in my next study:
"i think your next study should be, to workout what to do after the Moving Average cross! If you look just on the chart you have posted, Price would appear to always come back to the levels where the 2 MA's cross and then go back in the direction of the crossing of the MA's. It's a great pull back strategy."
I'm really just beginning to learn about coding strategies so I'm not 100% sure I correctly understood his suggestion.
I admit I had difficulties wrapping my head around how to do this.
Anyway, the result is a strategy which runs alongside the main Moving Average Crossover.
'The Algorithm'
When the fast and slow MA cross the strategy traces back 40 days to find a swing low.
This swing low and the price at the MA cross is used to calculate a fib 1.272 extension.
The price at this 1.272 extension is used to place a Pullback short order.
Since we're shorting a bull trend, a tight stop is used.
If the pullback reaches down to the fib 0.618 we take profit (close the short).
Like I said, I don't know if I correctly understood SignalTradersUK feedback, but I really appreciate the
feedback and advice!
As always I'm hoping to learn from the community, so all feedback, corrections and advice is very welcome!
Thanks!
/pbergden

Vegas TunnelThis indicator adds and subtracts fib levels from the moving average. I suppose profits are meant to be taken at certain levels. Additionally, it may help in finding tops and bottoms. There's more info here: www.forexstrategiesresources.com
The fib levels should be changed depending on time frame:
short) 5, 8, 13, 21
intermediate) 34, 55, 89, 144
long) 55, 89, 144, 233
