PpSignal Chandelier StopThere are few indicators for MT4 which draw trailing stop line. I prefer to use Chandelier Stops. I believe that with good money management this is one of the best tools to follow a trend.
About ATR trailing stop loss (Chandelier Stops)
When you catch trend you can profit from most of the move. The good thing about ATR is that you have a stop loss level in place. When there is a close on the other side of ATR, it is a signal to close. No second guessing.
Best time frame for ATR trailing stop loss
I strongly recommend time frames such as 30m or larger. On lower time frames like 5m there is too much algo trading. I trade with ATR on 1h or 4h charts.
Parameters for trailing stop
Depends on pair or instrument. In most cases standard parameters will be fine. If I change anything then it is usually a Kv parameter. Standard is 3.5 and I tend to make it bigger like 3.7 or 4.0. In most cases it is around 3.7.
ATR trailing stop loss (Chandelier Exit) – Metatrader download
January 1, 2018 by simon in forex indicators
In this section you can download ATR trailing stop loss (Chandelier Exit) for MetaTrader:
– download ATR trailing stop loss (Chandelier Exit) for MetaTrader 4 –
There are few indicators for MT4 which draw trailing stop line. I prefer to use Chandelier Stops. I believe that with good money management this is one of the best tools to follow a trend.
About ATR trailing stop loss (Chandelier Stops)
When you catch trend you can profit from most of the move. The good thing about ATR is that you have a stop loss level in place. When there is a close on the other side of ATR, it is a signal to close. No second guessing.
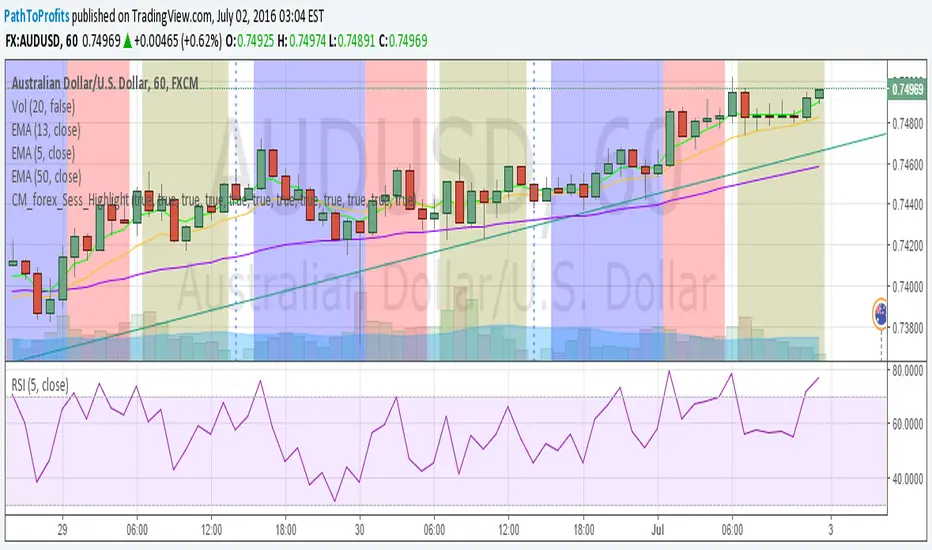
Over 300 pips in profit thanks to ATR stop
Over 300 pips in profit thanks to ATR stop
Best time frame for ATR trailing stop loss
I strongly recommend time frames such as 30m or larger. On lower time frames like 5m there is too much algo trading. I trade with ATR on 1h or 4h charts.
Parameters for trailing stop
Depends on pair or instrument. In most cases standard parameters will be fine. If I change anything then it is usually a Kv parameter. Standard is 3.5 and I tend to make it bigger like 3.7 or 4.0. In most cases it is around 3.7.
Remember, it depends from pair and current situation in the market. You should experiment with few settings and check it on historical price action if they are ok.
Best pairs to trade with ATR trailing stop loss
Trailing stop loss works best in trending markets. That is why you should check pair if it tends to move strong or to move in range. It is not the secret that yen pairs line to move strongly. If you are looking for solid trends, you can’t go wrong with GBPJPY or EURJPY.
Search in scripts for "forex"

NKD Forex Combo Indicator (UTC -5:00, New York/Toronto Time)This indicator is for the NKD Forex Kings & Queens. Use this version if you live in the New York/Toronto UTC -5:00 time zone.

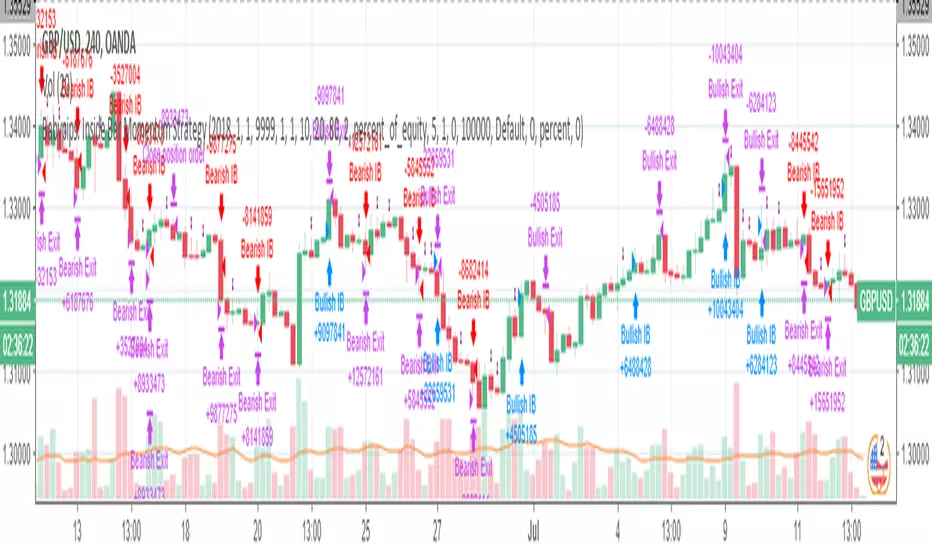
Babypips: Inside Bar Momentum StrategyThe strategy contained in this post comes courtesy of babypips (.com), an excellent resource for all thing forex related. If you are new to trading, the site is definitely worth checking out!
Code commentary and an introduction to Inside Bars are available for this post on the Backtest-Rookies (.com) website.
Note: If you are interested in custom development services, please check out our services page on the Backtest-Rookies site.
Strategy Overview
Inside Bar Momentum Strategy.
Inside Bar Detection
Position sizing based on stoploss distance ( Note: Based on equity and assumes that the account currency is the counter currency.
Stop buys for entries
Takeprofit / Stoplosses for exits
Control Stopbuy, Takeprofit and Stoploss targets with inputs
Control Backtest start/end dates

Default Strategy Inputs (Forex / Crypto)The code in this post contains a set of default strategy inputs I use in new projects / backtests in Tradingview.
Full code commentary is available on the Backtest-Rookies website. To comply with house rules, I cannot post the direct link here.
Features
Trade Direction: So that you can limit the strategy for long only, short only or trade in both directions. It is important to note that when you select “Long Only”, you will still see Short signals on the chart. However, they are only used to close a position rather than reverse it. This is the default behaviour for strategies. The same applies to “Short Only”.
Date Ranges: So that you can isolate backtesting to specific periods of interest such as bull or bear markets.
Sessions: So you can easily get an idea of the expected results during your own session. You may also notice that performance of the strategy varies depending on which session it is deployed in.
Some example stop losses: It is not an exhaustive list but it should be enough to provide some inspiration for different types of stops that you can experiment with.
Happy Scripting. I hope the community finds it useful.
Magic Moving Averages!Magic Moving Averages! is an indicator that comes standard in many forex trading platforms, and now on Tradingview designed for comfortable readability! It incorporates a series of simple moving averages plotted together with increasing periods. Finding a good trade with this is easily found with a set of rules. I took a course with Alex du Plooy on these rules and am using his suggested default values, however there are many more teachers of this method that have various rules that may be similar. If you desire a greater MA spread simply increase the MA Separation value in the input. Best for 15 mins or longer charts.
Happy trading
VWAP forex Yesterday Hi/Low update fix This script is an updte fix of an earlier script that stopped functioning when TradingView updated Pine script. This script plots Forex (24 hour session) VWAP, yesterday's high, low, open and close (HLOC),
the day before's HLOC -
Also plots higher timeframe 20 emas
1 minute 5, 15, 60 period 20 ema
5 minute 15, 60 period 20 ema
15 minute 60, 120 , 240 period 20 ema
60 minute 120, 240 period 20 ema
120 minute 240, D period 20 ema
240 minute D period 20 ema
Also signals inside bars (high is less than or equal to the previous bar's high and the low is greater than or equal to the previous low) the : true inside bars have a maroon triangle below the bar as well as a ">" above the bar.
If subsequest bars are inside the last bar before the last true inside bar they also are marked with an ">"
This is probably a slight variation from the way Leaf_West plots the inside bars.
It appears that he marks all bars that are inside the original bar until one a bar has a high or low
outside the original bar. But I would need to see an example on his charts.
The Time Session Glitch and the Fix FX_IDC, COINBASE and BITSTAMP:
The script will correctly default to 1700 hrs to 1700hrs EDT/EST session for FXCM.
Strangely some securities appear to erroneously start their session at 1200 hrs ie. My guess is that they are somehow tied to GMT+0 instead of New York time (GMT+5). See this for yourself by selecting EURUSD using the FXCM exchange (FX:EURUSD) and then EURUSD from the IDC exchange (FX_IDC:EURUSD). The FX-IDC session opening range starts 5 hours before it actually should at 1700 hrs EDT/EST. To correct for this I have implemented an automatic fix (default) and a user selected "5 hour time shift adjust. ment needed on some securities".
There is also a 4 hour time shift button which might be necessary when New York reverts from Eastern Standard Time to Eastern Daylight Time (1 hour difference) in March (and then back again in November). In the default auto adjust mode you will need to select the 1 hour time shift. That is if this glitch still exists at that time.
I have looked at other scripts, other than my own and where the script is available, that need to use information about the opening bar and all have the same time shift issue
COINBASE and BITSTAMP open at 0000 hours GMT. Since I use lines instead of circles or crosses I had to make a small adjustment to plot the lines correctly.
If it needs work let me know.
Jayy

Complete Forex Trading System6th Indicator:
The forex market is like a clockwork. Bigger and smaller gears working in conjunction. The line plotted is the two currencies on the chart calculated against all other currencies in the basket. Look for divergencies. The currencies on the chart should move as this line.

Naked Forex Trading Strategy v2v1 Big Shadow candles based on "How Naked Trading Works" video by Walter Peters: https://youtu created by AlistarElvis
v2 Bugfix calculation largest candle, added parameter for alternative calculation largest candle

Simple (Forex) Sessions - Asia,London, NYSimple Sessions separator for Forex Traders.
Originally created by ChrisMoody, Edited by Me.
Adjusting the time/color is very easy, but default is EST and should work out of the box.
Hope this helps some people.
VWAP forex Yesterday Hi/Low switchThis script plots VWAP, yesterday's high, low, open and close (HLOC), the day before's HLOC -
Also plots higher timeframe 20 emas including:
1 minute 5, 15, 60 period 20 ema
5 minute 15, 60 period 20 ema
15 minute 60, 120 , 240 period 20 ema
60 minute 120, 240 period 20 ema
120 minute 240, D period 20 ema
240 minute D period 20 ema
Also signals inside bars (high is less than or equal to the previous
bar's high and the low is greater than or equal to the previous low) the : true inside bars have a maroon triangle below the bar as well as a ">" above the bar.
If subsequent bars are inside the last bar before the last true inside bar they also are marked with an ">"
If you have suggestions let me know.
Jayy

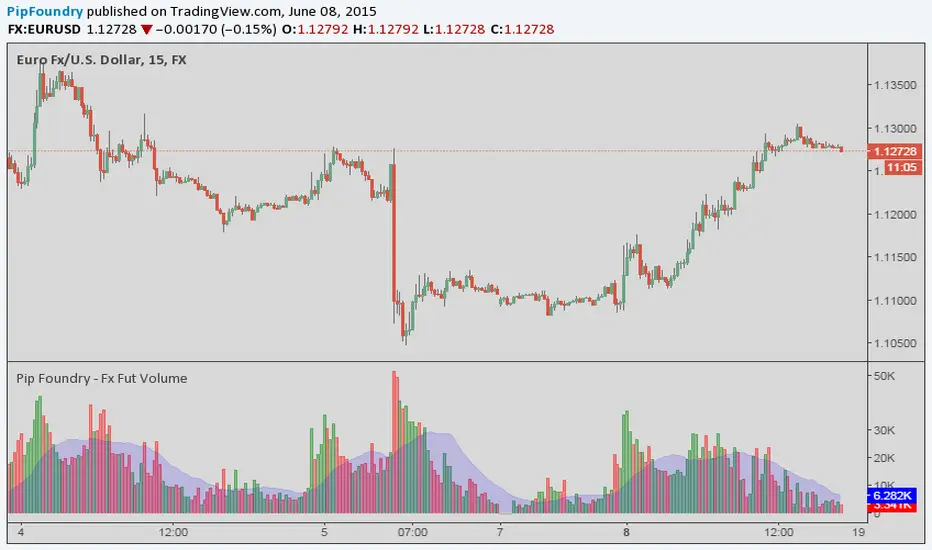
Pip Foundry - Auto Switching Fx Fut VolumeMy premium indicators are available for monthly lease at www.tradingview.com
I previously published a simple volume script that allowed you to manually apply a different security to the one you are charting as the volume plot. However, this script will automatically apply the correct volume data to whatever forex pair you are viewing without requiring a manual setting.
Pip Foundry - Fx IDC OBVMy premium indicators are available for monthly lease at www.tradingview.com
I previously published a simple OBV that allowed you to manually apply a different security to the one you are charting as the volume plot. However, this script will automatically apply the correct volume data to whatever forex pair you are viewing without requiring a manual setting.

Pip Foundry - Simple VolumeMy premium indicators are available for monthly lease at www.tradingview.com
Requested by user SunnyBTC for use in the Forex market on the EURUSD pair.
This simple indicator will allow you to view the volume of a security other than the one you are currently charting.
Edit: This script has since been updated. Please see related link at bottom.

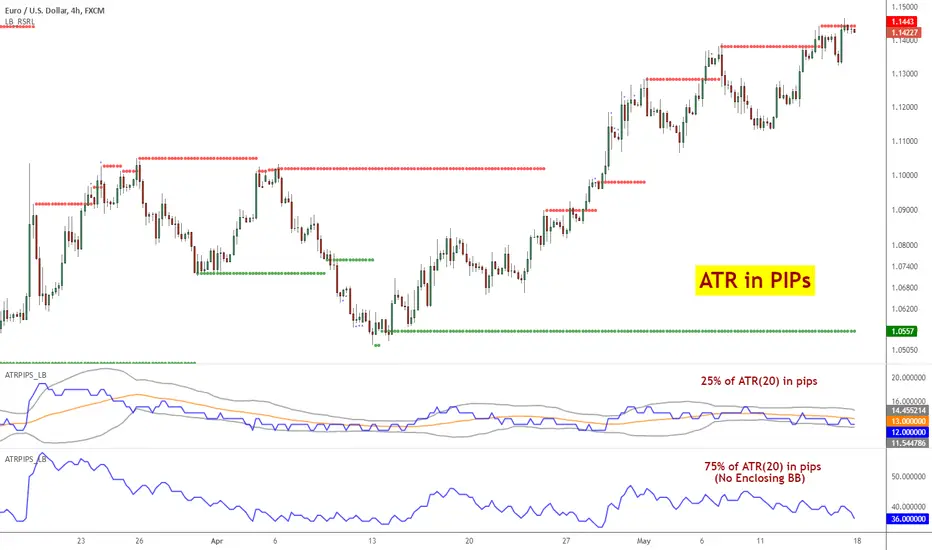
ATR Pips [LazyBear]This is ATR in pips. This was requested by user @ElixiumCapital. ATRPIPs in his words:
"ATR PIPs is useful for finding markets with your desired amount of volatility, for example I prefer to trade forex pairs with the highest amount of volatility in the past 5 days, setting the length parameter to 5 days. And setting my stop loss at 25% to 33% of the the indicators value."
I have added options to show a BB around ATR, as well as normal ATR (not in PIPs). All the parameters are configurable.
List of my public indicators: bit.ly
List of my app-store indicators: blog.tradingview.com
KK_Intraday MAsHey guys,
today I was browsing through intraday Charts looking at some moving averages. Basically what I wanted to see was whether the currency pair was trading below or above the moving average of the day/week/month. For a better understanding: The daily MA on a 15 minute Forex Chart would be the 96 MA.
I encountered the problem that i always had to change the settings for my MAs when changing the Time Interval, so I coded this here up. It is pretty simple but maybe somebody else has the same problem and can put it to use.
The script has some settings as listed below:
Choice which MAs to plot, (Daily, Weekly, Monthly)
Choice which type of MA to use (Simple, Exponential, Weighted)
Neccesary Settings for the correct calculation (e.g. Number of trading hours per day). These settings depend on the instrument you are using and should always be checked before using this script.
There are a few things to Note when using this script:
This script works for intraday charts only.
The monthly MA doesn't work on any Time Interval smaller than 15 minutes. Can't do anything about it unfortunately.
This is my first published Script, use it with caution and let me know what you think about it!

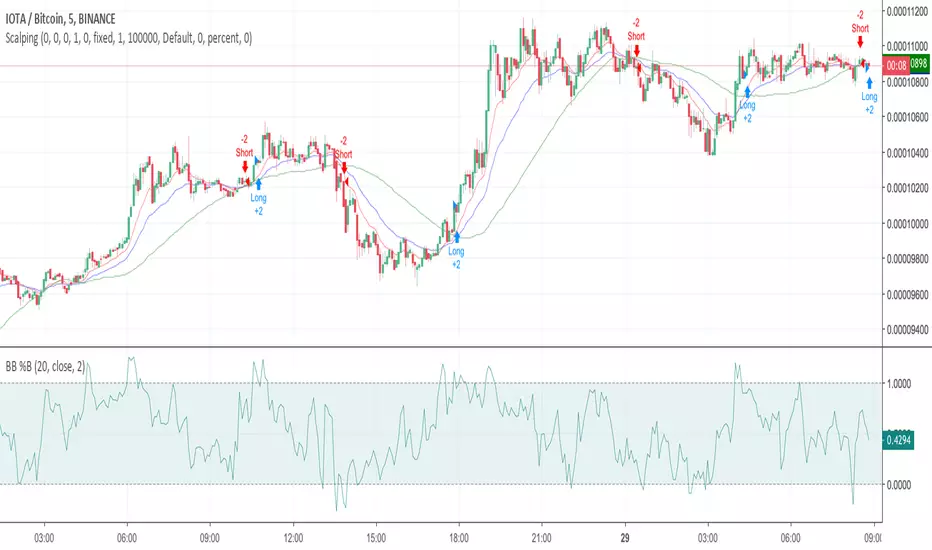
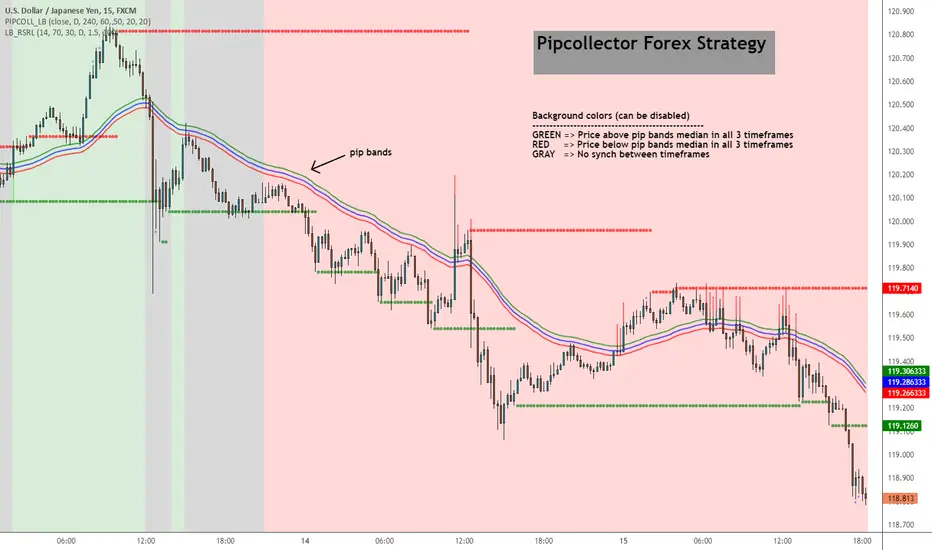
Pip collector [LazyBear]A simple but effective Forex strategy requested by user @pipcollector.
Suggested chart timeframe is 5mins.
Indicator marks potential long/short entries based on the following conditions:
LONG
------
Price above pip median ema on daily, 4 hour and 1 hour timeframe. These 3 timeframes and median EMA lengths are configurable.
Background color is set to GREEN (if option is enabled).
As soon as price touches or crosses the median ema, a GREEN arrow is shown to mark potential long.
SHORT
------
Price below pip median ema on daily, 4 hour and 1 hour timeframe. These 3 timeframes and median EMA lengths are configurable.
Background color is set to RED (if option is enabled).
As soon as price touches or crosses the median ema, a RED arrow is shown to mark potential short.
NO SETUP
-----------
Moving averages do not align on the 3 timeframes.
Background color is set to GRAY (if option is enabled)
I have noticed that this works well on other instruments too (anything trending), also on higher time frames. Feel free to leave any questions/comments on this below.
List of my public indicators: bit.ly
List of my app-store indicators: blog.tradingview.com
Mirrored MACD [LazyBear]This is a famous indicator I have seen used by many Forex traders in MT4 platform. This indicator uses the difference between EMA of "close" and EMA of "open" to form the oscillator lines (not just a convergence/divergence calculation between EMA of "close")
Current market state is determined by which histogram is above zero line. For more confirmation, wait for it to cross above Signal line too. Crossing down the signal or zeroline should be the exit condition. Also, look for divergences.
Use plot labels BullHisto/BearHisto/BearLine/BullLine/ZeroLine/Signal for setting up alerts.
Complete list of my indicators:
-----------------------------
docs.google.com

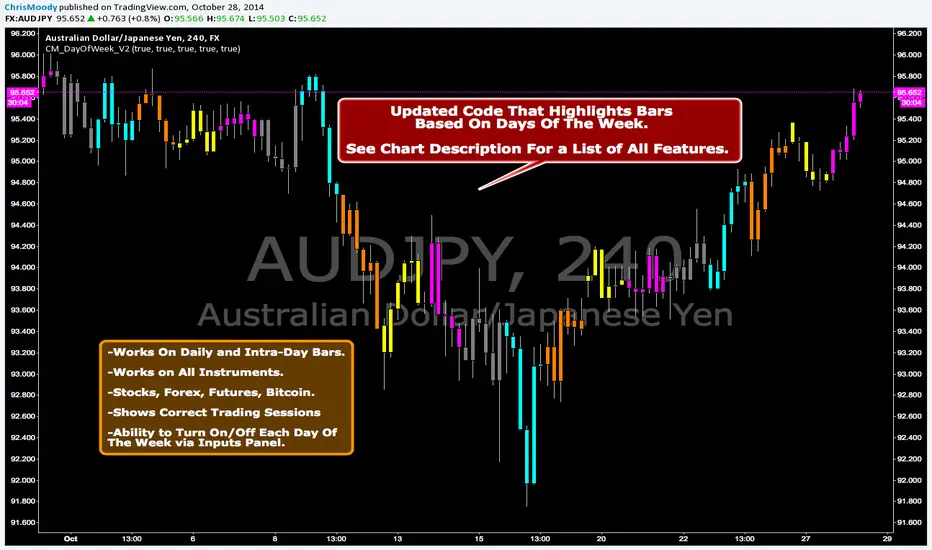
CM_DayOfWeek All Instruments V2Updated Code That Highlights Bars Based On Days Of The Week.
Works On Daily and Intra-Day Bars.
Works on All Instruments. Stocks, Forex, Futures, Bitcoin.
Shows Correct Trading Sessions!!!
Ability to Turn On/Off Each Day Of The Week via Inputs Panel.
magarto indicatorYou also need to add a MA30 to the chart and set a timeframe of W on FOREX and others and H4 or D for BTCUSD.
Buy: when MA30 changes from downtrend to uptrend, price is over MA30 and magarto indicator shows a crossover in the top.
Sell: opposite scenario
Update 1: Sorry, for LTCUSD it didn't work. I used the wrong chart when I published it so check it in BTCUSD.


Forex Trend Master FollowerThis indicator is based on slow and fast EMA, like regular EMA cross, but updated. It works the best on trendy pairs like EU, and works the best on 4h time frame. It shows where to entry and where to close the position based on slow EMA. It can be used like additional confluence with FTB entry model, and whole strategy.
