Search in scripts for "gann"

Natal & Transit Planetary Aspect Table📐 Natal & Transit Planetary Aspect Table
This open-source TradingView indicator displays a customizable table of astrological aspects between natal (first trade or custom date) planetary positions and current/live transits. Built in Pine Script v6, it leverages the AstroLib library for accurate geocentric or heliocentric longitude calculations, supporting a range of financial assets and historical events. Ideal for astro-finance enthusiasts, it highlights major and minor aspects with orbs, applying/separating status, and color-coded visuals. Supports 10 planetary bodies in geocentric mode (Sun, Moon, Mercury, Venus, Mars, Jupiter, Saturn, Uranus, Neptune, Pluto) or 11 in heliocentric mode (adds Earth).
Why Use This Indicator?
Astrology offers a unique lens for market analysis by examining planetary alignments relative to an asset's "birth" date (e.g., first trade), potentially revealing cycles, trends, and timing insights that complement technical and fundamental strategies. This tool empowers traders to integrate astro-finance principles, visualizing cosmic influences that may correlate with price movements, reversals, or volatility—backed by historical presets and customizable options for personalized research.
Key Features:
- 23 preset natal dates for assets like BTC, ETH, NYSE, and more (e.g., BTC genesis block on 2009-01-03), with credits to Susan Abbott Gidel for most of the first trade dates from her book " Trading In Sync With Commodities: Introducing Astrology To Your Technical Toolbox ."
- Manual natal and transit timestamp inputs for flexibility.
- Supports geocentric (default) or heliocentric views (displayed as 𝒢 or ℋ in the table), with adjustable observer location (latitude, longitude, timezone).
- Configurable aspects: Conjunction (☌), Opposition (☍), Trine (△), Square (□), Sextile (⚹), and minors like Semi-Sextile (⚺), Quincunx (⚻), etc., with user-defined orbs and colors.
- Applying (a) or separating (s) status is determined by comparing the orb on the current bar to the previous one—if decreasing, applying; if increasing, separating. This simplified approach may differ from traditional astrological methods that consider planetary speeds, directions (direct/retrograde), and which body is faster/slower.
- Table displays planet symbols or names, degrees/signs with tooltips showing exact longitude (e.g., hovering over a planet symbol reveals its precise degree), and aspect symbols/tags (e.g., ⚹a for applying sextile).
- Tooltip on the dates cell to view the exact transit and natal dates for easy tracking.
- Live mode updates with chart timeframe; test mode allows the user to move the transit date historically or to the future via a custom timestamp.
- Customizable table position, text size, colors, and visibility.
How to Use:
1. Add the indicator to your TradingView chart.
2. Select a preset or manual natal date in settings.
3. Choose live transits or test mode with a custom timestamp.
4. Enable/disable aspects and adjust orbs/colors as needed.
5. Hover over cells for detailed tooltips (e.g., exact orb and applying/separating status).
Powered by @BarefootJoey AstroLib for ephemeris data. For best accuracy, verify positions against external sources.

Rev & Line - CoffeeKillerRev & Line - CoffeeKiller Indicator Guide
🔔 Warning: This Indicator Repaints 🔔 This indicator uses real-time calculations that may change based on future price action. As a result, signals (such as arrows, lines, or color changes) **can and will repaint** — meaning they may appear, disappear, or shift after a candle closes.
**Do not rely on this tool alone for live trading decisions.** Use with caution and always confirm with non-repainting tools or additional analysis.(This indicator is designed to show me the full length of the trend and because of this there can be a smaller movement inside of the trend movement)
Welcome traders! This guide will walk you through the Rev & Line indicator, a sophisticated technical analysis tool developed by CoffeeKiller that combines multiple methodologies to identify market pivots, trends, and potential reversal points.
Core Components
1. ZigZag Analysis
- Dynamic pivot detection using ATR (Average True Range)
- Customizable sensitivity through ATR Reversal Factor
- Color-coded trend lines (green for upward, red for downward)
- Optional vertical lines at pivot points
- Real-time pivot point analysis
2. Donchian Channel Integration
- Traditional upper, lower, and middle bands
- Customizable length and displacement
- Channel-based entry signals
- Dynamic market structure visualization
3. Marker Lines System
- Dynamic support/resistance level tracking
- Pivot-based reset mechanism
- Optional fill zones between markers
- Percentage position tracking within range
4. Signal Generation System
- Confluence between ZigZag pivots and Donchian channels
- Up/down arrow visualization
- Alert system
Main Features
ZigZag Settings
- ATR Reversal Factor: Controls pivot sensitivity (default 3.2)
- Customizable line appearance:
Width control (default: 3)
Color selection (green for uptrend, red for downtrend)
Vertical line options at pivot points
Maximum vertical lines display limit
- Hide repainted option for more reliable signals
Donchian Channel Configuration
- Optional channel visibility toggle
- Length parameter for lookback period (default: 20)
- Displace option for time offset
- Bubble offset for visual placement
Marker Lines System
- High/low/middle marker lines with step-line visualization
- Dotted line projections for future reference
- Pivot-based reset mechanism
- Color-coded percentage position display
Signal Generation
- Triangle markers for signals
- Combined ZigZag and Donchian confluence
- Alert system for notifications
Visual Elements
1. Pivot Lines
- Green: Upward price movements
- Red: Downward price movements
- Customizable line width
- Optional vertical pivot markers with style options:
Solid lines for confirmed pivots
Dashed lines for older pivots
Dotted lines for most recent pivots
2. Donchian Channels
- Upper band (red): Resistance level
- Lower band (green): Support level
- Middle band (yellow): Median price line
- Customizable display options
3. Marker Lines
- High marker line (magenta): Tracks highest open price
- Low marker line (cyan): Tracks lowest open price
- Middle marker line (blue): 50% level between high/low
- Dotted line extensions for future price projections
4. Position Tracking
- Percentage position display within marker range
- Real-time calculations from 0% to 100%
- Label system for visual reference
Trading Applications
1. Trend Following
- Enter on confirmed ZigZag pivot points
- Use Donchian channel boundaries as targets
- Trail stops using marker lines
- Monitor for confluence between systems
2. Counter-Trend Trading
- Trade bounces from marker lines
- Use pivot confirmation for entry timing
- Set stops based on recent pivot points
- Target the opposite marker line
3. Range Trading
- Use high/low marker lines to define range
- Trade bounces between upper and lower markers
- Consider middle marker for range midpoint
- Monitor percentage position within range
4. Breakout Trading
- Enter on breaks above/below marker lines
- Confirm with Donchian channel breakouts
- Use ZigZag pivot confirmations
- Wait for arrow signals for additional confirmation
Optimization Guide
1. ZigZag Parameters
- Higher ATR Factor: Less sensitive, major moves only
- Lower ATR Factor: More sensitive, catches minor moves
- Adjust line width for chart visibility
- Balance vertical line count for clarity
2. Donchian Channel Settings
- Longer length: Smoother channels, fewer false signals
- Shorter length: More responsive, but potentially noisier
- Displacement: Offset for historical reference
- Consider timeframe when setting parameters
3. Marker Line Configuration
- Enable/disable based on trading style
- Toggle middle line for additional reference
- Adjust colors for visual clarity
- Enable/disable labels as needed
4. Signal Generation
- Use "Hide repainted" option for more reliable signals
- Combine ZigZag and Donchian signals for confirmation
- Set alerts based on confirmed pivot points
- Balance sensitivity with reliability
Best Practices
1. Signal Confirmation
- Wait for confirmed pivot points
- Check for Donchian channel interactions
- Confirm with price action
- Look for arrow signals at pivot points
2. Risk Management
- Use recent pivot points for stop placement
- Consider marker line boundaries for targets
- Don't trade against strong trends
- Wait for clear confluence between systems
3. Setup Optimization
- Start with default settings
- Adjust based on timeframe
- Fine-tune ATR sensitivity
- Match settings to trading style
Advanced Features
1. Alert System
- Customizable arrow alerts
- Pivot point notifications
- Text message alerts with ticker information
- Once-per-bar frequency option
2. Pivot Detection Logic
The indicator uses a sophisticated state-based approach to detect pivots:
- State transitions between "uptrend," "downtrend," and "undefined"
- ATR-based reversal detection
- Minimum movement threshold for pivot confirmation
- Historical pivot tracking and labeling
3. Marker Line Reset Mechanism
- Marker lines reset based on pivot detection
- Dynamic support/resistance level adjustment
- Percentage position calculation within range
- Automatic updates as market structure changes
Remember:
- Combine multiple confirmation signals
- Use appropriate timeframe settings
- Monitor both ZigZag and Marker signals
- Pay attention to Donchian channel interactions
- Consider market volatility when trading
This indicator works best when:
- Used with proper risk management
- Combined with other technical tools
- Applied to appropriate timeframes
- Signals are confirmed by price action
**DISCLAIMER**: This indicator and its signals are intended solely for educational and informational purposes. They do not constitute financial advice. Trading involves significant risk of loss. Always conduct your own analysis and consult with financial professionals before making trading decisions.

Gann Swings Trend CounterBased on Rick Santos ' Swing Charts V1 Darvas Box V0.1'
However I have migrated script to pine version 3, customized to suite and added a higher number for the trend count

[JRL] Murrey Math LinesMurrey Math Lines are support and resistance lines based on geometric mathematical formulas developed by T.
H. Murrey. MM lines are a derivation of the observations of W.D. Gann. Murrey's geometry facilitate the use of Gann's theories in a somewhat easier application. According to Gann's theory, price tends to trend and retrace in 1/8th intervals. The most important MM line levels are the 0/8, 4/8 and 8/8 levels, which typically provide strong support and resistance points. The 3/8 and 5/8 levels represent the low and high of the typical trading range. When price is above the typical trading range, it is considered overbought, and when it is below it is considered oversold. The 2/8 and 6/8 levels provide strong pivot points.
Some of the other Murrey Math indicators on TradingView use different formulas and therefore produce varying results. I've checked my indicator against MM indicators on other platforms and it is consistent with those indicators.
This indicator also allows users to switch to alternative timeframes for analysis and it includes labels for the MM lines. If you have any suggestions or comments, please leave them below.
Cheers!

TM_GANN_LEVELTM_GANN_LEVEL indicator have price values those play an important role in market structure explanation. This indicator is used with Day_Price _Level indicator with common values .
These price level must be draw with common values of swing? day levels and must be used during trading decision.
Value with " * " shows important level or a price cycle between two " * " values
Price respect to these levels if used with proper logic.
All the levels are very important .
Use the Below Contacts to Access this Indicator

Harmonic BloomHarmonic Bloom - Advanced Geometric Analysis
Building upon my previous Fibonacci inspired indicator "TrendZone", Harmonic Bloom is a sophisticated geometric trading indicator inspired by W.D. Gann's legendary market geometry principles. It reveals market structure through three key pivot points and dynamic angular analysis, creating powerful harmonic intersections for precision trading.
🎯 Core Features:
📍 Three-Point Gann System:
Set 3 custom pivot points to define your analysis timeframe
Automatic trend detection (bullish/bearish) between pivots
Dynamic geometric box construction following Gann's square principles
📐 Gann-Style 45° Angle Projections:
Pivot 2 Line: Follows trend direction (up if bullish, down if bearish)
Pivot 3 Line: Creates opposition (opposite direction to Pivot 2)
Corner Line: Mirrors Pivot 2 from appropriate box corner
All angles project forward using Gann's 1x1 (45°) methodology for future price targets
⚡ POWER OF HARMONIC INTERSECTIONS:
Confluence Zones: Where multiple 45° angles intersect create the strongest support/resistance
Geometric Harmony: Intersections represent natural market turning points
Time-Price Balance: Following Gann's principle that time and price must be in harmony
Multiple Timeframe Resonance: Intersection points often align across different timeframes
High-Probability Reversals: Markets frequently respect these geometric intersection levels
📊 Customizable Retracement Levels:
8 fully configurable levels (default: 0.0, 0.25, 0.5, 0.75, 1.0, 1.25, 1.5, 1.75)
Choose between 25% or 50% trendline alignment
Individual style controls for each level
🔢 Advanced Gann Analytics:
Fibonacci sequence detection in bar counts (Gann studied natural number sequences)
Numerology sum analysis on pivot prices (Gann's mystical number approach)
Special highlighting for significant numbers
Optional on-chart labels for key metrics
📈 Trading Applications:
✅ Support/Resistance: Use retracement levels for entry/exit points
✅ Gann Angles: 45° lines show momentum direction and strength following Gann's time-price theory
✅ Intersection Trading: Most powerful signals occur at harmonic intersections where multiple angles converge
✅ Price Targets: Forward projections provide future price objectives using Gann's geometric principles
✅ Market Geometry: Identify harmonic patterns and geometric confluences
✅ Time Analysis: Fibonacci-based bar counting for timing decisions (Gann emphasized time cycles)
🌟 Why Harmonic Intersections Are So Powerful:
Gann believed that markets move in geometric harmony, and when multiple angles intersect, they create "magnetic price levels" where:
Maximum Energy Convergence: Multiple geometric forces meet at one point
Natural Turning Points: Markets respect these intersections as natural support/resistance
Time-Price Synchronicity: Intersections often coincide with significant time cycles
Multi-Dimensional Confirmation: Price, time, and geometry align simultaneously
⚙️ Highly Customizable:
All colors, widths, and styles adjustable
Toggle any feature on/off independently
Extend projections beyond the analysis box
Choose your preferred visual presentation
Perfect for traders who use Gann theory, geometric analysis, harmonic patterns, and mathematical market structure. The true power lies in trading the intersection points where multiple harmonic angles converge - these represent the market's most significant geometric turning points.

NIFTY BANKNIFTY MIDCAP SENSEX FINNIFTY LEVELS)this indicator uses Gann's methods which are based on the idea that markets move in predictable geometric patterns and are influenced by time and price.
Key Concepts of Gann Levels:
Gann Angles:
Gann believed that specific angles could indicate the trend of a market. The most notable is the 45-degree angle, which he called the "1x1" or "45-degree line."
Angles are drawn from a significant price point, such as a high or low, and represent the speed or slope of the price movement.
Gann Square of 9:
A mathematical tool that calculates support and resistance levels based on the square root of numbers and their geometric relationships.
It aligns numbers in a spiral format, starting from a central point, and helps identify key price levels at certain degrees.
Gann Fan:
A series of lines drawn at specific angles from a significant high or low. Common angles include 1x1 (45°), 2x1 (26.25°), and 1x2 (63.75°).
These angles help traders identify potential areas where the trend might accelerate, decelerate, or reverse.
Gann Retracements:
Levels based on key price ratios derived from natural laws and geometric principles. Common Gann retracement levels include 12.5%, 25%, 50%, and 75%.
Time Analysis:
Gann emphasized the importance of time cycles. He believed markets move in time-based patterns, such as yearly cycles, seasonal cycles, or specific time intervals.

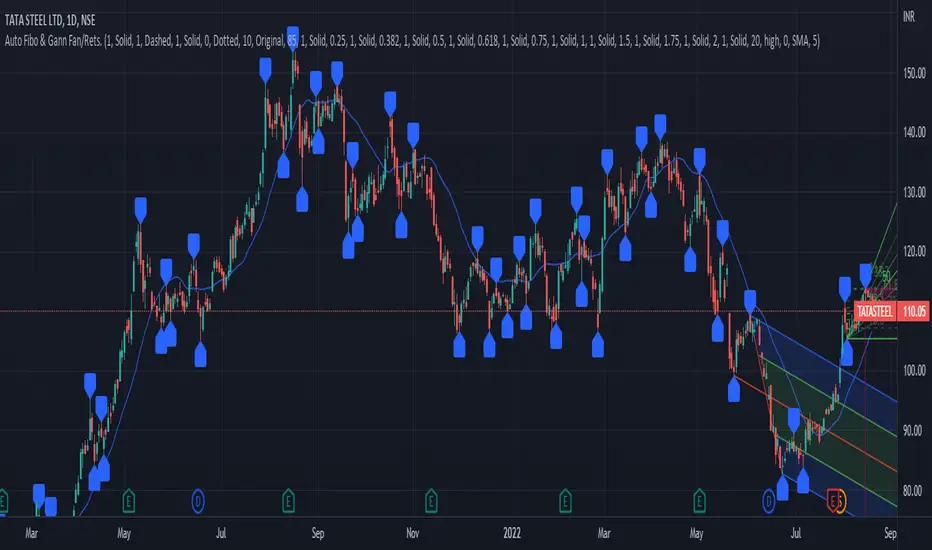
PrasiGanFanFibntroduction
This is a combination of Fibonacci and Gann fan /retracements.
The script can automatically draw as many:
Fibonacci Retracements
Fibonacci Fan
Gann Retracements
Gann Fan
as the user requires on the chart. Each level set or fan consists of 7 lines based on the most important ratios of Fibonacci/ Gann .
Basics
What are Fibonacci retracements?
Fibonacci retracement levels are horizontal lines that indicate where support and resistance are likely to occur. They stem from Fibonacci’s sequence. Each level is associated with a percentage which is how much of a prior move the price has retraced. The Fibonacci retracement levels are 23.6%, 38.2%, 61.8%, and 78.6%. While not officially a Fibonacci ratio, 50% is also used. The indicator is useful because it can be drawn between any two significant price points, such as a high and a low. The indicator will then create the levels between those two points.
What are Gann retracements?
A developer of technical analysis and trading was W.D. Gann . Gann theory expects a normal retracement of 50 percent. This means that under normal selling pressure, the stock price will decline half the amount of its most recent rise, and vice versa. It also suggests that retracements occur at the halfway point of a move, such as 25 percent (half of 50 percent), 12.5 percent (half of 25 percent), and so on.
What is Fibonacci fan?
Fibonacci fan is a set of sequential trend lines drawn from a trough or peak through a set of points dictated by Fibonacci retracements. The first step to create it is to draw a trend line covering the local lowest and highest prices of a security. To reach retracement levels, the trader divides the difference in price at the low and high end by ratios determined by the Fibonacci series. The lines formed by connecting the starting point for the base trend line and each retracement level create the Fibonacci fan.
What is Gann fan?
A Gann fan consists of a series of lines called Gann angles. These angles are superimposed over a price chart to show potential support and resistance levels. The resulting image is supposed to help technical analysts predict price changes. Gann believed the 45-degree angle to be most important, but the Gann fan also draws angles at degrees like 75, 63.75, 26.25 and 15. The Gann fan originates at a low or high point. The resulting lines show areas of potential future support and resistance . The 45-degree line is known as the 1:1 line because the price will rise or fall at a 45-degree angle when the price moves up/down one unit for each unit of time. All other lines in the Gann fan are drawn above and below the 1:1 line. The other angles are associated with 2:1, 3:1, 4:1, 8:1 and 1:8, 1:4, 1:3, and 1:2 time-to-price moves.
Challenges
The most of the time I dedicated to writing this script has been spent on handling these problems:
1. Finding Local Highest/Lowest Prices
In order to draw Fibonacci and Gann fan /retracements, it's necessary to find local highest and lowest price points (Extrema) on the chart. As this could be so challenging, most traders and coders draw the lines covering the low and high prices over a given period of time or a limited number of bars back instead. I already wrote an indicator using this approach (Auto Fibonacci Combo).
In this new script I tried to find the exact highest and lowest prices based on this idea that: if a high point is formed lower than previous high which was after a lowest point, then that previous one was the local highest point, and vice versa if a low point is formed higher than previous low which was after a highest point, then that previous one was the local lowest point. So logically an extremum price on the chart won't be found until the next high/low point is formed.
2. Finding Proper Chart Scale for Gann Fan
Based on the theory, Gann angles are sensitive to the chart price scale and in order to have the right angles, the chart must be made with the proper scale. J.A. Hyerczyk in his book "Pattern, Price & Time - Using Gann Theory in Technical Analysis" suggests that the easiest way to determine the scale of a market is by taking the difference between top-to-top and bottom-to-bottom and dividing it by the time it took the market to move from top to top and bottom to bottom.
Thus on a properly constructed chart, the basic equation for calculating Gann angles is: Price * Time.
3. Drawing Fans and Relocating Fan Labels at Each New Bar in Pine (A Programming-Related Subject)
To do this, I used linear equations and line slopes. Of course it was so complicated and exhausting, but finally I overcame that thanks to my genius cousin.
Settings and Usage
By default, the script shows detected extremum points plus 1 Fibonacci fan, 1 Gann fan , 1 set of Fibonacci retracements and no Gann retracements on the chart. All of these could be changed in the indicator settings beside the color and transparency of each line.
Feel free to use this and send me your thoughts!
VWAP roller autoBrief Description
VWAP Roller Auto is a TradingView Pine Script indicator that combines a rolling (resetting) Volume Weighted Average Price (VWAP) with dozens of dynamic support/resistance levels derived from Gann's Square of 9 principles. The VWAP resets periodically (automatically or manually) starting from a user-defined session open time, and the Gann levels "roll" with it, creating an adaptive grid of potential price reaction zones. It's designed for intraday trading and overlays directly on the price chart.
Key Features
Rolling VWAP with Custom Session Start
VWAP calculation restarts at configurable session open (default 8:30 CST, using proper Chicago timezone handling).
Auto-Adaptive Period Selection
Automatically chooses the VWAP reset period (from 2 min up to 48 hours) based on current volatility (ATR + realized range). Targets a user-defined spacing (~0.08% by default) between consecutive VWAPs to keep the grid relevant to market conditions. Falls back to manual period if disabled.
Gann Square of 9 Levels
Generates ~8 pairs of resistance (R) and support (S) levels above/below the current rolling VWAP using octave-based increments.
Two increment modes:
Points mode — fixed point steps that double octavely (e.g., 0.305, 0.610, 1.22, 2.44, etc.).
Percent mode — percentage steps scaled so the middle octave aligns near 0.025% for finer resolution on lower-priced assets.
Visual Enhancements
Colored fills between key level groups (e.g., inner ±0.25 octave in blue, ±1–2 octave zones in gray, higher extremes in yellow/red).
Labels on the right side marking important zones ("low", "normal", "high", "3/4 - ps1", "extreme - ps2").
Central VWAP line (customizable color and offset).
Table showing current period length and whether auto mode is active.
Non-Timeframe Friendly
Works on range bars, Renko, etc., using fallback settings when timeframe is non-standard.
Use Cases
Intraday Support/Resistance Trading
Treat the rolling VWAP as fair value and use the Gann-derived levels as dynamic zones for potential reversals, breakouts, or mean reversion.
Scalping and Day Trading
Auto-period ensures the grid spacing matches current volatility — tighter levels in quiet markets, wider in volatile ones — ideal for futures (ES, NQ), crypto, or forex.
Zone-Based Entries/Exits Buy near labeled support zones (e.g., "low" or "normal" volatility bottoms) when price trades below VWAP.
Sell/short near resistance zones in overbought conditions.
Watch for hits of "extreme" zones (±8 octave) as potential strong reversal signals.
Confluence Tool
Combine with order flow, volume profile, or other indicators; the colored fills highlight "value areas" similar to market profile concepts but anchored to a rolling VWAP.
In short, VWAP Roller Auto provides a sophisticated, self-adjusting Gann-inspired grid that moves with the market's fair value, helping traders identify high-probability reaction zones throughout the trading session.

VWAP CATS background flipped 4.0VWAP CATS Background Flipped 4.0 is a sophisticated Pine Script v5 indicator for TradingView that combines a configurable moving average (MA) with dynamic Gann Square of 9 levels to create a multi-layered background shading system for price action analysis. It visualizes support/resistance zones around a central MA (often VWAP or RVWAP) using incremental offsets (either % or absolute points), generating symmetrical bands that resemble a "CATS" (Concentric Adaptive Tiered System) — hence the name.The background is "flipped" in the sense that shading intensity and structure emphasize higher-tier zones, and labels are placed to the right of the chart for future projection.Key FeaturesFeature
Description
Multi-MA Engine
Supports 20+ MA types: EMA, DEMA, TEMA, SMA, VWAP, RVWAP, HMA, ALMA, custom volume blends (CVB1–4)
RVWAP Mode
Rolling VWAP with adaptive or fixed time window (days/hours/minutes)
Gann Square of 9 Logic
Generates 80+ symmetric levels (0.25x to 17x increment) above/below the MA
Dual Increment Mode
Choose Percent or Points for spacing
Background Fills
Tiered transparency fills between Gann levels (darker = stronger zones)
Visual MA Offset
Shift MA line left/right without breaking fill alignment
Smart Labels
Projected labels on last bar: "FV", "normal", "high", "3/4" at key levels
Performance Optimized
Hidden plots + label cleanup to prevent lag
Primary Use Cases
1. Institutional VWAP Anchoring
Use RVWAP (1-day fixed) as maRaw
Set Increment = 0.5 points or 0.05%
Watch price interaction with "normal" (2x), "high" (4x), "3/4" (6x) zones
Ideal for intraday scalping on indices (ES, NQ) or forex
2. Swing Trading with Gann Projections
Use 400-period SMA/EMA on daily chart
Increment in Percent mode (~1.22%)
Identify confluence when price rejects at 2x, 4x, or 6x bands
Labels project future targets to the right
3. Volume-Weighted Mean Reversion
Select CVB1–CVB4 for heavy volume smoothing
Use Points mode for stocks with stable tick sizes (e.g. $0.50 increments)
Trade mean reversion between ±1x and ±2x bands
4. Risk Management & Stop Placement
Place stops beyond 2x or 4x bands
Take profits at next major tier (e.g. 4x → 6x)
Pro Tips
Enable "Use Fixed Time Period" for RVWAP to avoid session reset issues
Increase i_label_offset on lower timeframes to avoid overlap
Combine with volume profile or order flow for confluence
The "FV" label marks the Fair Value MA — core anchor
Summary"VWAP CATS Background Flipped 4.0" turns any moving average into a dynamic Gann-based pricing grid with intelligent background shading and forward-projected labels — perfect for institutional-style mean reversion, swing targeting, and risk-defined trading."

LA - EMA Bands with MTF DashboardDetailed Explanation of the LA - EMA Bands with MTF Dashboard Indicator
This custom Pine Script v6 indicator, designed for Trading View, overlays EMA-based price channels on the chart while incorporating a multi-timeframe (MTF) dashboard for broader market context. It focuses on visualizing trend direction and momentum through three sets of EMA bands, each representing different time horizons, and extends this with a tabular dashboard that summarizes signals across user-selected timeframes. The bands help identify support, resistance, and trend shifts, while the dashboard provides at-a-glance alignment across multiple periods, aiding in confirming trades or spotting divergences. Unlike volatility-based channels (e.g., Bollinger or Keltner), it relies solely on EMAs for simplicity and lag-reduced responsiveness.
Inputs Section
The script begins with user-configurable options grouped for ease. A timeframe input allows specifying a resolution for the EMA bands' data fetching, defaulting to the chart's timeframe if left empty—this enables higher-timeframe overlays on lower charts for context.
Next, a shared source input defines the price data for all midlines, defaulting to the midpoint of high and low (hl2) but customizable to close, open, or others.
The EMA bands have dedicated toggles and length inputs for each of the three sets: the first (long-term) defaults to 144 periods, the second (medium-term) to 72, and the third (short-term) to 12. These are inlined for compact settings panels, with minimum lengths of 1 to prevent errors.
A boolean toggle controls the visibility of the MTF dashboard. Following this are nine pairs of inputs for dashboard timeframes: each pair includes a show/hide toggle and an editable timeframe string (e.g., '1' for 1-minute, 'D' for daily). Defaults progress from short (1, 3, 5 minutes) to longer (15, 30, 60 minutes, daily, weekly, monthly), grouped in inlines for organization. Only enabled and non-empty timeframes appear in the dashboard.
Helpers Section
Two utility functions are defined here. The first computes an EMA on any source series over a specified length using Trading View's built-in function, reused throughout for midlines and bands.
The second function generates a signal string ("B" for buy/bullish, "S" for sell/bearish, or "-" for neutral) based on the direction of an EMA applied to high prices. It compares the current EMA value to the previous one, mirroring the band fill logic for consistency in the dashboard.
Core Components per Band Set:
Midline: An EMA calculated on a user-selectable source price (default: hl2, which is the midpoint between high and low prices). This acts as the central trend line.
Upper Band: An EMA applied directly to the high prices of each bar.
Lower Band: An EMA applied to the low prices of each bar.
These form a channel that captures the smoothed range of price action, highlighting potential support (lower band), resistance (upper band), and overall trend direction (midline).
Multiple Band Sets: The indicator includes three independent EMA band sets, each with its own length parameter for customization:
EMA1 (default length: 144) – Focuses on long-term trends.
EMA2 (default length: 72) – Targets medium-term trends.
EMA3 (default length: 12) – Emphasizes short-term momentum.
Each set can be toggled on or off via input checkboxes, allowing users to reduce chart clutter if needed.
Visual Elements:
Midline Plot: Displayed as a line colored based on its direction compared to the previous bar: green for rising (bullish), red for falling (bearish), and black for neutral (flat).
Band Fill: The area between the upper and lower bands is filled with a semi-transparent color indicating the trend of the upper band: light green for rising (suggesting expanding highs/upward momentum) and light pink for falling (contracting highs/downward pressure). The bands themselves are plotted in blue with a thin linewidth.
Multi-Timeframe Support: Users can input a custom timeframe (e.g., 'D' for daily), and the indicator fetches data from that resolution. This enables higher-timeframe context on lower-timeframe charts, such as viewing daily EMA bands on a 1-hour chart.
Calculation Mechanics:
All EMAs are computed using Trading View's built-in ta.ema() function.
Data is retrieved in a single request.security() call for efficiency, with lookahead enabled to avoid repainting.
No multipliers or volatility adjustments are included, making it a simple EMA-based envelope rather than a true volatility channel.
In practice, this indicator helps traders identify trend strength, potential breakouts (price crossing bands), or mean-reversion opportunities (price bouncing within bands). It's particularly useful for swing or position trading where multi-period alignment (e.g., all midlines green) signals conviction.
Pros
Multi-Period Insight: By combining short (12), medium (72), and long (144) periods, it offers a layered view of trends across time horizons, helping confirm alignments or divergences without needing multiple separate indicators.
Visual Clarity: Color-coded trends and fills make it easy to spot bullish/bearish shifts at a glance, reducing analysis time.
Flexibility: Custom timeframe input allows for multi-timeframe analysis, while shared source and toggles provide user control.
Simplicity and Efficiency: Purely EMA-based, it's computationally light and avoids overcomplication, making it accessible for beginners while still useful for spotting channel-based setups like squeezes or expansions.
No Repainting: With lookahead, plots are stable once bars close.
Cons
Lagging Nature: EMAs inherently lag price action, especially longer ones like 144-period, which may cause delayed signals in fast-moving or ranging markets.
Lack of Volatility Adjustment: Unlike Keltner Channels or Bollinger Bands, it doesn't incorporate ATR or standard deviation, so bands may not accurately reflect true volatility—potentially leading to false breakouts in high-volatility environments.
Chart Clutter: Displaying all three band sets simultaneously can overcrowd the chart, particularly on lower timeframes or volatile assets.
Subjective Interpretation: Color changes and band interactions require trader discretion; there's no built-in alerting or quantitative signals, which might lead to inconsistent results.
Market Dependency: Defaults may not suit all assets (e.g., stocks vs. crypto); shorter periods like 12 could whipsaw in noisy markets, while 144 might be too slow for intraday trading.
Justification for Default Values (12, 72, and 144)
The default lengths of 12, 72, and 144 are not arbitrary but draw from established trading principles, particularly W.D. Gann's geometric and numerical theories, as well as Fibonacci sequences, to create a harmonic progression for short-, medium-, and long-term analysis. Here's the rationale:
12 (Short-Term): This is a common period for capturing recent momentum in technical indicators, often seen in setups like the MACD (which uses 12- and 26-day EMAs). It aligns with natural cycles, such as the 12 months in a year, and in Gann theory, 12 serves as a base unit for squaring price and time (e.g., in the "Square of 12" where multiples like 12, 24, etc., measure cycles in days, weeks, or months). At 12 periods, the EMA reacts quickly to price changes without excessive noise, making it ideal for short-term trend detection.
72 (Medium-Term): This acts as an intermediate bridge, derived from Gann's divisions of the 360-degree circle (a key Gann concept representing a full cycle). Specifically, 72 is 360/5 (relating to pentagonal geometry and natural harmonics) and appears in Gann's time cycle measurements (e.g., as a multiple in the Square of 12: 12×6=72). It's roughly half of 144, providing a balanced midpoint for medium-term trends without overlapping too closely with the others. In practice, 72 periods smooth out short-term fluctuations while still responding to developing trends.
144 (Long-Term): This is a powerhouse number in trading lore, being both 12 squared (12×12=144, central to Gann's "Square of 144" for monthly charts and major cycle turns, as there are 12 months in a year) and a Fibonacci sequence value (1, 1, 2, 3, 5, 8, 13, 21, 34, 55, 89, 144...). Fibonacci periods are popular in moving averages for their alignment with natural growth patterns in markets, and 144 is often used for long-term regime definition (e.g., confirming trends over 144 bars). It helps identify major support/resistance in extended cycles.
Overall, these values form a geometric/harmonic series (12, 72=12×6, 144=12×12), promoting alignment with market cycles as per Gann and Fibonacci principles, rather than generic lengths like 50 or 200. They can be adjusted based on the asset or timeframe, but the defaults provide a starting point rooted in time-tested trading numerology for balanced multi-period analysis.
Please use this along with other indicators (eg. Pivot, MACD, etc) for better results.

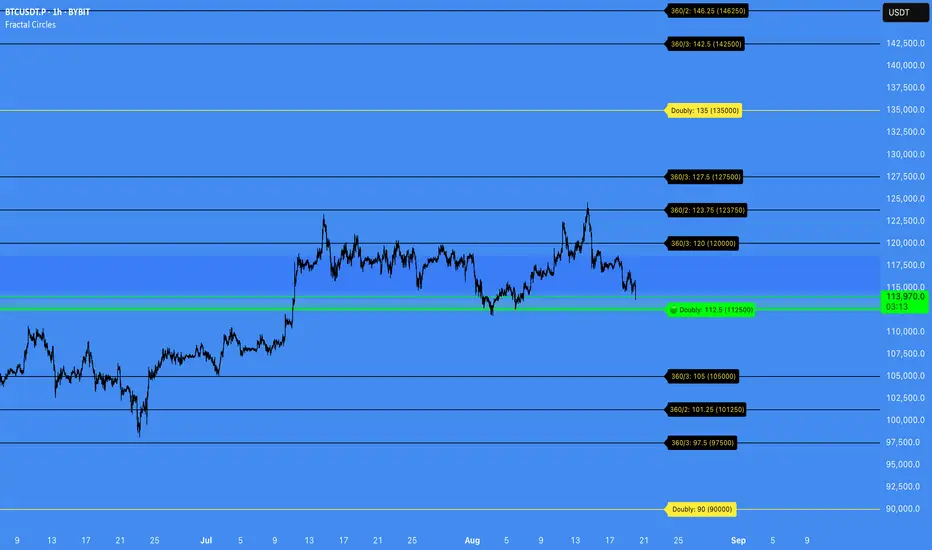
Fractal Circles#### FRACTAL CIRCLES ####
I combined 2 of my best indicators Fractal Waves (Simplified) and Circles.
Combining the Fractal and Gann levels makes for a very simple trading strategy.
Core Functionality
Gann Circle Levels: This indicator plots mathematical support and resistance levels based on Gann theory, including 360/2, 360/3, and doubly strong levels. The system automatically adjusts to any price range using an intelligent multiplier system, making it suitable for forex, stocks, crypto, or any market.
Fractal Wave Analysis: Integrates real-time trend analysis from both current and higher timeframes. Shows the current price range boundaries (high/low) and trend direction through dynamic lines and background fills, helping traders understand market structure.
Key Trading Benefits
Active Level Detection: The closest Gann level to current price is automatically highlighted in green with increased line thickness. This eliminates guesswork about which level is most likely to act as immediate support or resistance.
Real-Time Price Tracking: A customizable line follows current price with an offset to the right, projecting where price sits relative to upcoming levels. A gradient-filled box visualizes the exact distance between current price and the active Gann level.
Multi-Timeframe Context: View fractal waves from higher timeframes while maintaining current timeframe precision. This helps identify whether short-term moves align with or contradict longer-term structure.
Smart Alert System: Comprehensive alerts trigger when price crosses any Gann level, with options to monitor all levels or focus only on the active level. Reduces the need for constant chart monitoring while ensuring you never miss significant level breaks.
Practical Trading Applications
Entry Timing: Use active level highlighting to identify the most probable support/resistance for entries. The real-time distance box helps gauge risk/reward before entering positions.
Risk Management: Set stops based on Gann level breaks, particularly doubly strong levels which tend to be more significant. The gradient visualization makes it easy to see how much room price has before hitting key levels.
Trend Confirmation: Fractal waves provide immediate context about whether current price action aligns with broader market structure. Bullish/bearish background fills offer quick visual confirmation of trend direction.
Multi-Asset Analysis: The auto-scaling multiplier system works across all markets and timeframes, making it valuable for traders who monitor multiple instruments with vastly different price ranges.
Confluence Trading: Combine Gann levels with fractal wave boundaries to identify high-probability setups where multiple technical factors align.
This tool is particularly valuable for traders who appreciate mathematical precision in their technical analysis while maintaining the flexibility to adapt to real-time market conditions.
Enigma Unlocked 2.0Description for "Enigma Unlocked 2.0" Pine Script Indicator
Overview
Enigma Unlocked 2.0 is an advanced and highly customizable indicator designed to deliver actionable buy and sell signals by leveraging precise candlestick logic during specific market transitions. This indicator is built for flexibility, helping traders identify high-probability trade setups during key trading periods, specifically the transitions between the Asian Kill Zone and London Kill Zone as well as the London Kill Zone and New York Kill Zone on the 30-minute timeframe.
By combining Enigma Unlocked 2.0 with the ICT Killzones & Pivots indicator, traders can gain a deeper understanding of the timing and location of these transitions. Waiting for signals during these defined kill zones increases the likelihood of finding high-probability trade setups.
How to Use
Follow the Kill Zone Transitions:
Use the ICT Killzones & Pivots indicator to clearly visualize the boundaries of the Asian, London, and New York kill zones.
Focus on the signals generated by Enigma Unlocked 2.0 that align with these kill zone transitions.
Plotting Entries and Targets with Gann Box:
For Buy Signals:
Use the Gann Box tool to mark the high and low of the signal candle.
Ensure your Gann Box settings include only the 50%, 0%, and 100% levels.
Your entry zone lies between the 50% and 100% levels (discount zone). This is where buy trades are expected to offer an optimal risk-reward ratio.
For Sell Signals:
Similarly, plot the Gann Box on the high and low of the signal candle.
The 50% to 100% zone acts as the premium area for sell trades.
Setting Stop Loss and Targets:
To identify a safe stop loss, split the 50% zone of the Gann Box using another Gann Box.
Draw the secondary Gann Box from 50% to 100% of the initial box, then extend it to double the height.
For sell trades, place the stop loss above the extended 100% level.
For buy trades, place the stop loss below the extended 100% level.
Aim for a minimum of 1:1 risk-to-reward to ensure optimal trade management.
How It Works
Buy Logic:
Buy Logic 1: Detects a bullish candle (close > open) that:
Closes above its midpoint (50% of the candle body).
Has a low lower than the previous candle's low.
Buy Logic 2: Identifies a bearish candle (close < open) that:
Closes above its midpoint (50% of the candle body).
Has a low lower than the previous candle's low.
Sell Logic:
Sell Logic 1: Detects a bearish candle (close < open) that:
Closes below its midpoint (50% of the candle body).
Has a high higher than the previous candle's high.
Sell Logic 2: Identifies a bullish candle (close > open) that:
Closes below its midpoint (50% of the candle body).
Has a high higher than the previous candle's high.
Real-Time Alerts and Visual Cues:
Green triangles below candles indicate buy opportunities.
Red triangles above candles indicate sell opportunities.
Built-in alert conditions notify you of signals in real-time, so you never miss a trading opportunity.
Why Use Enigma Unlocked 2.0?
Precision: Advanced candlestick logic ensures that signals are generated only under optimal conditions.
Session-Based Filtering: Signals occur exclusively during the most active market sessions (kill zones), improving trade quality.
Visualization: Simple yet effective tools like Gann Box integration and clear visual signals make this indicator easy to use and highly effective.
Real-Time Alerts: Stay informed of potential trades even when you're away from your screen.
Enigma Unlocked 2.0 empowers traders to harness the power of candlestick analysis and session-based strategies for disciplined and effective trading. Pair this with a solid understanding of risk management and kill zones to achieve consistent results in your trading journey.

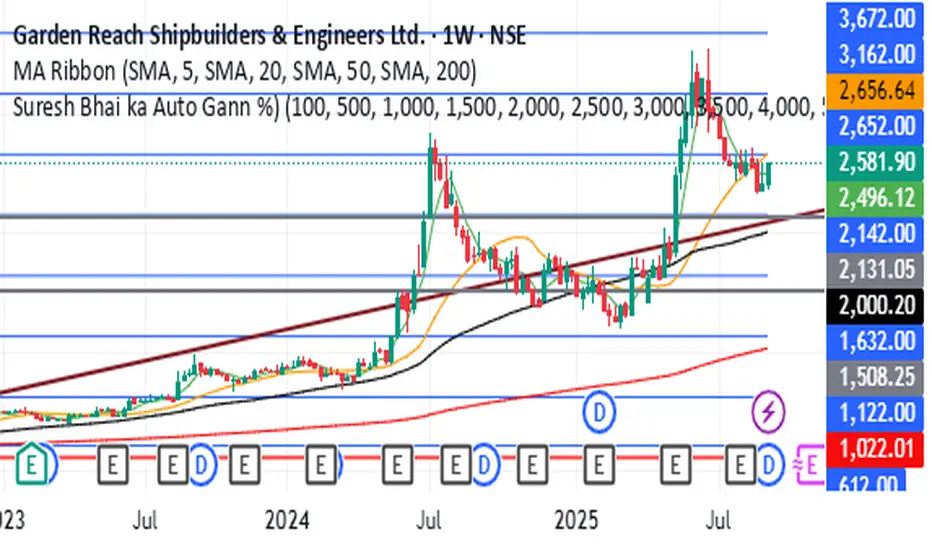
Dynamic Horizontal Lines
Gann levels (squares of 9) have multiple levels. Adding lines at all these levels would add too much noise on the chart.
This indicator adds horizontal lines as per the Gann levels (Squares of 9) closest to the days close.
The current indicator add horizontal lines at the Gann level closest to the days close. It also adds 4 lines above & below the closest Gann level
I have considered Gann levels from 1 to 10000. You can append the Gann levels based on your requirements.

Fibonacci Archer Box [ChartPrime]Fibonacci Archer Box (ChartPrime) is a full featured Fibonacci box indicator that automatically plots based on pivot points. This indicator plots retracement levels, time lines, fan lines, and angles. Each one of these features are fully customizable with the ability to disable individual features. A unique aspect to this implementation is the ability to set targets based on retracement levels and time zones. This is set to 0.618 by default but you can pick any Fibonacci zone you like. Also included are markings that show you when Fibonacci levels are met or exceeded. These moments are plotted on the chart as colored dots that can be enabled or disabled. Along with these markings are crosses that can be shown when targets are hit. Both of these markings are colored with the related Fibonacci level colors.
When there is a zig-zag, this indicator will test to see if the zig-zag meets the criteria set up by the user before plotting a new Fibonacci box. You can pick from either higher highs or lower highs for bearish patterns, and higher lows or lower lows for bullish patterns. Both patterns can be set to use both when finding new boxes if you want to make it more sensitive. You also have the option to filter based on minimum and maximum size. If the box isn't within the selected size range, it will simply be ignored. The pivot levels can be configured to use either candle wicks or candle bodies. By default this is configured to use candle wick with a lookforward of 5 and lookback of 10.
We have included alerts for Fibonacci level crosses, Fibonacci time crosses, and target hits. All alerts are found in the add alert section built into tradingview to make alert creation as easy as possible. Each alert is labeled with their correct names to make navigation simple.
W.D. Gann, a renowned figure in the world of trading and market analysis, is often questioned for his use of Fibonacci levels in his strategies. However, evidence points to the fact that Gann did not directly employ Fibonacci price levels in his work. Instead, Gann had his unique approach, dividing price ranges into thirds, eighths, and other fractions, which, although somewhat aligning with Fibonacci levels, are not exact matches. It is clear that Gann was familiar with Fibonacci and the golden ratio, as references to them appear in his recommended reading list and some of his writings. Despite this awareness, Gann chose not to incorporate Fibonacci levels explicitly in his methodologies, preferring instead to use his divisions of price and time. Notably, Gann's emphasis on the 50% level—a marker not associated with Fibonacci numbers—further illustrates his departure from Fibonacci usage. This level, despite its popularity among some Fibonacci enthusiasts, does not stem from Fibonacci's sequence. This is why we opted to call this indicator Fibonacci Archer Box instead of a Gann Box as we didn't feel like it was appropriate.
In summary, the Fibonacci Archer Box (ChartPrime) is a tool that incorporates Fibonacci retracements and projections with an automated pivot point-based plotting system. It allows for customization across various features including retracement levels, timelines, fan lines, and angles, and integrates visual cues for level crosses and target hits. While it acknowledges the methodologies of W.D. Gann, it distinctively utilizes Fibonacci techniques, providing a straightforward tool for market analysis. We hope you enjoy using this indicator as much as we enjoyed making it!
Enjoy

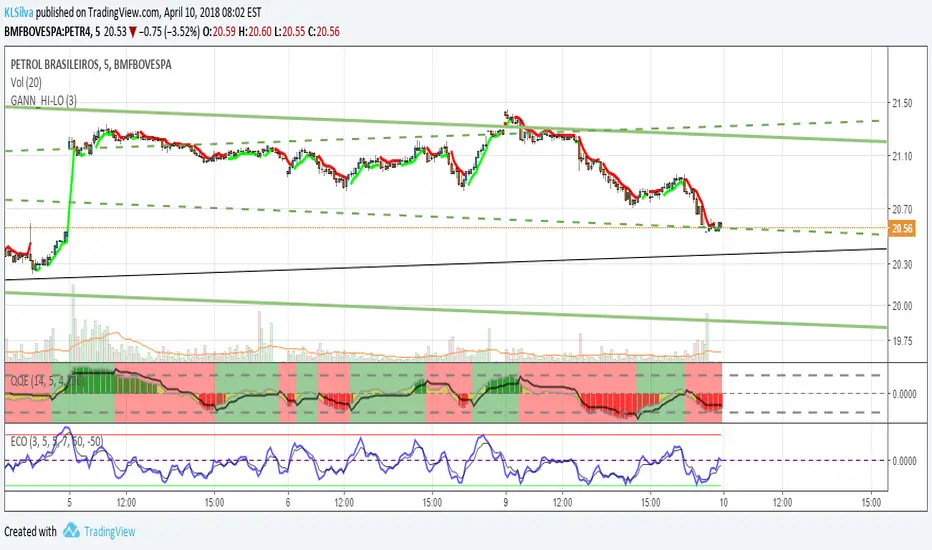
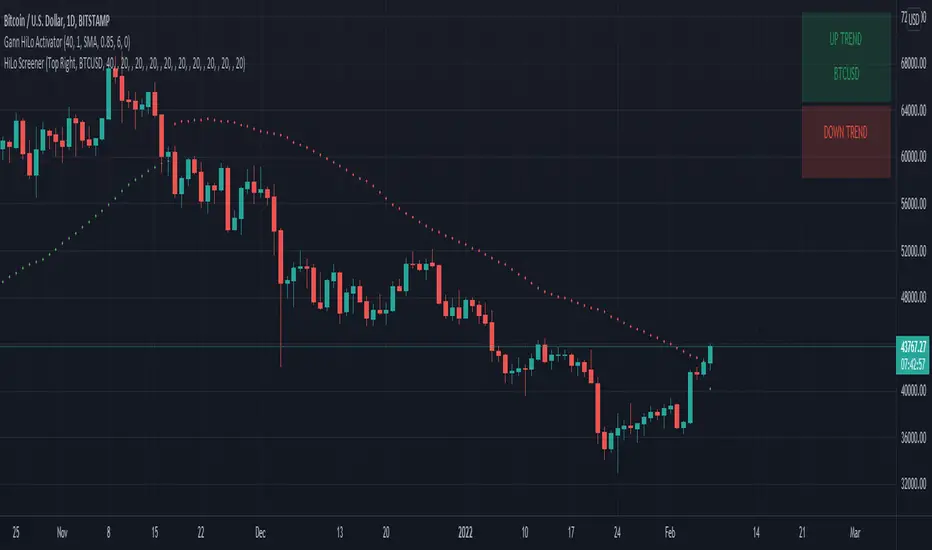
HiLo Screener█ OVERVIEW
This is a screener script for the Gann Hilo Indicator . It's an excellent trend analysis indicator to spot trend reversals.
█ DESCRIPTION
The screener works by scanning through up to 10 symbols and list down symbols that are currently breaking the high or low mean averages as definied by the Gann Hilo Indicator. Once you add it, 2 panels will be added to your chart - the green panel will list the symbols reversing into a bullish trend and the red panel will show the symbols reversing into a bearish trend.
█ HOW TO USE
After adding the indicator, open the script settings and type the symbol name and length to be used on the Gann Hilo Indicator for each stock.
█ FEATURES
The screener can scan up to 10 symbols each time.
█ LIMITATIONS
The screener will scan the symbols reversing trend on the current bar, and as such, there maybe some delays depending on the stock/etf/crypto you choose. Some exchanges require an additional subscription to get realtime data.
CirclesCircles - Support & Resistance Levels
Overview
This indicator plots horizontal support and resistance levels based on W.D. Gann's mathematical approach of dividing 360 degrees by 2 and by 3. These divisions create natural price magnetism points that have historically acted as significant support and resistance levels across all markets and timeframes.
How It Works
360÷2 Levels (Blue): 5.63, 11.25, 33.75, 56.25, 78.75, etc.
360÷3 Levels (Red): 7.5, 15, 30, 37.5, 52.5, 60, 75, etc.
Both Levels (Yellow): 22.5, 45, 67.5, 90, 112.5, 135, 157.5, 180 - These are "doubly strong" as they appear in both calculations
Key Features
Auto-Scaling: Automatically adjusts for any price range (from $0.001 altcoins to $100K+ Bitcoin)
Manual Scaling: Choose from 0.001x to 1000x multipliers or set custom values
Full Customization: Colors, line widths, styles (solid/dashed/dotted)
Historical View: Option to show all levels regardless of current price
Clean Display: Adjustable label positioning and line extensions
Use Cases
Identify potential reversal zones before price reaches them
Set profit targets and stop losses at key mathematical levels
Confirm breakouts when price decisively moves through major levels
Works on all timeframes and all markets (stocks, crypto, forex, commodities)
Gann Theory
W.D. Gann believed that markets move in mathematical harmony based on geometric angles and time cycles. These 360-degree divisions represent natural balance points where price often finds support or resistance, making them valuable for both short-term trading and long-term analysis.
Perfect for traders who use:
Support/Resistance trading
Fibonacci levels
Pivot points
Mathematical/geometric analysis
Multi-timeframe analysis

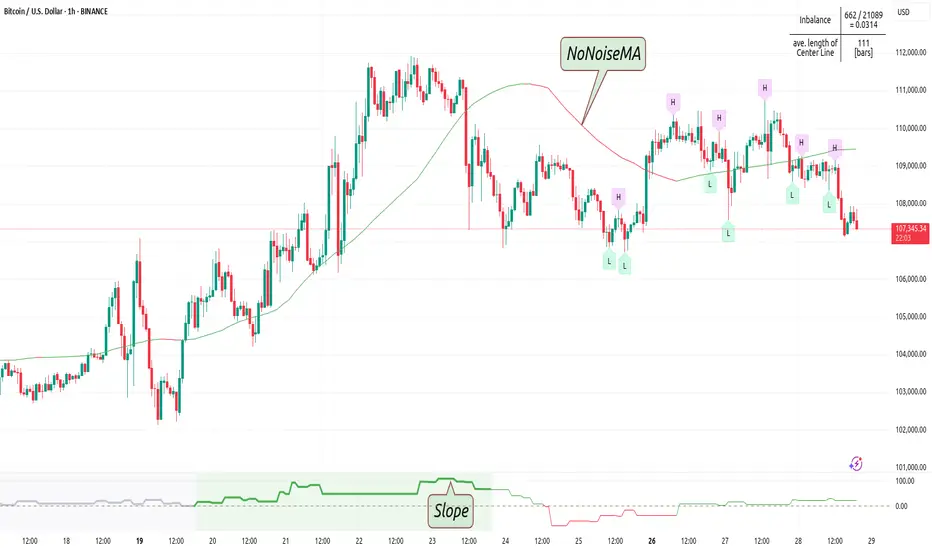
NoNoiseMA & SlopeHappy trade,
This is a noise-reduced moving average — let's call it the No-Noise MA. A MA where false breakout price action should have little to no impact, while the main trend remains fully represented. In comparison to previous MAs this one's trend appear more linear, and sideways price actions becomes easier to detect thanks to it's unique two filter stages.
In short, the No-Noise-MA (Noise-Reduced Moving Average) is calculated as the cumulative sum of the slopes derived from the center line of the last x pivot points. Let’s break it down step by step:
Pivot Detection:
A pivot algorithm (an adapted variant of the Bilson-Gann-Count method) identifies consecutive pivot points (high, low, high, low, etc.) in the close price series. Let's call this set of Pivots S.
Center Line Calculation:
Out of the set S the last x pivots are used to compute a center line (linear regression line). Always when a new pivot is confirmed, the oldest pivot in the queue is removed, and the new pivot is added.
Slope Extraction:
The center line is defined by its equation shown in the image below
Image 1
Cumulative Slope Sum:
As shown in the image 1 the slope is a series with values around zero. The No-Noise-MA is then just the cumulative sum of the slope series and a correction term. A correction term is needed otherwise the No-Noise-MA would run away over time from the original close price. The correction term is just the deviation between close price and cumulative slope sum multiply with a factor around 0.01 added to the No-Noise-MA.
Noise Reduction:
The goal of noise reduction is done by two filter stages. First Filter is the reduction of the input values. As shown above not all bars close prices are use, instead it uses just the pivot points delivered by the Bilson-Gann-Count method. Favorable the Bilson-Gann-Count method delivers the Pivot points in most cases much faster as other Pivot methods. Already after two bars a new Pivot is confirmed. This takes out all ups and downs between two consecutive Pivots. This first filter stage is legit because all price action in between is hedged by the Pivots.
The second filter stage is the done by the length of the center line. As more pivots are used to calculate the center line as smoother the slope becomes. Out liners just gets less impact if the base is bigger. So the number of involved Pivots has the same meaning as the lengths in any other MA.
Comparison with usual MAs:
For a comparison with other MAs this script also calculate the average lengths of the center line, shown in the upper right chart. So choose for example SMA and set the length parameter to the average length of the center line. As shown in the following image 2.
Image 2
This way both MAs have the same data base and can be objectively compared.
Trend detection:
The slope of the center line can be used for trend confirmation. A slope bigger then zero is an up trend while a slope smaller then zero is a down trend. And side way price action is indicated when the slope is around zero within a certain threshold.
Image 3
One hint should be mentioned here. The side way section gets indicated much later. About the number of bars as the center line is long. Before that there are just up or down trend predicted. In the image 2 you see the slope is firstly tin and as more bars past by the slope becomes more thick. This should indicate the point where no side way predictions will happens anymore.
Variation of calculation
In the settings menu you can find the setting "Include last close to center line". With this activated the center line is calculated with the last pivots and the last close price. The last close price is assumed as a pivot too. This gives the slope a more early reaction to volatile price action. But also brings back some noise.
TGS By ShadTGS Levels — Tesla–W.D. Gann Strategy
TGS Levels is a price-geometry indicator designed to map algorithmic decision zones on the chart using principles inspired by W.D. Gann price geometry and Tesla 3-6-9 harmonic structure.
This indicator is not a signal generator.
It provides a structured price map to help traders understand where reactions or breakouts are statistically more likely to occur.
🔹 Core Concept
Markets do not move randomly.
They rotate and expand around harmonic price cycles.
TGS Levels automatically plots a 100-unit price cycle framework (ideal for XAUUSD / Gold) and divides each cycle into hierarchical angles used by institutional and algorithmic trading models.
🔹 Level Hierarchy (Very Important)
TGS uses four types of levels, each with a different purpose:
🔴 SUPER ANGLE (+45)
Primary decision level
Price often shows strong rejection or explosive breakout
Highest importance level
🟥 MAIN ANGLES (+27, +63, +81)
High-probability reaction zones
Used for structured pullbacks, rejections, or continuation confirmation
🟠 SECONDARY ANGLES (+18, +36, +54, +72, +90)
Context & management levels
Expect hesitation, partial profit zones, or stop-tightening areas
Not recommended for direct entries
🟡 MICRO LEVELS (+3, +6, +9)
Liquidity & compression map
Help visualize absorption, stop hunts, and consolidation
For structure awareness only
🔹 What This Indicator Is Used For
✔ Identifying where price is likely to react
✔ Understanding market structure and rotation
✔ Distinguishing rejection vs breakout zones
✔ Improving trade timing when combined with:
Volatility (ATR)
Market structure (HL / LH / BOS)
Session timing (London / New York)
🔹 What This Indicator Is NOT
❌ Not a buy/sell signal
❌ Not a prediction tool
❌ Not based on indicators like RSI or MACD
TGS Levels is a price-first framework, designed to be used with price action, volatility, and structure.
🔹 Best Use Case
Asset: XAUUSD (Gold)
Execution Timeframe: M5
Sessions: London & New York
Style: Scalping / Intraday structure trading
The same logic can be adapted to other instruments by adjusting the cycle size.
🔹 How to Trade With TGS (High-Level)
When volatility is low or falling → expect rejections at main/super angles
When volatility is expanding → expect breakouts through angles
Use oscillators (like Stochastic) only for timing, not direction
Always confirm with price behavior at the level
🔹 Final Note
TGS Levels provides a clean, non-repainting price map that stays aligned when zooming or scrolling the chart.
All levels are calculated automatically and update dynamically with price.
Levels explain behavior — reactions create opportunity.
