WLI Swing High/Low advnc indicatorfor Class members
else
label.set_xy(lowMsg, bar_index, close)
label.set_text(lowMsg, "making New Low")
label.set_color(lowMsg, newSwingLowColor)
label.set_textcolor(lowMsg, color.white)
else
if not na(lowMsg)
label.delete(lowMsg)
lowMsg := na
Search in scripts for "high low"

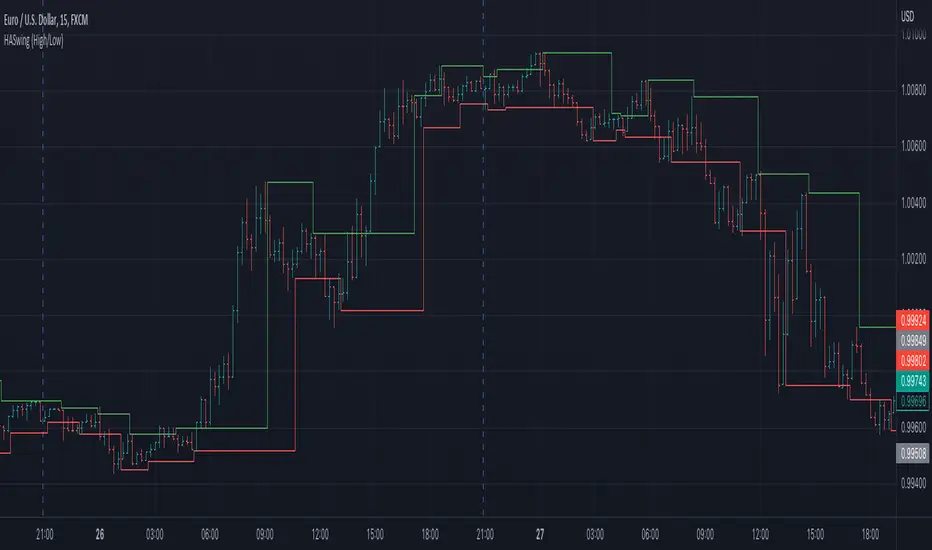
Heiken Ashi Swing High/LowIt uses Heiken Ashi candles to detect recent swing high and low.
It can be used as a stop-loss or support/resistance indicator.
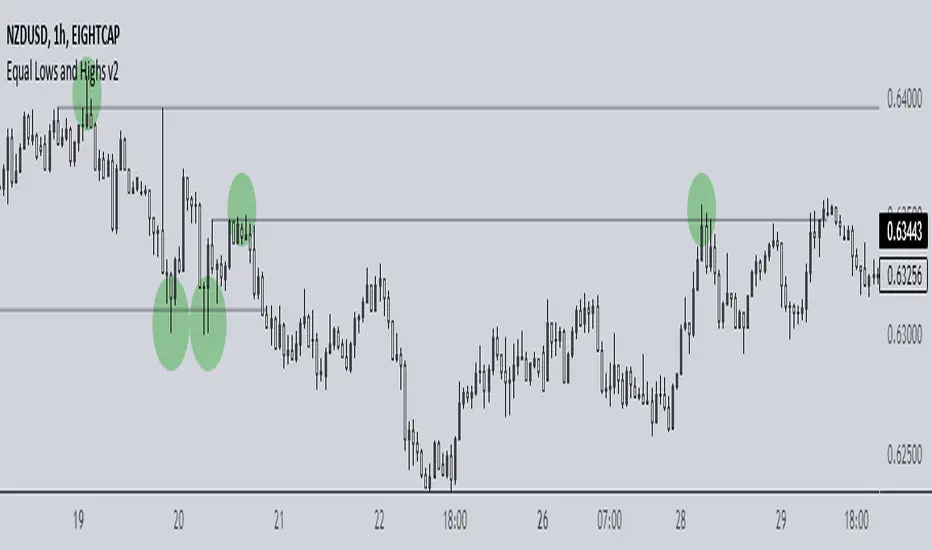
Equal Highs/LowsThis indicator checks for equal highs/lows using the previous three pivots at any given time. This is helpful for identifying where liquidity lies and where a likely sweep/SFP may occur.
You can choose the bar size for the pivots to check for in order to detect desirable levels as well as adjust the acceptable deviation for near-equal highs/lows.
By default, the settings are ideal for BTC in the 5-15m charts. Deviation would need to be set in the decimals for lower-priced symbols and experimentation is recommended.
Cyclic RSI High Low With Noise Filter█ OVERVIEW
This indicator displays Cyclic Relative Strength Index based on Decoding the Hidden Market Rhythm, Part 1 written by Lars von Thienen.
To determine true or false for Overbought / Oversold are unnecessary, therefore these should be either strong or weak.
Noise for weak Overbought / Oversold can be filtered, especially for smaller timeframe.
█ FEATURES
Display calculated Cyclic Relative Strength Index.
Zigzag high low based on Cyclic Relative Strength Index.
Able to filter noise for high low.
█ LEGENDS
◍ Weak Overbought / Oversold
OB ▼ = Strong Overbought
OS ▲ = Strong Oversold
█ USAGE / TIPS
Recommend to be used for Harmonic Patterns such as XABCD and ABCD.
Condition 1 (XABCD) : When ▼ and ▲ exist side by side, usually this outline XA, while the next two ◍ can be BC.
Condition 2 (ABCD) : When ▼ and ▲ exist side by side, usually this outline AB, while the next one ◍ can be BC, strong ABCD.
Condition 3 (ABCD) : When ▼ or ▲ exist at Point A, the next two ◍ can be Point B and Point C, medium ABCD.
Condition 4 (ABCD) : When ◍ exist at Point a, the next two ◍ can be Point b and Point c, weak ABCD usually used as lower case as abcd.
█ CREDITS
LoneSomeTheBlue
WhenToTrade

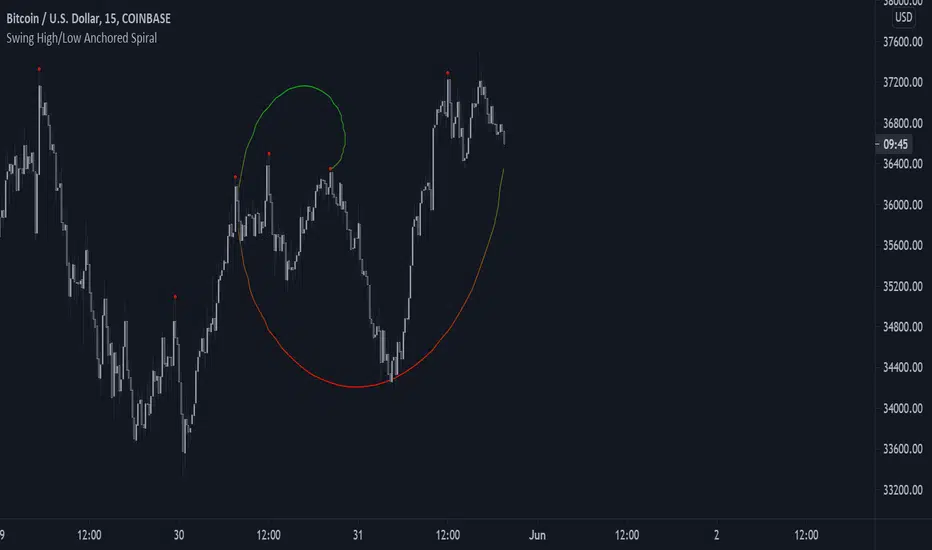
Swing High/Low Anchored SpiralFit the estimate of an Archimedean spiral to the price, with a central point determined by swing high/lows.
Users can determine which historical swing high/low to use as the spiral central point and can choose the number of turns it should make.
You can create cool shapes, cool enough to satisfy your apophenia needs.
If you are having issues just hide and unhide the script, or just lower the length/occurrence setting.
Posting is impossible without the support of my Patreons as well as @LuxAlgo, my scripts are dedicated to them.
Previous High/Low MTFIndicator to plot higher time frame previous candle highs and lows.
One of the key factor in understanding the trend is to look at higher time-frames chart.
Parameters are explained below:
resolution : Chose resolution of higher timeframe. If set to same as symbol, it will consider next parameter HTFMultiplier for calculation of higher timeframe
HTFMultiplier : Multiply symbol timeframe to by HTFMultiplier to derive higher time-frame
Offset : Number of higher timeframe candles before to be plotted. 1 means - it will show highs/lows of previous higher timeframe candle.
HiLoMAHiLoMA (High/Low Moving Average) was designed specifically for calculating moving average boundries similar to Bollinger Bands, but is derived from the highest and lowest prices of an asset, not just the closing price. The timeframe is configurable and the study displays arrows where buys (below) and sells (above) should take place.
On exchanges with low or discounted fees, the study does excessively well at scalping. Backtesting, in general, shows this study to be very robust in any market conditions.
The alert conditions are clearly identified as BUY ASSET and SELL ASSET for automated trading.
Buys only occur when the entire spread is below the momentum line.
Sells only take place when the entire spread is above the momentum line.
When the momentum line cuts through the spread, any potentional buys/sells are ignored as these are considered weak.
Be sure your calculate your momentum on the basis of your candlestick timeframe. If you are using 3 minutes candlesticks and you want a 24 hour momentum, you need to set your momentum to 480. This holds true for all timeframes.
Sep 24
Release Notes: Seperated buys/sells where spread crosses momentum.
Cyan (lighter blue) arrows are buy/sell signals that disregard momentum.
Buys/Sells that honour momentum are now labeled MOMBUY ASSET and MOMSELL ASSET.
Buys/Sells that disregard momentum are now BUY ASSET and SELL ASSET accordingly.
Oct 4
Release Notes: Momentum is now a band with an upper and lower boundry. Buys and sells must now be completely above the band or below the band respectively. The effect is to produce stronger signals for momentum precomditional trades.

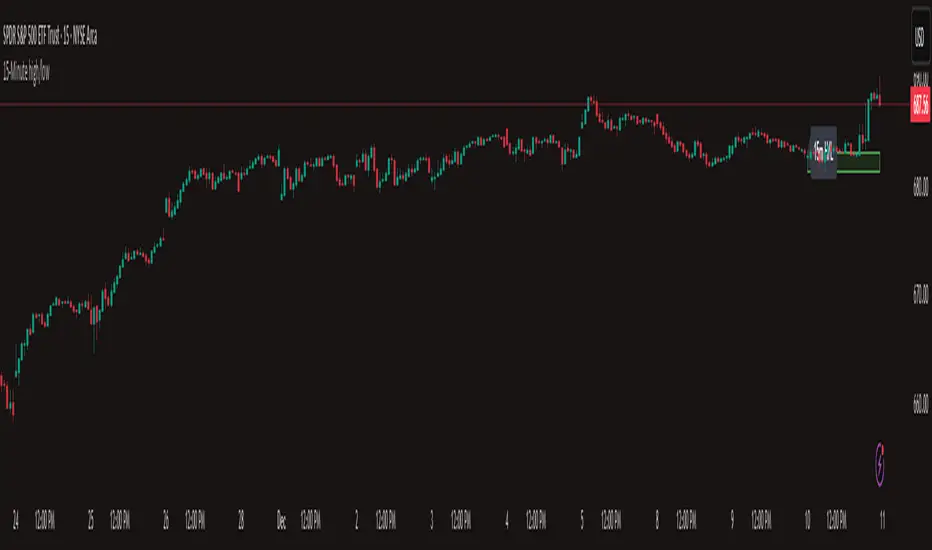
15-Minute high/lowThe 15-minute candle high/low indicator can be applied to any market during the first 15 minutes of trading.
Pivot Points High Low (With confirm bar)This script simply adds a visual circle confirmation to visualise the bar when the pivot has been confirmed. It's based on Pivot Points High Low scripts


Previous Day Close & High/Low RaysAutomatically draws rays at the close and high/low before each session ends.
Colors the rays green for bullish days and red for bearish days
Shows the last 3 sessions (customizable)
Gives you full control over colors, line thickness, and style through the GUI

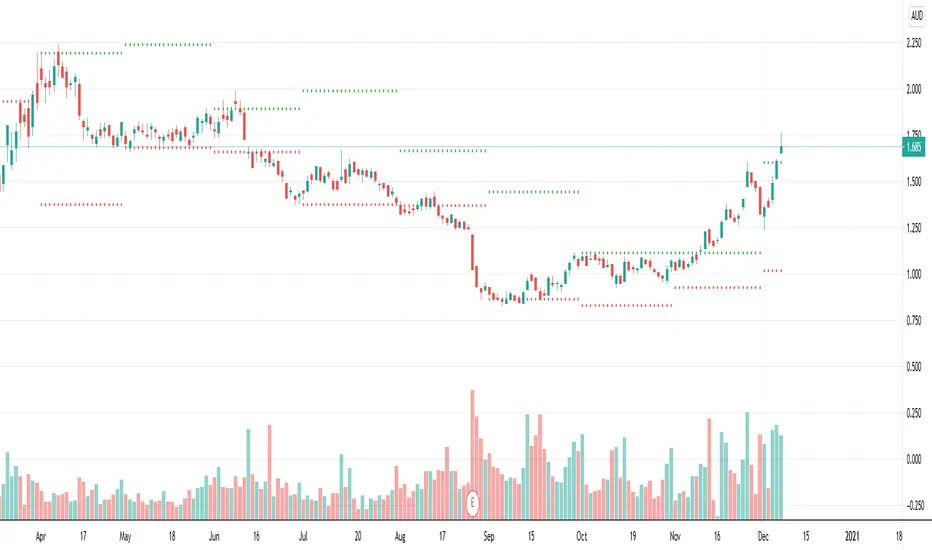
52 Week High/Low with Custom Levels by VivekBajajStockEdge 52Week high/Low Zone which identtifies stocks that are showing strength and weakness.

Swing High Low ZigZag v3.0 BajaSwing High/Low Pivot - Designed to help easily spot peaks and bottoms for quicker drawing of trendlines and other drawings as well as alerts without needing to zoom in a whole lot.

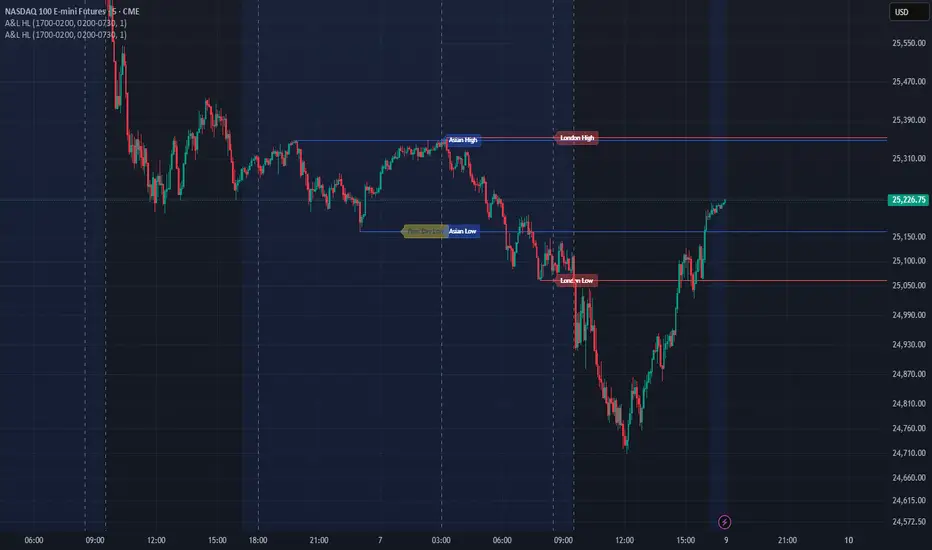
Asian & London Session Highs/LowsThis will help you spot session highs/lows to help you get draws on liq
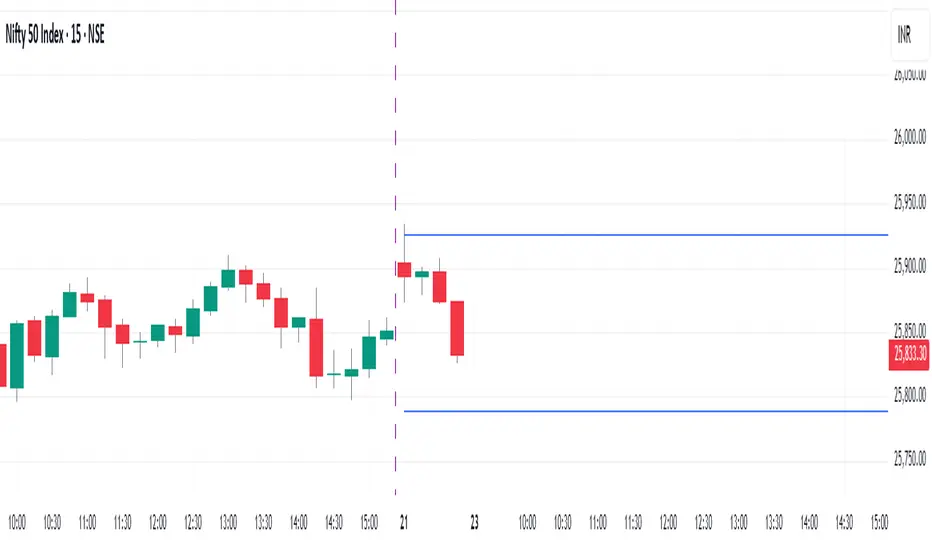
Previous day high lowThis script Identifies and draw Previous day High low on 15 min Intra day chart
Vortag High/LowThe script displays the previous day's high/low during trading hours from 9:30 to 16:00 EST. This gives us a clean chart.

Customisable Asia & London Session High/Low (UTC+1)london + asia high / low
can customise however you like. its not perfect but saves time
Multiple Session Pre-market High/LowThis indicator marks each day’s pre-market range and projects it into the opening move so you can see how price reacts after the bell. It tracks the **pre-market high/low** within a user-defined window (default **04:00–09:29 ET**) and, at **09:30 ET**, draws two solid horizontal lines from **09:30 to 11:00 ET** at those levels. For additional context, you can optionally show matching **dotted lines** across the pre-market window itself. Everything is anchored to **America/New\_York** time (DST-safe), and colors/widths for both the RTH and pre-market lines are fully customizable.
It’s built for **back testing and review**: levels are finalized at 09:30 and **do not repaint**, so what you see historically is what you would have had live. Use it to study opening drive behavior, VWAP/OR confluence, gap fills, and rejection/acceptance around the pre-market extremes. Works on any intraday timeframe; for stocks, enable **Extended Hours** so the 04:00–09:29 bars are available (futures usually include them by default). Adjust the pre-market start/end inputs to match your playbook (e.g., 07:00–09:29) and evaluate your strategies consistently across months of data.

xmtr's session highs/lowsMarks Asia & London session highs/lows with precision + PDH/PDL for daily context. Fully customizable & perfect for all traders.

Spartan trading swing high low with htf openspartan trading swing high low with htf open and htf market structure


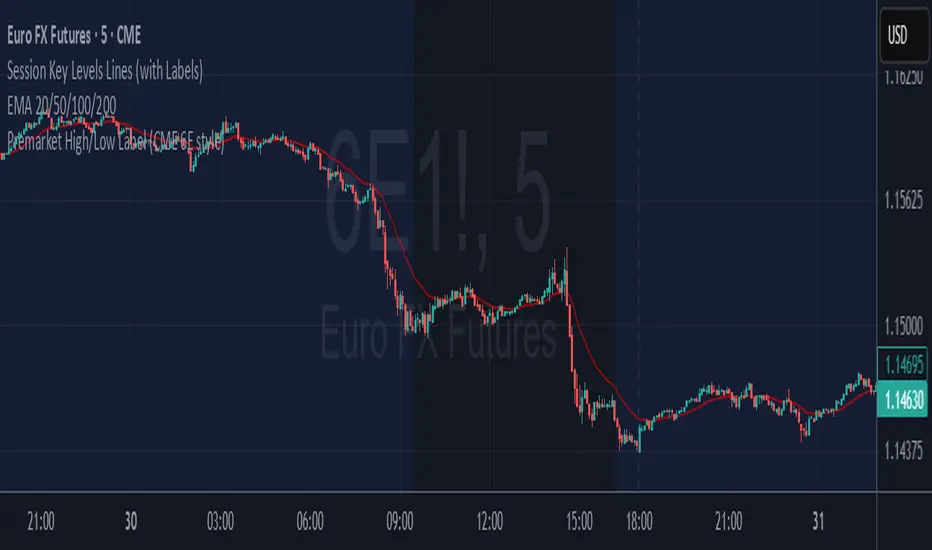
6E update Premarket High/Low Label (CME 6E style)6E update Premarket High/Low Label (CME 6E style). hope it helps :)