DIOSC indicatorThe Diosc indicator based on DMI is the combined version of -DI and +DI. While +DI is above (the trend is up), +DI is used and in the other case -DI is used. In addition, 9-day EMA was added to the graph so that sell/buy points could be seen on the histogram. Both sell/buy points and divergence/convergence can be followed on the graph.
Temeli DMI üzerine kurulmuş Diosc göstergesi -DI ve +DI'ın birleştirilmiş halidir. Temel mantığı +DI yukarıda iken yani trend yukarı iken +DI, diğer durumda da -DI göz önüne alınarak grafik oluşturulmuştur. Ek olarak Al-Sat noktalarının histogram üzerinde görülebilmesi için de grafiğe 9 günlük EMA eklenmiştir. Grafik üzerinde hem Al-Sat noktaları takip edilebilir hem de uyuşmazlıklar takip edilebilir.
Search in scripts for "histogram"

My WaveThis is my implementation in TradingView of my modified version of the "Weis Wave".
Given the limitations of TradingView in alter past variable values, whenever the close change direction and the wave don't I sum the volume to the present wave and also to a possible future wave.
This results in columns of a mixed color within the columns of the histogram. By changing the percentage input you can and must keep this extra columns to a minimum.
You must insert two copies of the indicator on your chart and "unmerge down" one of them. On the overlayed you must * format and edit and unmark Histup and Histdown, on the unmerged down you must * format and edit and unmark BetaZigZag and stableZigZag.
You can also unmark Bar Color on both if you don't want to colour the bars according to the waves.
Trend: If the buying waves are longer than the selling waves the immediate trend is up, and vice versa.
Look out for a change in trend if in an uptrend the selling waves begin to increase in time and distance or the buying waves shorten, and vice versa.
From the volume histogram you can get the force of the buying and selling waves.
From the price waves you get the result of that force. You can also spot the "shortening of the thrust" up or down.
Comparing the two you can spot "effort without result" "ease of movement".
References: "Trades About To Happen" David H. Weis, Division 2 of the Richard D. Wyckoff Method of Trading in Stocks.
Volumes on CandleThis script uses standard deviation of volume from the mean to color the candles.
IMPORTANT: Hide original candle, clicking in the "eye" near title.
I prefer use large Length input for more stability at mean and standard deviation values.
Uses 5 colors, by default:
Red = Volume >= 4 stdev;
Orange = 4 stdev > Volume >= 2.5 stdev;
Yellow = 2.5 stdev > Volume >= 1 stdev;
White = 1 stdev > Volume >= -0.5 stdev;
Aqua = -0.5 stdev > Volume.
I coded another script, called "Colored Volumes Histogram". It uses the same idea, but color directly the volume histogram.


Oscillator Moving Average (OsMA)This code for Oscillator of Moving Averages (OsMA) is based on MACD 4C indicator code published by vkno422 . Many thanks to vkno422. I have borrowed the concept of 4 colours which I find very useful.
For those who are not familiar with OsMA, it is histogram of difference between MACD (oscillator) and its MA (signal line). The zero line cross over of this indicator is used in many strategies.
This version includes MACD & its signal line together with OsMA histogram. I have programmed flexibility for switching OFF/ON individual indicator components as well as changing the periods for various moving averages.
I am dedicating this indicator to the TV trading community hoping that people will find it useful.

Indicator: Elder Impulse SystemAccording to Elder, "The Impulse System encourages you to enter a trade cautiously but exit fast, by identifying inflection points where a trend speeds up or slows down. This is the professional approach to trading, the total opposite of the amateur's style. Beginners jump into trades without thinking too much and take forever to get out, hoping and waiting for the market to turn their way."
The Impulse System is based on two indicators, a 13-day exponential moving average and the MACD-Histogram. The moving average identifies the trend, while the MACD-Histogram measures momentum. As a result, the Impulse System combines trend following and momentum to identify impulses that can be traded.
By default it uses your chart's time frame, but you can set it to any custom time frame via options page. Optionally, price bars can be color coded too.
More info:
stockcharts.com
Steps to import / use custom indicators from this chart:
PDF: drive.google.com

Indicator: Rahul Mohindar Oscillator (RMO)This indicator is a gauge to market direction. It is displayed as a histogram. As a bullish “buy” sign, we will look for the point at which the histogram shows movement crossing the oscillator’s zero line going upwards. If it should go down and cross the line going down, that would be our “sell” sign, or a “short-sell” sign.
I personally use this only for confirmation.

[blackcat] L3 Volume Sync TradeOVERVIEW
The L3 Volume Sync Trade indicator empowers traders 📈💹 with advanced tools to pinpoint precise entry and exit points leveraging intricate volume and price momentum analyses. By encapsulating sophisticated technical calculations into an intuitive visual format, this script aids in identifying high-probability trades while minimizing guesswork. Whether you're a seasoned trader looking to enhance your strategy or a newcomer seeking structured guidance, this indicator offers invaluable insights tailored to elevate your trading precision.
FEATURES
Advanced Volume Analysis 📊✨: Employs comprehensive volume dynamics to spot underlying market trends and resonance levels, allowing you to align your trades with significant movements.
Dynamic Price Momentum Metrics ⚡️: Computes both immediate and sustained price strengths, providing a holistic view of market directionality.
Customizable Indicators 🎯: Adjustable periods across multiple moving averages ensure flexibility in adapting the script to diverse trading styles and timeframes.
Intuitive Visual Representation 🖼️: Displays critical information via colorful histograms and candlestick patterns, facilitating quick comprehension even amidst fast-paced markets.
Automated Buy/Sell Labels 🔍: Clearly marks chart locations where buy/sell actions are recommended, reducing the need for constant manual monitoring.
Real-Time Alert Capabilities 🔔: Stay ahead with customizable alerts that notify you instantly whenever favorable trading conditions arise.
HOW TO USE
Initial Setup:
Begin by adding the L3 Volume Sync Trade indicator to your TradingView chart.
Familiarize yourself with the default settings provided within the script’s input parameters.
Configuring Input Parameters:
Short Period: Adjust if focusing on shorter-term fluctuations; defaults at 5 bars.
Long Period: Ideal for capturing broader trends over extended intervals; set initially at 27 bars.
EMA and SMA Periods: Tweak these for fine-tuning the sensitivity of trend-following mechanisms; default values are 3 and 3 respectively.
Long/EMA Periods: These influence smoothing effects; start with 360 and 21 respectively but experiment based on volatility.
Capital Threshold: Defines minimal risk level per trade; default set at 1 unit but can be increased/decreased based on your risk appetite.
Understanding Chart Elements:
Histograms & Candles: Blue/green histograms represent positive-negative resonances, red/green bands signify crossover events, aqua candles denote resonance points, orange highlights trade signals.
Labels: Green “BUY” tags appear above bars indicating bullish conditions; red “SELL” tags below bars suggest bearish reversals.
Activating Alarms:
Go to the alert settings in TradingView.
Enable conditional alerts for buy/sell signals ensuring timely responses without missing crucial moves.
Monitoring Performance:
Keep track of how often alerts trigger versus actual winning trades.
Periodically revisit input adjustments to optimize responsiveness under varying market phases.
ADVANCED USAGE TIPS
Backtesting Your Strategy: Before going live, apply historical data tests to gauge reliability.
Combining With Other Tools: Enhance accuracy by integrating additional indicators like RSI or MACD alongside Volume Sync.
Risk Management Integration: Use stop-loss/take-profit markers derived from script outputs to safeguard capital efficiently.
LIMITATIONS
Market Conditions Variability: Different assets or volatile environments might yield inconsistent outcomes.
Dependent On User Expertise: Best utilized by those familiar with technical analysis fundamentals.
Limited Flexibility In Real-time Adjustments: Once applied, real-time tweaking requires reloading script which might delay responses during rapid market shifts.
NOTES
Parameter Sensitivity: Minor changes can lead to drastic differences; always test modifications cautiously.
Regular Reviews: Continuously assess indicator efficacy against evolving market behaviors.
Complementary Techniques: Supplement this script with fundamental analysis or news-driven insights for well-rounded decisions.
THANKS
A heartfelt acknowledgment goes to our community of developers and enthusiasts whose feedback has been instrumental in refining this powerful indicator.

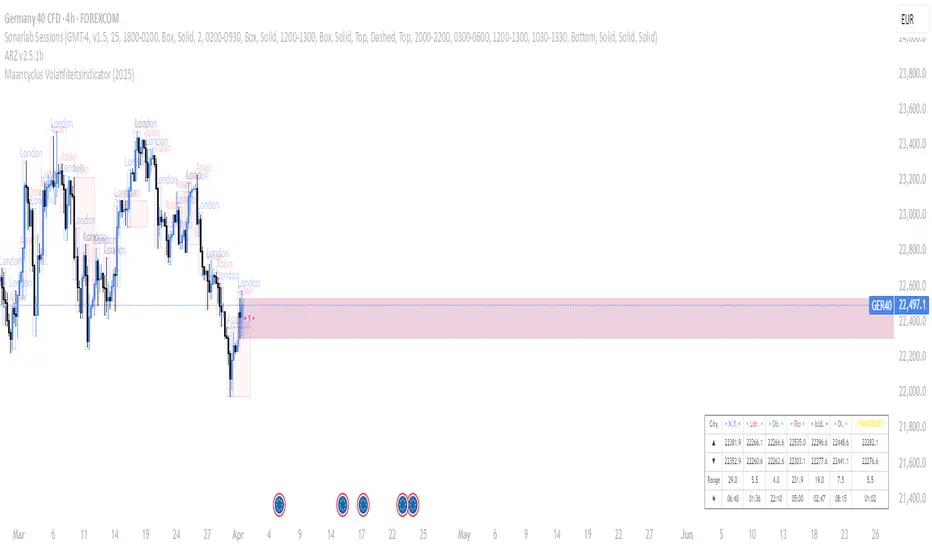
Maancyclus Volatiliteitsindicator (2025)This Moon Cycle Volatility Indicator for TradingView is designed to help traders track and analyze market volatility around specific lunar phases, namely the Full Moon and New Moon. The indicator marks the dates of these moon phases on the chart and measures volatility using the Average True Range (ATR) indicator, which gauges market price fluctuations.
Key Features:
Moon Phase Markers: The indicator marks the Full Moon and New Moon on the chart using labels. Blue labels are placed below bars for Full Moons, while red labels are placed above bars for New Moons. These markers are based on a manually curated list of moon phase dates for the year 2025.
Volatility Calculation: The indicator calculates market volatility using the ATR (14), which provides a sense of market movement and potential risk. Volatility is plotted as histograms, with blue histograms representing volatility around Full Moons and red histograms around New Moons.
Comparative Analysis: By comparing the volatility around these moon phases to the average volatility, traders can spot potential patterns or heightened market movements. This can inform trading strategies, such as anticipating increased market activity around specific lunar events.
In essence, this tool helps traders identify potential high-volatility periods tied to lunar cycles, which could impact market sentiment and price action.
Akshay - TheOne, TheMostWanted, TheUnbeatable, TheEnd➤ All-in-One Solution (❌ No repaint):
This Technical Chart contains, MA24 Condition, Supertrend Indicator, HalfTrend Signal, Ichimoku Cloud Status, Parabolic SAR (P_SAR), First 5-Minute Candle Analysis (ORB5min), Volume-Weighted Moving Average (VWMA), Price-Volume Trend (PVT), Oscillator Composite, RSI Condition, ADX & Trend Strength.
Technicals don't lie.
🚀 Overview and Key Features
Comprehensive Multi-Indicator Approach:
The script is built to be an all-in-one technical indicator on TradingView. It integrates several well-known indicators and overlays—including Supertrend, HalfTrend, Ichimoku Cloud, various moving averages (EMA, SMA, VWMA), oscillators (Klinger, Price Oscillator, Awesome Oscillator, Chaikin Oscillator, Ultimate Oscillator, SMI Ergodic Oscillator, Chande Momentum Oscillator, Detrended Price Oscillator, Money Flow Index), ADX, and Donchian Channels—to create a composite picture of market sentiment.
Signal Generation and Alerts:
It not only calculates these indicators but also aggregates their output into “Master Candle” signals. Vertical lines are drawn on the chart with corresponding alerts to indicate potential buy or sell opportunities based on robust, combined conditions.
Visual Layering:
Through the use of colored histograms, custom candle plots, trend lines, and background color changes, the script offers a multi-layered visual representation of data, providing clarity about both short-term signals and overall market trends.
⚙️ How It Works and Functionality
MA24 Condition:
Uses the 24-period moving average as a proxy; if the price is above it, the bar is colored green, and red if below, with neutrality when conditions aren’t met.
Supertrend Indicator:
Evaluates price relative to the Supertrend level (calculated via ATR), coloring green when price is above it and red when below.
HalfTrend Signal:
Determines trend shifts by comparing the current close to a calculated trend level; green indicates an upward trend, while red suggests a downtrend.
Ichimoku Cloud Status:
Analyzes the relationship between the Conversion and Base lines; a bullish (green) signal is given when price is above both or the Conversion line is higher than the Base line.
Parabolic SAR (P_SAR):
Colors the signal based on whether the current price is above (green) or below (red) the Parabolic SAR marker, indicating stop and reverse conditions.
First 5-Minute Candle Analysis (ORB5min):
Uses key levels from the first 5-minute candle; if price exceeds the candle’s low, VWAP, and MA, it’s bullish (green), otherwise bearish (red).
Volume-Weighted Moving Average (VWMA):
Compares the current price to volume-weighted averages; a price above these levels is shown in green, below in red.
Price-Volume Trend (PVT):
Determines bullish or bearish momentum by comparing PVT to its VWAP—green when above and red when below.
Oscillator Composite:
Aggregates signals from multiple oscillators; a majority of positive results turn it green, while negative dominance results in red.
RSI Condition:
Uses a simple RSI threshold of 50, with values above signifying bullish (green) momentum and below marking bearish (red) conditions.
ADX & Trend Strength:
Reflects overall trend strength through ADX and directional movements; a combination favoring bullish conditions colors it green, with red signaling bearish pressure.
Master Candle Overall Signal:
Combines multiple indicator outputs into one “Master” signal—green for a consensus bullish trend and red for a bearish outlook.
Scalp Signal Variation:
Focused on short-term price changes, this signal adjusts quickly; green indicates improving short-term conditions, while red signals a downturn.
📊 Visualizations and 🎨 User Experience (❌ no repaint)
Dynamic Histograms & Bar Plots:
Each indicator is represented as a colored bar (with added vertical offsets) to facilitate easy comparison of their respective bullish or bearish contributions.
Clear Color-Coding & Labels:
Green (e.g., GreenFluorescent) indicates bullish sentiment.
Red (e.g., RedFluorescent) indicates bearish sentiment.
Custom labels and descriptive text accompany each bar for clarity.
Interactive Charting:
The overall background color adapts based on the “Master Candle” condition, offering an instant read on market sentiment.
The current candlestick is overlaid with color cues to reinforce the indicator’s signal, enhancing the trading experience.
Real-Time Alerts:
Vertical lines appear on signal events (buy/sell triggers), complemented by alerts that help traders stay on top of actionable market moves.
Sharp lines:
The Sharp lines are plotted based upon the EMA5 cross over with the same market trend, marks this as good time to reentry.
🔧 Settings and Customization
Flexible Timeframe Input:
Users can select their preferred timeframe for analysis, making the indicator adaptable to intraday or longer-term trading styles.
Customizable Indicator Parameters:
➤ Supertrend: Adjust ATR length and multiplier factors.
➤ HalfTrend: Tweak amplitude and channel deviation settings.
➤ Ichimoku Cloud & Oscillators: Fine-tune the conversion/base lines and oscillator lengths to match individual trading strategies.
Visual Customization:
The script’s color schemes and plotting styles can be altered as needed, giving users the freedom to tailor the interface to their taste or existing chart setups.
🌟 Uniqueness of the Concept
Integrated Multi-Indicator Synergy:
Combines a diverse range of trend, momentum, and volume-based indicators into a single cohesive system for a holistic market view.
Master Candle Aggregation:
Consolidates numerous individual signals into a "Master Candle" that filters out noise and provides a clear, consensus-based trading signal.
Layered Visual Feedback:
Uses color-coded histograms, adaptive background cues, and dynamic overlays to deliver a visually intuitive guide to market sentiment at a glance.
Customization and Flexibility:
Offers adjustable parameters for each indicator, allowing users to tailor the system to fit diverse trading styles and market conditions.
✅ Conclusion:
Robust Trading Tool & Non-Repainting Reliability:
This versatile technical analysis tool computes an extensive range of indicators, aggregates them into a stable, non-repainting “Master Candle” signal, and maintains consistent, verifiable outputs on historical data.
Holistic Market Insight & Consistent Signal Generation:
By combining trend detection, momentum oscillators, and volume analysis, the indicator delivers a comprehensive snapshot of market conditions and generates dependable signals across varying timeframes.
User-Centric Design with Rich Visual Feedback:
Customizable settings, clear color-coded outputs, adaptive backgrounds, and real-time alerts work together to provide actionable, transparent feedback—enhancing the overall trading experience.
A Unique All-in-One Solution:
The integrated approach not only simplifies complex market dynamics into an easy-to-read visual guide but also empowers systematic traders with a powerful, adaptable asset for accurate decision-making.
❤️ Credits:
Pine Script™ User Manual
Supertrend
Ichimoku Cloud
Parabolic SAR
Price Volume Trend (PVT)
Average Directional Index (ADX)
Volume Oscillator
HalfTrend
Donchian Trend

[blackcat] L3 Top and Bottom Divine JudgmentOVERVIEW
The "Top and Bottom Divine Judgment" indicator is designed to identify potential tops and bottoms in the market using a combination of EMAs, SMAs, and custom calculations based on high and low prices. It provides multiple lines and plots to help traders visualize different market conditions and potential turning points.
FEATURES
Customizable EMA and SMA periods for various calculations.
Identification of bullish and bearish trends using EMAs.
Detection of overbought and oversold conditions.
Multiple lines and histograms to indicate specific market conditions and potential reversals.
Visual alerts with colored lines and shapes.
HOW TO USE
Add the script to your TradingView chart.
Customize Settings:
Adjust the short_ema_period, long_ema_period, sma_period, high_period, low_period, and other period inputs in the "Inputs" section.
Bullish and Bearish EMAs:
bullish_ema (yellow) and bearish_ema (fuchsia) are plotted to assess the overall market trend.
When bullish_ema is above bearish_ema, it suggests an uptrend.
When bullish_ema is below bearish_ema, it suggests a downtrend.
High-Low Boundary Line:
A horizontal line at 50 (yellow) represents a midpoint in the normalized price range, helping to identify overbought or oversold conditions.
Danger and Caution, Sell Signal, etc.:
These lines indicate specific conditions where the market might be overextended or due for a reversal.
Histograms for CZS1 and CZS4:
These histograms (aqua and purple) represent changes in certain indicators, possibly related to momentum or volatility, helping traders gauge the strength of trends.
Support Line Cross:
A shape ("●") is plotted when the close price crosses above a calculated support line, which could be a buy signal.
Generate Trading Signals:
Bullish and Bearish Trends:
Use the crossover of bullish_ema and bearish_ema to identify potential trend changes.
Overbought/Oversold Conditions:
Use the High-Low Boundary Line to identify overbought or oversold levels.
Specific Market Conditions:
Use the lines for "Danger and Caution," "Sell Signal," "Weak Out Strong Stay," "Opportunity," "Low Suck," and "High Sell" to identify specific market conditions and potential reversals.
Support Line Cross:
Use the plotted shape to identify potential buy signals when the close price crosses above the support line.
Risk Management:
Use the indicator in conjunction with other tools and risk management strategies to confirm trading signals and manage positions effectively.
LIMITATIONS
The script is based on historical data and does not guarantee future performance.
It is recommended to use the script in conjunction with other analysis tools.
The effectiveness of the strategy may vary depending on the market conditions and asset being traded.
NOTES
The script is designed for educational purposes and should not be considered financial advice.
Users are encouraged to backtest the strategy on a demo account before applying it to live trades.
THANKS
Special thanks to the TradingView community for their support and feedback.

Wick Detection (1 and 0) - AYNETDetailed Scientific Explanation
1. Wick Detection Logic
Definition of a Wick:
A wick, also known as a shadow, represents the price action outside the range of a candlestick's body (the region between open and close).
Upper Wick: Occurs when the high value exceeds the greater of open and close.
Lower Wick: Occurs when the low value is lower than the smaller of open and close.
Upper Wick Detection:
pinescript
Kodu kopyala
bool has_upper_wick = high > math.max(open, close)
This checks if the high price of the candle is greater than the maximum of the open and close prices. If true, an upper wick exists.
Lower Wick Detection:
pinescript
Kodu kopyala
bool has_lower_wick = low < math.min(open, close)
This checks if the low price of the candle is less than the minimum of the open and close prices. If true, a lower wick exists.
2. Binary Representation
The presence of a wick is encoded as a binary value for simplicity and computational analysis:
Upper Wick: Represented as 1 if present, otherwise 0.
pinescript
Kodu kopyala
float upper_wick_binary = has_upper_wick ? 1 : 0
Lower Wick: Represented as 1 if present, otherwise 0. This value is inverted (-1) for visualization purposes.
pinescript
Kodu kopyala
float lower_wick_binary = has_lower_wick ? 1 : 0
3. Visualization with Histograms
The plot function is used to create histograms for visualizing the binary wick data:
Upper Wicks: Plotted as positive values with green columns:
pinescript
Kodu kopyala
plot(upper_wick_binary, title="Upper Wick", color=color.new(color.green, 0), style=plot.style_columns, linewidth=2)
Lower Wicks: Plotted as negative values with red columns:
pinescript
Kodu kopyala
plot(lower_wick_binary * -1, title="Lower Wick", color=color.new(color.red, 0), style=plot.style_columns, linewidth=2)
Features and Applications
1. Wick Visualization:
Upper wicks are displayed as positive green columns.
Lower wicks are displayed as negative red columns.
This provides a clear visual representation of wick presence in historical data.
2. Technical Analysis:
Wick formations often indicate market sentiment:
Upper Wicks: Sellers pushed the price lower after buyers drove it higher, signaling rejection at the top.
Lower Wicks: Buyers pushed the price higher after sellers drove it lower, signaling rejection at the bottom.
3. Signal Generation:
Traders can use wick detection to build strategies, such as identifying key price levels or market reversals.
Enhancements and Future Improvements
1. Wick Length Measurement
Instead of binary detection, measure the actual length of the wick:
pinescript
Kodu kopyala
float upper_wick_length = high - math.max(open, close)
float lower_wick_length = math.min(open, close) - low
This approach allows for thresholds to identify significant wicks:
pinescript
Kodu kopyala
bool significant_upper_wick = upper_wick_length > 10 // For wicks longer than 10 units.
bool significant_lower_wick = lower_wick_length > 10
2. Alerts for Long Wicks
Trigger alerts when significant wicks are detected:
pinescript
Kodu kopyala
alertcondition(significant_upper_wick, title="Long Upper Wick", message="A significant upper wick has been detected.")
alertcondition(significant_lower_wick, title="Long Lower Wick", message="A significant lower wick has been detected.")
3. Combined Wick Analysis
Analyze both upper and lower wicks to assess volatility:
pinescript
Kodu kopyala
float total_wick_length = upper_wick_length + lower_wick_length
bool high_volatility = total_wick_length > 20 // Combined wick length exceeds 20 units.
Conclusion
This script provides a compact and computationally efficient way to detect candlestick wicks and represent them as binary data. By visualizing the data with histograms, traders can easily identify wick formations and use them for technical analysis, signal generation, and volatility assessment. The approach can be extended further to measure wick length, detect significant wicks, and integrate these insights into automated trading systems.

Divergence Detector [TradingFinder] RSI + MACD + AO Oscillator 🔵 Introduction
🟣 Understanding Divergence
As mentioned, divergence occurs in technical analysis when a stock's price behaves contrary to indicators on the price chart. Divergence can signify either a reversal of the stock's trend or a continuation of the previous trend correction.
Divergences can act as reversal patterns or continuation patterns. Moreover, divergences can be utilized to identify potential support and resistance levels.
For instance, when an indicator is trending upwards and positive, but the price is declining and trending downwards, divergence occurs. Divergence in a stock indicates trader indecision in buying and selling and warns traders to reconsider their decisions regarding buying or holding the stock.
Divergence aids analysts in identifying critical price points. In indicator divergences, it serves as a potent signal in the realm of technical analysis.
🟣 Types of Divergence
1.Regular Divergence
o Positive Regular Divergence (RD+)
o Negative Regular Divergence (RD-)
2.Hidden Divergence
o Positive Hidden Divergence (HD+)
o Negative Hidden Divergence (HD-)
3.Time Divergence
Key Note : This indicator is specifically designed to identify "Regular Divergence" only. Therefore, the following explanation pertains to this type of divergence.
🔵 Regular Divergence/Convergence
Regular Divergence(Convergence) occurs due to conflicting behavior between the indicator and the price chart, typically at the end of a trend. Recognizing Regular Divergence suggests an anticipation of a trend reversal or a pattern resembling a reversal.
🟣 Positive Regular Divergence (RD+)
In contrast to negative divergence, positive Regular Divergence occurs at the end of a downtrend and between two price lows. It manifests when the price forms a new low on the price chart, but the indicator fails to recognize it.
Positive Regular Divergence indicates strong buying pressure and weak selling pressure. Following the identification of positive divergence on the chart, one can anticipate a price increase for the examined stock.
🟣 Negative Regular Divergence (RD-)
This type of Regular Divergence emerges between two price highs during an uptrend. A new high is formed on the price chart, but the indicator fails to acknowledge it. This scenario indicates negative Regular Divergence.
The likelihood of a subsequent market downturn is high. Negative divergence signifies strong selling pressure and weak buying pressure, suggesting an unfavorable future for the stock.
🔵 How to use
By utilizing the "Fractal Period" input, you can specify your desired periods for identifying divergences.
Additionally, through the "Divergence Detect Method" feature, you can choose which oscillators (MACD, RSI, or AO) to base divergence identification on.
Divergence in MACD Oscillator :
Divergence in the MACD indicator occurs when the price chart and the MACD line form a noticeable opposing pattern, meaning the price moves contrary to the MACD line. In this scenario, one expects a reversal in price direction.
Divergence in RSI Oscillator :
If divergence occurs during a downtrend on the price chart (two consecutive lows, with the second low being lower) and on the corresponding RSI point (two consecutive lows, with the second low being higher), it signifies positive Regular Divergence and implies a buying signal.
Conversely, if divergence occurs during an uptrend on the price chart (two consecutive highs, with the second high being higher) and on the corresponding RSI point (two consecutive highs, with the second high being lower), it indicates negative Regular Divergence, signaling a selling opportunity.
Divergence in AO Oscillator :
The AO indicator calculates histograms similar to the AO base. It calculates the difference between the simple moving averages of 5 and 34 periods based on the median of each bar. Then, it plots the bars based on the difference.
It then compares the histograms to detect peaks and troughs in the AO histograms and compares the identified peaks and troughs to the price. Whenever divergence is detected, it plots lines and arrows.
🔵 Table
The table contains information on the functional features of this oscillator that you can utilize. Four categories of information are presented in the table: "Exist," "Consecutive," "Divergence Quality," and "Change Phase Indicator."
Exist :
If divergence exists, you'll see "+" in this row.
Consecutive :
Divergences may occur consecutively. If same-type divergences form within short intervals, you can observe the count in this row.
Divergence Quality : Based on the number of consecutive divergences, their quality can be evaluated. If one divergence exists, its quality is considered "Normal." If two divergences exist, the quality is "Good," and if three or more divergences exist, the quality is considered "Strong."
Change Phase Indicator : If a phase change occurs between two oscillation peaks formed based on divergence, this change is identified and displayed in this row.

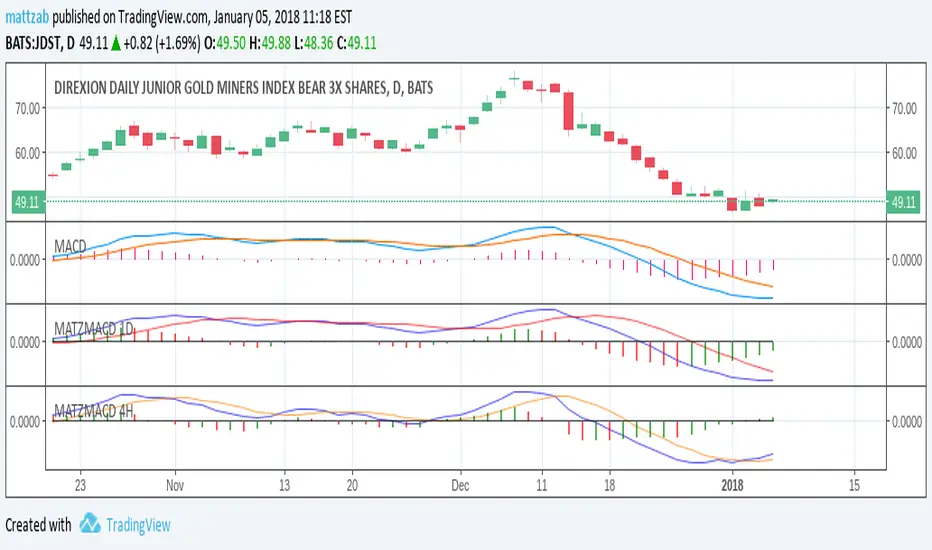
[PUZ] MACD MTB System MTFMACD Moving Average convergence/divergence
Here are a little articel how the MACD is calculated an how you can use it.
en.wikipedia.org
This Indicator have many differet spezifications than a normal MACD.
You can use different timeframes.
The histogramm workes a litle bit smother
The signalline have two different colors:
He is blue when the macd line is greater than the signalline and the signalline is red when the macd line is smaller than the signalline.
The macd line habe three different colores:
Color green when the macd line is greater than the macd line one period back and the macd line is under the signal line.
Color yellow when the macd line is smaller than the macd line one period back and the macd line is greater than the signalline.
Color gray when the conditions fot color yellow an green are not true
Three different types for Signals
The L1 signal show you a triange when the macd ist crossover or crossunder the signal line, you can use the L1 Threshold to filter the signals.
For example the L1 long threshold is equal to 0 than the Indicator show you only L1 long singnals when the crossover from the macd line to the signal line is smaller than 0.
This works like the same for all Signals (L2 signals / L3 signals)
The L2 signals show you a bigger triangle when the color from the macd line is eqal to yellow or green, you can use the L2 Threshold to filter the signals.
The L3 signals show you a green or red diamond when the histogramm is rising or falling, you can use the L3 Threshold to filter the signals.
Multibit Signal Compatible Indicator with DJMAD Multibit System
This Pine Script indicator is designed to function as part of the Multibit Signal System developed by DJMAD. It encompasses a comprehensive implementation of a MACD-based trading strategy with multiple threshold levels, color-coded signals, alert functionalities, and seamless compatibility with the Multibit Signal System for more sophisticated signal analysis and trading strategies.
Signal Daisychain:
Provides a configurable interface (Signal_Channel_Line1 to Signal_Channel_Line6) that allows users to select channel lines for Long and Short conditions, specifically designed for compatibility with the Multibit Signal System.
Multibit Signal Integration:
Utilizes functions from DJMAD's Signal_transcoder_library to encode and decode signals, ensuring compatibility with the Multibit Signal System for advanced signal processing and strategy development.
For more Informations about the Multibit System please look at djmad Tradingview Profile.

Ichimoku Oscillator 4 colorsJust Ichimoku oscillator!
Histogramm of Tenkan/Kujun convergence/divergence + Kumo height = cummulative line (momentum).
Can use histogramm or cummulative line color for bars.

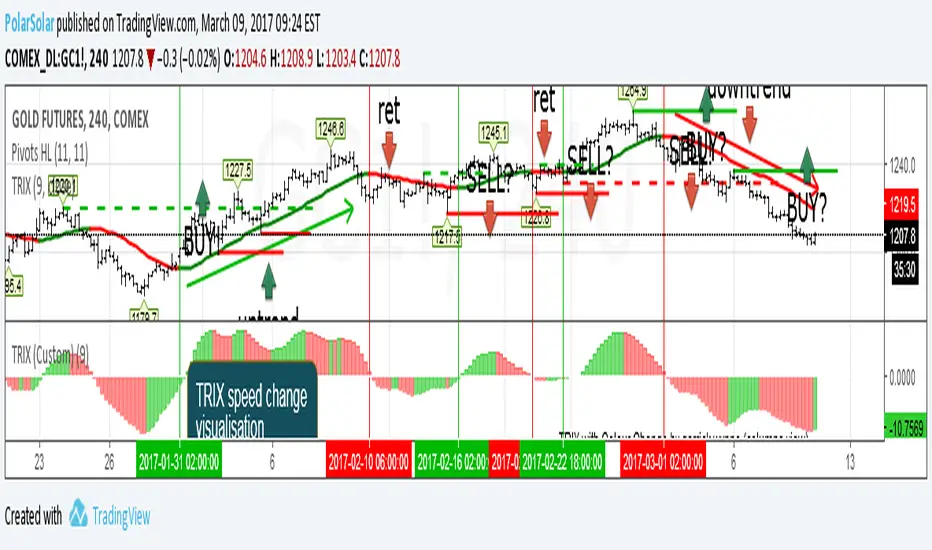
Triple Exponental Moving Average (overlay)TRIX Overlay + TRIX change Histogramm = simplest tactic to trade.
Just use last counter trend fractal to place delayed order
A counter trend fractal is a fractal down on TRIX uptrend or fractal up on TRIX downtrend.
Use TRIX speed change histogramm to seek divergence
Scout Regiment - MACD# Scout Regiment - MACD Indicator
## English Documentation
### Overview
Scout Regiment - MACD is an advanced implementation of the Moving Average Convergence Divergence indicator with enhanced features including dual divergence detection (histogram and MACD line), customizable moving average types, multi-timeframe analysis, and sophisticated visual elements. This indicator provides traders with comprehensive momentum analysis and high-probability reversal signals.
### What is MACD?
MACD (Moving Average Convergence Divergence) is a trend-following momentum indicator that shows the relationship between two moving averages:
- **MACD Line**: Difference between fast and slow EMAs
- **Signal Line**: Moving average of the MACD line
- **Histogram**: Difference between MACD line and signal line
- **Purpose**: Identifies trend direction, momentum strength, and potential reversals
### Key Features
#### 1. **Enhanced MACD Display**
**Three Core Components:**
**MACD Line** (Default: Blue/Orange, 2px)
- Fast EMA (13) minus Slow EMA (34)
- Shows momentum direction
- Color changes based on position relative to signal line:
- Blue: Above signal line (bullish)
- Orange: Below signal line (bearish)
- Can be toggled on/off
**Signal Line** (Default: White/Blue with transparency, 2px)
- EMA (9) of the MACD line
- Serves as trigger line for crossover signals
- Color varies based on settings
- Essential for identifying entry/exit points
**Histogram** (Default: 4-color gradient, 4px columns)
- Difference between MACD and signal line
- Visual representation of momentum strength
- Advanced 4-color scheme:
- **Dark Green (#26A69A)**: Positive and increasing (strong bullish)
- **Light Green (#B2DFDB)**: Positive but decreasing (weakening bullish)
- **Dark Red (#FF5252)**: Negative and decreasing (strong bearish)
- **Light Red (#FFCDD2)**: Negative but increasing (weakening bearish)
- Histogram tells the "story" of momentum changes
#### 2. **Customizable Moving Average Types**
**Oscillator MA Type** (MACD Line calculation):
- **EMA** (Exponential) - Default, more responsive
- **SMA** (Simple) - Smoother, less responsive
**Signal Line MA Type**:
- **EMA** (Exponential) - Default, faster signals
- **SMA** (Simple) - Slower, fewer false signals
**Flexibility**: Mix and match for different trading styles
- EMA/EMA: Most responsive (day trading)
- SMA/SMA: Smoothest (swing trading)
- EMA/SMA or SMA/EMA: Balanced approaches
#### 3. **Multi-Timeframe Capability**
**Current Chart Period** (Default: Enabled)
- Uses current timeframe automatically
- Simplest option for most traders
**Custom Timeframe Selection**
- Calculate MACD on any timeframe
- Display higher timeframe MACD on lower timeframe charts
- Example: View 1H MACD on 15min chart
- **Use Case**: Align lower timeframe trades with higher timeframe momentum
#### 4. **Visual Enhancement Features**
**Golden Cross / Death Cross Markers**
- Circles mark crossover points
- Color matches MACD line color
- Clearly identifies entry/exit signals
- Can be toggled on/off
**Zero Line** (White, 2px solid)
- Reference for positive/negative momentum
- Critical level for trend identification
- MACD above zero = Bullish bias
- MACD below zero = Bearish bias
**Color Transitions**
- MACD line changes color at signal line crosses
- Histogram shows momentum acceleration/deceleration
- Provides early warning of trend changes
#### 5. **Dual Divergence Detection System**
This indicator features TWO separate divergence detection systems:
**A. Histogram Divergence Detection**
- **Purpose**: Earlier divergence signals (most sensitive)
- **Detects**: Regular bullish and bearish divergences
- **Label**: "H涨" (Histogram Up), "H跌" (Histogram Down)
- **Special Feature**: Same-sign requirement option
- Top divergence: Both histogram points must be positive
- Bottom divergence: Both histogram points must be negative
- Filters out less reliable divergences
**B. MACD Line Divergence Detection**
- **Purpose**: Stronger, more reliable divergences
- **Detects**: Regular bullish and bearish divergences
- **Label**: "M涨" (MACD Up), "M跌" (MACD Down)
- **Use**: Confirmation of histogram divergences or standalone
**Divergence Types Explained:**
**Regular Bullish Divergence (Yellow)**
- **Price**: Lower lows
- **Indicator**: Higher lows (histogram OR MACD line)
- **Signal**: Potential upward reversal
- **Best**: Near support levels, oversold conditions
- **Entry**: After price breaks above recent resistance
**Regular Bearish Divergence (Blue)**
- **Price**: Higher highs
- **Indicator**: Lower highs (histogram OR MACD line)
- **Signal**: Potential downward reversal
- **Best**: Near resistance levels, overbought conditions
- **Entry**: After price breaks below recent support
#### 6. **Advanced Divergence Parameters**
**Histogram Divergence Settings:**
- **Price Reference**: Wicks (default) or Bodies
- **Right Lookback**: Bars to right of pivot (default: 2)
- **Left Lookback**: Bars to left of pivot (default: 5)
- **Max Range**: Maximum bars between divergences (default: 60)
- **Min Range**: Minimum bars between divergences (default: 5)
- **Same Sign Requirement**: Ensures both histogram points have same sign
- **Show Regular Divergence**: Toggle display
- **Show Labels**: Toggle divergence labels
**MACD Line Divergence Settings:**
- **Price Reference**: Wicks (default) or Bodies
- **Right Lookback**: Bars to right of pivot (default: 1)
- **Left Lookback**: Bars to left of pivot (default: 5)
- **Max Range**: Maximum bars between divergences (default: 60)
- **Min Range**: Minimum bars between divergences (default: 5)
- **Show Regular Divergence**: Toggle display
- **Show Labels**: Toggle divergence labels
**Independent Control**: Adjust histogram and MACD line divergences separately
### Configuration Settings
#### MACD Basic Settings
- **Fast EMA Period**: Fast moving average length (default: 13)
- **Slow EMA Period**: Slow moving average length (default: 34)
- **Signal Line Period**: Signal line length (default: 9)
- **Use Current Chart Period**: Auto-adjust to current timeframe
- **Select Period**: Choose custom timeframe
- **Show MACD & Signal Lines**: Toggle lines display
- **Show Cross Markers**: Toggle golden/death cross dots
- **Show Histogram**: Toggle histogram display
- **Show Crossover Color Change**: Enable MACD line color change
- **Show Histogram Colors**: Enable 4-color histogram scheme
- **Oscillator MA Type**: Choose SMA or EMA for MACD
- **Signal Line MA Type**: Choose SMA or EMA for signal
#### Histogram Divergence Settings
- **Show Histogram Divergence**: Enable histogram divergence detection
- **Price Reference**: Wicks or Bodies for price comparison
- **Right/Left Lookback**: Pivot detection parameters
- **Max/Min Range**: Distance constraints between pivots
- **Show Regular Divergence**: Display histogram divergence lines
- **Show Labels**: Display histogram divergence labels
- **Require Same Sign**: Enforce histogram sign consistency
#### MACD Line Divergence Settings
- **Show MACD Line Divergence**: Enable MACD line divergence detection
- **Price Reference**: Wicks or Bodies for price comparison
- **Right/Left Lookback**: Pivot detection parameters
- **Max/Min Range**: Distance constraints between pivots
- **Show Regular Divergence**: Display MACD line divergence lines
- **Show Labels**: Display MACD line divergence labels
### How to Use
#### For Basic Trend Following
1. **Enable Core Components**
- MACD line, signal line, and histogram
- Enable cross markers
2. **Identify Trend**
- MACD above zero = Uptrend
- MACD below zero = Downtrend
3. **Watch for Crossovers**
- Golden cross (MACD crosses above signal) = Buy signal
- Death cross (MACD crosses below signal) = Sell signal
4. **Confirm with Histogram**
- Increasing histogram = Strengthening trend
- Decreasing histogram = Weakening trend
#### For Divergence Trading
1. **Enable Both Divergence Systems**
- Histogram divergence (early signals)
- MACD line divergence (confirmation)
2. **Wait for Divergence Signals**
- "H涨" or "H跌" = Early warning
- "M涨" or "M跌" = Confirmation
3. **Best Divergences**
- Both histogram AND MACD line showing divergence
- Divergence at key support/resistance levels
- Multiple divergences on same trend
4. **Entry Timing**
- Wait for price structure break
- Enter on pullback after confirmation
- Use MACD crossover as trigger
#### For Multi-Timeframe Analysis
1. **Set Higher Timeframe**
- Example: 4H MACD on 1H chart
- Uncheck "Use Current Chart Period"
- Select desired timeframe
2. **Identify Higher TF Trend**
- MACD position relative to zero
- MACD vs signal line relationship
3. **Trade with HTF Direction**
- Only take long signals if HTF MACD bullish
- Only take short signals if HTF MACD bearish
4. **Use Current TF for Entries**
- Higher TF for bias
- Current TF for precise timing
#### For Histogram Analysis
1. **Enable 4-Color Histogram**
- Watch color transitions
- Dark colors = Strong momentum
- Light colors = Weakening momentum
2. **Momentum Stages**
- Dark green → Light green = Bullish losing steam
- Light red → Dark red = Bearish gaining strength
3. **Trade Transitions**
- Light green to light red = Momentum shift (potential reversal)
- Entry on confirmation crossover
### Trading Strategies
#### Strategy 1: Classic MACD Crossover
**Setup:**
- Standard settings (13/34/9)
- Enable MACD, signal line, and cross markers
- Clear trend on higher timeframe
**Entry:**
- **Long**: Golden cross (circle marker) above zero line
- **Short**: Death cross (circle marker) below zero line
**Confirmation:**
- Histogram color supporting direction
- Volume increase helps
**Stop Loss:**
- Below recent swing low (long)
- Above recent swing high (short)
**Exit:**
- Opposite crossover
- MACD crosses zero line against position
**Best For:** Trend following, clear trending markets
#### Strategy 2: Zero Line Bounce
**Setup:**
- Enable all components
- Established trend (MACD staying one side of zero)
- Wait for pullback to zero line
**Entry:**
- **Long**: MACD touches zero from above, bounces up with golden cross
- **Short**: MACD touches zero from below, bounces down with death cross
**Confirmation:**
- Histogram color change
- Price at support/resistance
**Stop Loss:**
- Just beyond zero line (opposite side)
**Exit:**
- Target previous extreme
- Or opposite crossover
**Best For:** Trend continuation, strong markets
#### Strategy 3: Dual Divergence Confirmation
**Setup:**
- Enable both histogram and MACD line divergences
- Price at extreme (high/low)
- Wait for divergence signals
**Entry:**
- **Long**: Both "H涨" AND "M涨" labels appear
- **Short**: Both "H跌" AND "M跌" labels appear
**Confirmation:**
- Price breaks structure
- Volume increase
- Golden/death cross confirms
**Stop Loss:**
- Beyond divergence pivot point
**Exit:**
- MACD crosses zero line
- Or opposite divergence appears
**Best For:** Reversal trading, swing trading
#### Strategy 4: Histogram Color Transition
**Setup:**
- Enable 4-color histogram
- Focus on color changes
- Price in trend
**Entry:**
- **Long**: Light red → Light green transition + golden cross
- **Short**: Light green → Light red transition + death cross
**Rationale:**
- Light colors show momentum exhaustion
- Color flip = momentum shift
- Early entry before full trend reversal
**Stop Loss:**
- Recent swing point
**Exit:**
- Histogram color turns light against position
- Or at predetermined target
**Best For:** Scalping, day trading, early entries
#### Strategy 5: Multi-Timeframe Momentum
**Setup:**
- Display higher timeframe MACD (e.g., 4H on 1H chart)
- Current chart shows current momentum
- Higher TF shows overall bias
**Entry:**
- **Long**: HTF MACD above zero + current TF golden cross
- **Short**: HTF MACD below zero + current TF death cross
**Confirmation:**
- HTF histogram supporting direction
- Both timeframes aligned
**Stop Loss:**
- Based on current timeframe structure
**Exit:**
- Current TF opposite crossover
- Or HTF MACD momentum weakens
**Best For:** Swing trading, high-probability setups
#### Strategy 6: Histogram-Only Divergence Scout
**Setup:**
- Enable only histogram divergence
- Use "same sign requirement"
- Focus on early signals
**Entry:**
- **Long**: "H涨" label + price at support
- **Short**: "H跌" label + price at resistance
**Confirmation:**
- Wait for MACD/signal crossover
- Or price structure break
**Advantage:**
- Earliest divergence signals
- Get in before crowd
**Risk:**
- More false signals than MACD line divergence
- Requires strict confirmation
**Stop Loss:**
- Tight stop beyond entry bar
**Exit:**
- Quick targets (30-50% of expected move)
- Or trail stop
**Best For:** Active traders, scalpers seeking early entries
### Best Practices
#### MACD Period Selection
**Standard (13/34/9)** - Default
- Balanced for most markets
- Good for day trading and swing trading
- Widely used, works with general market psychology
**Faster (8/21/5 or 12/26/9)**
- More responsive
- More signals, more noise
- Best for: Scalping, volatile markets
- Risk: More false signals
**Slower (21/55/13)**
- Smoother signals
- Fewer but stronger signals
- Best for: Swing trading, position trading
- Benefit: Higher reliability
#### Histogram vs MACD Line Divergences
**Histogram Divergence:**
- ✅ Earlier signals
- ✅ Catch moves before others
- ❌ More false signals
- ❌ Requires confirmation
- **Best for**: Active traders, scalpers
**MACD Line Divergence:**
- ✅ More reliable
- ✅ Stronger divergences
- ❌ Later signals
- ❌ May miss early moves
- **Best for**: Swing traders, conservative traders
**Both Together:**
- ✅ Maximum confidence
- ✅ Histogram for alert, MACD for confirmation
- ✅ Highest probability setups
- **Best for**: All traders seeking quality over quantity
#### Same Sign Requirement Feature
**Enabled (Recommended):**
- Filters low-quality divergences
- Top divergence: Both histogram points positive
- Bottom divergence: Both histogram points negative
- Results in fewer but more reliable signals
**Disabled:**
- More divergence signals
- Includes zero-line crossing divergences
- Higher false signal rate
- Only for experienced traders
#### Price Reference: Wicks vs Bodies
**Wicks (Default):**
- Uses high/low prices
- Catches all extremes
- More divergences detected
- Best for: Most trading styles
**Bodies:**
- Uses open/close prices
- Filters out spike movements
- Fewer but cleaner divergences
- Best for: Noisy markets, crypto
#### Visual Settings Recommendations
**For Beginners:**
- Enable: MACD line, signal line, histogram
- Enable: Cross markers
- Enable: Histogram colors
- Disable: Both divergence systems initially
- Focus: Learn basic crossovers first
**For Intermediate:**
- All basic components
- Add: Histogram divergence only
- Use: Same sign requirement
- Focus: Early reversal signals
**For Advanced:**
- All components
- Both divergence systems
- Custom parameters per market
- Multi-timeframe analysis
- Focus: High-probability confluence setups
### Indicator Combinations
**With Moving Averages (EMAs):**
- EMAs (21/55/144) show trend
- MACD shows momentum
- Enter when both align
- Exit when MACD turns first
**With RSI:**
- RSI for overbought/oversold
- MACD for momentum confirmation
- Divergence on both = Extremely strong signal
- RSI + MACD divergence = High probability trade
**With Volume:**
- Volume confirms MACD signals
- Crossover + volume spike = Valid breakout
- Divergence + volume divergence = Strong reversal
**With Support/Resistance:**
- S/R levels for entry/exit targets
- MACD divergence at levels = Highest probability
- MACD crossover at level = Strong confirmation
**With Bias Indicator:**
- Bias shows price deviation from EMA
- MACD shows momentum
- Both diverging = Powerful reversal signal
- Bias extreme + MACD divergence = High conviction trade
**With OBV:**
- OBV shows volume trend
- MACD shows price momentum
- OBV + MACD divergence = Volume not supporting price
- Strong reversal indication
**With KSI (RSI/CCI):**
- KSI for oscillator extremes
- MACD for momentum direction
- KSI extreme + MACD divergence = Reversal likely
- All aligned = Maximum confidence
### Common MACD Patterns
1. **Bullish Cross Above Zero**: Strong uptrend continuation signal
2. **Bearish Cross Below Zero**: Strong downtrend continuation signal
3. **Zero Line Rejection**: Price respects zero as support/resistance
4. **Histogram Peak**: Momentum climax, watch for reversal
5. **Double Divergence**: Two divergences without reversal = Very strong signal when it finally reverses
6. **Histogram Convergence**: Histogram narrowing = Trend losing steam
7. **Signal Line Hug**: MACD stays close to signal = Consolidation, expect breakout
### Performance Tips
- Start with default settings (13/34/9 EMA/EMA)
- Test one divergence system at a time
- Use same sign requirement initially
- Enable cross markers for clear signals
- Adjust lookback parameters per market volatility
- Higher timeframe MACD more reliable than lower
- Combine histogram early signal with MACD line confirmation
- Don't trade every divergence - wait for best setups
### Alert Conditions
While not explicitly coded, you can set custom alerts on:
- MACD crossing above/below signal line
- MACD crossing above/below zero line
- Histogram crossing zero
- When divergence labels appear (using visual alerts)
---
## 中文说明文档
### 概述
Scout Regiment - MACD 是移动平均线收敛发散指标的高级实现版本,具有增强功能,包括双重背离检测(直方图和MACD线)、可自定义的移动平均类型、多时间框架分析和复杂的视觉元素。该指标为交易者提供全面的动量分析和高概率反转信号。
### 什么是MACD?
MACD(移动平均线收敛发散)是一个趋势跟随动量指标,显示两条移动平均线之间的关系:
- **MACD线**:快速和慢速EMA之间的差值
- **信号线**:MACD线的移动平均
- **直方图**:MACD线和信号线之间的差值
- **用途**:识别趋势方向、动量强度和潜在反转
### 核心功能
#### 1. **增强的MACD显示**
**三个核心组件:**
**MACD线**(默认:蓝色/橙色,2像素)
- 快速EMA(13)减去慢速EMA(34)
- 显示动量方向
- 根据相对于信号线的位置改变颜色:
- 蓝色:信号线上方(看涨)
- 橙色:信号线下方(看跌)
- 可开关显示
**信号线**(默认:白色/蓝色带透明度,2像素)
- MACD线的EMA(9)
- 作为交叉信号的触发线
- 颜色根据设置变化
- 识别进出场点的关键
**直方图**(默认:4色渐变,4像素柱)
- MACD和信号线之间的差值
- 动量强度的视觉表示
- 高级4色方案:
- **深绿色(#26A69A)**:正值且增加(强劲看涨)
- **浅绿色(#B2DFDB)**:正值但减少(看涨减弱)
- **深红色(#FF5252)**:负值且减少(强劲看跌)
- **浅红色(#FFCDD2)**:负值但增加(看跌减弱)
- 直方图讲述动量变化的"故事"
#### 2. **可自定义的移动平均类型**
**振荡器MA类型**(MACD线计算):
- **EMA**(指数)- 默认,反应更快
- **SMA**(简单)- 更平滑,反应较慢
**信号线MA类型**:
- **EMA**(指数)- 默认,更快信号
- **SMA**(简单)- 更慢,假信号更少
**灵活性**:混合搭配以适应不同交易风格
- EMA/EMA:最灵敏(日内交易)
- SMA/SMA:最平滑(波段交易)
- EMA/SMA或SMA/EMA:平衡方法
#### 3. **多时间框架功能**
**当前图表周期**(默认:启用)
- 自动使用当前时间框架
- 大多数交易者的最简单选项
**自定义时间框架选择**
- 在任何时间框架上计算MACD
- 在低时间框架图表上显示高时间框架MACD
- 示例:在15分钟图上查看1小时MACD
- **使用场景**:使低时间框架交易与高时间框架动量保持一致
#### 4. **视觉增强功能**
**金叉/死叉标记**
- 圆点标记交叉点
- 颜色与MACD线颜色匹配
- 清晰识别进出场信号
- 可开关
**零线**(白色,2像素实线)
- 正负动量的参考
- 趋势识别的关键水平
- MACD在零线上方 = 看涨偏向
- MACD在零线下方 = 看跌偏向
**颜色转换**
- MACD线在信号线交叉处改变颜色
- 直方图显示动量加速/减速
- 提供趋势变化的早期警告
#### 5. **双重背离检测系统**
该指标具有两个独立的背离检测系统:
**A. 直方图背离检测**
- **用途**:更早的背离信号(最敏感)
- **检测**:常规看涨和看跌背离
- **标签**:"H涨"(直方图上涨)、"H跌"(直方图下跌)
- **特殊功能**:同符号要求选项
- 顶背离:两个直方图点都必须为正
- 底背离:两个直方图点都必须为负
- 过滤不太可靠的背离
**B. MACD线背离检测**
- **用途**:更强、更可靠的背离
- **检测**:常规看涨和看跌背离
- **标签**:"M涨"(MACD上涨)、"M跌"(MACD下跌)
- **用途**:确认直方图背离或独立使用
**背离类型说明:**
**常规看涨背离(黄色)**
- **价格**:更低的低点
- **指标**:更高的低点(直方图或MACD线)
- **信号**:潜在向上反转
- **最佳**:在支撑水平附近、超卖状况
- **入场**:价格突破近期阻力后
**常规看跌背离(蓝色)**
- **价格**:更高的高点
- **指标**:更低的高点(直方图或MACD线)
- **信号**:潜在向下反转
- **最佳**:在阻力水平附近、超买状况
- **入场**:价格跌破近期支撑后
#### 6. **高级背离参数**
**直方图背离设置:**
- **价格参考**:影线(默认)或实体
- **右侧回溯**:枢轴点右侧K线数(默认:2)
- **左侧回溯**:枢轴点左侧K线数(默认:5)
- **最大范围**:背离之间最大K线数(默认:60)
- **最小范围**:背离之间最小K线数(默认:5)
- **同符号要求**:确保两个直方图点符号相同
- **显示常规背离**:切换显示
- **显示标签**:切换背离标签
**MACD线背离设置:**
- **价格参考**:影线(默认)或实体
- **右侧回溯**:枢轴点右侧K线数(默认:1)
- **左侧回溯**:枢轴点左侧K线数(默认:5)
- **最大范围**:背离之间最大K线数(默认:60)
- **最小范围**:背离之间最小K线数(默认:5)
- **显示常规背离**:切换显示
- **显示标签**:切换背离标签
**独立控制**:分别调整直方图和MACD线背离
### 配置设置
#### MACD基础设置
- **快速EMA周期**:快速移动平均长度(默认:13)
- **慢速EMA周期**:慢速移动平均长度(默认:34)
- **信号线周期**:信号线长度(默认:9)
- **使用当前图表周期**:自动调整到当前时间框架
- **选择周期**:选择自定义时间框架
- **显示MACD线和信号线**:切换线条显示
- **显示金叉死叉圆点标记**:切换金叉/死叉圆点
- **显示直方图**:切换直方图显示
- **显示穿越变化MACD线**:启用MACD线颜色变化
- **显示直方图颜色**:启用4色直方图方案
- **振荡器MA类型**:为MACD选择SMA或EMA
- **信号线MA类型**:为信号线选择SMA或EMA
#### 直方图背离设置
- **显示直方图背离信号**:启用直方图背离检测
- **价格参考**:影线或实体用于价格比较
- **右侧/左侧回溯**:枢轴检测参数
- **最大/最小范围**:枢轴之间的距离约束
- **显示直方图常规背离**:显示直方图背离线
- **显示直方图常规背离标签**:显示直方图背离标签
- **要求背离点柱状图同符号**:强制直方图符号一致性
#### MACD线背离设置
- **显示MACD线背离信号**:启用MACD线背离检测
- **价格参考**:影线或实体用于价格比较
- **右侧/左侧回溯**:枢轴检测参数
- **最大/最小范围**:枢轴之间的距离约束
- **显示线常规背离**:显示MACD线背离线
- **显示线常规背离标签**:显示MACD线背离标签
### 使用方法
#### 基础趋势跟随
1. **启用核心组件**
- MACD线、信号线和直方图
- 启用交叉标记
2. **识别趋势**
- MACD在零线上方 = 上升趋势
- MACD在零线下方 = 下降趋势
3. **观察交叉**
- 金叉(MACD向上穿越信号线)= 买入信号
- 死叉(MACD向下穿越信号线)= 卖出信号
4. **用直方图确认**
- 直方图增加 = 趋势加强
- 直方图减少 = 趋势减弱
#### 背离交易
1. **启用两个背离系统**
- 直方图背离(早期信号)
- MACD线背离(确认)
2. **等待背离信号**
- "H涨"或"H跌" = 早期警告
- "M涨"或"M跌" = 确认
3. **最佳背离**
- 直方图和MACD线都显示背离
- 在关键支撑/阻力水平的背离
- 同一趋势上多个背离
4. **入场时机**
- 等待价格结构突破
- 确认后回调时进入
- 使用MACD交叉作为触发
#### 多时间框架分析
1. **设置更高时间框架**
- 示例:在1小时图上显示4小时MACD
- 取消勾选"使用当前图表周期"
- 选择所需时间框架
2. **识别更高TF趋势**
- MACD相对于零线的位置
- MACD与信号线的关系
3. **顺HTF方向交易**
- 仅在HTF MACD看涨时接受多头信号
- 仅在HTF MACD看跌时接受空头信号
4. **使用当前TF入场**
- 更高TF确定偏向
- 当前TF精确定时
#### 直方图分析
1. **启用4色直方图**
- 观察颜色转换
- 深色 = 强动量
- 浅色 = 动量减弱
2. **动量阶段**
- 深绿色→浅绿色 = 看涨失去动力
- 浅红色→深红色 = 看跌获得力量
3. **交易转换**
- 浅绿色到浅红色 = 动量转变(潜在反转)
- 确认交叉时入场
### 交易策略
#### 策略1:经典MACD交叉
**设置:**
- 标准设置(13/34/9)
- 启用MACD、信号线和交叉标记
- 更高时间框架明确趋势
**入场:**
- **多头**:零线上方金叉(圆点标记)
- **空头**:零线下方死叉(圆点标记)
**确认:**
- 直方图颜色支持方向
- 成交量增加有帮助
**止损:**
- 近期波动低点之下(多头)
- 近期波动高点之上(空头)
**离场:**
- 相反交叉
- MACD反向穿越零线
**适合:**趋势跟随、明确趋势市场
#### 策略2:零线反弹
**设置:**
- 启用所有组件
- 已建立趋势(MACD保持在零线一侧)
- 等待回调至零线
**入场:**
- **多头**:MACD从上方触及零线,向上反弹并金叉
- **空头**:MACD从下方触及零线,向下反弹并死叉
**确认:**
- 直方图颜色变化
- 价格在支撑/阻力位
**止损:**
- 零线对面一侧
**离场:**
- 目标前一极值
- 或相反交叉
**适合:**趋势延续、强势市场
#### 策略3:双重背离确认
**设置:**
- 启用直方图和MACD线背离
- 价格在极值(高点/低点)
- 等待背离信号
**入场:**
- **多头**:"H涨"和"M涨"标签都出现
- **空头**:"H跌"和"M跌"标签都出现
**确认:**
- 价格突破结构
- 成交量增加
- 金叉/死叉确认
**止损:**
- 背离枢轴点之外
**离场:**
- MACD穿越零线
- 或出现相反背离
**适合:**反转交易、波段交易
#### 策略4:直方图颜色转换
**设置:**
- 启用4色直方图
- 关注颜色变化
- 价格处于趋势
**入场:**
- **多头**:浅红色→浅绿色转换 + 金叉
- **空头**:浅绿色→浅红色转换 + 死叉
**原理:**
- 浅色显示动量衰竭
- 颜色翻转 = 动量转变
- 完全趋势反转前的早期入场
**止损:**
- 近期波动点
**离场:**
- 直方图颜色变为反向浅色
- 或预定目标
**适合:**剥头皮、日内交易、早期入场
#### 策略5:多时间框架动量
**设置:**
- 显示更高时间框架MACD(例如,在1小时图上显示4小时)
- 当前图表显示当前动量
- 更高TF显示整体偏向
**入场:**
- **多头**:HTF MACD在零线上方 + 当前TF金叉
- **空头**:HTF MACD在零线下方 + 当前TF死叉
**确认:**
- HTF直方图支持方向
- 两个时间框架对齐
**止损:**
- 基于当前时间框架结构
**离场:**
- 当前TF相反交叉
- 或HTF MACD动量减弱
**适合:**波段交易、高概率设置
#### 策略6:仅直方图背离侦察
**设置:**
- 仅启用直方图背离
- 使用"同符号要求"
- 关注早期信号
**入场:**
- **多头**:"H涨"标签 + 价格在支撑位
- **空头**:"H跌"标签 + 价格在阻力位
**确认:**
- 等待MACD/信号线交叉
- 或价格结构突破
**优势:**
- 最早的背离信号
- 在大众之前进入
**风险:**
- 比MACD线背离假信号更多
- 需要严格确认
**止损:**
- 入场K线之外紧密止损
**离场:**
- 快速目标(预期波动的30-50%)
- 或移动止损
**适合:**活跃交易者、寻求早期入场的剥头皮交易者
### 最佳实践
#### MACD周期选择
**标准(13/34/9)** - 默认
- 大多数市场的平衡
- 适合日内交易和波段交易
- 广泛使用,符合一般市场心理
**更快(8/21/5或12/26/9)**
- 更灵敏
- 更多信号,更多噪音
- 最适合:剥头皮、波动市场
- 风险:更多假信号
**更慢(21/55/13)**
- 更平滑的信号
- 信号较少但更强
- 最适合:波段交易、仓位交易
- 优势:更高可靠性
#### 直方图vs MACD线背离
**直方图背离:**
- ✅ 更早信号
- ✅ 在其他人之前捕捉波动
- ❌ 更多假信号
- ❌ 需要确认
- **最适合**:活跃交易者、剥头皮交易者
**MACD线背离:**
- ✅ 更可靠
- ✅ 更强的背离
- ❌ 信号较晚
- ❌ 可能错过早期波动
- **最适合**:波段交易者、保守交易者
**两者结合:**
- ✅ 最大信心
- ✅ 直方图警报,MACD确认
- ✅ 最高概率设置
- **最适合**:所有寻求质量而非数量的交易者
#### 同符号要求功能
**启用(推荐):**
- 过滤低质量背离
- 顶背离:两个直方图点都为正
- 底背离:两个直方图点都为负
- 产生更少但更可靠的信号
**禁用:**
- 更多背离信号
- 包括零线穿越背离
- 假信号率更高
- 仅适合有经验的交易者
#### 价格参考:影线vs实体
**影线(默认):**
- 使用最高/最低价
- 捕捉所有极值
- 检测到更多背离
- 最适合:大多数交易风格
**实体:**
- 使用开盘/收盘价
- 过滤突刺波动
- 背离更少但更干净
- 最适合:噪音市场、加密货币
#### 视觉设置建议
**新手:**
- 启用:MACD线、信号线、直方图
- 启用:交叉标记
- 启用:直方图颜色
- 禁用:初始禁用两个背离系统
- 重点:先学习基本交叉
**中级:**
- 所有基本组件
- 添加:仅直方图背离
- 使用:同符号要求
- 重点:早期反转信号
**高级:**
- 所有组件
- 两个背离系统
- 每个市场自定义参数
- 多时间框架分析
- 重点:高概率汇合设置
### 指标组合
**与移动平均线(EMA)配合:**
- EMA(21/55/144)显示趋势
- MACD显示动量
- 两者一致时进入
- MACD先转向时退出
**与RSI配合:**
- RSI用于超买超卖
- MACD用于动量确认
- 两者都背离 = 极强信号
- RSI + MACD背离 = 高概率交易
**与成交量配合:**
- 成交量确认MACD信号
- 交叉 + 成交量激增 = 有效突破
- 背离 + 成交量背离 = 强反转
**与支撑/阻力配合:**
- 支撑阻力水平用于进出目标
- 水平处的MACD背离 = 最高概率
- 水平处的MACD交叉 = 强确认
**与Bias指标配合:**
- Bias显示价格相对EMA的偏离
- MACD显示动量
- 两者都背离 = 强大反转信号
- Bias极值 + MACD背离 = 高信念交易
**与OBV配合:**
- OBV显示成交量趋势
- MACD显示价格动量
- OBV + MACD背离 = 成交量不支持价格
- 强反转迹象
**与KSI(RSI/CCI)配合:**
- KSI用于振荡器极值
- MACD用于动量方向
- KSI极值 + MACD背离 = 可能反转
- 全部对齐 = 最大信心
### 常见MACD形态
1. **零线上方看涨交叉**:强上升趋势延续信号
2. **零线下方看跌交叉**:强下降趋势延续信号
3. **零线拒绝**:价格将零线作为支撑/阻力
4. **直方图峰值**:动量高潮,注意反转
5. **双重背离**:两次背离未反转 = 最终反转时非常强
6. **直方图收敛**:直方图变窄 = 趋势失去动力
7. **信号线紧贴**:MACD紧贴信号线 = 盘整,预期突破
### 性能提示
- 从默认设置开始(13/34/9 EMA/EMA)
- 一次测试一个背离系统
- 初始使用同符号要求
- 启用交叉标记以获得清晰信号
- 根据市场波动性调整回溯参数
- 更高时间框架MACD比更低的更可靠
- 结合直方图早期信号与MACD线确认
- 不要交易每个背离 - 等待最佳设置
### 警报条件
虽然没有明确编码,但您可以设置自定义警报:
- MACD向上/向下穿越信号线
- MACD向上/向下穿越零线
- 直方图穿越零线
- 背离标签出现时(使用视觉警报)
---
## Technical Support
For questions or issues, please refer to the TradingView community or contact the indicator creator.
## 技术支持
如有问题,请参考TradingView社区或联系指标创建者。

[CT] D&W PPO + RBF + DivergenceThis indicator combines two separate ideas into one tool so you can read trend context from your price chart while timing momentum shifts from a clean oscillator panel. The first component is the Daily and Weekly Percentage Price Oscillator (D&W PPO), which measures the relationship between two EMA spreads that are intentionally built to reflect two “speeds” of market structure. The “weekly” leg is calculated as the percentage distance between a slower and faster EMA pair (L1 and L2), and the “daily” leg is calculated as the percentage distance between a shorter EMA pair (L3 and L4), but both are normalized by the same long EMA (e2) so the values behave like a percent-based oscillator rather than raw points. The script then combines those two legs by creating R = W + D, and it plots the histogram as R − W, which simplifies to D. That is not a mistake, it is the point of the design. By setting the baseline at “R equals W,” the zero line becomes a very intuitive threshold that tells you whether the shorter-term push is adding to the longer-term bias or subtracting from it. When the histogram is above zero, the daily component is supportive of the larger trend pressure, and when it is below zero, the daily component is opposing it. The histogram color is intentionally binary and stable, green when the histogram is at or above zero and red when it is below, so the panel reads like a momentum confirmation tool rather than a noisy oscillator that constantly shifts shades.
The second component is the RBF Price Trail, which is drawn on the upper price chart even though the indicator itself lives in a lower panel. This line is not a moving average in the traditional sense. It is a Radial Basis Function kernel smoother that weights recent prices based on their similarity rather than only their recency. In plain terms, the kernel attempts to build a smoother “baseline” that adapts to the shape of price action, and then the script optionally wraps that baseline inside an ATR band and applies a Supertrend-like trailing clamp. When the ATR band is enabled, the line will not simply track the kernel value, it will trail price and hold its position until price forces it to ratchet. This behavior is what makes it useful as a structure-aligned trend line rather than just another smoothing curve. When the adaptive band boost is enabled, the band width is multiplied by a factor that grows when recent price change is large relative to a lookback normalization window. That means the trailing mechanism can adapt to fast markets by changing the effective band behavior, which helps reduce whipsaws in choppy conditions while still allowing the line to respond when volatility expands. The line color is determined by where price closes relative to the trail, bullish when price is above the trail and bearish when price is below it, and you can optionally color your actual chart candles from either the PPO state or the RBF state depending on what you want your eyes to follow.
The settings are organized so you can control each module without changing how the core PPO trend logic behaves. The PPO settings L1, L2, L3, and L4 define the EMA lengths used to compute the weekly leg W and the daily leg D. Increasing these values makes the oscillator slower and smoother, while decreasing them makes it react faster to recent movement. “Show W line” is simply a visual aid, it plots the W line in the oscillator panel so you can see the longer-term component, but it does not change the histogram logic. “Histogram thickness” is purely visual and controls how thick the column bars are. The PPO colors are the two base colors used for the histogram state, green when the daily component is supportive and red when it is opposing.
The RBF settings control what you see on the upper chart. “Show RBF on Price Chart” turns the trail line on or off. “Source” chooses which price series feeds the kernel, and close is usually the cleanest choice. “Kernel Length” determines how many bars the kernel uses; a larger value makes the baseline smoother and slower, and a smaller value makes it more reactive. “Gamma Adj” controls how quickly the kernel’s weights decay as price becomes dissimilar, so higher gamma tends to make the kernel react more sharply to changes while lower gamma produces a broader smoothing effect. “Use ATR Trail Band” is the switch that turns the kernel baseline into a trailing band line, and it is the reason the line can “hold” and then ratchet instead of moving continuously like a normal moving average. “ATR Length” and “ATR Factor” control the width of that band, and widening the band will generally reduce flips and noise at the cost of later signals. “Use Adaptive Band Boost” turns on the volatility normalization idea, “Boost Normalization Lookback” defines how far back the script looks to determine what counts as a large price change, and “Boost Multiplier” controls how strongly the band behavior is adjusted during those periods. The line width and bull/bear colors are visual controls only.
Price bar coloring is intentionally handled with a single selector so you do not end up with two modules fighting to color candles differently. If you choose “Off,” nothing on the main chart is recolored. If you choose “PPO,” your price candles reflect whether the PPO histogram is above or below zero. If you choose “RBF,” your price candles reflect whether price is above or below the RBF trail. Most traders will pick one and stick with it so the chart communicates a single bias at a glance.
The divergence module is optional and is designed to be a confirmation layer rather than a primary trigger. When enabled, it can mark regular divergence and hidden divergence, and it lets you decide what the pivots should be based on. The divergence source can be the PPO histogram or the R line, depending on whether you want divergence measured on the cleaner momentum component or on the combined series. “Key off pivots” determines whether pivot detection is driven by oscillator pivots or by price pivots. If you choose oscillator pivots, divergence anchors are found where the oscillator makes pivot highs or lows and those are compared against price at the same points. If you choose price pivots, the pivots are taken from price first and the oscillator value at those pivot bars is used for the comparison, which can feel more intuitive when you want divergence to respect obvious swing structure on the chart. Pivot Left and Pivot Right control how strict the swing definition is, larger values create fewer but more meaningful pivots and smaller values create more frequent signals. “Mark on Price Chart” adds tiny markers on the candles at the pivot location so you can see where the divergence event was confirmed, while the oscillator panel uses lines and labels to make the divergence relationship obvious.
For trading, the cleanest way to use this tool is to separate “bias” from “timing.” The RBF Price Trail is your bias filter because it is structure-like and tends to hold and ratchet rather than constantly drifting. When price is closing above the trail and the trail is colored bullish, you treat the market as long-biased and you focus on long setups, pullbacks, and continuation entries. When price is closing below the trail and the trail is bearish, you treat the market as short-biased and you focus on short setups, rallies, and continuation shorts. The PPO histogram is then your timing and pressure confirmation. In an up-bias, the highest quality continuation conditions are when the histogram is above zero and stays above zero through pullbacks, because that means the shorter-term pressure is still supporting the longer-term drift. When the histogram dips below zero during an up-bias, it is a warning that the daily component is now opposing, which often corresponds to a deeper pullback, a rotation, or a period of consolidation, so you either wait for the histogram to recover above zero or you tighten expectations and manage risk more aggressively. In a down-bias, the mirror logic applies: the best continuation conditions are when the histogram is below zero, and pushes above zero tend to represent countertrend rotations or pauses inside the bearish condition.
Divergence is best used as an early warning and a location filter, not as a standalone entry button. Regular bullish divergence, where price makes a lower low but the oscillator makes a higher low, can signal bearish pressure is weakening and is most useful when it appears while price is below the RBF trail but failing to continue downward, because it often precedes a reclaim of the trail or at least a meaningful rotation. Regular bearish divergence, where price makes a higher high but the oscillator makes a lower high, can signal bullish pressure is weakening and is most useful when it appears while price is above the trail but extension is failing, because it often precedes a drop back to the trail or a full flip. Hidden divergence is a continuation concept. Hidden bullish divergence, where price makes a higher low while the oscillator makes a lower low, often shows up during pullbacks in an uptrend and can help you confirm continuation as long as the RBF bias remains bullish. Hidden bearish divergence, where price makes a lower high while the oscillator makes a higher high, often shows up during rallies in a downtrend and can help you confirm continuation as long as the RBF bias remains bearish. In practice, you’ll get the best results when you only act on divergence that aligns with the RBF bias for hidden divergence continuation, and you treat regular divergence as a caution or reversal setup only when it occurs near a meaningful swing and is followed by a bias change or a strong momentum shift on the PPO.
The most practical workflow is to keep the RBF trail visible on the price chart as your regime guide, keep the PPO histogram as your momentum confirmation, and decide in advance whether you want candle coloring to represent the PPO state or the RBF state so your eyes are not reading two different meanings at once. if you want the cleanest “trend-following” behavior, color candles by the RBF trail and use the PPO histogram as the timing trigger. If you want the cleanest “momentum-first” behavior, color candles by PPO and treat the RBF trail as the higher-level filter for whether you should press a move or fade it.

[CT] Daily & Weekly Percentage Price Oscillator Daily & Weekly Percentage Price Oscillator, or D&W PPO, is a dual-speed momentum oscillator that blends a slower “weekly-style” percentage oscillator with a faster “daily-style” percentage oscillator, then turns the relationship between them into a clean histogram that is easy to trade. The script builds four EMAs from the chart’s close. The first pair, L1 and L2, is used to create the W component, which behaves like a slow, higher-timeframe trend pressure line. W is calculated as the percentage distance between EMA(L1) and EMA(L2), normalized by EMA(L2). When W is rising and positive, it tells you the broader momentum is expanding upward, and when W is falling and negative, the broader momentum is expanding downward. The second pair, L3 and L4, creates the D component, which behaves like a faster, lower-timeframe momentum pulse, also expressed as a percentage but normalized by the same EMA(L2), so both components share a consistent “scale.” The script then combines them into R = W + D, which represents the total blended momentum, where W supplies the slow structure and D supplies the fast impulse.
The indicator is plotted as a histogram using “R − W,” and that choice is intentional. Because R = W + D, the histogram value “R − W” is mathematically identical to D. In other words, the columns you see are the fast momentum component, but anchored to a clear baseline that reflects whether the fast component is adding to, or subtracting from, the slower component’s trend context. The zero line is the equilibrium point where R equals W, meaning the fast component is neutral relative to the slow trend context. When the histogram is above zero, the fast component is contributing positive momentum and the script colors the columns with the Bull color, indicating that R is above W and the short-term push is aligned to the upside. When the histogram is below zero, the fast component is contributing negative momentum and the script colors the columns with the Bear color, indicating that R is below W and the short-term push is aligned to the downside. If you enable “Color price bars,” the chart candles are painted with the same logic so you can visually stay in sync with the fast momentum regime without staring at the panel.
How to trade it comes down to treating the histogram as your actionable trigger layer and using its behavior around the zero line as the decision boundary. A basic long framework is to prioritize long trades when the histogram is above zero and either expanding or printing consecutive positive columns, because that tells you the fast momentum pulse is supportive and not fighting the current regime. The cleanest long entries usually occur when the histogram flips from negative to positive and holds above zero for at least a bar or two, because that transition often marks the shift from pullback pressure into renewed upside impulse. You can add selectivity by watching for a “dip and re-strengthen” pattern above zero: after a positive run, the histogram contracts toward the baseline without breaking materially below it, then turns back up, which often corresponds to a controlled pullback followed by continuation. A basic short framework is the mirror image: prioritize shorts when the histogram is below zero and expanding downward, and treat flips from positive to negative that hold below zero as the higher-quality transition into downside impulse. In both directions, the histogram is especially useful for avoiding trades during momentum dead zones, because when columns chop tightly around the zero line with frequent flips, it is signaling indecision and a lack of clean directional impulse, which is where most “false starts” tend to happen.
Risk management with this tool is straightforward because the oscillator gives you a natural invalidation concept. For long trades, a common invalidation is the histogram losing the zero line and staying negative, since that indicates the fast component has turned from supportive to opposing. For short trades, invalidation is the histogram regaining the zero line and holding positive. Another practical way to manage trades is to use histogram contraction as an early warning that the impulse is weakening. If you are long and positive columns begin to shrink toward zero for several bars, you can tighten risk, take partials, or wait for a fresh expansion before adding. If you are short and negative columns begin to shrink toward zero, the same concept applies. The optional W line can be shown if you want a visual anchor of the slow component; while the histogram is already built to reflect the fast component relative to the slow context, viewing W can help you quickly recognize whether the larger momentum backdrop is generally rising or falling, which can be used as an additional bias filter for trade selection.
In practice, the D&W PPO is best used as a momentum alignment and timing tool: the slow component defines the “weather,” the fast component defines the “wind,” and the histogram tells you whether the wind is pushing with the weather or pushing against it. When the histogram is cleanly one-sided and expanding, it supports continuation-style trading and trend-following entries. When the histogram is choppy around zero, it warns you that conditions are rotational and patience usually pays.

ROC+ADX Trend & Momentum System### Code Analysis: ROC+ADX Trend & Momentum System (v5 Pine Script)
#### **Core Function**
This Pine Script indicator integrates **Rate of Change (ROC)** and **Average Directional Index (ADX)** to build a professional trend-momentum trading system, which identifies trend strength, momentum changes, price divergences and generates actionable long/short trading signals for financial markets (stocks, crypto, forex). It features coordinated visual display, adaptive volatility adjustment and a comprehensive scoring mechanism for trend evaluation.
#### **Key Features (Concise)**
1. **Hybrid Indicator Logic**
Combines **ROC (12/6-period, EMA-smoothed)** (measures price momentum) and **ADX (14-period)** (identifies trend strength/direction, with +DI/-DI for trend bias), forming a dual-dimension analysis of trend + momentum.
2. **Adaptive Dynamic Threshold**
Adjusts momentum thresholds in real time based on **14-period ATR volatility**; higher market volatility raises thresholds, lower volatility lowers them, ensuring signal accuracy across different market conditions.
3. **Multi-Category Trading Signals**
Generates 4 core signal types: trend breakout (long/short), momentum boost/drop, trend reversal, and price-ROC bullish/bearish divergence, all filtered by ADX trend validity.
4. **Comprehensive Trend Scoring System**
Calculates a **0-100 trend score** (integrates ADX strength, ROC momentum, direction consistency, momentum persistence) and classifies trend intensity into 5 levels (Extreme/Strong/Medium/Weak/None).
5. **Coordinated Visual Display**
Supports scalable unified display for ROC & ADX values (custom scale factors), with color-coded lines, momentum histograms, heatmap background and reference lines for intuitive trend judgment.
6. **Informative Dashboard & Alerts**
Embeds a top-right info panel showing real values (ROC, ADX, volatility), trend level and active signals; includes multi-tier alert conditions for all key signals (breakout, reversal, divergence).
7. **High Customizability**
Full input configurability for all core parameters (periods, thresholds, scale factors) and visual toggles (show/hide ROC/ADX, signals, heatmap, reference lines).
#### **Technical Highlights**
- Uses EMA smoothing for ROC/ADX to reduce false signals;
- Identifies ROC momentum & acceleration for precise trend phase judgment;
- ADX grading (strong/weak/oscillation) filters invalid signals in sideways markets;
- Color-coded elements (lines, histograms, heatmap) reflect real-time trend/momentum status;
- Non-overlay layout ensures clear separation from price charts, optimized for multi-screen analysis.

ACCDv3# ACCDv3 - Accumulation/Distribution MACD with Divergence Detection
## Overview
**ACCDv3** (Accumulation/Distribution MACD Version 3) is an advanced volume-weighted momentum indicator that combines the Accumulation/Distribution (A/D) line with MACD methodology and divergence detection. It helps identify trend strength, momentum shifts, and potential reversals by analyzing volume-weighted price movements.
## Key Features
- **Volume-Weighted MACD**: Applies MACD calculation to volume-weighted A/D values for earlier, more reliable signals
- **Divergence Detection**: Identifies when A/D trend diverges from MACD momentum
- **Volume Strength Filtering**: Distinguishes high-volume confirmations from low-volume noise
- **Color-Coded Histogram**: 4-color system showing momentum direction and volume strength
- **Real-Time Alerts**: Background colors and alert conditions for bullish/bearish divergences
## Components
### 1. Accumulation/Distribution (A/D) Line
The A/D line measures buying and selling pressure by comparing the close price to the trading range, weighted by volume:
```
A/D = Σ ((2 × Close - Low - High) / (High - Low)) × Volume
```
- **Rising A/D**: More accumulation (buying pressure)
- **Falling A/D**: More distribution (selling pressure)
- **Doji Handling**: When High = Low, contribution is zero (avoids division errors)
### 2. Volume-Weighted MACD
Instead of simple EMAs, the indicator weights A/D values by volume:
- **Fast Line** (default 12): `EMA(A/D × Volume, 12) / EMA(Volume, 12)`
- **Slow Line** (default 26): `EMA(A/D × Volume, 26) / EMA(Volume, 26)`
- **MACD Line**: Fast Line - Slow Line (green line)
- **Signal Line** (default 9): EMA or SMA of MACD (orange line)
- **Histogram**: MACD - Signal (color-coded columns)
This volume-weighting ensures that periods with higher volume have greater influence on the indicator values.
### 3. Histogram Color System
The histogram uses 4 distinct colors based on **direction** and **volume strength**:
| Condition | Color | Meaning |
|-----------|-------|---------|
| Rising + High Volume | **Dark Green** (#1B5E20) | Strong bullish momentum with volume confirmation |
| Rising + Low Volume | **Light Teal** (#26A69A) | Bullish momentum but weak volume (less reliable) |
| Falling + High Volume | **Dark Red** (#B71C1C) | Strong bearish momentum with volume confirmation |
| Falling + Low Volume | **Light Red/Pink** (#FFCDD2) | Bearish momentum but weak volume (less reliable) |
Additional shading:
- **Light Cyan** (#B2DFDB): Positive but not rising (momentum stalling)
- **Bright Red** (#FF5252): Negative and accelerating down
### 4. Divergence Detection
Divergence occurs when A/D trend and MACD momentum move in opposite directions:
#### Bullish Divergence (Green Background)
- **Condition**: A/D is trending up BUT MACD is negative and trending down
- **Interpretation**: Accumulation increasing while momentum appears weak
- **Signal**: Potential bullish reversal or continuation
- **Action**: Look for entry opportunities or hold long positions
#### Bearish Divergence (Red Background)
- **Condition**: A/D is trending down BUT MACD is positive and trending up
- **Interpretation**: Distribution increasing while momentum appears strong
- **Signal**: Potential bearish reversal or weakening uptrend
- **Action**: Consider exits, tighten stops, or prepare for reversal
## Parameters
| Parameter | Default | Range | Description |
|-----------|---------|-------|-------------|
| **Fast Length** | 12 | 1-50 | Period for fast EMA (shorter = more sensitive) |
| **Slow Length** | 26 | 1-100 | Period for slow EMA (longer = smoother) |
| **Signal Smoothing** | 9 | 1-50 | Period for signal line (MACD smoothing) |
| **Signal Line MA Type** | EMA | SMA/EMA | Moving average type for signal calculation |
| **Volume MA Length** | 20 | 5-100 | Period for volume average (strength filter) |
## Usage Guide
### Reading the Indicator
1. **MACD Lines (Green & Orange)**
- **Crossovers**: When green crosses above orange = bullish, below = bearish
- **Distance**: Wider gap = stronger momentum
- **Zero Line**: Above = bullish bias, below = bearish bias
2. **Histogram Colors**
- Focus on **dark colors** (dark green/red) for high-confidence signals
- Be cautious with **light colors** (teal/pink) - wait for volume confirmation
- Watch for **rising red bars** (V-bottom pattern) = potential bullish reversal
- Watch for **falling green bars** (Λ-top pattern) = potential bearish reversal
3. **Background Divergence Alerts**
- **Green background**: Bullish divergence - consider long entries
- **Red background**: Bearish divergence - consider exits or shorts
- Best used in combination with price action and support/resistance levels
### Trading Strategies
#### Trend Following
1. Wait for MACD to cross above zero line with dark green histogram
2. Enter long when histogram shows consecutive dark green bars
3. Exit when histogram turns light green or red appears
#### Divergence Trading
1. Wait for background divergence alert (green or red)
2. Confirm with price action (support/resistance, candlestick patterns)
3. Enter on next dark-colored histogram bar in divergence direction
4. Set stops beyond recent swing high/low
#### Volume Confirmation
1. Ignore signals during low-volume periods (light colors)
2. Take aggressive positions during high-volume confirmations (dark colors)
3. Use volume strength as position sizing guide (larger size on dark bars)
### Best Practices
✓ **Combine with price action**: Don't rely on indicator alone
✓ **Wait for dark colors**: High-volume bars are more reliable
✓ **Watch for divergences**: Early warning signs of reversals
✓ **Use multiple timeframes**: Confirm signals across 1m, 5m, 15m
✓ **Respect zero line**: Trading direction should align with MACD side
✗ **Don't chase light-colored signals**: Low volume = lower reliability
✗ **Don't ignore context**: Market structure and levels matter
✗ **Don't over-trade**: Wait for clear, high-volume setups
✗ **Don't ignore alerts**: Divergences are early warnings
## Technical Details
### Volume-Weighted Calculation Method
Traditional MACD uses simple price EMAs. ACCDv3 weights each A/D value by its corresponding volume:
```pine
// Volume-weighted fast EMA
close_vol_fast = ta.ema(ad × volume, fast_length)
vol_fast = ta.ema(volume, fast_length)
vw_ad_fast = close_vol_fast / vol_fast
// Same for slow EMA
close_vol_slow = ta.ema(ad × volume, slow_length)
vol_slow = ta.ema(volume, slow_length)
vw_ad_slow = close_vol_slow / vol_slow
// MACD is the difference
macd = vw_ad_fast - vw_ad_slow
```
This ensures high-volume periods have proportionally more impact on the indicator.
### Volume Strength Filter
Determines whether current volume is above or below average:
```pine
vol_avg = ta.sma(volume, vol_length)
vol_strength = volume > vol_avg
```
Used to select dark (high volume) vs light (low volume) histogram colors.
### Divergence Logic
```pine
// A/D trending up if above its 5-period SMA
ad_trend = ad > ta.sma(ad, 5)
// MACD trending up if above zero
macd_trend = macd > 0
// Divergence when trends oppose
divergence = ad_trend != macd_trend
// Specific conditions
bullish_divergence = ad_trend and not macd_trend and macd < 0
bearish_divergence = not ad_trend and macd_trend and macd > 0
```
## Alerts
The indicator includes built-in alert conditions:
- **Bullish Divergence**: "Bullish Divergence: A/D trending up but MACD trending down"
- **Bearish Divergence**: "Bearish Divergence: A/D trending down but MACD trending up"
To enable:
1. Click "Create Alert" button in TradingView
2. Select "ACCDv3" as condition
3. Choose "Bullish Divergence" or "Bearish Divergence"
4. Configure notification method (popup, email, webhook, etc.)
## Comparison with Standard MACD
| Feature | Standard MACD | ACCDv3 |
|---------|---------------|---------|
| **Input** | Close price | Accumulation/Distribution line |
| **Weighting** | Simple EMA | Volume-weighted EMA |
| **Divergence** | Price vs MACD | A/D vs MACD |
| **Volume Analysis** | None | Built-in strength filter |
| **Color System** | 2 colors (up/down) | 4+ colors (direction + volume) |
| **Leading/Lagging** | Lagging | More leading (volume-weighted) |
## Example Scenarios
### Scenario 1: Strong Bullish Signal
- **Chart**: MACD crosses above zero line
- **Histogram**: Dark green bars (#1B5E20) appearing
- **Volume**: Above 20-period average
- **Action**: Enter long, strong momentum with volume confirmation
### Scenario 2: Weak Bearish Signal
- **Chart**: MACD crosses below zero line
- **Histogram**: Light pink bars (#FFCDD2) appearing
- **Volume**: Below 20-period average
- **Action**: Avoid shorting, low volume = unreliable signal
### Scenario 3: Bullish Divergence Reversal
- **Chart**: Price making lower lows
- **Indicator**: A/D line trending up, MACD negative
- **Background**: Green shading appears
- **Histogram**: Transitions from red to dark green
- **Action**: Look for long entry on next dark green bar
### Scenario 4: V-Bottom Reversal
- **Chart**: Downtrend in place
- **Histogram**: Red bars start rising (becoming less negative)
- **Pattern**: Forms "V" shape at bottom
- **Confirmation**: Transitions to dark green bars
- **Action**: Bullish reversal signal, consider long entry
## Timeframe Recommendations
- **1-minute**: Scalping, very fast signals (noisy, use with caution)
- **5-minute**: Intraday momentum trading (recommended)
- **15-minute**: Swing entries, clearer trend signals
- **1-hour+**: Position trading, major trend identification
## Limitations
- **Requires volume data**: Will not work on instruments without volume
- **Lag during consolidation**: MACD is inherently trend-following
- **False signals in chop**: Sideways markets generate noise
- **Not a standalone system**: Should be combined with price action and risk management
## Version History
- **v3**: Removed traditional price MACD, using only volume-weighted A/D MACD with A/D divergence
- **v2**: Added A/D divergence detection, volume strength filtering, enhanced histogram colors
- **v1**: Basic MACD on A/D line with volume-weighted calculation
## Support & Further Reading
For questions, updates, or to report issues, refer to the main project documentation or contact the developer.
**Related Indicators in Suite:**
- **VMACDv3**: Volume-weighted MACD on price (not A/D)
- **RSIv2**: RSI with A/D divergence
- **DMI**: Directional Movement Index with A/D divergence
- **Elder Impulse**: Bar coloring system using volume-weighted MACD
---
*This indicator is for educational purposes. Always practice proper risk management and never risk more than you can afford to lose.*

able MACD Overview
Purpose: The indicator combines the traditional MACD (Moving Average Convergence Divergence) with a short-term “forecast” (projection) of MACD/histogram values to give early warning of momentum changes.
Typical outputs:
MACD line (fastEMA − slowEMA)
Signal line (EMA of MACD)
Histogram (MACD − signal)
Forecasted MACD or histogram projected N bars ahead
Optional buy/sell markers and alert conditions
Add the indicator to TradingView (Installation)
Open TradingView and the chart you want to apply the indicator to.
Click “Pine Editor” at the bottom of the chart.
Copy the contents of able_macd_forecast.pine into the Pine Editor window.
Click “Add to chart” (or Save then Add to chart). If it’s a study, it will appear on the chart below price.
If you plan to re-use the script, click Save and give it a meaningful name.
Inputs / Parameters (typical) Note: exact input names may differ in your script. Replace the names below with the script’s input labels when you inspect it.
Source: price source for calculations (close, hl2, etc.).
Fast Length: length for the fast EMA (commonly 12).
Slow Length: length for the slow EMA (commonly 26).
Signal Length: length for the MACD signal EMA (commonly 9).
Forecast Length / Horizon: how many bars ahead the script projects the MACD/histogram (e.g., 1–5).
Forecast Method / Smoothing: choice of projection method (linear regression, EMA extrapolation, simple slope * N, etc.) if available.
Histogram Thresholds: numeric thresholds to emphasize significant momentum (optional).
Show Forecast: toggle on/off the forecast plot.
Alerts On/Off toggles: enable or disable alert conditions baked into the indicator.
Visual / Style settings: colors, plot thickness, histogram style (columns/areas), show labels, show buy/sell arrows.
How the indicator is typically calculated (summary)
MACD line = EMA(source, fast) − EMA(source, slow)
Signal line = EMA(MACD line, signal length)
Histogram = MACD − Signal
Forecast = method-specific short-term projection of MACD or histogram (for example: extend the last slope forward, apply linear regression to MACD values and extrapolate N bars, or apply an additional smoothing and extend that value) Note: For exact math, I need to inspect the script; this is the typical approach.
How to read the indicator (signals & interpretation)
Bullish signal:
MACD line crossing above the signal line (MACD cross up).
Histogram turns positive (cross above zero).
Forecast shows MACD/histogram moving higher in the next N bars (if forecast is positive or trending up).
Bearish signal:
MACD line crossing below the signal line (MACD cross down).
Histogram turns negative (cross below zero).
Forecast shows MACD/histogram moving lower ahead.
Confirmations:
Use price action (higher highs/lows for bullish, lower highs/lows for bearish).
Volume or other momentum/confluence indicators (RSI, ADX).
Divergences:
Bullish divergence: price makes lower low while MACD histogram makes higher low.
Bearish divergence: price makes higher high while MACD histogram makes lower high.
Forecast behavior:
If the forecast leads the MACD cross (forecast crosses before the current MACD does), it’s an early warning.
Use caution: forecasts are prone to false signals; always confirm.
Common trading setups using this indicator
Conservative:
Wait for MACD to cross signal + histogram above zero + forecast already trending same direction.
Use stop below recent swing low (for long) or above recent swing high (for short).
Aggressive (early entry):
Enter when forecast turns positive while MACD still below signal (anticipating cross).
Use tighter stops and smaller position sizes.
Exit rules:
Opposite MACD cross, histogram flipping sign, or a target based on risk-reward.
Use trailing stop based on ATR or structure.
Example settings for different timeframes (starting points)
Scalping / 5–15 min:
Fast 8, Slow 21, Signal 5, Forecast 1–2
Intraday / 1H:
Fast 12, Slow 26, Signal 9, Forecast 2–3
Swing / 4H–Daily:
Fast 12, Slow 26, Signal 9, Forecast 3–5 Adjust based on the asset volatility and backtests.
Adding alerts (TradingView)
Click the “Alerts” button (clock icon) or press Alt + A.
In the Condition dropdown, select the indicator name (able_macd_forecast) and choose a plotted series or built-in alert condition (if the script uses alertcondition).
Common alert types:
MACD crosses Signal (Crossing)
Histogram crosses 0 (Crossing)
Forecast crosses 0 or Forecast trend change (if provided)
Message templates:
“{{ticker}}: MACD crossed above signal on {{interval}}”
“{{ticker}} Forecast positive: MACD forecast shows upward momentum”
Customize the message for your trade automation or notifications.
Configure frequency (Only once, Once per bar, or Once per bar close) — for signals like crossovers, “Once per bar close” is usually safer to avoid repainting issues. Note: If the script includes alertcondition() calls with explicit IDs/messages, use those directly — they are the most reliable for automation.
Backtesting / Strategy conversion
If this script is a study (indicator), you can:
Convert it to a strategy by adding strategy.* order calls (strategy.entry, strategy.close) using the entry/exit logic you prefer, or
Use TradingView’s “Bar Replay” to manually test signals across different markets/timeframes.
If you want, I can help convert or write a strategy wrapper that uses the indicator’s signals to place backtest trades (I’ll need the code).
Practical tips & best practices
Use higher timeframe confirmation for lower-timeframe entries (e.g., check daily MACD momentum before trading 15m signals).
Beware of choppy markets; MACD / forecast may produce whipsaws. Combine with trend filters (moving average direction, ADX).
If you rely on forecasted values, prefer alerts “on bar close” when possible to reduce false alerts from intra-bar noise.
Tune parameters for the specific asset (FX, crypto, stocks have different behavior).
Record each signal and outcome for a sample period (20–100 trades) to evaluate performance.
Troubleshooting
Indicator won’t add: verify Pine version in script header (//@version=4 or //@version=5). TradingView may reject scripts with unsupported version syntax.
Plots missing: check script inputs (Some scripts hide plots if toggles are off).
Alerts firing too often: change alert frequency to “Once per bar close” or adjust threshold values.
Forecast seems to repaint: some forecast methods can repaint (use “bar_index” or store values only on closed bars, or use non-repainting forecast methods). Ask me to inspect the script for repainting logic.
What I can do next (recommended)
If you paste the content of able_macd_forecast.pine here, I will:
Produce a precise, line-by-line usage guide mapping to the exact input names and default values.
Show the exact plotted series names and how to reference them for alerts.
Point out any repainting risks and suggest fixes.
Provide example alert messages that match the script’s alertcondition IDs (if any).
Optionally convert it into a strategy for backtesting, or add non-repainting forecast logic if needed.
