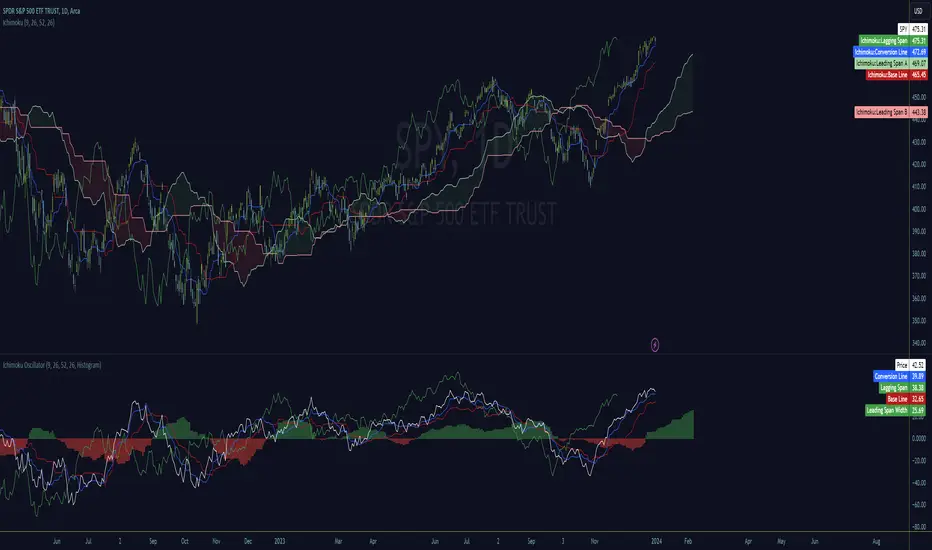
Ichimoku OscillatorFans of the Ichimoku cloud indicator may enjoy this lower study version.
It's all the exact same representation but the cloud is converted to an oscillation in histogram or classic cloud fill formats.
All of the original lines, except Kumo cloud lines, are provided but adjusted to be positionally accurate to the oscillation values.
The oscillation value is calculated simply by absolute subtraction of span a and b lines and as such become an additional width detection mechanism in what I consider to be a slightly cleaner display.
Since the entire cloud can be removed from the main chart, it's necessary to understand price location relative to the values which is calculated and displayed as the 'Price' plot. It is positionally accurate to the oscillation and cross signals can be observed.
My hope is that this serves as a foundation for others to create interesting Ichimoku lower study indicators, and to provide relief to traders looking for cleaner main charts.
I've done my best to ensure accuracy but if any issues are found please let me know.
Feedback and suggestions are welcome, enjoy.
Search in scripts for "ichimoku"
Ichimoku MA BandsThis indicator is based on the price average of the Ichimoku Strategy taking into account the last twenty five bars.
The blue band represents an upward momentum whereas the white band represents a downward momentum.
The red line is the 50 EMA which is used as a dynamic support resistance level for this strategy.
This indicator also has alerts that can be enabled by the user.
Disclaimer :
The current script should be used in confluence with other trading strategies and not in isolation. The scripts works best on 5M and 15M Timeframes and should be used with caution on lower timeframes.
This indicator is not intended to give exact entry or exit points for a trade but to provide a general idea of the trend & determine a good range for entering or exiting the trade. Please DYOR
Credit & References :
This script uses the default technical analysis reference library provided by PineScript (denoted as ta)
Ichimoku Kinko Hyo1) Plot up to 8 moving averages or donchian channels.
2) Moving average types include SMA, EMA, Double EMA, Triple EMA, Quadruple EMA, Pentuple EMA, Zero-Lag EMA, Tillson's T3, Hull's MA, Smoothed MA, Weighted MA, Volume-Weighted MA.
3) Donchian channels can be plotted for a user specified period with upper and lower lines based on either A) highest and lowest prices or B) highest candle body (open/close) and lowest candle body (open/close) over a specified period.
4) Plot 2 arithmetic means averaging any 2 to 8 of the previously mentioned moving averages or donchian median lines.
5) Display 2 fills/clouds between any of the previously mentioned plots.
6) Enough flexibility in the script to utilize Ichimoku Kinko Hyo with correctly adjusted offsets.
7) Ichimoku Kinko Hyo is the default settings. Display additional moving averages or donchian channels for comparison.
"One Half" color scheme by Son A. Pham

Ichimoku CrossThis is a trend analysis indicator based on Ichimoku
this indicator splits the chart into :
"Buy Phase" where KijunSen > TenkanSen with "Green color"
"Sell Phase" where KijunSen < TenkanSen with "Red color"
"Cross Phase" where KijunSen = TenkanSen
Close of each candle above or below KijunSen and TenkanSen determine the strength of the trend
and is shown by 3 different green colors for Bullish Trends and 3 different red colors for Bearish Trends .

ICHIMOKU Crypto Swing StrategyThis is a crypto swing strategy designed for timeframes bigger than 1h.
The main components are
ICHOMOKU
KDJ
Average High
Average Low
Rules for entry
For long: we have the ichimoku crosses between tenkan and baselines, we have a rising kdj line and at the same time we have a increase in the average high
For short: we have the ichimoku crosses between tenkan and baselines, we have a falling kdj line and at the same time we have an increase in the average low
Rules for exit
We exit when we have inverse conditions than the initial ones used for entry.
Caution
This strategy does not use a risk management, so be careful with it !
If you have any questions let me know !

Ichimoku Cloud Strategy IdeaThis strategy idea uses the famous Ichimoku Cloud (Forward-shifted SMA-9 and SMA-26) and Chiku (52-candle lagged close price) with its default parameters. This strategy is slow and issues few signals. However, this is one of the most performant long-term trend trading strategies. It usually works well on 1D and 4H timeframes and even better on trending instruments. This is the implementation used in QuantCT app.
You can set operation mode to be Long/Short or long-only.
You also can set a fixed stop-loss or ignore it so that the strategy act solely based on entry and exit signals.
Trade Idea
When both close price and chiku are above the cloud, market is considered rising (bullish) and the plotted cloud becomes green.
When both close price and chiku are below the cloud, market is considered falling (bearish) and the plotted cloud becomes red.
Otherwise, market is considered ranging and the plotted cloud becomes orange.
Entry/Exit rules
Enter LONG right after both close price and chiku went above the cloud (i.e. when the end of the plotted cloud becomes green).
Enter SHORT right after both close price and chiku went below the cloud (i.e. when the end of the plotted cloud becomes red).
EXIT market when close price enters the cloud.
CAUTION
It's just a bare trading idea - but a profitable one. You can enhance this idea and turn it into a full trading strategy with enhanced risk/money management and optimizing it, and you ABSOLUTELY should do this!
DON'T insist on using Long/Short mode on all instruments! This strategy performs much better in Long-Only mode on several instruments (Like BTC , ETH, etc.), and also performs better in Long/Short mode on other instruments (Like VET, BNT, etc.).

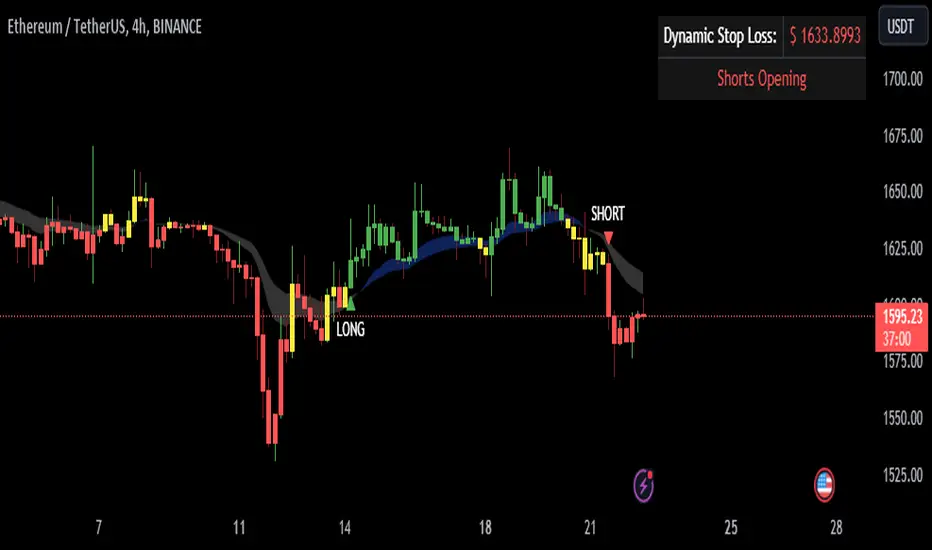
Ichimoku Cloud Strategy Long Only [Bitduke]Slightly modificated and optimized for Pine Script 4.0, Ichimoku Cloud Strategy which, suddenly, good suitable for the several crypto assets.
Details:
Enter position when conversion line crosses base line up, and close it when the opposite happens.
Additional condition for open / close the trade is lagging span, it should be higher than cloud to open position and below - to close it.
Backtesting:
Backtested on SOLUSDT ( FTX, Binance )
+150% for 2021 year, 8% dd
+191% for all time, 32% dd
Disadvantages:
- Small number of trades
- Need to vary parameters for different coins (not very robust)
Should be tested carefully for other coins / stock market. Different parameters could be needed or even algo modifications.
Strategy doesn't repaint.


Ichimoku Kinko Hyo SignalsIchimoku Kinko Hyo Signals
This script show signals based on my understanding in Ichimoku Kinko Hyo.
/!\ Please do not follow signals blindly and always make your own analysis /!\
Buy : Han Ne lines are up, price is up, and also stochastic (K=30, D=10) is up
Strong Buy : Is a Sanyaku Kouten and can show a potential reverse in current tendance and Buy Signal conditions
Sell : Han Ne lines are down, price is down, and also stochastic (K=30, D=10) is down
Strong Sell : Is a Sanyaku Gyakuten and can show a potential reverse in current tendance and Sell Signal conditions
Exit : Show a potential time to take profit based on previous Sell, Strong Sell, Buy, or Strong Buy signal

Ichimoku Kinko Hyo and moreI am publishing my updated Ichimoku ++ study with a more suitable title. Future updates will take place with this version.
Description:
The intention of this script is to build/provide a kind of work station / work bench for analysing markets and especially Bitcoin . Another goal is to get maximum market information while maintaining a good chart overview. A chart overloaded with indicators is useless because the structure of the chart is more difficult to see. The chart should be clear and market structure should be easy to see. The script allows you to add indicators and signals in different visualizations to better assess the quality of signals and the sentiment of the market.
A general advise:
Use the included indicators and signals in a confluent way to get stoploss, buy and sell entry points. SR clusters can be identified for use in conjunction with Fractals and other indicators as entry and exit pints. My other scripts can also help. Prefer 4 hours, daily and a longer time frame. There is no "Holy Grail" :).

Ichimoku ++ public v0.9Description:
The intention of this script is to build/provide a kind of work station / work bench for analysing markets and especially Bitcoin . Another goal is to get maximum market information while maintaining a good chart overview. A chart overloaded with indicators is useless because it obscures the view of the chart as the most important indicator. The chart should be clear and market structure should be easy to see. In addition, some indicator signals can be activated to better assess the quality of signals from the past. The chart environment or the chart context is important for the quality of a signal.
The intention of this script is not to teach someone how to trade or how to use these Indicators but to provide a tool to analyse markets better and to help to draw conclusions of market behaviour in a higher quality.
A general advise:
Use the included indicators and signals in a confluent way to get stoploss, buy and sell entry points. SR clusters can be identified for use in conjunction with fractals as entry and exit pints. My other scripts can also help. Prefer 4 hours, daily and a longer time frame. There is no "Holy Grail" :).
If someone is new to trading you should learn about the indicators first. Definitely learn about Ichimoku Cloud Indicator.
Integrated indicators are:
Ichimoku Cloud and signals
Parabolic SAR and signal
ATR stop
Bollinger Bands
EMA / SMA and background color as signal
Williams Fractals and signal
Puell Multiple signal

Best Ichimoku ScreenerHello traders
Continuing deeper and stronger with the screeners' educational series one more time
I - Concept
This screener detects whether the price goes above, below or stays in between the Ichimoku cloud
II - How did I set the screener
The visual signals are as follow:
- square: Above or Below
Then the colors are:
- green when above the cloud
- red when below the cloud
- orange when in the cloud
Best regards,
Dave

Ichimoku Kinkō hyō Keizen 改善
The script is not finnished yet and show's an other interpretation of how it could be scripted
Step -1 is complete... Basic Ichimoku with asjutable length and editable lines colors and visibilities.
Step -2 in progress... Adding ability to une multiple Spans, sens and Kumo on higher and lower timeframe.
Your Step : Like and Share ;) have a good year 2020 !
2020-01-06 /--------/ -R.V.
Ichimoku Double Cloud + AutoFibCombined indicator using an ichimoku double cloud derivative.
Ideal use is option swings, using traditional ichimoku rules, targets are adjusted to the current ATR.
Appropriate strikes closest to one of these lines for assisted price targeting.
Ichimoku A/D Breakoutthis is basically a clone of the super a/d indicator but we're using a standard ichimoku as the source for the trend instead of the supertrend indicator

Combination Ichimoku CloudThis indicator allows you to display two Ichimoku Cloud settings simultaneously. Each variable can be set independently, including its visibility.
Basically a way to combine two "Ichimoku Cloud" indicators into one slot.

Ichimoku+SMAsmoothedSMA_smoothed with Ichimoku added makes good yet still simple strategy perhaps useful to APIbot programmers

3 HULLs & ICHIMOKU divided by PRICEBasically just another form of moving average, for quick swings, built for testing/use with API cryptobots, simple switch from buy to sell.
Hull MA(2 candles back) times 3 plus Ichimoku divided by price(1 candle back) = value1
Hull MA(3 candles back) times 3 plus Ichimoku divided by price(1 candle back) = value2
if value1>value2 then buy else sell
calculates price from 1 candle back, and calculates signal from 2nd and 3rd candle prices, so no repainting? so best on low timeframes.
for when use in bot, would not need 1 candle lag. Lag is for TV chartists to not have to suffer repainting.
Bots do not repaint. they are not "painting" anything, they simply open or close orders, which cannot be "repainted"
but here on TV chart, when you refresh the browser page, the script recalculates, and signals may be repainted.
hopefully this will not repaint. please test. thankyou

^-^ Three Ichimoku Clouds ^-^ 4x4 Moving Average x EMA ^-^Three ichimoku clouds
Four moving averages
Four exponential moving averages


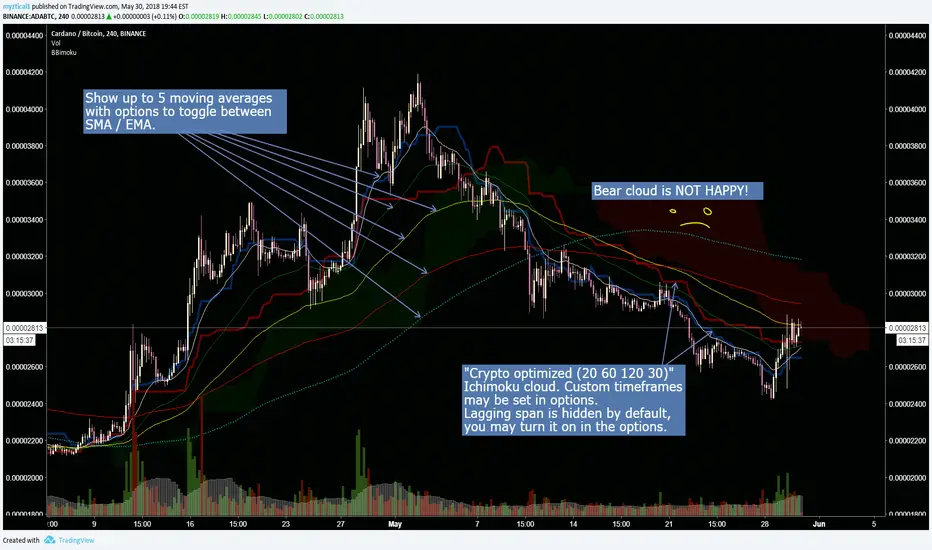
Crypto optimized Ichimoku and 5 variable SMA / EMAThis script has the option for showing up to 5 moving averages with options to toggle between SMA / EMA. Also includes crypto optimized Ichimoku cloud.
********This script was pieced together from various other's contributions from this site, and I cannot remember who the original authors are*******
Im just combining them to help others with free accounts and limited indicator availability like myself.
I hope this can help someone! Thank you and enjoy.
