OutsiderEdge - Adaptive Node Efficiency Function (ANEF)Overview - What is ANEF?
ANEF is a zero-centered oscillator that blends price efficiency, effective volume around VWAP (node proximity), order-flow imbalance (uptick/downtick proxy), and returns volatility into a single, normalized score. The goal is to help you spot efficient breakouts and inefficient mean-reversions in a way that’s transparent, systematic, and easy to align with your own analysis.
Users can combine ANEF’s components to build rules such as: “ Only consider short breakout signals when trend context is bearish and the ANEF score pushes into the Efficient Zone ,” or “ Look for mean-reversion setups when the ANEF score sinks into the Inefficient Zone while trend context remains bullish. ”
While ANEF can stand on its own, it also works well as a secondary confirmation layer to a user’s primary process (volume profile, price action, S/R, market structure, or your preferred overlays).
🔹 FEATURES
Below is each ANEF component/feature in the order that typically leads to the most confluence.
ANEF Core (Normalized Score)
Combines a price change term with effective volume near VWAP and order-flow imbalance, scaled by volatility and normalized into a zero-centered oscillator.
Read it like a pressure gauge: high positive values = efficient upside impulse risk; deep negative values = inefficient pressure that often reverts.
Efficient & Inefficient Zones (Thresholds)
Two user-set levels (default ≥ +4.6 and ≤ −4.6) to quickly see when ANEF pushes into efficient breakout territory (top zone) or inefficient territory (bottom zone).
Thresholds are not overbought/oversold; they’re contextual “efficiency bands.”
2nd-Signal Confirmation (Optional)
An opt-in rule to ignore the first signal of a type and only print the second occurrence within X bars (default 6).
Reduces one-off noise without repainting or lookahead.
Trend Context (EMA-based Wave, Optional)
A lightweight EMA context that lets you filter signals (e.g., only show ▼ in downtrend, only show ▲ in uptrend).
The context is plotted as a sub-pane wave centered around zero so it doesn’t fight for price-panel space.
Clean Alerts (Raw & Confirmed)
Raw alerts fire at zone interactions.
Confirmed alerts respect the 2nd-signal rule and (optionally) the trend filter.
Price-Panel Markers (through force_overlay)
Even with the oscillator in a separate pane, ANEF can print mini markers on the main chart.
Useful to correlate impulses/reversions with structure, S/R, or higher-TF levels.
🔹 USAGE
In the examples below, you see chart snapshot with five labeled points of (in)efficiency breakouts.
ICMARKETS:UK100
Point 1 — Efficient Downside Breakout (▼)
ANEF surges into the Efficient Zone, indicating downside momentum that’s aligned with node volume/imbalance and volatility. Typical use: trend-following continuation, takeprofit on existing long or tightening risk on existing shorts (invalidations above recent structure).
Point 2 — Inefficient Upside Reversion (▲)
First rebound after the selloff with ANEF deep in the Inefficient Zone. Not an ideal long entry on its own, but a good management cue: take partial profits on shorts or tighten stops as an early confirmation that the drop may be exhausting.
Point 3, 4 and 5 — Inefficient Upside Reversion (▲)
Another 3x ▲ appears as price forms a higher low and ANEF prints a less extreme negative reading. With the “second-signal within X bars” option enabled, this becomes a more credible mean-reversion attempt. Possible long entries or takeprofits on existing shorts.
Trading involves substantial risk. This tool is for educational purposes only and is not financial advice. Past performance does not guarantee future results. You are solely responsible for your trading decisions and risk management.
🔹 NAVIGATING MARKET CONDITIONS
Trending phases:
Expect more time in or near the zones in the trend direction.
Consider allowing only trend-aligned signals (filter ON) and using counter zone exits for trail/partials rather than counter-trend trades.
Ranging phases:
Expect frequent dips and surges into the (In)efficient Zones and back.
Counter-moves (▲ in range downs, ▼ in range ups) can be productive with tight invalidation and the 2nd-signal rule to reduce noise.
Regime shifts:
Watch for repeated failures of one side’s signals plus cross-pane confluence (e.g., context flips while ANEF re-anchors around zero).
That sequence often marks transitions where your rules should adapt (e.g., disable the trend filter temporarily or widen your 2nd-signal window).
🔹 SETTINGS SUMMARY
ANEF Core: lengthPrice, lengthVol, lengthVolat, imbalanceCap
Zones: Efficient (≥), Inefficient (≤)
Confirmation: Require 2nd signal, Lookahead bars
Trend Filter: Enable, EMA length, optional smoothing & “only show ▲/▼ with trend”
Chart Markers: Also show on main chart (force_overlay)
Alerts: Raw vs Confirmed (pick what suits your workflow)
🔹 GOOD PRACTICES
Treat signals as context cues, not as mechanical buy/sell calls. You can align ANEF with structure (S/R, HTF bias, LVN, HVN or POC) and risk management (partials on zone exit, invalidation beyond recent swing). Start with defaults; tweak parameters to match your market/TF.
🔹 LIMITATIONS / DISCLAIMER
ANEF does not use lookahead and does not repaint, but no indicator guarantees outcomes.
Thresholds are heuristics; markets can remain efficient/inefficient longer than expected.
Use appropriate position sizing and independent validation.
Trading involves substantial risk. This tool is for educational purposes only and is not financial advice. Past performance does not guarantee future results. You are solely responsible for your trading decisions and risk management.
Release Notes
v1.0 — Initial invite-only release with: normalized ANEF core, Efficient/Inefficient zones, optional EMA trend context, 2nd-signal confirmation, raw & confirmed alerts, and optional price-panel markers via force_overlay.
Search in scripts for "imbalance"

Rapid Cumulative Delta Proxy (Close vs Close)Rapid Cumulative Delta Proxy (Close vs Close)
1. Summary
This indicator provides a powerful proxy for Cumulative Delta , offering insight into the buying and selling pressure within each candle without requiring access to specialized tick data. It works by analyzing a Lower Timeframe (LTF) of your choice and accumulating the volume based on simple price changes, then displaying the results in a clean, customizable "footprint-style" table on your main chart.
This tool is designed for traders who want to understand the underlying order flow dynamics and see whether buyers or sellers were more aggressive during the formation of a candle.
2. Key Features
Cumulative Delta Proxy: Calculates delta by comparing the close of each LTF bar to the previous one, assigning volume to either buyers or sellers.
Lower Timeframe Analysis: Gives you the flexibility to choose any LTF (e.g., 1-minute, 5-minute, or even seconds) to build your delta analysis, allowing for granular or broad views.
Historical "Footprint" Table: Displays data for the current, developing bar as well as a user-defined number of previous bars, allowing for immediate historical context.
Live Data Monitoring: The top row of the table always shows the real-time, developing values for the current bar.
Full Visual Customization: Provides extensive options to control the table's position, colors, and text styles to perfectly match your chart's theme.
3. Calculation Mechanism
The logic of this indicator is straightforward and transparent. For every single bar on your main (Higher Timeframe) chart, the script performs the following steps:
Data Collection: The script uses the request.security_lower_tf() function to gather all the close and volume data from the user-specified Lower Timeframe that falls within the current HTF bar.
Volume Allocation: It then iterates through each of these LTF bars to determine if it represented buying or selling pressure.
If an LTF bar's close is greater than the close of the previous LTF bar, its entire volume is added to a running total of Buy Volume.
If an LTF bar's close is less than the close of the previous LTF bar, its volume is added to a running total of Sell Volume.
If the closes are identical, the volume is considered neutral and is ignored.
Final Calculations: Once all the LTF bars have been processed, the final metrics for that single HTF bar are calculated:
Delta: This is the net difference between the accumulated volumes. The formula is:
Delta=TotalBuyVolume−TotalSellVolume
Imbalance %: This shows the percentage dominance of buyers or sellers relative to the total activity. The formula is:
Imbalance%= Delta / (TotalBuyVolume+TotalSellVolume) ×100
This entire process repeats for each bar on your chart, with the results stored and displayed in the historical table.
4. Settings Explained
Lower Timeframe: The most important setting. This is the timeframe the script will analyze to calculate delta. It must be a lower interval than your main chart's timeframe.
History Bar Count: Controls how many previous, closed bars of data are displayed in the table below the "Live" bar.
Table Visuals (Group):
Header Colors: Customize the text color for each column header (Buy, Sell, Delta, Imbalance).
Background Colors: Set the colors used for the conditional backgrounds on the Delta and Imbalance columns (Positive, Negative, and Neutral values).
Data Text Style: Control the color and size of all standard text in the table. Placed on one line for convenience.
Table Position: A dropdown menu to place the table in any of nine positions on your chart.
5. Trading Concepts & Examples
This is where the Delta Table truly shines. By comparing the delta data (the "Effort") with the candle on your chart (the "Result"), you can gain powerful insights.
A. Effort vs. Result Analysis
This concept helps you determine if the trading activity is actually succeeding in moving the price.
Confirmation:
High positive delta on a large green candle that closes strong. This confirms the buying pressure was effective and the trend is likely to continue.
High negative delta on a large red candle that closes weak. This confirms the selling pressure was effective.
Divergence (Sign of Reversal):
Absorption: You see very high positive delta, but the candle on the chart is small, with a long upper wick (a shooting star). This is a major warning sign. It means buyers exerted massive effort, but the result was poor because a large seller absorbed all their buying, preventing the price from rising. This often precedes a move down.
Exhaustion: You see very high negative delta, but the candle is small with a long lower wick (a hammer). This means sellers tried their best to push the price down but failed. Their effort was met with strong buying pressure, signaling selling exhaustion and a potential bottom.
B. Identifying Traps (Two-Bar Analysis)
Traps occur when a breakout or breakdown fails, catching traders on the wrong side of the market. The Delta Table makes these easy to spot.
Example of a Bull Trap:
The Bait (Bar 1): A strong green candle breaks above a key resistance level. You look at the table and see a strong positive delta, convincing traders to go long.
The Trap (Bar 2): The very next candle is a powerful red candle that closes back below the resistance level. Now, check the table for this candle—you will often see an equally strong or even stronger negative delta.
Interpretation: The initial breakout buyers are now "trapped." The aggressive negative delta on the second bar confirms that sellers have taken control, and the trapped longs will be forced to sell, fueling a sharper decline.
Example of a Bear Trap:
The Bait (Bar 1): A strong red candle breaks below a key support level, showing a strong negative delta in the table. Traders are convinced to go short.
The Trap (Bar 2): The next candle is a powerful green candle closing back above support, accompanied by a very strong positive delta.
Interpretation: The breakdown has failed. Aggressive buyers have stepped in, "trapping" the short-sellers who must now buy back their positions, adding fuel to the rally.
6. Important Notes
Repainting: This indicator does not repaint. Once a bar on your main chart closes, its calculated values in the historical table are fixed and will not change. The "Live" data row updates in real-time as the current bar forms, which is the intended and expected behavior.
1-Second Timeframe: The script allows for using second-based intervals (e.g., "1S"). Please be aware that access to second-based timeframes on TradingView requires a Premium subscription. If you do not have one, please use a minute-based interval (e.g., "1").
Historic Bars: The script can accommodate large range, does not have any max bar limit. Please be aware that large table will require heavy computing power.
7. Disclaimer
The information provided by this indicator is for educational and informational purposes only and does not constitute financial advice. All trading and investment decisions are your own and should be made with the help of a qualified financial professional. Trading financial markets involves substantial risk, and past performance is not indicative of future results. The author is not responsible for any losses you may incur as a result of using this script.

Cnagda Liquidit Trading SystemCnagda Liquidit Trading System helps spot where price is likely to trap traders and reverse, then gives simple, actionable Level to entry, place SL, and take profits with confidence. It blends imbalance zones, trend bias, order blocks, liquidity pools, high-probability fake Signal, and context-aware candle patterns into one clean workflow.
🟩🟥 Imbalance boxes: “Crowd rushed, gaps left”
What it is: Green/red boxes mark fast, one-sided moves where price “skipped” orders—think FVG-like zones that often get revisited.
Why it helps: Price frequently pulls back to “fill” these zones, creating clean retest entries with logical stops.
⏩How to use:
Green box = potential demand retest; Red box = potential supply retest. Enter on pullback into box, not on first impulse. Put stop on far side of box and aim first targets at recent swing points.
↕️ Swing bias (HH/HL vs LH/LL): “Which way is the road?”
What it is: Higher-highs/higher-lows = up-bias; Lower-highs/lower-lows = down-bias. system plots Buy/Sell OB levels aligned with that bias.
Why it helps: Trading with the broader flow reduces “hero trades” against institutions. Bias gives clearer entries and cleaner drawdowns.
⏩How to use:
Up-bias: look for long on Buy OB retests. Down-bias: look for short on Sell OB retests. Wait for a small rejection/engulfing to confirm before triggering.
🧱Order blocks: “Where big players remember”
What it is: last opposite-colored candle before an impulsive move—these zones often hold memory and reaction. system plots these as Buy/Sell OB lines.
Why it helps: Many breakouts pull back to the origin. Good entries often happen on retest, not on the breakout chase.
⏩ How to use:
Let price return into the OB, show wick rejection, and decent volume. Enter with stop beyond OB; define risk-reward before entry.
📊Volume coloring: “How Volume is move?”
What it is: Bar color reflects relative volume; inside bars are black. The dashboard also shows Volume and “Volume vs Prev.”
Why it helps: Patterns without volume often fade; volume validates strength and intent of moves.
⏩ How to use:
Favor entries where imbalance/OB/liquidity-grab coincide with higher volume. If volume is weak, reduce size or skip.
🧲 BSL/SSL liquidity pools: “Fishing for stops”
What it is: Equal highs cluster stops above (BSL); equal lows cluster stops below (SSL). system plots these and highlights the nearest one (“magnet”).
Why it helps: Price often sweeps these pools to trigger stops before reversing. This is a prime trap-reversal location.
⏩ How to use:
Watch nearest BSL/SSL. If price wicks through and closes back inside, anticipate a reversal. Trade reaction, not first poke. When price closes beyond, consider that pool mitigated and move on.
🟢🔴 Advanced liquidity grab: “Catch fakeout”
What it is: Bullish grab = makes a new low beyond a prior low but closes back above it, with a long lower wick, small body, and higher volume. Bearish is mirror. Labeled automatically.
Why it helps: It exposes trap moves (stop hunts) and often precedes true direction.
⏩ How to use:
Best when it aligns with a nearby imbalance/OB and supportive volume. Enter on reversal candle break or on retest. Stop goes beyond sweep wick.
🧠 Smart candlestick patterns (only in right place)
What it is: Engulfing, Hammer, Shooting Star, Hanging Man, Doji (with high volume), Morning/Evening Star, Piercing—but marked “effective” only if context (swing/trend/location) agrees.
Why it helps: same pattern in the wrong place is noise; in the right place, it’s signal.
⏩ How to use:
Location first (BSL/SSL/OB/imbalance), then pattern. Treat pattern as trigger/confirmation—one fresh label shows to keep chart clean.
🧭 Dashboard: “Context in a glance”
⏩ Reversal Level: current swing anchor—expect turns or reactions nearby; great for alerts and planning.
⏩ Volume vs Prev + Volume: Strength meter for signal candle—higher adds conviction.
⏩ Nearest Pool: next “magnet” area—look for sweeps/rejections there.
🧩Step-by-step trading flow (with mindset)
⏩ Set bias: HH/HL = long bias, LH/LL = short bias. Counter-trend only on clean sweeps with strong confirmation.
⏩ Find magnet: Check Nearest Pool (BSL/SSL). Focus attention there; it saves screen time.
⏩ Wait for event: Look for a sweep/grab label, or sharp rejection at pool/OB/imbalance. Avoid FOMO.
⏩ Add confluence: Stack 2–3 of these—imbalance box, OB, contextual pattern, supportive volume.
⏩Plan entry: Bullish: trigger above reversal candle high or take retest of FVG/OB. Stop below sweep wick/zone. Target at least 1:1.5–1:2.
Bearish: mirror above.
⏩Manage smartly: Take partials, move to breakeven or trail thoughtfully. Don’t drag stops inside zone out of emotion.
🎛️ Parameter tuning (to reduce human error)
⏩ swingLen: Smaller = faster but noisier; larger = cleaner but slower. Backtest first, then go live.
⏩ Tolerance (ATR or percent): ATR tolerance adapts to volatility (good for fast markets and lower TFs). Start around 0.15–0.30. In calm markets, try percent 0.05–0.15%.
⏩ minBarsGap: Start with 3–5 so equal highs/lows are truly equal—reduces false pools.
❌Common mistakes → ✅ Better habits
⏩Chasing every breakout → Wait for sweep/rejection, then confirm.
⏩Ignoring volume → Validate strength; cut size or skip on weak volume.
⏩Losing history of pools → If reviewing/backtesting, keep mitigated pools visible (dashed/faded).
⏩Over-tight tolerance/too small swingLen → Increases false signals; backtest to find balance.
📝 checklist (before entry)
⏩ Is there a nearby BSL/SSL and did a sweep/grab happen there?
⏩ Is there a close imbalance/OB that price can retest?
⏩ Do we have an effective pattern plus supportive volume?
⏩Is the stop beyond the wick/zone and RR ≥ 1:1.5?
•?((¯°·._.• 🎀 𝐻𝒶𝓅𝓅𝓎 𝒯𝓇𝒶𝒹𝒾𝓃𝑔 🎀 •._.·°¯((?•

FVG Premium [no1x]█ OVERVIEW
This indicator provides a comprehensive toolkit for identifying, visualizing, and tracking Fair Value Gaps (FVGs) across three distinct timeframes (current chart, a user-defined Medium Timeframe - MTF, and a user-defined High Timeframe - HTF). It is designed to offer traders enhanced insight into FVG dynamics through detailed state monitoring (formation, partial fill, full mitigation, midline touch), extensive visual customization for FVG representation, and a rich alert system for timely notifications on FVG-related events.
█ CONCEPTS
This indicator is built upon the core concept of Fair Value Gaps (FVGs) and their significance in price action analysis, offering a multi-layered approach to their detection and interpretation across different timeframes.
Fair Value Gaps (FVGs)
A Fair Value Gap (FVG), also known as an imbalance, represents a range in price delivery where one side of the market (buying or selling) was more aggressive, leaving an inefficiency or an "imbalance" in the price action. This concept is prominently featured within Smart Money Concepts (SMC) and Inner Circle Trader (ICT) methodologies, where such gaps are often interpreted as footprints left by "smart money" due to rapid, forceful price movements. These methodologies suggest that price may later revisit these FVG zones to rebalance a prior inefficiency or to seek liquidity before continuing its path. These gaps are typically identified by a three-bar pattern:
Bullish FVG : This is a three-candle formation where the second candle shows a strong upward move. The FVG is the space created between the high of the first candle (bottom of FVG) and the low of the third candle (top of FVG). This indicates a strong upward impulsive move.
Bearish FVG : This is a three-candle formation where the second candle shows a strong downward move. The FVG is the space created between the low of the first candle (top of FVG) and the high of the third candle (bottom of FVG). This indicates a strong downward impulsive move.
FVGs are often watched by traders as potential areas where price might return to "rebalance" or find support/resistance.
Multi-Timeframe (MTF) Analysis
The indicator extends FVG detection beyond the current chart's timeframe (Low Timeframe - LTF) to two higher user-defined timeframes: Medium Timeframe (MTF) and High Timeframe (HTF). This allows traders to:
Identify FVGs that might be significant on a broader market structure.
Observe how FVGs from different timeframes align or interact.
Gain a more comprehensive perspective on potential support and resistance zones.
FVG State and Lifecycle Management
The indicator actively tracks the lifecycle of each detected FVG:
Formation : The initial identification of an FVG.
Partial Fill (Entry) : When price enters but does not completely pass through the FVG. The indicator updates the "current" top/bottom of the FVG to reflect the filled portion.
Midline (Equilibrium) Touch : When price touches the 50% level of the FVG.
Full Mitigation : When price completely trades through the FVG, effectively "filling" or "rebalancing" the gap. The indicator records the mitigation time.
This state tracking is crucial for understanding how price interacts with these zones.
FVG Classification (Large FVG)
FVGs can be optionally classified as "Large FVGs" (LV) if their size (top to bottom range) exceeds a user-defined multiple of the Average True Range (ATR) for that FVG's timeframe. This helps distinguish FVGs that are significantly larger relative to recent volatility.
Visual Customization and Information Delivery
A key concept is providing extensive control over how FVGs are displayed. This control is achieved through a centralized set of visual parameters within the indicator, allowing users to configure numerous aspects (colors, line styles, visibility of boxes, midlines, mitigation lines, labels, etc.) for each timeframe. Additionally, an on-chart information panel summarizes the nearest unmitigated bullish and bearish FVG levels for each active timeframe, providing a quick glance at key price points.
█ FEATURES
This indicator offers a rich set of features designed to provide a highly customizable and comprehensive Fair Value Gap (FVG) analysis experience. Users can tailor the FVG detection, visual representation, and alerting mechanisms across three distinct timeframes: the current chart (Low Timeframe - LTF), a user-defined Medium Timeframe (MTF), and a user-defined High Timeframe (HTF).
Multi-Timeframe FVG Detection and Display
The core strength of this indicator lies in its ability to identify and display FVGs from not only the current chart's timeframe (LTF) but also from two higher, user-selectable timeframes (MTF and HTF).
Timeframe Selection: Users can specify the exact MTF (e.g., "60", "240") and HTF (e.g., "D", "W") through dedicated inputs in the "MTF (Medium Timeframe)" and "HTF (High Timeframe)" settings groups. The visibility of FVGs from these higher timeframes can be toggled independently using the "Show MTF FVGs" and "Show HTF FVGs" checkboxes.
Consistent Detection Logic: The FVG detection logic, based on the classic three-bar imbalance pattern detailed in the 'Concepts' section, is applied consistently across all selected timeframes (LTF, MTF, HTF)
Timeframe-Specific Visuals: Each timeframe's FVGs (LTF, MTF, HTF) can be customized with unique colors for bullish/bearish states and their mitigated counterparts. This allows for easy visual differentiation of FVGs originating from different market perspectives.
Comprehensive FVG Visualization Options
The indicator provides extensive control over how FVGs are visually represented on the chart for each timeframe (LTF, MTF, HTF).
FVG Boxes:
Visibility: Main FVG boxes can be shown or hidden per timeframe using the "Show FVG Boxes" (for LTF), "Show Boxes" (for MTF/HTF) inputs.
Color Customization: Colors for bullish, bearish, active, and mitigated FVG boxes (including Large FVGs, if classified) are fully customizable for each timeframe.
Box Extension & Length: FVG boxes can either be extended to the right indefinitely ("Extend Boxes Right") or set to a fixed length in bars ("Short Box Length" or "Box Length" equivalent inputs).
Box Labels: Optional labels can display the FVG's timeframe and fill percentage on the box. These labels are configurable for all timeframes (LTF, MTF, and HTF). Please note: If FVGs are positioned very close to each other on the chart, their respective labels may overlap. This can potentially lead to visual clutter, and it is a known behavior in the current version of the indicator.
Box Borders: Visibility, width, style (solid, dashed, dotted), and color of FVG box borders are customizable per timeframe.
Midlines (Equilibrium/EQ):
Visibility: The 50% level (midline or EQ) of FVGs can be shown or hidden for each timeframe.
Style Customization: Width, style, and color of the midline are customizable per timeframe. The indicator tracks if this midline has been touched by price.
Mitigation Lines:
Visibility: Mitigation lines (representing the FVG's opening level that needs to be breached for full mitigation) can be shown or hidden for each timeframe. If shown, these lines are always extended to the right.
Style Customization: Width, style, and color of the mitigation line are customizable per timeframe.
Mitigation Line Labels: Optional price labels can be displayed on mitigation lines, with a customizable horizontal bar offset for positioning. For optimal label placement, the following horizontal bar offsets are recommended: 4 for LTF, 8 for MTF, and 12 for HTF.
Persistence After Mitigation: Users can choose to keep mitigation lines visible even after an FVG is fully mitigated, with a distinct color for such lines. Importantly, this option is only effective if the general setting 'Hide Fully Mitigated FVGs' is disabled, as otherwise, the entire FVG and its lines will be removed upon mitigation.
FVG State Management and Behavior
The indicator tracks and visually responds to changes in FVG states.
Hide Fully Mitigated FVGs: This option, typically found in the indicator's general settings, allows users to automatically remove all visual elements of an FVG from the chart once price has fully mitigated it. This helps maintain chart clarity by focusing on active FVGs.
Partial Fill Visualization: When price enters an FVG, the indicator offers a dynamic visual representation: the portion of the FVG that has been filled is shown as a "mitigated box" (typically with a distinct color), while the original FVG box shrinks to clearly highlight the remaining, unfilled portion. This two-part display provides an immediate visual cue about how much of the FVG's imbalance has been addressed and what potential remains within the gap.
Visual Filtering by ATR Proximity: To help users focus on the most relevant price action, FVGs can be dynamically hidden if they are located further from the current price than a user-defined multiple of the Average True Range (ATR). This behavior is controlled by the "Filter Band Width (ATR Multiple)" input; setting this to zero disables the filter entirely, ensuring all detected FVGs remain visible regardless of their proximity to price.
Alternative Usage Example: Mitigation Lines as Key Support/Resistance Levels
For traders preferring a minimalist chart focused on key Fair Value Gap (FVG) levels, the indicator's visualization settings can be customized to display only FVG mitigation lines. This approach leverages these lines as potential support and resistance zones, reflecting areas where price might revisit to address imbalances.
To configure this view:
Disable FVG Boxes: Turn off "Show FVG Boxes" (for LTF) or "Show Boxes" (for MTF/HTF) for the desired timeframes.
Hide Midlines: Disable the visibility of the 50% FVG Midlines (Equilibrium/EQ).
Ensure Mitigation Lines are Visible: Keep "Mitigation Lines" enabled.
Retain All Mitigation Lines:
Disable the "Hide Fully Mitigated FVGs" option in the general settings.
Enable the feature to "keep mitigation lines visible even after an FVG is fully mitigated". This ensures lines from all FVGs (active or fully mitigated) remain on the chart, which is only effective if "Hide Fully Mitigated FVGs" is disabled.
This setup offers:
A Decluttered Chart: Focuses solely on the FVG opening levels.
Precise S/R Zones: Treats mitigation lines as specific points for potential price reactions.
Historical Level Analysis: Includes lines from past, fully mitigated FVGs for a comprehensive view of significant price levels.
For enhanced usability with this focused view, consider these optional additions:
The on-chart Information Panel can be activated to display a quick summary of the nearest unmitigated FVG levels.
Mitigation Line Labels can also be activated for clear price level identification. A customizable horizontal bar offset is available for positioning these labels; for example, offsets of 4 for LTF, 8 for MTF, and 12 for HTF can be effective.
FVG Classification (Large FVG)
This feature allows for distinguishing FVGs based on their size relative to market volatility.
Enable Classification: Users can enable "Classify FVG (Large FVG)" to identify FVGs that are significantly larger than average.
ATR-Based Threshold: An FVG is classified as "Large" if its height (price range) is greater than or equal to the Average True Range (ATR) of its timeframe multiplied by a user-defined "Large FVG Threshold (ATR Multiple)". The ATR period for this calculation is also configurable.
Dedicated Colors: Large FVGs (both bullish/bearish and active/mitigated) can be assigned unique colors, making them easily distinguishable on the chart.
Panel Icon: Large FVGs are marked with a special icon in the Info Panel.
Information Panel
An on-chart panel provides a quick summary of the nearest unmitigated FVG levels.
Visibility and Position: The panel can be shown/hidden and positioned in any of the nine standard locations on the chart (e.g., Top Right, Middle Center).
Content: It displays the price levels of the nearest unmitigated bullish and bearish FVGs for LTF, MTF (if active), and HTF (if active). It also indicates if these nearest FVGs are Large FVGs (if classification is enabled) using a selectable icon.
Styling: Text size, border color, header background/text colors, default text color, and "N/A" cell background color are customizable.
Highlighting: Background and text colors for the cells displaying the overall nearest bullish and bearish FVG levels (across all active timeframes) can be customized to draw attention to the most proximate FVG.
Comprehensive Alert System
The indicator offers a granular alert system for various FVG-related events, configurable for each timeframe (LTF, MTF, HTF) independently. Users can enable alerts for:
New FVG Formation: Separate alerts for new bullish and new bearish FVG formations.
FVG Entry/Partial Fill: Separate alerts for price entering a bullish FVG or a bearish FVG.
FVG Full Mitigation: Separate alerts for full mitigation of bullish and bearish FVGs.
FVG Midline (EQ) Touch: Separate alerts for price touching the midline of a bullish or bearish FVG.
Alert messages are detailed, providing information such as the timeframe, FVG type (bull/bear, Large FVG), relevant price levels, and timestamps.
█ NOTES
This section provides additional information regarding the indicator's usage, performance considerations, and potential interactions with the TradingView platform. Understanding these points can help users optimize their experience and troubleshoot effectively.
Performance and Resource Management
Maximum FVGs to Track : The "Max FVGs to Track" input (defaulting to 25) limits the number of FVG objects processed for each category (e.g., LTF Bullish, MTF Bearish). Increasing this value significantly can impact performance due to more objects being iterated over and potentially drawn, especially when multiple timeframes are active.
Drawing Object Limits : To manage performance, this script sets its own internal limits on the number of drawing objects it displays. While it allows for up to approximately 500 lines (max_lines_count=500) and 500 labels (max_labels_count=500), the number of FVG boxes is deliberately restricted to a maximum of 150 (max_boxes_count=150). This specific limit for boxes is a key performance consideration: displaying too many boxes can significantly slow down the indicator, and a very high number is often not essential for analysis. Enabling all visual elements for many FVGs across all three timeframes can cause the indicator to reach these internal limits, especially the stricter box limit
Optimization Strategies : To help you manage performance, reduce visual clutter, and avoid exceeding drawing limits when using this indicator, I recommend the following strategies:
Maintain or Lower FVG Tracking Count: The "Max FVGs to Track" input defaults to 25. I find this value generally sufficient for effective analysis and balanced performance. You can keep this default or consider reducing it further if you experience performance issues or prefer a less dense FVG display.
Utilize Proximity Filtering: I suggest activating the "Filter Band Width (ATR Multiple)" option (found under "General Settings") to display only those FVGs closer to the current price. From my experience, a value of 5 for the ATR multiple often provides a good starting point for balanced performance, but you should feel free to adjust this based on market volatility and your specific trading needs.
Hide Fully Mitigated FVGs: I strongly recommend enabling the "Hide Fully Mitigated FVGs" option. This setting automatically removes all visual elements of an FVG from the chart once it has been fully mitigated by price. Doing so significantly reduces the number of active drawing objects, lessens computational load, and helps maintain chart clarity by focusing only on active, relevant FVGs.
Disable FVG Display for Unused Timeframes: If you are not actively monitoring certain higher timeframes (MTF or HTF) for FVG analysis, I advise disabling their display by unchecking "Show MTF FVGs" or "Show HTF FVGs" respectively. This can provide a significant performance boost.
Simplify Visual Elements: For active FVGs, consider hiding less critical visual elements if they are not essential for your specific analysis. This could include box labels, borders, or even entire FVG boxes if, for example, only the mitigation lines are of interest for a particular timeframe.
Settings Changes and Platform Limits : This indicator is comprehensive and involves numerous calculations and drawings. When multiple settings are changed rapidly in quick succession, it is possible, on occasion, for TradingView to issue a "Runtime error: modify_study_limit_exceeding" or similar. This can cause the indicator to temporarily stop updating or display errors.
Recommended Approach : When adjusting settings, it is advisable to wait a brief moment (a few seconds) after each significant change. This allows the indicator to reprocess and update on the chart before another change is made
Error Recovery : Should such a runtime error occur, making a minor, different adjustment in the settings (e.g., toggling a checkbox off and then on again) and waiting briefly will typically allow the indicator to recover and resume correct operation. This behavior is related to platform limitations when handling complex scripts with many inputs and drawing objects.
Multi-Timeframe (MTF/HTF) Data and Behavior
HTF FVG Confirmation is Essential: : For an FVG from a higher timeframe (MTF or HTF) to be identified and displayed on your current chart (LTF), the three-bar pattern forming the FVG on that higher timeframe must consist of fully closed bars. The indicator does not draw speculative FVGs based on incomplete/forming bars from higher timeframes.
Data Retrieval and LTF Processing: The indicator may use techniques like lookahead = barmerge.lookahead_on for timely data retrieval from higher timeframes. However, the actual detection of an FVG occurs after all its constituent bars on the HTF have closed.
Appearance Timing on LTF (1 LTF Candle Delay): As a natural consequence of this, an FVG that is confirmed on an HTF (i.e., its third bar closes) will typically become visible on your LTF chart one LTF bar after its confirmation on the HTF.
Example: Assume an FVG forms on a 30-minute chart at 15:30 (i.e., with the close of the 30-minute bar that covers the 15:00-15:30 period). If you are monitoring this FVG on a 15-minute chart, the indicator will detect this newly formed 30-minute FVG while processing the data for the 15-minute bar that starts at 15:30 and closes at 15:45. Therefore, the 30-minute FVG will become visible on your 15-minute chart at the earliest by 15:45 (i.e., with the close of that relevant 15-minute LTF candle). This means the HTF FVG is reflected on the LTF chart with a delay equivalent to one LTF candle.
FVG Detection and Display Logic
Fair Value Gaps (FVGs) on the current chart timeframe (LTF) are detected based on barstate.isconfirmed. This means the three-bar pattern must be complete with closed bars before an FVG is identified. This confirmation method prevents FVGs from being prematurely identified on the forming bar.
Alerts
Alert Setup : To receive alerts from this indicator, you must first ensure you have enabled the specific alert conditions you are interested in within the indicator's own settings (see 'Comprehensive Alert System' under the 'FEATURES' section). Once configured, open TradingView's 'Create Alert' dialog. In the 'Condition' tab, select this indicator's name, and crucially, choose the 'Any alert() function call' option from the dropdown list. This setup allows the indicator to trigger alerts based on the precise event conditions you have activated in its settings
Alert Frequency : Alerts are designed to trigger once per bar close (alert.freq_once_per_bar_close) for the specific event.
User Interface (UI) Tips
Settings Group Icons: In the indicator settings menu, timeframe-specific groups are marked with star icons for easier navigation: 🌟 for LTF (Current Chart Timeframe), 🌟🌟 for MTF (Medium Timeframe), and 🌟🌟🌟 for HTF (High Timeframe).
Dependent Inputs: Some input settings are dependent on others being enabled. These dependencies are visually indicated in the settings menu using symbols like "↳" (dependent setting on the next line), "⟷" (mutually exclusive inline options), or "➜" (directly dependent inline option).
Settings Layout Overview: The indicator settings are organized into logical groups for ease of use. Key global display controls – such as toggles for MTF FVGs, HTF FVGs (along with their respective timeframe selectors), and the Information Panel – are conveniently located at the very top within the '⚙️ General Settings' group. This placement allows for quick access to frequently adjusted settings. Other sections provide detailed customization options for each timeframe (LTF, MTF, HTF), specific FVG components, and alert configurations.
█ FOR Pine Script® CODERS
This section provides a high-level overview of the FVG Premium indicator's internal architecture, data flow, and the interaction between its various library components. It is intended for Pine Script™ programmers who wish to understand the indicator's design, potentially extend its functionality, or learn from its structure.
System Architecture and Modular Design
The indicator is architected moduarly, leveraging several custom libraries to separate concerns and enhance code organization and reusability. Each library has a distinct responsibility:
FvgTypes: Serves as the foundational data definition layer. It defines core User-Defined Types (UDTs) like fvgObject (for storing all attributes of an FVG) and drawSettings (for visual configurations), along with enumerations like tfType.
CommonUtils: Provides utility functions for common tasks like mapping user string inputs (e.g., "Dashed" for line style) to their corresponding Pine Script™ constants (e.g., line.style_dashed) and formatting timeframe strings for display.
FvgCalculations: Contains the core logic for FVG detection (both LTF and MTF/HTF via requestMultiTFBarData), FVG classification (Large FVGs based on ATR), and checking FVG interactions with price (mitigation, partial fill).
FvgObject: Implements an object-oriented approach by attaching methods to the fvgObject UDT. These methods manage the entire visual lifecycle of an FVG on the chart, including drawing, updating based on state changes (e.g., mitigation), and deleting drawing objects. It's responsible for applying the visual configurations defined in drawSettings.
FvgPanel: Manages the creation and dynamic updates of the on-chart information panel, which displays key FVG levels.
The main indicator script acts as the orchestrator, initializing these libraries, managing user inputs, processing data flow between libraries, and handling the main event loop (bar updates) for FVG state management and alerts.
Core Data Flow and FVG Lifecycle Management
The general data flow and FVG lifecycle can be summarized as follows:
Input Processing: User inputs from the "Settings" dialog are read by the main indicator script. Visual style inputs (colors, line styles, etc.) are consolidated into a types.drawSettings object (defined in FvgTypes). Other inputs (timeframes, filter settings, alert toggles) control the behavior of different modules. CommonUtils assists in mapping some string inputs to Pine constants.
FVG Detection:
For the current chart timeframe (LTF), FvgCalculations.detectFvg() identifies potential FVGs based on bar patterns.
For MTF/HTF, the main indicator script calls FvgCalculations.requestMultiTFBarData() to fetch necessary bar data from higher timeframes, then FvgCalculations.detectMultiTFFvg() identifies FVGs.
Newly detected FVGs are instantiated as types.fvgObject and stored in arrays within the main script. These objects also undergo classification (e.g., Large FVG) by FvgCalculations.
State Update & Interaction: On each bar, the main indicator script iterates through active FVG objects to manage their state based on price interaction:
Initially, the main script calls FvgCalculations.fvgInteractionCheck() to efficiently determine if the current bar's price might be interacting with a given FVG.
If a potential interaction is flagged, the main script then invokes methods directly on the fvgObject instance (e.g., updateMitigation(), updatePartialFill(), checkMidlineTouch(), which are part of FvgObject).
These fvgObject methods are responsible for the detailed condition checking and the actual modification of the FVG's state. For instance, the updateMitigation() and updatePartialFill() methods internally utilize specific helper functions from FvgCalculations (like checkMitigation() and checkPartialMitigation()) to confirm the precise nature of the interaction before updating the fvgObject’s state fields (such as isMitigated, currentTop, currentBottom, or isMidlineTouched).
Visual Rendering:
The FvgObject.updateDrawings() method is called for each fvgObject. This method is central to drawing management; it creates, updates, or deletes chart drawings (boxes, lines, labels) based on the FVG's current state, its prev_* (previous bar state) fields for optimization, and the visual settings passed via the drawSettings object.
Information Panel Update: The main indicator script determines the nearest FVG levels, populates a panelData object (defined in FvgPanelLib), and calls FvgPanel.updatePanel() to refresh the on-chart display.
Alert Generation: Based on the updated FVG states and user-enabled alert settings, the main indicator script constructs and triggers alerts using Pine Script's alert() function."
Key Design Considerations
UDT-Centric Design: The fvgObject UDT is pivotal, acting as a stateful container for all information related to a single FVG. Most operations revolve around creating, updating, or querying these objects.
State Management: To optimize drawing updates and manage FVG lifecycles, fvgObject instances store their previous bar's state (e.g., prevIsVisible, prevCurrentTop). The FvgObject.updateDrawings() method uses this to determine if a redraw is necessary, minimizing redundant drawing calls.
Settings Object: A drawSettings object is populated once (or when inputs change) and passed to drawing functions. This avoids repeatedly reading numerous input() values on every bar or within loops, improving performance.
Dynamic Arrays for FVG Storage: Arrays are used to store collections of fvgObject instances, allowing for dynamic management (adding new FVGs, iterating for updates).

Time-Based Fair Value Gaps (FVG) with Inversions (iFVG)Overview
The Time-Based Fair Value Gaps (FVG) with Inversions (iFVG) (ICT/SMT) indicator is a specialized tool designed for traders using Inner Circle Trader (ICT) methodologies. Inspired by LuxAlgo's Fair Value Gap indicator, this script introduces significant enhancements by integrating ICT principles, focusing on precise time-based FVG detection, inversion tracking, and retest signals tailored for institutional trading strategies. Unlike LuxAlgo’s general FVG approach, this indicator filters FVGs within customizable 10-minute windows aligned with ICT’s macro timeframes and incorporates ICT-specific concepts like mitigation, liquidity grabs, and session-based gap prioritization.
This tool is optimized for 1–5 minute charts, though probably best for 1 minute charts, identifying bullish and bearish FVGs, tracking their mitigation into inverted FVGs (iFVGs) as key support/resistance zones, and generating retest signals with customizable “Close” or “Wick” confirmation. Features like ATR-based filtering, optional FVG labels, mitigation removal, and session-specific FVG detection (e.g., first FVG in AM/PM sessions) make it a powerful tool for ICT traders.
Originality and Improvements
While inspired by LuxAlgo’s FVG indicator (credit to LuxAlgo for their foundational work), this script significantly extends the original concept by:
1. Time-Based FVG Detection: Unlike LuxAlgo’s continuous FVG identification, this script filters FVGs within user-defined 10-minute windows each hour (:00–:10, :10–:20, etc.), aligning with ICT’s emphasis on specific periods of institutional activity, such as hourly opens/closes or kill zones (e.g., New York 7:00–11:00 AM EST). This ensures FVGs are relevant to high-probability ICT setups.
2. Session-Specific First FVG Option: A unique feature allows traders to display only the first FVG in ICT-defined AM (9:30–10:00 AM EST) or PM (1:30–2:00 PM EST) sessions, reflecting ICT’s focus on initial market imbalances during key liquidity events.
3. ICT-Driven Mitigation and Inversion Logic: The script tracks FVG mitigation (when price closes through a gap) and converts mitigated FVGs into iFVGs, which serve as ICT-style support/resistance zones. This aligns with ICT’s view that mitigated gaps become critical reversal points, unlike LuxAlgo’s simpler gap display.
4. Customizable Retest Signals: Retest signals for iFVGs are configurable for “Close” (conservative, requiring candle body confirmation) or “Wick” (faster, using highs/lows), catering to ICT traders’ need for precise entry timing during liquidity grabs or Judas swings.
5. ATR Filtering and Mitigation Removal: An optional ATR filter ensures only significant FVGs are displayed, reducing noise, while mitigation removal declutters the chart by removing filled gaps, aligning with ICT’s principle that mitigated gaps lose relevance unless inverted.
6. Timezone and Timeframe Safeguards: A timezone offset setting aligns FVG detection with EST for ICT’s New York-centric strategies, and a timeframe warning alerts users to avoid ≥1-hour charts, ensuring accuracy in time-based filtering.
These enhancements make the script a distinct tool that builds on LuxAlgo’s foundation while offering ICT traders a tailored, high-precision solution.
How It Works
FVG Detection
FVGs are identified when a candle’s low is higher than the high of two candles prior (bullish FVG) or a candle’s high is lower than the low of two candles prior (bearish FVG). Detection is restricted to:
• User-selected 10-minute windows (e.g., :00–:10, :50–:60) to capture ICT-relevant periods like hourly transitions.
• AM/PM session first FVGs (if enabled), focusing on 9:30–10:00 AM or 1:30–2:00 PM EST for key market opens.
An optional ATR filter (default: 0.25× ATR) ensures only gaps larger than the threshold are displayed, prioritizing significant imbalances.
Mitigation and Inversion
When price closes through an FVG (e.g., below a bullish FVG’s bottom), the FVG is mitigated and becomes an iFVG, plotted as a support/resistance zone. iFVGs are critical in ICT for identifying reversal points where institutional orders accumulate.
Retest Signals
The script generates signals when price retests an iFVG:
• Close: Triggers when the candle body confirms the retest (conservative, lower noise).
• Wick: Triggers when the candle’s high/low touches the iFVG (faster, higher sensitivity). Signals are visualized with triangular markers (▲ for bullish, ▼ for bearish) and can trigger alerts.
Visualization
• FVGs: Displayed as colored boxes (green for bullish, red for bearish) with optional “Bull FVG”/“Bear FVG” labels.
• iFVGs: Shown as extended boxes with dashed midlines, limited to the user-defined number of recent zones (default: 5).
• Mitigation Removal: Mitigated FVGs/iFVGs are removed (if enabled) to keep the chart clean.
How to Use
Recommended Settings
• Timeframe: Use 1–5 minute charts for precision, avoiding ≥1-hour timeframes (a warning label appears if misconfigured).
• Time Windows: Enable :00–:10 and :50–:60 for hourly open/close FVGs, or use the “Show only 1st presented FVG” option for AM/PM session focus.
• ATR Filter: Keep enabled (multiplier 0.25–0.5) for significant gaps; disable on 1-minute charts for more FVGs during volatility.
• Signal Preference: Use “Close” for conservative entries, “Wick” for aggressive setups.
• Timezone Offset: Set to -5 for EST (or -4 for EDT) to align with ICT’s New York session.
Trading Strategy
1. Macro Timeframes: Focus on New York (7:00–11:00 AM EST) or London (2:00–5:00 AM EST) kill zones for high institutional activity.
2. FVG Entries: Trade bullish FVGs as support in uptrends or bearish FVGs as resistance in downtrends, especially in :00–:10 or :50–:60 windows.
3. iFVG Retests: Enter on retest signals (▲/▼) during liquidity grabs or Judas swings, using “Close” for confirmation or “Wick” for speed.
4. Session FVGs: Use the “Show only 1st presented FVG” option to target the first gap in AM/PM sessions, often tied to ICT’s market maker algorithms.
5. Risk Management: Combine with ICT concepts like order blocks or breaker blocks for confluence, and set stops beyond FVG/iFVG boundaries.
Alerts
Set alerts for:
• “Bullish FVG Detected”/“Bearish FVG Detected”: New FVGs in selected windows.
• “Bullish Signal”/“Bearish Signal”: iFVG retest confirmations.
Settings Description
• Show Last (1–100, default: 5): Number of recent iFVGs to display. Lower values reduce clutter.
• Show only 1st presented FVG : Limits FVGs to the first in 9:30–10:00 AM or 1:30–2:00 PM EST sessions (overrides time window checkboxes).
• Time Window Checkboxes: Enable/disable FVG detection in 10-minute windows (:00–:10, :10–:20, etc.). All enabled by default.
• Signal Preference: “Close” (default) or “Wick” for iFVG retest signals.
• Use ATR Filter: Enables ATR-based size filtering (default: true).
• ATR Multiplier (0–∞, default: 0.25): Sets FVG size threshold (higher values = larger gaps).
• Remove Mitigated FVGs: Removes filled FVGs/iFVGs (default: true).
• Show FVG Labels: Displays “Bull FVG”/“Bear FVG” labels (default: true).
• Timezone Offset (-12 to 12, default: -5): Aligns time windows with EST.
• Colors: Customize bullish (green), bearish (red), and midline (gray) colors.
Why Use This Indicator?
This indicator empowers ICT traders with a tool that goes beyond generic FVG detection, offering precise, time-filtered gaps and inversion tracking aligned with institutional trading principles. By focusing on ICT’s macro timeframes, session-specific imbalances, and customizable signal logic, it provides a clear edge for scalping, swing trading, or reversal setups in high-liquidity markets.

Volatility Footprint CandlesVolatility Footprint is an innovative volume profile indicator that dynamically adapts to real-time market conditions, providing traders with a powerful tool to visualize and interpret market structure, order flow, and potential areas of support and resistance.
At its core, Volatility Footprint combines the concepts of market profile, volume analysis, and volatility measurement to create a unique and adaptive charting experience. The indicator intelligently adjusts its display based on the current market volatility, ensuring that traders always have a clear and readable chart, regardless of the instrument or timeframe they are analyzing.
The footprint chart is composed of a series of color-coded boxes, each representing a specific price level. The color of the box indicates whether there is a net buying or selling pressure at that level, while the opacity reflects the relative strength of the volume. This intuitive visualization allows traders to quickly identify areas of high and low volume, as well as potential imbalances in order flow.
In addition to the individual box volumes, Volatility Footprint also calculates and displays the cumulative volume delta. This running total of buy and sell volumes across all price levels provides valuable insight into the overall market sentiment and potential trends.
One of the key features of Volatility Footprint is its ability to identify and highlight the Point of Control (POC). The POC represents the price level with the highest volume concentration and serves as a key reference point for potential support or resistance. By drawing attention to this crucial level, the indicator helps traders make more informed decisions about potential entry and exit points.
Volatility Footprint is designed to be highly customizable, allowing traders to tailor the appearance of the footprint chart to their specific preferences. Users can easily modify the colors, opacity, and size of the boxes, labels, and POC marker to enhance readability and clarity.
The indicator's versatility makes it suitable for a wide range of trading styles and strategies. Whether you are a scalper looking for short-term opportunities or a swing trader aiming to identify potential trend reversals, Volatility Footprint can provide valuable insights into market dynamics.
By combining Volatility Footprint with other forms of analysis, such as price action, key levels, and technical indicators, traders can gain a more comprehensive understanding of market behavior and make better-informed trading decisions.
Volatility Footprint's adaptive approach to volume profile analysis sets it apart from traditional fixed-resolution volume profile indicators. By dynamically adjusting to the unique characteristics of each instrument and timeframe, the indicator ensures that traders always have a clear and meaningful representation of market structure and order flow.
Volatility Footprint is a powerful tool that traders can incorporate into their market analysis and decision-making process. By providing a dynamic, visual representation of volume and order flow at different price levels, this indicator offers valuable insights into market structure, sentiment, and potential areas of support and resistance. Let's explore how traders might effectively utilize Volatility Footprint in their trading approach.
1. Identifying Key Levels:
One of the primary uses of Volatility Footprint is to identify key price levels where significant trading activity has occurred. The color-coded boxes allow traders to quickly spot areas of high volume concentration, which may indicate potential support or resistance zones. For example, if a trader notices a cluster of boxes with high opacity at a specific price level, they may interpret this as a strong support or resistance area, depending on the prevailing market context. By paying attention to these key levels, traders can make more informed decisions about potential entry and exit points, as well as placement of stop-loss orders and profit targets.
2. Assessing Market Sentiment:
The cumulative volume delta feature of Volatility Footprint provides traders with a valuable gauge of overall market sentiment. By analyzing the running total of buy and sell volumes across all price levels, traders can gain insight into the dominant market forces at play. If the cumulative delta is significantly positive, it may suggest a bullish sentiment, as buying pressure has been consistently outpacing selling pressure. Conversely, a negative cumulative delta may indicate a bearish sentiment. Traders can use this information to confirm or question their bias and adjust their trading plan accordingly.
3. Confirming Breakouts and Trend Reversals:
Volatility Footprint can be particularly useful in confirming the strength and validity of breakouts and potential trend reversals. When a price level is breached, traders can refer to the footprint chart to assess the volume and order flow characteristics around that level. If the breakout is accompanied by a surge in volume and a clear imbalance between buying and selling pressure, it may suggest a strong and sustainable move. On the other hand, if the volume is relatively low or evenly distributed, the breakout may be less reliable. By using Volatility Footprint to confirm breakouts, traders can make more informed decisions about whether to enter or exit a trade, or to adjust their position size.
4. Detecting Imbalances and Potential Reversals:
Imbalances between buying and selling pressure at specific price levels can often precede significant market moves or reversals. Volatility Footprint makes it easy for traders to spot these imbalances visually. For instance, if a trader observes a price level with a significantly larger number of sell boxes compared to buy boxes, it may indicate a potential exhaustion point for a bullish trend, and a reversal might be imminent. Traders can use this information in conjunction with other technical analysis tools, such as trendlines, moving averages, or momentum oscillators, to identify high-probability trading opportunities.
5. Adapting to Market Conditions:
One of the key strengths of Volatility Footprint is its ability to dynamically adapt to the unique volatility characteristics of different instruments and timeframes. This adaptability ensures that the indicator remains relevant and informative across a wide range of market conditions. Traders can use Volatility Footprint to gauge the relative volatility and volume of a particular instrument or timeframe, and adjust their trading approach accordingly. For example, in a highly volatile market, traders may opt for wider stop-loss levels and smaller position sizes to account for the increased risk.
Incorporating Volatility Footprint into a trading strategy requires a combination of technical analysis, market understanding, and risk management. Traders should use this indicator as part of a comprehensive approach, combining it with other forms of analysis, such as price action, key levels, and technical indicators. By doing so, traders can gain a more complete picture of market dynamics and make better-informed trading decisions.
It's important to note that while Volatility Footprint provides valuable insights, it should not be relied upon as a standalone trading signal. Traders should always consider the broader market context, their risk tolerance, and their overall trading plan when making decisions based on the information provided by this indicator.
In conclusion, Volatility Footprint offers traders a dynamic and visually intuitive way to analyze market structure, volume, and order flow. By identifying key levels, assessing market sentiment, confirming breakouts, detecting imbalances, and adapting to market conditions, traders can leverage this powerful tool to make more informed and confident trading decisions. As with any technical analysis tool, Volatility Footprint should be used in conjunction with sound risk management principles and a well-defined trading strategy to maximize its effectiveness.

PATIThis indicator is part of our educational suite focused on teaching price structure, momentum, and mean reversion trading strategies for intraday trading. Our team has selected this set of tools and metrics, which define our trading style and serve as the foundation for our teaching, to be included in this indicator. We are displaying each component in a way we believe is helpful to their understanding which also provides a clean, comprehensive look.
This indicator is for Intraday Trading
Our Traders most commonly use this indicator on the 1,3 or 5 minute chart.
Components of this Indicator:
Multiple VWAP Levels: monthly, weekly, standard (anchored to the right of price)
Dynamically Anchored VWAP Cloud (trend tool)
13 EMA (trend tool)
Structural Orderblocks
Multi-Timeframe Fair Value Gap detection
Key Daily Price Levels (anchored to the right of price)
Customizable Opening Range (anchored to the right of price)
15 minute “Golden Zone” (shows the .5-.618 zone of the previous 15m candle)
ADR (Average Daily Range)
A4R (Average 4hr Range)
These tools are used in conjunction with the education we provide to help our users determine their optimal trade plan to utilize their edge.
Specific Functionalities and Uses:
Monthly-VWAP & Weekly-VWAP (M-VWAP/W-VWAP):
VWAP = “Volume Weighted Average Price”
These levels provide probable zones where price may mean revert and risk should be taken off/ put on. We have anchored these to the right-hand side of your chart by default to minimize the noise on your chart.
Average Daily Range (ADR): The Average Daily Range is a technical indicator used to measure the volatility of an asset. It displays how much an instrument can move on average during a given day. The significance is that each market has a unique range that is likely to be covered on any given day.
Average 4hr Range (A4R): The Average 4hr Range is a technical indicator used to measure the volatility of an asset twice in a single session. It displays how much an instrument can move on average during a session and is measured twice in a day. Calculating a smaller volatility range may seem strange at first but can be a huge advantage by analyzing the volatility of the intraday action, giving you average price targets based on more recent market data.
Tip: When used in conjunction with key support and resistance levels, ADR & A4R can be a huge edge to traders to determine where to push/pull risk.
Opening Range: The open often establishes the trend and sentiment for the day, but there is also statistical significance to the open that is overlooked. Statistically, on average, the open is near the high or low of the day and offers plenty of opportunities to build trading strategies. The chart below provides some potential trades that could be taken once the opening range has been established.
Dynamically Anchored VWAP Cloud: Our dynamically anchored VWAP cloud tracks the most recent impulsive move and re-anchors to show you potential bounce points in a trend. We re-anchor at each structural shift to give the most probable targets for buyers/sellers to defend their positions to continue the current trend push.
By utilizing the re-anchoring at each significant structural inflection point, we can establish a much less lagging trend following technique.
We have also included the feature to substitute this cloud for a 34/55 EMA cloud for the traders already familiar with that system.
The chart below provides potential trades that could be taken using the VWAP cloud system.
FVGS (Fair Value Gaps/ Imbalances): These areas represent potential buy/sell side liquidity imbalances where price is pushed aggressively, sweeping the orderbook and will likely return to “fix” the structure before continuing. Below is an example of 3 possible trade paths we look for inside these structural imbalances.
Structural Orderblocks:
These areas are based on structural pivots that have been pushed out of with aggression determined by subsequent structural breaks to confirm their validity. Because of this, when price returns to these areas we can anticipate this area to be defended.
The blue boxes track Orderblocks. These highlight instances of past participation which create areas likely to be defended again when retested.
Swing High/Low/Previous:
We use swing high and lows as points of short-term support and resistance, a break of these levels can signify a shift in market sentiment.
-The dashed green line shows the previous structural swing high or low pivot point.
-The solid green lines show the high and low in our current trading structure.
Note: Displaying the previous swing can provide us with context of the current market trend, and will assist us make better decisions.
15 Minute Golden Zone:
Displayed as a gray box, it tracks the .5-.618 of the previous 15m candle and gives us an area where we look for short-term resistance/support on smaller time frame price action. This area can be viewed as an equilibrium of the current range. If the price can hold this area, it can show a likely support area for continuation.
13 EMA:
This is the choice length ema of our traders, they use this ema to confirm (short-term) trend direction and reference it for a common bounce point for re-entries. Our traders consider this as a crucial point to speculate reversals and break of short-term trends.
Note: Typically in a trend we see the price hold to one side of this ema, by looking for this characteristic, it brings confidence to staying in trades.
Please check the Author Instructions Below for how to gain access to our indicators.
Fair Value Gap [by Oberlunar]Fair Value Gap
This indicator is designed to identify and display Fair Value Gaps (FVG) on the price chart. Fair Value Gaps are areas between candles where the price lacks continuity, leaving a "gap" that can serve as a reference point for price retracements. These zones are often considered important by traders as they represent market imbalances that tend to be "mitigated" (i.e., filled or tested) over time.
Purpose of Publication
This indicator addresses a common gap in FVG indicators. Most existing FVG indicators do not visually distinguish between mitigated (touched) FVGs and those that remain intact. With this indicator:
Mitigated FVGs are clearly displayed with distinct colors, allowing traders to identify which zones have been partially or fully filled by the price.
Unmitigated FVGs remain prominent, representing potential points of interest.
Key Features
Identification of Fair Value Gaps:
A Bullish FVG (upward gap) forms when the high of the three previous candles (candle -3) is lower than the low of the next candle (candle -1).
A Bearish FVG (downward gap) forms when the low of the three previous candles (candle -3) is higher than the high of the next candle (candle -1).
Dynamic Coloring:
Unmitigated FVGs are highlighted with specific colors: green for Bullish and red for Bearish gaps.
When an FVG is "touched" by the price (i.e., mitigated), the color changes:
Yellow-green for mitigated Bullish FVGs.
Purple for mitigated Bearish FVGs.
Handling Mitigated FVGs:
When an FVG is touched by the price, it is visually updated with a different color.
An option can be enabled to "shrink" the mitigated zone, adjusting the box to reflect the remaining untested portion of the gap.
Customization:
Configure the maximum number of FVGs to display on the chart.
Set specific colors for mitigated and unmitigated FVGs.
Choose whether to automatically shrink mitigated zones.
How to Identify Support and Resistance Levels
Support:
Bullish FVGs represent potential support levels, as they indicate areas where the price might return to seek liquidity or fill the imbalance.
An FVG that is repeatedly touched without being fully filled becomes a significant support zone.
Resistance:
Bearish FVGs represent potential resistance levels, indicating zones where the price might stall or reverse direction.
Why a Repeatedly Mitigated FVG is Significant
When an FVG is touched or mitigated multiple times, it means the market recognizes that area as significant. This can happen for several reasons:
Accumulation or Distribution: Institutional traders may use these zones to accumulate or distribute positions without causing excessive market movement.
Presence of Liquidity: FVGs often represent areas with pending orders (stop-losses, limit orders), and the price revisits these zones to seek liquidity.
Market Equilibrium: When an FVG is repeatedly filled, it indicates the market's attempt to balance a demand-supply imbalance. This makes the zone an important level to monitor for potential breakouts or reversals.

ICT Comprehensive IndicatorThe ICT Comprehensive Indicator is a robust tool designed to assist traders in applying key concepts from the Inner Circle Trader (ICT) methodology directly to their TradingView charts. This indicator integrates multiple ICT principles to provide a holistic view of the market, aiming to enhance trading analysis and decision-making.
Key Features:
Market Structure Analysis:
Swing Highs and Lows:
Automatically identifies and marks significant swing highs and lows.
Plots dotted lines at these levels to help visualize market structure and trend direction.
Red Lines: Indicate swing highs (potential resistance levels).
Green Lines: Indicate swing lows (potential support levels).
Liquidity Pools:
Highlights potential liquidity zones where stop orders may accumulate.
Marks previous swing highs and lows with small circles to identify areas institutions might target for liquidity.
Order Blocks Identification:
Bullish Order Blocks:
Detects the last down candle before a significant up move.
Draws solid green lines extended to the right, representing potential support zones.
Bearish Order Blocks:
Detects the last up candle before a significant down move.
Draws solid red lines extended to the right, representing potential resistance zones.
Fair Value Gaps (Imbalance):
Identifies and highlights gaps in price action where the market moved rapidly, leaving imbalances.
Draws semi-transparent purple boxes to indicate areas where the price may retrace to fill unfilled orders.
Time and Price Theory:
Trading Sessions Highlighting:
Allows selection of major trading sessions: London, New York, or Asian.
Highlights the chosen session on the chart with a semi-transparent blue background.
Helps focus analysis during periods of higher liquidity and volatility.
Risk Management Display:
Calculates and displays the risk amount per trade based on user-defined account size and risk percentage.
Shows a label on the chart with the calculated risk amount to aid in proper position sizing.
Custom Alerts:
Provides alerts for key events:
Formation of new swing highs or lows.
Identification of bullish or bearish order blocks.
Detection of fair value gaps (both up and down).
How to Use:
Add the Indicator to Your Chart:
Search for "ICT Comprehensive Indicator" in the TradingView Indicators library.
Add it to your chart to begin analyzing the market using ICT concepts.
Configure Settings:
Trading Session Selection:
Choose your preferred trading session in the settings to highlight it on the chart.
Risk Management Inputs:
Input your account size and desired risk percentage per trade to calculate the risk amount.
Analyze the Market:
Market Structure:
Use the swing highs and lows to understand the current market trend.
Liquidity Pools and Order Blocks:
Identify potential entry and exit points by observing marked liquidity zones and order blocks.
Fair Value Gaps:
Look for possible retracement areas where the price may return to fill imbalances.
Set Up Alerts:
Configure alerts based on the indicator's conditions to stay informed of significant market events without constant monitoring.
Benefits:
Holistic Analysis Tool:
Combines multiple ICT principles into one indicator for comprehensive market analysis.
Enhanced Decision-Making:
Aids in identifying high-probability trade setups by highlighting key market areas.
Time-Efficient:
Automates the detection of complex trading concepts, saving time on manual analysis.
Customizable:
Adjustable settings allow tailoring the indicator to individual trading styles and preferences.
Disclaimer:
This indicator is intended for educational and informational purposes only.
Trading involves significant risk, and past performance is not indicative of future results.
Always conduct thorough analysis and consult with a financial advisor before making trading decisions.
Note:
This indicator is inspired by ICT concepts but is not affiliated with or endorsed by Inner Circle Trader.
Users are encouraged to have a foundational understanding of ICT methodologies to fully benefit from this tool.

S_Sigma HTF Candles (UTC Draw / NY Labels)🕯️ S_Sigma HTF Candles (UTC Draw / NY Labels)
Multi-Timeframe Overlay with Session Labels & Imbalances
S_Sigma HTF Candles is a powerful, non-repainting overlay indicator that allows you to visualize up to 6 different Higher Timeframes (HTF) directly on your current chart.
Designed specifically for traders who need context without switching tabs, this tool draws accurate HTF candles using UTC time (standard for Crypto) while labeling them with New York Timezone data (standard for Stocks/Forex). It also detects Fair Value Gaps (FVG) and Volume Imbalances automatically.
🌟 Key Features
📊 6 Independent HTF Slots
Configure up to 6 different timeframes simultaneously (e.g., 15m, 1H, 4H, 1D, 1W). Each slot is customizable and can be toggled on/off independently.
🌍 UTC Drawing + NY Labels (The "Sigma" Edge)
Drawing: Candles are calculated strictly using UTC time to ensure wicks and bodies match exchange data (perfect for BTC/ETH).
Labels: Day of the Week (Mon/Tue/Wed) and Time labels are converted to America/New_York time. Never get confused by candle closes again.
#HTF Countdown Timer**
See exactly how much time is left until the Higher Timeframe candle closes. Essential for timing entries at the "Candle Close."
📈 Smart Imbalance Detection
FVG (Fair Value Gaps): Automatically highlights 3-candle reversal gaps.
VI (Volume Imbalance): Highlights wicks that pierce previous bodies.
🏗️ Custom Session Starts
Don't like the standard Daily candle? Force the Daily candle to open at 08:30 NY or 09:30 NY (Market Open) instead of Midnight UTC.
⚙️ Customization Options
Visuals: Full control over Bull/Bear colors, borders, wicks, and opacity.
Layout: Adjust padding, width, and spacing between timeframes to prevent overlap.
Trace Lines: Optional lines tracing the Open, High, Low, and Close of the forming HTF candle.
Labels: Toggle HTF names, Timers, and Day-of-Week labels on/off.
💡 How to Use
Add to Chart: The indicator draws candles to the right of the current price (offset) to keep your chart clean.
Check Alignment: Ensure the "Daily Name" matches your expected market session (NY Time).
Spot Entries: Look for price entering an FVG (Gray box) or hitting a HTF Support/Resistance level (Wick of the HTF candle).
Time Entries: Wait for the Timer to hit 00:00 for a confirmed candle close.
Perfect for: Smart Money Concepts (SMC), ICT, Wyckoff, and Multi-Timeframe Analysis.

SMC Academy [PhenLabs]📊 SMC Academy
Version: PineScript™ v6
📌 Description
The SMC Academy indicator is a comprehensive educational tool designed to demystify Smart Money Concepts (SMC) for traders of all levels. Unlike standard indicators that simply print signals, this script uses a “Learning Phase” system that allows users to toggle between individual concepts—such as Market Structure, Liquidity, Imbalances, and Order Blocks—or view them all simultaneously. It lets you focus on one piece of the puzzle at a time.
🚀 Points of Innovation
Progressive Learning Modes: Toggle between 5 distinct phases to master concepts individually before using the Full Strategy Mode.
Educational Tooltips: Hover over labels to read detailed explanations of why a BOS, MSS, or Liquidity zone was identified.
Smart Filtering: Uses ATR and Volume integration to filter out low-quality Fair Value Gaps and weak Order Blocks.
HTF Dashboard: A built-in panel analyzes Higher Timeframe (4H) data to ensure you are trading in alignment with the broader trend.
🔧 Core Components
Market Structure Engine: Automatically detects Swing Highs and Lows to map out market direction using configurable swing lengths.
Liquidity Manager: Identifies unmitigated swing points that serve as Buy-Side (BSL) and Sell-Side (SSL) liquidity magnets.
Imbalance Detector: Highlights Fair Value Gaps (FVG) where price inefficiencies exist, using ATR thresholds to ignore noise.
Order Block Identifier: Locates the specific candles responsible for structure breaks, validated by volume analysis.
🔥 Key Features
Break of Structure (BOS): Automatically marks trend continuation signals with solid lines and color-coded labels.
Market Structure Shift (MSS): Identifies potential trend reversals when significant swing points are breached.
Dashboard Context: Displays the current trend direction and the 4H context directly on your chart.
Custom Alerts: Built-in alert conditions for structure breaks and new Order Blocks allow for automated tracking.
🎨 Visualization
Structure Lines: Solid lines indicate confirmed breaks (Green for Bullish, Red for Bearish).
Liquidity Zones: Dotted lines extending rightward indicate resting liquidity levels that price may target.
FVG Boxes: Shaded boxes highlight imbalance zones, automatically extending for a user-defined number of bars.
Dashboard: A clean, non-intrusive table in the top-right corner displays trend status and active mode.
📖 Usage Guidelines
Setting Categories
Learning Mode: Select from ‘1. Market Structure’ through ‘5. Full Strategy Mode’ to filter what appears on the chart.
Swing Detection Length: Default (5). Determines the sensitivity of the swing high/low detection.
Structure Break Type: Options (Close/Wick). Choose whether a candle close or just a wick is required to confirm a break.
Min FVG Size: Default (0.5 ATR). Filters out gaps smaller than this multiplier to reduce noise.
Filter Weak OBs by Volume: Default (True). Only highlights Order Blocks where volume exceeds the 20-period average.
✅ Best Use Cases
Educational Study: Isolate “Phase 1: Market Structure” to practice identifying trend changes without distraction.
Trend Following: Use “Phase 3: Imbalances” to find entry points within an established trend.
Reversal Trading: Combine “Phase 2: Liquidity” and “Phase 4: Order Blocks” to catch reversals at key levels.
⚠️ Limitations
Subjectivity: Market structure can be interpreted differently depending on the swing length settings used.
Ranging Markets: Like all trend-following concepts, false BOS/MSS signals may generate during choppy, sideways price action.
Repainting: While the signals are non-repainting once confirmed, the live candle may flash a signal before the close if “Close” mode is selected.
💡 What Makes This Unique
Interactive Learning: The inclusion of tooltip explanations transforms this from a simple tool into an active mentor.
Phase-Based Workflow: The ability to strip the chart back to basics at the click of a button is unique to the PhenLabs ecosystem.
🔬 How It Works
Swing Analysis: The script calculates pivot highs and lows based on your length input to define the structural landscape.
Break Validation: It checks if price crosses these pivot points to trigger BOS (Continuation) or MSS (Reversal) logic.
Volume Confirmation: For Order Blocks, it looks back inside the swing leg to find the specific candle responsible for the move, verifying it has significant volume.
💡 Note:
For the best experience, start in Phase 1 to calibrate your Swing Detection Length to the specific volatility of the asset you are trading before enabling Full Strategy Mode.

Call-Put Cross Strike Match [Pro]📊 Call-Put Cross Strike Match - Professional Options Trading Indicator
Advanced NSE Options Analysis with AI-Powered Trading Signals & Dynamic Display
🎯 Overview
The Call-Put Cross Strike Match is an institutional-grade options analysis tool designed exclusively for NSE NIFTY and BANKNIFTY traders. Built on Pine Script v6, this indicator combines sophisticated cross-strike matching algorithms with intelligent trading signal generation to identify optimal options trading opportunities in real-time.
What makes it unique:
Analyzes 25 call-put combinations simultaneously
Generates actionable BUY/SELL signals using professional strategies
Fully customizable display with 9 table positions and 6 size options
Simplified setup with semi-automatic ATM detection
Clean, clutter-free interface with only essential information
Perfect for intraday scalpers, premium sellers, and positional options traders.
✨ Key Features
1. 🔍 Advanced Cross-Strike Matching Algorithm
The indicator calculates price differences for all 25 combinations (5 call strikes × 5 put strikes) and identifies the best matches based on put-call parity.
How it works:
Compares each call option price with every put option price
Calculates absolute difference: |Call - Put |
Ranks all 25 combinations from lowest to highest difference
Highlights top 3 or top 5 matches with visual checkmarks
Visual indicators:
✓✓ (Double check) = Best match (lowest price difference)
✓ (Single check) = Good matches (top 3 or top 5)
Empty cells = No match (significant price difference)
Why this matters:
When Call ≈ Put at same strike, it indicates fair pricing and synthetic position opportunities. The indicator automatically finds these opportunities across different strike combinations.
2. 🎯 Intelligent Trading Signals (Last Column)
The indicator generates professional trading recommendations based on Call-Put price difference analysis:
Signal Types:
BUY CE - Long call opportunity (bullish)
SELL CE - Short call opportunity (premium selling)
BUY PE - Long put opportunity (bearish/hedge)
SELL PE - Short put opportunity (premium selling)
BULL - Moderate bullish bias
BEAR - Moderate bearish bias
ATM - Neutral market (near parity)
NEUTRAL - No clear bias
Color-Coded for Quick Decisions:
🟩 Green = Long opportunities (BUY CE, BULL)
🟥 Red = Short call opportunities (SELL CE)
🟧 Orange = Long put opportunities (BUY PE)
🟫 Maroon = Short put opportunities (SELL PE)
⬛ Gray = Neutral zones (ATM, NEUTRAL)
3. 🤖 Three Professional Signal Modes
SMART Mode (Recommended) 🎯
Context-aware institutional strategy that considers strike position relative to spot price.
Signal Logic:
text
OTM Call Expensive (C-P > threshold, Strike > Spot):
→ SELL CE (Premium selling opportunity)
ITM Call Underpriced (C-P > threshold, Strike < Spot):
→ BUY CE (Synthetic long opportunity)
OTM Put Expensive (C-P < -threshold, Strike < Spot):
→ SELL PE (Premium selling opportunity)
ITM Put Underpriced (C-P < -threshold, Strike > Spot):
→ BUY PE (Protection or synthetic short)
Near Parity (|C-P| < threshold/4):
→ ATM (Neutral market, straddle/strangle zone)
Moderate Imbalance:
→ BULL or BEAR (Directional bias without extreme pricing)
Best for: Professional traders, option writers, synthetic position builders
MOMENTUM Mode 📈
Trend-following strategy that rides market momentum.
Signal Logic:
text
Calls Expensive (C-P > threshold):
→ BUY CE (Follow bullish momentum)
Puts Expensive (C-P < -threshold):
→ BUY PE (Follow bearish momentum)
Near Parity:
→ NEUTRAL (No clear trend)
Best for: Intraday scalpers, directional traders, swing traders
MEAN REVERSION Mode 🔄
Counter-trend strategy focused on premium selling.
Signal Logic:
text
Calls Overpriced (C-P > threshold):
→ SELL CE (Collect inflated premium)
Puts Overpriced (C-P < -threshold):
→ SELL PE (Collect inflated premium)
Near Parity:
→ ATM (Fair value, no edge)
Best for: Option writers, theta decay strategies, credit spread traders
4. 🎨 Fully Customizable Display
Dynamic Table Positioning (9 Options):
Top: left, center, right
Middle: left, center, right
Bottom: left, center, right
Choose position based on your chart layout and other indicators.
Dynamic Table Sizing (6 Options):
Auto - Adapts to content
Tiny - Minimal space (for cluttered charts)
Small - Default, best balance
Normal - Medium size (1080p monitors)
Large - Big text (4K monitors)
Huge - Maximum size (presentations)
Text scales intelligently:
Headers, data, and checkmarks adjust proportionally
Checkmarks remain visible even in tiny mode
Info row stays readable at all sizes
5. ⚙️ Simplified Input System
Auto Mode (Recommended):
Enter just 5 strikes once at market open - used for both calls and puts.
Example for NIFTY at 25,900:
text
Strike 1: 25850 (ATM - 100)
Strike 2: 25900 (ATM - 50)
Strike 3: 25950 (ATM)
Strike 4: 26000 (ATM + 50)
Strike 5: 26050 (ATM + 100)
Manual Mode (Advanced):
Enter separate call and put strikes for cross-strike arbitrage analysis.
Why this matters:
50% fewer inputs compared to traditional indicators
One-time setup at market open
Rarely needs updating (only if market moves 100+ points)
6. 🎛️ Semi-Automatic ATM Detection
The indicator automatically:
Detects current NIFTY/BANKNIFTY spot price
Calculates ATM strike (rounded to nearest 50 or 100)
Marks ATM strikes with *ATM in the table
Displays ATM and spot price in info box
No manual recalculation needed!
7. 📊 Clean Information Display
Main Table (Top/Middle/Bottom):
CE \ PE matrix showing all strike combinations
Checkmarks (✓✓ and ✓) highlighting best matches
SIGNAL column with color-coded trading recommendations
Best Match footer showing optimal combination
Info row displaying symbol, signal mode, and spot price
Info Box (Bottom Left):
Symbol (NIFTY/BANKNIFTY)
Signal Mode (Smart/Momentum/Mean Reversion)
Current Spot Price
Detected ATM Strike
Best Matched Call Strike
Best Matched Put Strike
Match Difference
C-P value for best match
📋 Quick Setup Guide (3 Steps)
Step 1: Add Indicator
Open NIFTY or BANKNIFTY chart on TradingView
Add "Call-Put Cross Strike Match " from indicators
Step 2: Configure Basic Settings
text
Symbol Detection: Auto (reads from chart)
Expiry Date: 251219 (format: YYMMDD for 19-Dec-2025)
Strike Mode: Auto
Strike Interval: 50 (for NIFTY) or 100 (for BANKNIFTY)
Step 3: Enter Strikes
At market open (9:15 AM), check current price and enter 5 strikes:
text
Example: NIFTY at 25,937
Strike 1: 25850 (ATM - 100)
Strike 2: 25900 (ATM - 50)
Strike 3: 25950 (ATM) ← Rounded to nearest 50
Strike 4: 26000 (ATM + 50)
Strike 5: 26050 (ATM + 100)
That's it! The indicator handles everything else automatically.
💡 Real-World Use Cases
1. 📉 Premium Selling (Mean Reversion Mode)
Scenario: Looking for overpriced options to write
How to use:
Set Signal Mode to "Mean Reversion"
Set Threshold: 30 (NIFTY) or 75 (BANKNIFTY)
Look for SELL CE or SELL PE signals with ✓ or ✓✓
Sell naked options or credit spreads at those strikes
Target 30-50% profit or 3-5 days theta decay
Perfect for: Credit spreads, iron condors, covered calls, naked puts
2. 📈 Directional Trading (Momentum Mode)
Scenario: Scalping intraday moves
How to use:
Set Signal Mode to "Momentum"
Set Threshold: 15 (aggressive) or 25 (conservative)
BUY CE signal + ✓✓ = Long call entry
Enter with tight stop (20% of premium)
Target 30-50% gain within 1-2 hours
Perfect for: Intraday scalping, swing trading, trend following
3. 🔄 Synthetic Positions (Smart Mode)
Scenario: Building synthetic long/short with defined risk
How to use:
Set Signal Mode to "Smart"
Look for BUY CE at ITM strike + SELL PE at OTM strike
Both should have ✓ indicator (good parity)
Creates synthetic long position
Lower capital than buying futures
Perfect for: Professional traders, arbitrage, capital efficiency
4. ⚖️ ATM Strategy Optimization (Smart Mode)
Scenario: Finding optimal strikes for straddle/strangle
How to use:
Identify strike marked *ATM
Check if signal shows ATM (balanced market)
If BULL/BEAR → Market has directional bias, adjust accordingly
✓✓ indicates best matched strike for neutral strategies
Perfect for: Volatility trading, earnings plays, event trading
5. 🛡️ Hedging Optimization (Smart Mode)
Scenario: Protecting long equity positions
How to use:
Look for BUY PE signals (protection signals)
Avoid strikes with SELL PE (expensive hedges)
✓✓ shows best value for hedge entry
Optimize hedge timing and strike selection
Perfect for: Portfolio hedging, risk management, protective puts
⚙️ Settings Guide
Symbol Settings
Symbol Detection: Auto (recommended) or Manual
Manual Symbol: NIFTY or BANKNIFTY
Expiry Date: Format YYMMDD (e.g., 251219 = 19-Dec-2025)
Update every Thursday after 3:30 PM for next week's expiry
Strike Settings
Strike Mode: Auto (recommended) or Manual
Strike Interval:
50 for NIFTY
100 for BANKNIFTY
Trading Signals
Signal Mode: Smart / Momentum / Mean Reversion
Smart: Professional institutional strategy (default)
Momentum: Trend-following for scalpers
Mean Reversion: Premium selling for writers
Signal Threshold: Sensitivity in points
NIFTY Recommendations:
Conservative: 30-40 points (fewer, higher quality signals)
Balanced: 20-25 points (default)
Aggressive: 10-15 points (more signals, more noise)
BANKNIFTY Recommendations:
Conservative: 75-100 points
Balanced: 50-60 points (default)
Aggressive: 30-40 points
Algorithm Settings
Matching Mode:
Top 3: Shows 3 best matches (cleaner display)
Top 5: Shows 5 best matches (more opportunities)
Display Settings
Show Matching Table: Enable/disable main table
Table Position: Choose from 9 positions
top_right (default) - Doesn't block price action
middle_right - Centered vertical view
bottom_right - If top is crowded
Table Size: Choose from 6 sizes
small (default) - Best for most users
normal - For 1080p/4K monitors
tiny - If you have many indicators
📊 Understanding The Table
Table Layout Example:
text
CE \ PE | 25950 | 25900 | 25850 | 26000 | 26050 | SIGNAL
---------|-------|-------|-------|-------|-------|--------
25850 | | | | | | SELL PE
25900*ATM| | ✓ | | | | ATM
25950 | ✓✓ | | | | | BULL
26000 | | | | ✓ | | BUY CE
26050 | | | | | | SELL CE
---------|-------|-------|-------|-------|-------|--------
Best Match: 25950 / 25950 (0.25)
Info: NIFTY | Smart | Spot:25881.9
Reading the Table:
Rows (Left): Call option strike prices
Columns (Top): Put option strike prices
Cells: Checkmarks where Call ≈ Put
✓✓: Best match (minimum price difference)
✓: Good matches (top 3 or 5)
Empty: Prices too different (no match)
*ATM: Automatically detected at-the-money strike
SIGNAL Column: Actionable trading recommendation for each call strike
Info Box Metrics:
Symbol: Currently analyzed index
Signal Mode: Active strategy
Spot: Current underlying price
ATM: Calculated at-the-money strike
Best Call: Matched call strike
Best Put: Matched put strike
Match Diff: Price difference (lower = better)
C-P (Best): Call minus Put for best match
📈 Best Practices
Strike Selection & Maintenance
At Market Open (9:15 AM):
Check current price (e.g., NIFTY at 25,937)
Round to nearest interval (25,950 for 50 interval)
Enter 5 strikes: -100, -50, 0, +50, +100 from ATM
Update Frequency:
Usually no update needed entire day
Update only if market moves 100+ points from initial ATM
Typically 0-2 updates per trading session
Signal Interpretation by Confidence Level
High Confidence (✓✓ + Signal):
Best match indicator present
Strongest signal quality
Highest probability setup
Medium Confidence (✓ + Signal):
Good match present
Reliable signal
Acceptable risk/reward
Low Confidence (Signal without ✓):
No match indicator
Strike far from parity
Requires additional confirmation
Risk Management Rules
Never trade signals blindly. Always:
✅ Confirm with price action and support/resistance
✅ Check overall market trend (NIFTY/BANKNIFTY direction)
✅ Consider time decay (theta) for your position
✅ Monitor IV changes (implied volatility)
✅ Use proper position sizing (1-2% risk per trade)
✅ Set stop losses (20-30% of premium for longs)
✅ Have profit targets (30-50% for scalps)
Timeframe Selection
Intraday Trading:
Use 5-minute or 15-minute chart
Momentum or Smart mode
Lower threshold (aggressive)
Quick entries and exits
Positional Trading:
Use hourly or daily chart
Smart or Mean Reversion mode
Higher threshold (conservative)
Swing trade positions
Combining with Other Tools
Recommended complements:
Support/resistance levels (horizontal lines)
Trend indicators (EMA 20/50, SuperTrend)
Volume analysis (confirm breakouts)
India VIX (volatility context)
Option chain data (open interest)
🎓 Strategy Examples
Strategy 1: Professional Premium Selling
text
Mode: Mean Reversion
Threshold: 30 (NIFTY) / 75 (BANKNIFTY)
Timeframe: Daily
Rules:
1. Wait for SELL CE or SELL PE signal
2. Verify strike has ✓ or ✓✓ (good parity)
3. Check if OTM (Strike away from spot)
4. Sell option or create credit spread
5. Target: 30-50% profit or 3-5 days theta
6. Stop: If signal changes to BUY
Position: Naked short or credit spreads
Risk: Define with spreads or capital allocation
Strategy 2: Intraday Momentum Scalping
text
Mode: Momentum
Threshold: 15 (aggressive)
Timeframe: 5-minute
Rules:
1. Wait for BUY CE signal + ✓✓
2. Enter long call immediately
3. Stop loss: 20% of premium paid
4. Target 1: 30% gain (partial exit)
5. Target 2: 50% gain (full exit)
6. Exit if signal changes or 2 hours pass
Position: Long calls or long puts only
Risk: 1-2% of capital per trade
Strategy 3: Synthetic Long Position
text
Mode: Smart
Threshold: 25 (NIFTY) / 60 (BANKNIFTY)
Timeframe: Hourly
Rules:
1. Identify BUY CE signal at ITM strike
2. Identify SELL PE signal at OTM strike
3. Both should have ✓ indicator
4. Buy ITM call + Sell OTM put = Synthetic Long
5. Lower capital than futures
6. Defined risk (width of strikes)
Position: Call debit + Put credit
Risk: Net debit paid (defined risk)
Strategy 4: ATM Straddle Entry
text
Mode: Smart
Threshold: 20 (default)
Timeframe: Daily
Rules:
1. Find strike marked *ATM
2. Check signal shows "ATM" (neutral)
3. Verify ✓✓ at that strike
4. Sell ATM call + Sell ATM put
5. Collect maximum premium
6. Exit at 30% profit or before expiry
Position: Short straddle or iron condor
Risk: Use defined risk (iron condor recommended)
🔔 Important Notes
Data Accuracy
Indicator uses TradingView's NSE options data feed
Always verify prices independently before trading
Ensure market is open (9:15 AM - 3:30 PM IST)
Check for "-" in cells indicating missing data
Expiry Management
Update expiry date every week on Thursday post-closing
Format: YYMMDD (6 digits)
Weekly expiry: Every Thursday
Monthly expiry: Last Thursday of month
Strike Format
NIFTY: Multiples of 50 (25850, 25900, 25950...)
BANKNIFTY: Multiples of 100 (51800, 51900, 52000...)
Wrong strikes = No data in table
Performance Optimization
Indicator updates every bar close
No lag or performance issues
Works on all timeframes (1m to 1D)
Maximum 5 calls + 5 puts = 10 security calls (within limits)
⚠️ Disclaimer
Trading options involves substantial risk of loss and is not suitable for all investors. This indicator is provided for educational and informational purposes only. It does not constitute financial advice, investment advice, or trading advice.
Important disclaimers:
Options can expire worthless, resulting in 100% loss
Past performance of signals is not indicative of future results
Accuracy depends on TradingView's NSE data feed
Signals are mathematical analysis, not predictions
You are solely responsible for your trading decisions
The developer is not liable for any trading losses incurred while using this indicator.
Before trading, ensure you understand:
Options Greeks (Delta, Gamma, Theta, Vega, Rho)
Implied volatility and its impact
Time decay and expiration risks
Assignment risk for short positions
Liquidity and slippage considerations
Margin requirements and capital needs
Always:
Use proper risk management (1-2% per trade)
Trade with capital you can afford to lose
Paper trade before live trading
Consult with a licensed financial advisor
Start with small position sizes
Never risk more than you can afford to lose
📊 Technical Specifications
Platform: TradingView Pine Script v6
Exchanges: NSE (National Stock Exchange of India)
Instruments: NIFTY, BANKNIFTY options
Timeframes: All (1m, 5m, 15m, 1h, 1D)
Strikes Analyzed: 5 calls × 5 puts = 25 combinations
Security Calls: 10 (5 calls + 5 puts)
Table Positions: 9 (all corners and centers)
Table Sizes: 6 (auto to huge)
Signal Modes: 3 (Smart, Momentum, Mean Reversion)
Performance: Optimized, minimal lag
🎯 Who Should Use This?
✅ Perfect For:
Options Traders: Intraday and positional
Premium Sellers: Option writers and theta strategists
Arbitrage Traders: Synthetic position builders
Straddle/Strangle Traders: ATM strategy traders
Professional Traders: Institutional-grade analysis
Volatility Traders: IV imbalance exploiters
Scalpers: Quick intraday moves
❌ Not Suitable For:
Stock options traders (NSE index-specific)
Equity-only traders (requires options knowledge)
International markets (NSE format only)
Complete beginners (requires basic options understanding)
💬 FAQ
Q: Why manual strike entry? Why not fully automatic?
A: Pine Script's type system limits fully automatic strike generation from live data. However, setup takes just 30 seconds once at market open, and the indicator handles all analysis automatically throughout the day.
Q: How often should I update strikes?
A: Rarely! Only when market moves 100+ points from initial ATM. Usually 0-2 times per day, even in volatile markets.
Q: Which Signal Mode is best?
A: Smart mode (default) for professional trading. Use Momentum for intraday scalping, Mean Reversion for premium selling.
Q: Can I use this for stock options?
A: No. The indicator is designed specifically for NSE index options (NIFTY and BANKNIFTY) with NSE format.
Q: Does it work on mobile?
A: Yes, but table display is optimized for desktop/tablet screens. Use "tiny" or "small" size on mobile.
Q: What if I see "-" in cells?
A: Check expiry format (YYMMDD), verify strikes match NSE strikes, and ensure market is open.
Q: What's the difference between ✓✓ and ✓?
A: ✓✓ = Best match (lowest price difference), highest quality. ✓ = Good matches (top 3-5), reliable quality.
Q: Can I backtest this indicator?
A: The indicator shows live analysis. For backtesting options strategies, you'll need historical options data and separate backtesting tools.
Q: What does the info box show?
A: Bottom-left box shows key metrics: symbol, signal mode, spot price, ATM strike, best matched strikes, match difference, and C-P value.
Q: Why no chart plotting?
A: v1.0 focuses on clean table display with maximum information density. Chart plotting may be added in future versions based on user feedback.
🙏 Credits
Developed by a professional options trader for the Indian trading community. Inspired by institutional trading desks and market makers who use call-put parity for daily trading decisions.
Found This Helpful?
⭐ Rate 5 stars if it improved your trading
💬 Comment with your strategy results
🔔 Follow for updates and new indicators
📢 Share with fellow options traders
Feature Requests
Continuous improvement based on trader feedback. Suggest features in comments!
Planned Features (v2.0):
Multi-expiry comparison
Greeks display (Delta, Theta, Vega)
Historical signal performance stats
Custom signal formulas
Export to CSV functionality
🏷️ Tags for Search
#Options #OptionsTrading #NIFTY #BANKNIFTY #NSE #India #OptionChain #CallPut #PutCallParity #Straddle #Strangle #ATM #TradingSignals #OptionsStrategy #PremiumSelling #OptionsScanner #Derivatives #IntradayTrading #VolatilityTrading #Arbitrage #SyntheticPosition #OptionsGreeks #OptionsSelling #OptionsWriting #IndianStockMarket #NSEOptions #OptionsAnalysis #TechnicalAnalysis #AlgoTrading #QuantTrading #ProfessionalTrading #TradingIndicator #PineScript #TradingView
📝 Version History
v1.0 (Current - Dec 2025)
Pine Script v6 implementation
Cross-strike matching (5×5 matrix, 25 combinations)
Three signal modes (Smart, Momentum, Mean Reversion)
Trading signal generation with color coding
Dynamic table positioning (9 positions)
Dynamic table sizing (6 sizes)
Intelligent text scaling
Semi-automatic ATM detection
Auto symbol detection
Simplified input system (50% fewer inputs in Auto mode)
Clean information display
Info box with key metrics
NSE NIFTY & BANKNIFTY support
Start trading smarter with institutional-grade options analysis! 📈💰🚀
Disclaimer: Options trading is subject to market risk. Please read all scheme-related documents carefully before investing.

IFVGs [NINE]Overview
The IFVG Indicator is a precision-engineered tool designed to identify and display Inversion Fair Value Gaps (IFVGs), a powerful price action concept rooted in ICT (Inner Circle Trader) methodology. This indicator automatically detects when price closes through an existing Fair Value Gap, causing the zone to "invert" and flip its directional bias, signaling potential areas of institutional interest for future price reactions.
What is an Inversion Fair Value Gap?
A Fair Value Gap (FVG) is a three-candle pattern where a gap exists between the wicks of the first and third candles, representing an imbalance in price delivery. These zones often act as magnets for price to return and "fill" the inefficiency.
An Inversion Fair Value Gap (IFVG) occurs when price doesn't just tap into an FVG, it closes through it with a candle body. This "inversion" transforms the zone:
A Bullish FVG that gets closed through becomes a Bearish IFVG (potential resistance/supply zone)
A Bearish FVG that gets closed through becomes a Bullish IFVG (potential support/demand zone)
IFVGs represent areas where the market has shown its hand — institutional order flow has aggressively moved through a prior inefficiency, and the inverted zone now becomes a point of interest for potential reversals or continuations.
Key Features
Automatic IFVG Detection
The indicator continuously monitors for Fair Value Gaps and automatically converts them to IFVGs when price body closes through the zone. No manual identification required.
Multiple Display Styles
Choose from four distinct visualization modes to match your chart aesthetic:
Level — Clean, minimal single line at the IFVG extreme (top for bullish, bottom for bearish)
Normal — Filled zone with dashed borders and dot label
Minimalist — High/low boundary lines with connecting link
Classic — Filled box with 50% midline only
Full Customization
Independent colors for bullish and bearish IFVGs
Adjustable transparency for zone fills
Optional 50% midline (Consequent Encroachment level)
Flexible label styles: "IFVG" or "+/−" notation
Multiple label sizes: Tiny, Small, Normal, Large
Smart Extension Options
Extend to Current Bar — Zones dynamically extend as price progresses
Extend to Confirmation — Zones end at the bar where inversion occurred
Manual Offset — Fine-tune extension length in bars
Clustered IFVG Filter
Prevents chart clutter by ensuring only one IFVG per direction forms within a 5-bar cooldown period. When a single candle closes through multiple FVGs, only the first IFVG of that directional series is displayed — eliminating redundant signals and keeping your chart clean.
FVG Lookback Control
Limit which FVGs can become IFVGs based on their age. Options include 10, 50, 100, 200, or 300 bars. This filters out old, stale FVGs that may create less relevant inversions.
Session Time Filters
Optional time-based filtering allows you to focus on specific trading sessions:
Configurable session windows (e.g., 9:30 AM - 12:00 PM)
Support for two independent session filters
Multiple timezone options including New York, London, Tokyo, and more
Volume Imbalance Detection
Optionally include Volume Imbalances (VIs) — gaps between candle bodies rather than wicks — expanding the scope of detectable inefficiencies.
Invalidation Tracking
IFVGs are automatically invalidated when price closes back through the zone in the opposite direction, with optional display of invalidated zones.
How to Use
Entry Confirmation
IFVGs serve as areas for trade entries. When price returns to a confirmed IFVG:
Bullish IFVG — Look for long entries as price taps the zone from above
Bearish IFVG — Look for short entries as price taps the zone from below
Settings Reference
Inversion Fair Value Gaps
Show IFVGs? — Master toggle for IFVG display
Style — Level, Normal, Minimalist, or Classic
Transparency % — Zone fill opacity (0-100)
Historical Display — Maximum IFVGs to show per direction
Bullish/Bearish Colors — Independent color selection
Show Invalidated? — Display IFVGs that have been invalidated
Extend IFVGs? — Enable dynamic zone extension
Extension Mode — Current Bar or Confirmation
Manual Offset — Additional bars to extend
High/Low Lines — Show boundary lines (Minimalist style)
50% Midline — Show Consequent Encroachment level
Show Labels? — Display zone labels
Label Style — IFVG or +/− notation
FVG Lookback — Maximum age of FVGs that can invert
Clustered Filter — Prevent multiple same-direction IFVGs in quick succession
Volume Imbalances — Include body gaps in detection
Session Filters
Enable 1st/2nd Time Filter — Activate session filtering
Session Times — Define active trading windows
Timezone — Reference timezone for session calculations
Disclaimer
This indicator is provided for educational and informational purposes only. It is not financial advice, and nothing contained herein constitutes a recommendation, solicitation, or offer to buy or sell any securities, options, or other financial instruments.
Trading involves substantial risk of loss and is not suitable for all investors. Past performance is not indicative of future results. You should carefully consider your investment objectives, level of experience, and risk appetite before making any trading decisions.
The developer of this indicator makes no representations or warranties regarding the accuracy, completeness, or reliability of the information provided. You are solely responsible for your own trading decisions and any profits or losses that may result.
Always conduct your own research and consider seeking advice from a licensed financial professional before trading.

NWOG/NDOG [NINE]Overview
A professional-grade indicator for detecting and visualizing New Week Opening Gaps (NWOGs) and New Day Opening Gaps (NDOGs), essential concepts in ICT (Inner Circle Trader) methodology and analysis.
What Are Opening Gaps?
Opening gaps represent price inefficiencies created between trading sessions. When one session closes and the next session opens at a different price, the resulting "gap" creates a zone of unfilled orders and potential liquidity. These gaps often act as magnets for price, providing high-probability trading opportunities as the market seeks to rebalance these inefficiencies.
NWOG (New Week Opening Gap)
The gap between Friday's close and Sunday's open. These weekly imbalances are significant because they represent the collective repositioning of institutional traders over the weekend. NWOGs frequently serve as major support/resistance zones that can influence price action for days or even weeks. Due to their larger timeframe context, NWOGs typically carry more weight than daily gaps.
NDOG (New Day Opening Gap)
The gap between one session's close and the next session's open. Daily gaps occur more frequently than weekly gaps, offering more regular trading setups. While individually less significant than NWOGs, NDOGs provide valuable intraday reference points and often fill within the same trading session.
Features In Depth
Gap Detection & Visualization
The indicator automatically identifies and plots opening gaps as they form in real-time.
Automatic Detection: The indicator monitors session transitions and instantly identifies when a gap forms between the previous close and current open. NWOGs are detected on Sunday opens, while NDOGs are detected at each new daily session open (excluding Sundays, which are reserved for NWOG detection).
Bullish vs Bearish Classification: Each gap is automatically classified based on its direction:
Bullish Gap (Gap Up): Current open is higher than previous close, indicates overnight buying pressure
Bearish Gap (Gap Down): Current open is lower than previous close, indicates overnight selling pressure
The indicator uses distinct color schemes for bullish and bearish gaps, making it easy to identify gap direction at a glance. Current/most recent gaps use the "new" color settings, while historical gaps use the standard color settings.
Historical Tracking: Track up to 20 gaps of each type simultaneously. The "Historical Count" setting controls how many gaps remain visible on your chart. Older gaps are automatically removed as new ones form, keeping your chart clean while maintaining relevant historical context.
Visual Customization:
Toggle gap boundary lines (HIGH/LOW) on or off independently from the background fill
Choose line styles: solid (⎯⎯⎯), dashed (----), or dotted (····)
Adjust line thickness from 1-4 pixels
Enable/disable background fill with customizable transparency
Set colors independently for current vs historical gaps
Consequent Encroachment (C.E.)
The Consequent Encroachment represents the 50% midpoint of a gap — a critical level in ICT methodology.
Why C.E. Matters: In smart money concepts, the C.E. level represents the point of maximum efficiency within an imbalance. Price often gravitates toward this level as it seeks to rebalance the gap. Many traders use C.E. as their primary target when trading gap fills, or as a key level for entries and stop placement.
C.E. Display Options:
Independent color settings for current vs historical gaps
Separate line style and thickness controls
Can be shown/hidden independently from gap boundaries
Quarter Levels (25% and 75%): For traders who want additional precision, the indicator offers optional quarter levels at 25% and 75% of the gap range. These levels can serve as:
Partial profit targets
Scaling entry points
Additional support/resistance zones within the gap
Fill Tracking & Percentage
The indicator provides sophisticated fill tracking to monitor how much of each gap has been "filled" by subsequent price action.
How Fill Percentage Works:
For bullish gaps (gap up): Measures how far price has retraced DOWN from the gap's high toward its low
For bearish gaps (gap down): Measures how far price has retraced UP from the gap's low toward its high
The fill percentage updates in real-time as price moves through the gap zone, giving you instant feedback on gap fill progress.
Fill Detection Methods:
Wicks: Uses the full candle range (high/low) — more sensitive, detects fills earlier
Bodies: Uses only open/close prices — more conservative, requires stronger commitment
Visual Fill Indicators: The fill percentage is displayed with intuitive symbols:
〇 0-24% filled — Gap is largely untouched
◔ 25-49% filled — Minor fill in progress
◑ 50-74% filled — C.E. level has been reached
◕ 75-99% filled — Gap nearly complete
⬤ 100% filled — Gap fully filled
Hide Filled Gaps: Enable this option to automatically remove gaps from your chart once they reach 100% fill. This keeps your chart focused on active, unfilled gaps that still represent potential trading opportunities.
Projection Levels
When price breaks out of a gap zone, projection levels provide potential targets based on the gap's size.
How Projections Work: Once price closes above a gap's high (for upward projections) or below a gap's low (for downward projections), the indicator calculates extension levels using the gap's range as a measuring unit. These projections function similarly to Fibonacci extensions but are anchored to the gap's dimensions.
Projection Direction:
Upward Projections: Triggered when price closes above the gap's high — levels project above the gap
Downward Projections: Triggered when price closes below the gap's low — levels project below the gap
Customizable Multipliers: Define your own projection levels using the "Projection Levels" input. Enter comma-separated values representing multiples of the gap size:
Default: 0.5,1,2,2.5
Example custom: 0.618,1,1.618,2,2.618 (Fibonacci-based)
Each value creates a projection line at that multiple of the gap range
Projection Display Options:
Side: Display projections on the Left (extending back from gap formation) or Right (extending forward)
Color, Style, Thickness: Full visual customization
Labels: Show multiplier values at each projection level
"Extend Until Tapped" Feature: When enabled (Left side only), projection lines stop extending once price touches them. This creates a visual record of which levels have been reached and when, helping you track projection performance over time. Untapped projections continue extending until they're reached.
Labels & Formatting
Comprehensive labeling options help you quickly identify and reference gaps on your chart.
Label Format Options:
Gap Type: Simple label showing "NWOG" or "NDOG"
Gap Type + Date: Includes the full date with day of week (e.g., "NWOG Monday, November 3, 2025")
Gap Type + Date + Filled Percent: Adds the fill percentage and symbol (e.g., "NWOG Monday, November 3, 2025 ")
Label Positioning:
When Show Levels is ON: Separate labels appear at the HIGH and LOW boundaries
When Show Levels is OFF: A single label appears at the C.E. (midpoint) level
Label Customization:
Text size: Tiny, Small, Normal, or Large
Text color and background color (set background transparency to 100 for no background)
Tooltips provide detailed information including all price levels and fill percentage
Hide Historical Labels: Enable this option to hide labels and projection text on all gaps except the most recent. Lines remain visible, but text clutter is reduced — useful when tracking many historical gaps.
Status Table
An optional summary table provides at-a-glance information about all active gaps.
Table Contents: For each active gap, the table displays:
Gap Type: NWOG or NDOG with date
HIGH: Upper boundary of the gap
LOW: Lower boundary of the gap
C.E.: Consequent Encroachment (50% level)
% Filled: Current fill percentage with visual symbol
Display Settings:
Position: 9 positions available (Top/Middle/Bottom × Left/Center/Right)
Size: Tiny, Small, or Normal text
Gap Count: Control how many NWOGs and NDOGs appear in the table (1-3 each)
Adaptive Theming: The table automatically detects your chart's background color and adjusts text colors for optimal readability on both light and dark themes.
Smart Filtering: The table only shows unfilled gaps (or gaps not hidden by the "Hide Filled" setting), keeping the display focused on actionable information.
Alert System
Stay informed of key gap events without constantly monitoring your charts.
Gap Formation Alerts: Receive an alert the moment a new gap is detected. The alert includes:
Gap direction (Bullish/Bearish)
Gap type (NWOG/NDOG)
Symbol name
Example: "Bullish NWOG formed on AMEX:SPY "
Gap Filled Alerts: Get notified when a gap reaches 100% fill. This is valuable for:
Confirming trade targets have been reached
Identifying when gaps are no longer active reference points
Example: "NWOG filled on AMEX:SPY "
Projection Level Alerts: Receive alerts when price reaches your defined projection levels. Each level only alerts once, preventing spam. Useful for:
Taking profits at projection targets
Identifying extended moves beyond the gap
Example: "NWOG 2x projection reached on AMEX:SPY "
General Settings
Gap Offset: Controls how many bars the gap lines extend to the right of the current candle (0-15 bars). A higher offset keeps labels and lines visible further into the future, while a lower offset keeps the display tighter to current price action.
Tips
NWOG Priority: NWOGs typically hold more significance than NDOGs due to their weekly timeframe. When NWOG and NDOG levels conflict, consider giving more weight to the NWOG.
Unfilled Historical Gaps: Gaps from days or weeks ago can still influence current price action. Don't ignore older unfilled gaps — they often become relevant when price returns to those zones.
Session Context: Pay attention to which session created the gap. Gaps formed during high-volume sessions (like NYSE open) may carry more significance than gaps from lower-volume periods.
Gap Size Matters: Larger gaps represent more significant imbalances and often provide stronger support/resistance. Smaller gaps may fill quickly and offer less reliable levels.
Clean Chart Option: Use "Hide Historical Labels" combined with the status table to maintain a clean chart while still having access to all gap information.
Requirements
Intraday Timeframes Only: This indicator works exclusively on intraday timeframes (minutes, hours). Gap detection requires session open/close data that is only available on intraday charts.
Sufficient Historical Data: Ensure your chart has enough historical bars loaded for accurate gap tracking, especially if using higher historical count settings.
Session-Based Markets: The indicator is optimized for markets with distinct trading sessions (stocks, futures, forex). 24/7 markets like crypto may show fewer or different gap patterns.
Disclaimer
For Educational and Informational Purposes Only
This indicator is provided as a technical analysis tool for educational and informational purposes only. It is not intended as, and should not be construed as, financial advice, investment advice, trading advice, or any other type of advice.
No Guarantees: Past performance of any trading strategy, indicator, or methodology is not indicative of future results. The identification of gaps, projections, and fill levels does not guarantee that price will behave in any predicted manner. Markets are inherently unpredictable, and no technical indicator can accurately predict future price movements.
Risk Warning: Trading financial instruments involves substantial risk of loss and is not suitable for all investors. You should carefully consider your investment objectives, level of experience, and risk appetite before trading. Never trade with money you cannot afford to lose.
Not Financial Advice: The creator of this indicator (NINE) is not a licensed financial advisor, broker, or dealer. Nothing in this indicator or its documentation should be interpreted as a recommendation to buy, sell, or hold any financial instrument.
Your Responsibility: You are solely responsible for your own trading decisions. Always conduct your own research and due diligence before making any trading or investment decisions. Consider consulting with a qualified financial professional before trading.
No Liability: The creator assumes no responsibility or liability for any errors, inaccuracies, or omissions in this indicator or its documentation. The creator shall not be held liable for any losses, damages, or costs arising from the use or inability to use this indicator.

One for AllOne for All (OFA) - Complete ICT Analysis Suite
Version 3.3.0 by theCodeman
📊 Overview
One for All (OFA) is a comprehensive TradingView indicator designed for traders who follow Inner Circle Trader (ICT) concepts. This all-in-one tool combines essential ICT analysis features—sessions, kill zones, previous period levels, and higher timeframe candles with Fair Value Gaps (FVGs) and Volume Imbalances (VIs)—into a single, highly customizable indicator. Whether you're a beginner learning ICT concepts or an experienced trader refining your edge, OFA provides the visual structure needed for precise market analysis and execution.
✨ Key Features
- 🏷️ Customizable Watermark**: Display your trading identity with customizable titles, subtitles, symbol info, and full style control
- 🌍 Trading Sessions**: Visualize Asian, London, and New York sessions with high/low lines, range boxes, and open/close markers
- 🎯 Kill Zones**: Highlight 5 critical ICT kill zones with precise timing and visual boxes
- 📈 Previous Period H/L**: Track Daily, Weekly, and Monthly highs/lows with customizable styles and lookback periods
- 🕐 Higher Timeframe Candles**: Display up to 5 HTF timeframes with OHLC trace lines, timers, and interval labels
- 🔍 FVG & VI Detection**: Automatically detect and visualize Fair Value Gaps and Volume Imbalances on HTF candles
- ⚙️ Universal Timezone Support**: Works globally with GMT-12 to GMT+14 timezone selection
- 🎨 Full Customization**: Control colors, styles, visibility, and layout for every feature
🚀 How to Use
Watermark Setup
The watermark overlay helps you identify your charts and maintain focus on your trading principles:
1. Enable/disable watermark via "Show Watermark" toggle
2. Customize the title (default: "Name") to display your trading name or account identifier
3. Set up to 3 subtitles (default: "Patience", "Confidence", "Execution") as trading reminders
4. Choose position (9 locations available), size, color, and transparency
5. Toggle symbol and timeframe display as needed
Use Case: Display your trading principles or account name for multi-monitor setups or content creation.
Trading Sessions Analysis
Sessions define market character and liquidity availability:
1. Enable "Show All Sessions" to visualize all three sessions
2. Adjust timezone to match your local market (default: UTC-5 for EST)
3. Customize session times if needed (defaults cover standard hours)
4. Enable session range boxes to see consolidation zones
5. Use session high/low lines to identify key levels for the current session
6. Enable open/close markers to track session transitions
Use Case: Identify which session you're trading in, track session highs/lows for liquidity, and anticipate session transition volatility.
Kill Zones Trading
Kill zones are ICT's high-probability trading windows:
1. Enable individual kill zones or use "Show All Kill Zones"
2. **Asian Kill Zone** (2000-0000 GMT): Early positioning and smart money accumulation
3. **London Kill Zone** (0300-0500 GMT): European market opening volatility
4. **NY AM Kill Zone** (0930-1100 EST): Post-NYSE open expansion
5. **NY Lunch Kill Zone** (1200-1300 EST): Midday consolidation or manipulation
6. **NY PM Kill Zone** (1330-1600 EST): Afternoon positioning and closes
7. Customize colors and times to match your trading style
8. Set max days display to control historical visibility (default: 30 days)
Use Case: Focus entries during high-probability windows. Watch for liquidity sweeps at kill zone openings and institutional positioning.
Previous Period High/Low Levels
Previous period levels act as magnetic price targets and support/resistance:
1. Enable Daily (PDH/PDL), Weekly (PWH/PWL), or Monthly (PMH/PML) levels individually
2. Set lookback period (how many previous periods to display)
3. Choose line style: Solid (current emphasis), Dashed (standard), or Dotted (subtle)
4. Customize colors per timeframe for visual hierarchy
5. Adjust line width (1-5) for visibility preference
6. Enable gradient effect to fade older periods
7. Position labels left or right based on chart layout
8. Customize label text for your preferred notation
Use Case: Identify key levels where price is likely to react. Daily levels work on intraday timeframes, Weekly on daily charts, Monthly for swing trading.
Higher Timeframe (HTF) Candles
HTF candles reveal the larger market context while trading lower timeframes:
1. Enable up to 5 HTF slots simultaneously (default: 5m, 15m, 1H, 4H, Daily)
2. Choose display mode: "Below Chart" (stacked rows) or "Right Side" (compact column)
3. Customize timeframe, colors (bull/bear), and titles for each slot
4. **OHLC Trace Lines**: Visual lines connecting HTF candle levels to chart bars
5. **HTF Timer**: Countdown showing time remaining until HTF candle close
6. **Interval Labels**: Display day of week (Daily+) or time (intraday) on each candle
7. For Daily candles: Choose open time (Midnight, 8:30, 9:30) to match your market structure preference
Use Case: Trade lower timeframes while respecting higher timeframe structure. Watch for HTF candle closes to confirm directional bias.
FVG & VI Detection
Fair Value Gaps and Volume Imbalances highlight inefficiencies that price often revisits:
1. **Fair Value Gaps (FVGs)**: Detected when HTF candle wicks don't overlap between 3 consecutive candles
- Bullish FVG: Gap between candle 1 high and candle 3 low (green box by default)
- Bearish FVG: Gap between candle 1 low and candle 3 high (red box by default)
2. **Volume Imbalances (VIs)**: Similar detection but focuses on body gaps
- Bullish VI: Gap between candle 1 close and candle 3 open
- Bearish VI: Gap between candle 1 open and candle 3 close
3. Enable FVG/VI detection per HTF slot individually
4. Customize colors and transparency for each imbalance type
5. Boxes appear on chart at formation and remain visible as retracement targets
**Use Case**: Identify high-probability retracement zones. Price often returns to fill FVGs and VIs before continuing the trend. Use as entry zones or profit targets.
🎨 Customization
OFA is built for flexibility. Every feature includes extensive customization options:
Visual Customization
- **Colors**: Independent color control for every element (sessions, kill zones, lines, labels, FVGs, VIs)
- **Transparency**: Adjust box and label transparency (0-100%) for clean charts
- **Line Styles**: Choose Solid, Dashed, or Dotted for previous period lines
- **Sizes**: Control text size, line width, and box borders
- **Positions**: Place watermark in 9 positions, labels left/right
Layout Control
- **HTF Display Mode**: "Below Chart" for detailed analysis, "Right Side" for space efficiency
- **Drawing Limits**: Set max days for sessions/kill zones to manage chart clutter
- **Lookback Periods**: Control how many previous periods to display (1-10)
- **Gradient Effects**: Enable fading for older previous period lines
Timing Adjustments
- **Timezone**: Universal GMT offset selector (-12 to +14) for global markets
- **Session Times**: Customize each session's start/end times
- **Kill Zone Times**: Adjust kill zone windows to match your market's characteristics
- **Daily Open**: Choose Midnight, 8:30, or 9:30 for Daily HTF candle open time
💡 Best Practices
1. Start Simple: Enable one feature at a time to learn how each element affects your analysis
2. Match Your Timeframe: Use Daily levels on intraday charts, Weekly on daily charts, HTF candles one or two levels above your trading timeframe
3. Kill Zone Focus: Concentrate your trading activity during kill zones for higher probability setups
4. HTF Confirmation: Wait for HTF candle closes before committing to directional bias
5. FVG/VI Entries: Look for price to return to unfilled FVGs/VIs for entry opportunities with favorable risk/reward
6. Customize Colors: Use a consistent color scheme that matches your chart theme and reduces visual fatigue
7. Reduce Clutter: Disable features you're not actively using in your current trading plan
8. Session Context: Understand which session controls the market—trade with session direction or anticipate reversals at session transitions
⚙️ Settings Guide
OFA organizes settings into logical groups for easy navigation:
- **═══ WATERMARK ═══**: Title, subtitles, position, style, symbol/timeframe display
- **═══ SESSIONS ═══**: Enable/disable sessions, times, colors, high/low lines, boxes, markers
- **═══ KILL ZONES ═══**: Individual kill zone toggles, times, colors, max days display
- **═══ PREVIOUS H/L - DAILY ═══**: Daily high/low lines, style, color, lookback, labels
- **═══ PREVIOUS H/L - WEEKLY ═══**: Weekly high/low lines, style, color, lookback, labels
- **═══ PREVIOUS H/L - MONTHLY ═══**: Monthly high/low lines, style, color, lookback, labels
- **═══ HTF CANDLES ═══**: Global display mode, layout settings
- **═══ HTF SLOT 1-5 ═══**: Individual HTF configuration (timeframe, colors, title, FVG/VI detection, trace lines, timer, interval labels)
Each setting includes tooltips explaining its function. Hover over any input for detailed guidance.
📝 Final Notes
One for All (OFA) represents a complete ICT analysis toolkit in a single indicator. By combining watermark customization, session visualization, kill zone highlighting, previous period levels, and higher timeframe candles with FVG/VI detection, OFA eliminates the need for multiple indicators cluttering your chart.
**Version**: 3.3.0
**Author**: theCodeman
**Pine Script**: v6
**License**: Mozilla Public License 2.0
Start with default settings to learn the indicator's structure, then customize extensively to match your personal trading style. Remember: tools provide information, but your edge comes from disciplined execution of a proven strategy.
Happy Trading! 📈

Fibonacci Projection with Volume & Delta Profile (Zeiierman)█ Overview
Fibonacci Projection with Volume & Delta Profile (Zeiierman) blends classic Fibonacci swing analysis with modern volume-flow reading to create a unified, projection-based market framework. The indicator automatically detects the latest swing high and swing low, builds a complete Fibonacci structure, and then projects future extension targets with clear visual pathways.
What makes this tool unique is the integration of two volume-based systems directly into the Fibonacci structure. A Fib-aligned Volume Profile shows how bullish and bearish volume accumulated inside the swing range, while a separate Delta Profile reveals the imbalance of buy–sell pressure inside each Fibonacci interval. Together, these elements transform the standard Fibonacci tool into a multi-dimensional structural and volume-flow map.
█ How It Works
The indicator first detects the most recent swing high and swing low using the Period setting. That swing defines the Fibonacci range, from which the script draws retracement levels (0.236–0.786) and builds a forward projection path using the chosen Projection Level and a 1.272 extension.
Along this path, it draws projection lines, target boxes, and percentage labels that show how far each projected leg extends relative to the previous one.
Inside the same swing range, the script builds a Fib-based Volume Profile by splitting price into rows and assigning each bar’s volume as bullish (close > open) or bearish (close ≤ open). On top of that, it calculates a Volume Delta Profile between each pair of fib levels, showing whether buyers or sellers dominated that band and how strong that imbalance was.
█ How to Use
This tool helps traders quickly understand market structure and where the price may be heading next. The projection engine shows the most likely future targets, highlights strong or weak legs in the move, and updates automatically whenever a new swing forms. This ensures you always see the most relevant and up-to-date projection path.
The Fib Volume Profile shows where volume supported the move and where it did not. Thick bullish buckets reveal zones where buyers stepped in aggressively, often becoming retestable support. Thick bearish buckets highlight zones of resistance or rejection, particularly useful if projected levels align with prior liquidity.
The Delta Profile adds a second dimension to volume reading by showing where buy–sell pressure was truly imbalanced. A projected Fibonacci target that aligns with a strong bullish delta, for example, may suggest continuation. A projection into a band dominated by bearish delta may warn of reversal or hesitation.
█ Settings
Period – bars used to determine swing high/low
Projection Level – chosen Fib ratio for projection path
-----------------
Disclaimer
The content provided in my scripts, indicators, ideas, algorithms, and systems is for educational and informational purposes only. It does not constitute financial advice, investment recommendations, or a solicitation to buy or sell any financial instruments. I will not accept liability for any loss or damage, including without limitation any loss of profit, which may arise directly or indirectly from the use of or reliance on such information.
All investments involve risk, and the past performance of a security, industry, sector, market, financial product, trading strategy, backtest, or individual's trading does not guarantee future results or returns. Investors are fully responsible for any investment decisions they make. Such decisions should be based solely on an evaluation of their financial circumstances, investment objectives, risk tolerance, and liquidity needs.

CRT MTF + HTF Candles - Milana TradesCRT MTF + HTF Candles is an educational tool that helps you visualize higher-timeframe CRT and HTF candles on your intraday chart
The script automatically tracks key HTF levels and shows three types of CRT events:
1. Pending CRT
When a higher-timeframe candle breaks the previous high or low, the indicator marks this as a “pending” CRT.
This helps you see potential liquidity grabs and where price is currently trapped inside the HTF range
2. Completed CRT
A CRT becomes “completed” when price reaches the opposite side of the previously broken level
3. Invalid CRT
If price closes outside the HTF range before completion, the CRT is marked as invalid.
This helps you identify failed breaks and possible reversals.
Multi-Timeframe HTF Candles
The script draws clean higher-timeframe candles directly on your lower timeframe chart.
Each candle includes:
Body and wicks
HTF open & close
Swing high/low markers
Timeframe labels
Optional timers (showing time remaining in the candle)
Optional imbalances (FVG / volume imbalance)
Optional Midpont line (0.5)
HTF candle spacing
You can adjust candle width, spacing, and alignment so HTF candles fit nicely over lower-TF bars.
Gaps & Imbalances
The tool can highlight:
Fair value gaps
Volume imbalance
Swing Sweep line
When price tried update swing but closed inside the candle cange
Equlibrium line (Midpoint 0.5)
Timeframe tags & timers
Shows clear labels for each HTF candle
You can choose which timeframes to show (1H, 2H, 4H, Daily, etc.) and how many candles should be displayed
Trade smart, stay disciplined, and keep improving every day
Enjoy :)

Adaptive Trend Mapper-ATM (Arjo)Adaptive Trend Mapper (ATM) is a multi-factor trend, momentum, and compression-analysis tool designed to help traders visually map the strength and direction of market pressure.
Instead of simply combining existing indicators, ATM creates a new composite framework that blends momentum imbalance, directional strength, volatility contraction, and adaptive smoothing into a single, unified model.
Originality and usefulness
Adaptive Trend Mapper (ATM) does not replicate any one indicator.
It generates two custom indices— Bull Pressure Index and Bear Pressure Index —derived from a mathematical combination of RSI, inverse-RSI, and ADX. These indices behave differently from traditional oscillators:
They represent directional pressure on a 0–100 scale , not momentum.
They are designed to converge/diverge, forming a basis for the built-in Squeeze Detection Engine.
They can be optionally step-compressed , making the movement easier to read on fast or small charts.
The script also integrates a custom SuperSmoother trend model (not TradingView’s built-in function), which acts as an adaptive trend curve on the chart.
All calculations are combined intentionally—not as a mashup—to create a framework that allows traders to understand trend strength, compression phases, and micro-trend shifts in one place.
How the Indicator Works
1. Bull & Bear Pressure Indices:
These indices measure directional imbalance:
Bull Index = ADX strength weighted against inverse-RSI
Bear Index = ADX strength weighted against normal RSI
This produces two opposing pressure curves that rise or fall depending on whether buyers or sellers dominate.
You can optionally smooth these using:
SMA / EMA / WMA / RMA via the “Smoothing Settings” panel.
2. Squeeze & Compression Detection:
A squeeze is detected when:
ADX stays below a user-defined threshold
Bull–Bear Index difference shrinks
Average difference is falling (convergence)
This is a volatility-contraction model inspired by squeeze logic but applied to directional pressure, not Bollinger Bands/Keltner Channels .
3. Adaptive Trend Curve (SuperSmoother Engine)
The indicator applies a two-pole SuperSmoother filter to the price, then smooths it again using EMA.
The slope color flips between bullish and bearish and is displayed using:
A thin SuperSmoother curve
A thicker band for visual context
4. EMA-50 Trend Context:
An optional EMA-50 helps identify broad directional bias .
5. Step-Based Scaling
You can quantize the Bull/Bear indices using custom step intervals.
This makes the indicator easier to read on noisy intraday charts.
How to Use the Indicator
1. Trend Analysis
A rising Bull Index shows strengthening upward pressure
A rising Bear Index shows strengthening downward pressure
Wide divergence between the indices signals a strong trend
2. Compression / Squeeze Analysis
Yellow background = volatility compression + pressure convergence
Breakouts from this zone often precede directional expansion
3. Trendline Reading
SuperSmoother line color flip = micro trend shift
EMA-50 slope gives macro-trend direction
Perfect for combining trend and momentum maps on the same chart
4. Visual Interpretation
Cyan/teal → strong bullish pressure
Purple/red/orange → various levels of bearish control
Neutral/teal background → weak ADX
Yellow background → squeeze zone
Open-Source Notes
This script uses:
TradingView built-in RSI, ADX/DMI, and smoothing functions
A SuperSmoother implementation based on known DSP filter coefficients
All remaining logic, signal methods, composite indices, and compression model are original developments by ARJO .
The script is published open-source to comply with TradingView’s reuse policy.
Disclaimer
This tool is for educational and analytical purposes only.
It does not generate buy or sell signals.
Always use proper risk management.
Happy Trading (ARJO)

Quantura - Supply & Demand Zone DetectionIntroduction
“Quantura – Supply & Demand Zone Detection” is an advanced indicator designed to automatically detect and visualize institutional supply and demand zones, as well as breaker blocks, directly on the chart. The tool helps traders identify key areas of market imbalance and potential reversal or continuation zones, based on price structure, volume, and ATR dynamics.
Originality & Value
This indicator provides a unique and adaptive method of zone detection that goes beyond simple pivot or candle-based logic. It merges multiple layers of confirmation—volume sensitivity, ATR filters, and swing structure—while dynamically tracking how zones evolve as the market progresses. Unlike traditional supply and demand indicators, this script also detects and plots Breaker Zones when previous imbalances are violated, giving traders an extra layer of market context.
The key values of this tool include:
Automated detection of high-probability supply and demand zones.
Integration of both volume and ATR filters for precision and adaptability.
Dynamic zone merging and updating based on price evolution.
Identification of breaker blocks (invalidated zones) to visualize market structure shifts.
Optional bullish and bearish trade signals when zones are retested.
Clear, visually optimized plotting for efficient chart interpretation.
Functionality & Core Logic
The indicator continuously scans recent price data for swing highs/lows and combines them with optional volume and ATR conditions to validate potential zones.
Demand Zones are formed when price action indicates accumulation or a strong bullish rejection from a low area.
Supply Zones are created when distribution or strong bearish rejection occurs near local highs.
Breaker Blocks appear when existing zones are invalidated by price, helping traders visualize potential market structure shifts.
Bullish and bearish signals appear when price re-enters an active zone or breaks through a breaker block.
Parameters & Customization
Demand Zones / Supply Zones: Enable or disable each individually.
Breaker Zones: Activate breaker block detection for invalidated zones.
Volume Filter: Optional filter to only confirm zones when volume exceeds its long-term average by a user-defined multiplier.
ATR Filter: Optional filter for volatility confirmation, ensuring zones form under strong momentum conditions.
Swing Length: Controls the number of bars used to detect structural pivots.
Sensitivity Controls: Adjustable ATR and volume multipliers to fine-tune detection responsiveness.
Signals: Toggle for on-chart bullish (▲) and bearish (▼) signal plotting when price interacts with zones.
Color Customization: User-defined bullish and bearish colors for both standard and breaker zones.
Core Calculations
Zones are detected using pivot highs and lows with a defined lookback and lookahead period.
Additional filters apply if ATR and volume are enabled, requiring conditions like “ATR > average * multiplier” and “Volume > average * multiplier.”
Detected zones are merged if overlapping, keeping the chart clean and logical.
When price breaks through a zone, the original box is closed, and a new breaker zone is plotted automatically.
Bullish and bearish markers appear when zones are retested from the opposite side.
Visualization & Display
Demand zones are shaded in semi-transparent bullish color (default: blue).
Supply zones are shaded in semi-transparent bearish color (default: red).
Breaker zones appear when previous imbalances are broken, helping to spot structural shifts.
Optional arrows (▲ / ▼) indicate potential buy or sell reactions on zone interaction.
Use Cases
Identify institutional areas of accumulation (demand) or distribution (supply).
Detect potential breakout traps and market structure shifts using breaker zones.
Combine with other tools such as volume profile, EMA, or liquidity indicators for deeper confirmation.
Observe retests and reactions of zones to anticipate possible reversals or continuations.
Apply multi-timeframe analysis to align higher timeframe zones with lower timeframe entries.
Limitations & Recommendations
The indicator does not predict future price movement; it highlights structural imbalances only.
Performance depends on chosen swing length and sensitivity—users should optimize parameters for each market.
Works best in volatile markets where supply and demand imbalances are clearly expressed.
Should be used as part of a broader trading framework, not as a standalone signal generator.
Markets & Timeframes
The “Quantura – Supply & Demand Zone Detection” indicator is suitable for all asset classes including cryptocurrencies, Forex, indices, commodities, and equities. It performs reliably across multiple timeframes, from intraday scalping to higher timeframe swing analysis.
Author & Access
Developed 100% by Quantura. Published as a Open-source script indicator. Access is free.
Important
This description complies with TradingView’s Script Publishing and House Rules. It clearly explains the indicator’s originality, underlying logic, functionality, and intended use without unrealistic claims or performance guarantees.

Lord Mathew ATSThe Smart Money Structure & Pattern Analyzer is a complete, all-in-one visual trading system that brings together every essential element of Smart Money Concepts (SMC), ICT methodology, and candlestick psychology into one powerful indicator.
It is designed to help traders instantly understand the market’s structure, liquidity flow, and potential turning points without switching tools or manually marking charts. Whether you trade forex, indices, crypto, or commodities, this indicator automatically identifies where institutional activity, imbalances, and price inefficiencies occur in real time.
With its advanced algorithm, it plots market structure shifts, equal highs and lows, liquidity zones, order blocks, fair value gaps (FVGs), and previous week and day levels (PWO, PWH, PWL, PWC, PDO, PDH, PDL, PDO). It also integrates a deep candlestick recognition engine that detects over ten classic and advanced candle formations including engulfing patterns, dojis, hammers, shooting stars, morning/evening stars, and spinning tops to provide precise confirmation at critical points of interest.
This indicator isn’t just a tool it’s a complete market map that helps traders visualize how institutional order flow and candlestick sentiment interact.
Core Features
📊 Market Structure Detection:
Automatically marks swing highs/lows, Break of Structure (BOS), and Change of Character (CHOCH) in real time.
💧 Liquidity Mapping:
Highlights equal highs/lows and liquidity grabs, showing where price is likely to target before a reversal or continuation.
🧱 Order Block Visualization:
Displays the last bullish or bearish candle before an impulsive displacement, acting as a potential institutional entry zone.
⚡ Fair Value Gap (FVG) Scanner:
Detects and highlights imbalances where price moved too fast, helping you identify high-probability retracement areas.
🕯️ Candlestick Pattern Recognition:
Recognizes key reversal and continuation patterns (engulfing, hammer, shooting star, doji, morning/evening star, etc.) in real time.
📅 Institutional Reference Points:
Plots previous week & day open (PWO, PDO), previous week & day high (PWH, PWH), previous week & day low (PWL, PDL), previous week & day close (PWC, PDC) and optionally previous day levels to help frame bias.
🎨 Customizable Design:
Toggle any feature, change colors, and set alerts when multiple Smart Money signals align for cleaner, faster decision-making.
How It Works
Add the indicator to your chart on any timeframe or market.
The algorithm automatically detects structure, liquidity, and imbalance zones.
Candlestick patterns are highlighted when they form near high-probability areas (like OBs or FVGs).
When confluence occurs such as a liquidity grab, FVG fill, and bullish engulfing candle—the indicator provides a visual signal zone for your confirmation-based entries.
You can refine your trades using higher-timeframe bias (HTF order flow) and lower-timeframe execution (LTF confirmation).
Best For
Traders using ICT, Smart Money Concepts, or price-action systems.
Intraday and swing traders looking for clear, data-driven chart structure.
Traders who want to simplify confluence analysis and focus on precision execution.
Why It Stands Out
Unlike standard candlestick or pattern scanners, this indicator merges institutional market logic with technical candle behavior, allowing traders to see where smart money might be entering or exiting positions.
It’s not about random signals it’s about context, structure, and confirmation.
Every feature in this indicator is built around the principle of liquidity engineering:
price creates liquidity, grabs it, and moves toward imbalance or order flow efficiency.
By merging that institutional logic with candlestick patterns, this tool gives traders an edge in recognizing not only where to trade but why price is reacting in that exact area.
Disclaimer
This indicator is intended for educational and analytical use. It does not provide financial advice or guaranteed trading results. Always backtest and manage your risk responsibly.

HTF Candles & ReversalsThis indicator, "HTF Candles & Reversals," provides multi-timeframe (HTF) candlestick overlays combined with advanced market structure and reversal detection, all on your main TradingView chart. It empowers traders to visualize the broader trend context, spot potential price reversals, and identify Fair Value Gaps (Imbalances) across up to eight user-selectable higher timeframes, supporting robust, efficient technical analysis.
Key Features
Multi-Timeframe Candle Display: Overlays up to eight higher timeframe candles (5m, 15m, 1H, 4H, 1D, 1W, 1M, 3M) on any chart. Each HTF candle features customizable body, border, and wick colors for bullish and bearish states.
Live Price Action Representation: HTF candle data is updated in real time, reflecting both completed and developing HTF candles for continuous context during current price moves.
Reversal Pattern Detection: Spots key bullish and bearish reversal patterns on both standard and HTF candles, marking them with green (bullish) and red (bearish) triangles beneath or above the main candles. HTF candles are optionally colored (lime/orange) upon identifying stronger reversal setups.
Fair Value Gap (Imbalance) Visualization: Automatically detects and highlights HTF imbalances (FVG) with transparent rectangles and mid-line overlays, indicating zones of potential price revisits and trading interest.
Day-of-Week Labels: For daily HTF candles, annotated with custom-positioned weekday labels (above/below), aiding in session structure recognition.
Customizable Visuals: Extensive settings for the distance, width, transparency, and buffer of overlaid candles, as well as label/timer position, alignment, sizing, and coloring—including per-element control for clarity and chart aesthetics.
HTF Timer & Labeling: Optionally display the HTF name and a remaining-time countdown for each candle, positioned at the top, bottom, or both, for improved situational awareness.
Performance Optimizations: Script is designed for overlay use with up to 500 candles, lines, and labels on charts with deep historical access (5,000 bars back).
How to Use
Apply the script to your chart and select the desired number of HTF candles to display.
Enable or disable triangles for reversal spotting and customize color schemes to match your workflow.
Leverage HTF overlays to validate lower timeframe signals, spot key levels, and monitor imbalances as price moves toward or away from high-interest zones.
Use settings to tune the look and adjust feature visibility for a clean, focused display.
Alerts
Built-in alert conditions are available for immediate notification when bullish or bearish reversal triangles appear—keeping you informed of critical setups in real time.
Use Case
Ideal for traders who want to:
Add higher-timeframe context and structure to their intraday or swing analysis
Quickly identify HTF-based support/resistance and potential reversal areas
Monitor market imbalances for order flow strategies or mean reversion plays
Access multi-timeframe price action cues without switching charts
Disclaimer: This indicator is intended for educational and analytical purposes. Always conduct your own analysis and manage risk appropriately when trading financial markets.

FVG - Sweep [TradeWithRon]FVG – Sweep - A multi-layer liquidity and imbalance detection system designed to help traders identify high-probability zones where price is likely to react.
🔍 Overview
This indicator combines Sweep Detection , Fair Value Gap (FVG) logic, and Change in State of Delivery (CISD) confirmation into a single streamlined tool. It helps traders visually connect liquidity grabs, displacement imbalances, and continuation or reversal opportunities — all in one chart.
⚙️ How It Works
1. Sweep Detection (Liquidity Grabs)
Detects when price takes liquidity above a previous high or below a previous low, then rejects it.
Alerts trigger when a bullish or bearish sweep is confirmed.
2. CISD Confirmation (Change in State of Delivery)
Identifies structural shifts using candle body direction and previous swing breaks.
Confirms when price transitions from expansion to contraction or vice versa.
CISD alerts notify when new shifts occur on any selected timeframe.
3. Fair Value Gap (FVG) Detection
Automatically highlights the first valid FVG following a confirmed sweep optional or CISD.
Optional alert for IFVG confirmation.
🧩 Why It’s Powerful
Multiple conditions across separate tools — sweeps, imbalances, and structure shifts.
This indicator integrates all three into one system that can:
Detect liquidity grabs,
Confirm displacement through FVGs,
Validate momentum or reversals with CISD logic.
🧩 Ideal Use Case
Combine this tool with your existing strategy to:
Build liquidity + imbalance confluence zones
Spot reversal setups after sweeps
Track continuations after structural shifts
Automate alerts for precision entries
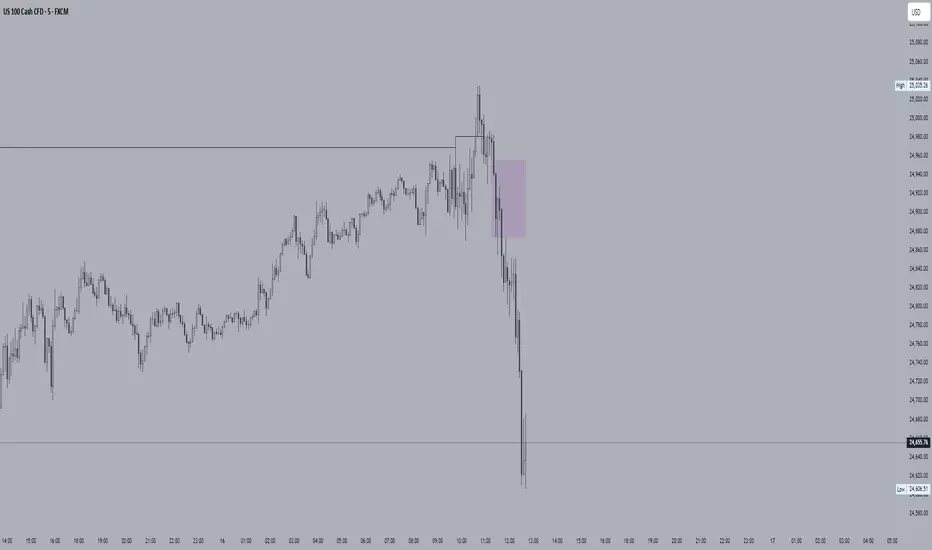
TPO Levels [VAH/POC/VAL] with Poor H/L, Single Prints & NPOCs### 🎯 Advanced Market Profile & Key Level Analysis
This script is a unique and comprehensive technical analysis tool designed to help traders understand market structure, value, and key liquidity levels using the principles of **Auction Market Theory** and **Market Profile**.
This script is unique (and shouldn't be censored) because :
It allows large history of levels to be displayed
Accurate as possible tick size
Doesn't draw a profile but only the actual levels
Supports multi-timeframe levels even on the daily mode giving macro context
There is no indicator out there that does it
While these concepts are universal, this indicator was built primarily for the dynamic, 24/7 nature of the **cryptocurrency market**. It helps you move beyond simple price action to understand *why* the market is moving, which is especially crucial in the volatile crypto space.
### ## 📊 The Concepts Behind the Calculations
To use this script effectively, it's important to understand the core concepts it is built upon. The entire script is self-contained and does not require other indicators.
* **What is Market Profile?**
Market Profile is a unique charting technique that organizes price and time data to reveal market structure. It's built from **Time Price Opportunities (TPOs)**, which are 30-minute periods of market activity. By stacking these TPOs, the script builds a distribution, showing which price levels were most accepted (heavily traded) and which were rejected (lightly traded) during a session.
* **What is the Value Area (VA)?**
The Value Area is the heart of the profile. It represents the price range where **70%** of the session's trading volume occurred. This is considered the "fair value" zone where both buyers and sellers were in general agreement.
* **Point of Control (POC):** The single price level with the most TPOs. This was the most accepted or "fairest" price of the session and acts as a gravitational line for price.
* **Value Area High (VAH):** The upper boundary of the 70% value zone.
* **Value Area Low (VAL):** The lower boundary of the 70% value zone.
VAH and VAL are dynamic support and resistance levels. Trading outside the previous session's value area can signal the start of a new trend.
***
### ## 📈 Key Features Explained
This script automatically calculates and displays the following critical market-generated information:
* **Multi-Timeframe Market Profile**
Automatically draws Daily, Weekly, and Monthly profiles, allowing you to analyze market structure across different time horizons. The script preserves up to 20 historical sessions to provide deep market context.
* **Naked Point of Control (nPOC)**
A "Naked" POC is a Point of Control from a previous session that has **not** been revisited by price. These levels often act as powerful magnets for price, representing areas of unfinished business that the market may seek to retest. The script tracks and displays Daily, Weekly, and Monthly nPOCs until they are touched.
* **Single Prints (Imbalance Zones)**
A Single Print is a price level where only one TPO traded during the session's development. This signifies a rapid, aggressive price move and an imbalanced market. These areas, like gaps in a traditional chart, are frequently revisited as the market seeks to "fill in" these thin parts of the profile.
* **Poor Structure (Unfinished Auctions)**
A **Poor High** or **Poor Low** occurs when the top or bottom of a profile is flat, with two or more TPOs at the extreme price. This suggests that the auction in that direction was weak and inconclusive. These weak structures often signal a high probability that price will eventually break that high or low.
***
### ## 💡 How to Use This Indicator
This tool is not a signal generator but an analytical framework to improve your trading decisions.
1. **Determine Market Context:** Start by asking: Is the current price trading *inside* or *outside* the previous session's Value Area?
* **Inside VA:** The market is in a state of balance or range-bound. Look for trades between the VAH and VAL.
* **Outside VA:** The market is in a state of imbalance and may be starting a trend. Look for continuation or acceptance of prices outside the prior value.
2. **Identify Key Levels:**
* Use historical **nPOCs** as potential profit targets or areas to watch for a price reaction.
* Treat historical **VAH** and **VAL** levels as significant support and resistance zones.
* Note where **Single Prints** are. These are often price magnets that may get "filled" in the future.
3. **Spot Weakness:**
* A **Poor High** suggests weak resistance that may be easily broken.
* A **Poor Low** suggests weak support, signaling a potential for a continued move lower if broken.
***
### ## ⚙️ Customization & Crypto Presets
The indicator is highly customizable, allowing you to change colors, transparency, the number of historical sessions, and more.
To help traders get started quickly, the indicator includes **built-in layout presets** specifically calibrated for major cryptocurrencies: ** BINANCE:BTCUSDT.P , BINANCE:ETHUSDT.P , and BINANCE:SOLUSDT.P **. These presets automatically adjust key visual parameters to better suit the unique price characteristics and volatility of each asset, providing an optimized view right out of the box.
***
### ## ⚠️ Disclaimer
This indicator is a tool for market analysis and should not be interpreted as direct buy or sell signals. It provides information based on historical price action, which does not guarantee future results. Trading involves significant risk, and you should always use proper risk management. This script is designed for use on standard chart types (e.g., Candlesticks, Bar) and may produce misleading information on non-standard charts.
