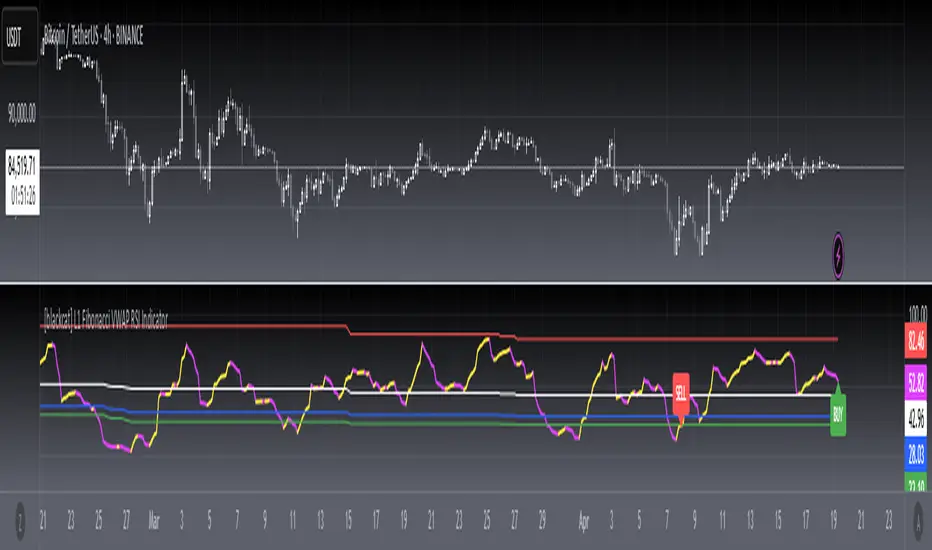
[blackcat] L1 Fibonacci VWAP RSI IndicatorLevel: 1
Background
Ingo Bucher proposed "Fibonacci RSI" in March,2003. It describes the advantages of considering Fibonacci retracement levels for use with the classic RSI indicator. Bucher reviews six charts, each displaying Fibonacci retracement levels for the RSI associated with each chart. The pine code given here will allow you to automatically recreate these charts for any security available in Tradingview. BTW, i enhanced it by changing RSI into VWAP RSI with hl2.
Function
For this Fib VWAP RSI indicator, it also applicable for original Bucher's fib concept. Bucher calculated his retracement levels by picking the RSI high and low for a given time window. In his examples, these were generally six months to a year's worth of data. Once the high and low were picked, he calculated retracement levels based on the well-known Fibonacci numbers (23.6%, 38.2%, 50%, 61.8%). This script here does the same thing. I use a "LookbackLength" (default: 400 bars), which represents a sliding data window that is used to determine the VWAP RSI high and low. The second input value controls the VWAP RSI period (default: 14 bars). The next three inputs select the retracement levels.
A total of eight different lines need to be drawn: the RSI itself, the 50% line, two retracements above the 50% point, two retracements below, and the zero and 100% lines. Pine script will create four plotlines per indicator, so I advise inserting the Fibonacci RSI twice. The first time it is inserted, leave the PlotRSI input with its default value, true. True tells pine script to plot the VWAP RSI itself. The second copy should have the input "Plot RSI" set to false. This will put the 50% line on your chart.
Inputs
LookbackLength --> Look Back Length.
RSILength --> RSI Length.
Fib1 and Fib2 --> Fibonacci lengths.
Key Signal
RawVWAPRSI --> Raw VWAP RSI output signal
Remarks
This is a Level 1 free and open source indicator.
Feedbacks are appreciated.
Search in scripts for "indicator"
Larry Williams Strategies IndicatorThis indicator is a trend following indicator. It plots some of the trend following strategies described by Larry Williams in his book 'Long Term Secrets to Short Term Trading'. Below are types of trend following strategies you can trade using this indicator. These are notes taken directly from Larry Williams' book.
Short Term Low Strategy
Short Term Low - Any daily low with higher lows on each side of it.
Intermediate Term Low – Any short term low with higher short term lows on each side of it.
Long Term Low – Any intermediate term low with higher intermediate term lows on each side of it.
Conceptual pattern for best buying opportunity is when forming an intermediate term low higher than the last intermediate term low.
This setup can be used on all time frames. However since Larry Williams usually trades the daily chart, the daily chart is probably the best timeframe to trade using this strategy.
Entry point – High of the day that has a higher high on the right side of it.
(My interpretation: price crossing above the high of the previous day is the buy signal)
Target – Markets have a strong tendency to rally above the last intermediate term high by the same amount it moved from the last intermediate term high to the lowest point prior to advancing to new highs.
Trailing Stop – Set stop to most recent short term low, move up as new short term lows are formed. Can also use formation of next intermediate term high as an exit point.
A 'run' to the upside is over when price fails to move higher the next day and falls below the prior day's low.
Short Term High Strategy
Short Term High - Any daily high with lower highs on each side of it.
Intermediate Term High – Any short term high with lower short term highs on each side of it.
Long Term High – Any intermediate term high with lower intermediate term highs on each side of it.
Conceptual pattern for best selling opportunity is when forming an intermediate term high lower than the last intermediate term high.
This setup can be used on all time frames. However since Larry Williams usually trades the daily chart, the daily chart is probably the best timeframe to trade using this strategy.
Entry point – Low of the day that has a lower low on the right side of it.
(My interpretation: price crossing below the low of the previous day is the sell short signal)
Target – Markets have a strong tendency to fall below the last intermediate term low by the same amount it moved from the last intermediate term low to the highest point prior to declining to new lows.
Trailing Stop – Set stop to most recent short term high, move down as new short term highs are formed. Can also use formation of next intermediate term low as an exit point.
A 'run' to the downside is over when price fails to move lower the next day and rises above the prior day's high.
Trend Reversals
A trend change from down to up occurs when a short term high is exceeded on the upside, a trend change from up to down is identified by price going below the most recent low.
Can take these signals to make trades, but it is best to filter them with a confirmation or edge such as Trading Day of the Week, Trading Day of the Month, trendlines, etc. to cut down on false signals.
Three Bar High/Low System
Calculate a three bar moving average of the highs and a three bar moving average of the lows.
Strategy is to buy at the at the price of the three bar moving average of the lows - if the trend is positive according to the swing point trend identification technique - and take profits at the three bar moving average of the highs.
Selling is just the opposite. Sell short at the three bar moving average of the highs and take profits at the three bar moving average of the lows, using the trend identification technique above for confirmation.
This strategy can work on any timeframe, but was described as a daytrading system by Larry Williams.

Faith IndicatorThis indicator compares buyers demand with sellers supply volumes and calculates which prevails. Therefore it only works if volume is published. Buyers demand is assumed for a period in which a higher high is reached with more volume. Sellers supply is recognized by a lower low combined with more volume.
The average of sellers supplies is subtracted from buyers demand, the result is graded because a statement like “The faith in this period was ## percent” has no meaning. We can conclude to more faith and less faith but not represent it in some exact number.
This indicator assigns the following grades:
Very high faith graduated as 8
High faith as 6
Good faith as 4
Some Faith as 2
Little Faith as 1
Neither Faith nor Distrust as zero
Self Protection Distrust graduated as -8
Fear Distrust as -6
Anxiety Distrust as -4
Suspicion Distrust as -2
Doubt Distrust as -1
It is presented as a histogram with blue staves pointing up (meaning faith) and red staves pointing down (meaning distrust)
The background is colored using the Hull Agreement Indicator (Hullag), which I published before. Hullag graduates price movements in five grades to which it assigns a background color. These are as follows:
grade 2: blue, clear upward movement
grade 1: green, some upward movement
grade 0: silver, neither upward nor downward movement
grade -1: maroon, some downward movement
grad -2: red, clear downward movement.
Use of the Faith Indicator:
The indicator shows price action/momentum as a background color and volume action analyzed as a grade of faith in the form of a histogram. Usually faith comes together with rising prices (blue/green background) and distrust with lowering prices (red/maroon background), however contrarian situations occur, e.g. lowering prices while the market has good faith. These can be explained by minority sellers who act contrary to the feelings in the market. You can then decide that this might be an unsustainable move of the quotes.
If the faith indicator confirms the price movement, you might assume that the move is meaningful and will go further. Also if you see faith diminishing you might assume that the move is coming to an end and the tide is going to turn.
[blackcat] L2 Ehlers Modified Stochastic IndicatorLevel: 2
Background
John F. Ehlers introuced Modified Stochastic Indicator in his "Cycle Analytics for Traders" chapter 7 on 2013.
Function
Conventional indicators are not immune to the effects of spectral dilation. For example, a Stochastic indicator remains near its upper bound when the market is in an uptrend even though a relatively short lookback period is used. This, of course, is due to the presence of the larger and longer cyclic components in the data. In a broad sense, the classic Stochastic indicator acts as a one-pole filter because there is just a single difference term in the numerator of its calculation. This calculation is the same as the standard, except Dr. Ehlers use a SuperSmoother for the smoothing instead of moving averages. The bottom subgraph shows an identical calculation except that the Stochastic calculations are preceded by the roofing filter that constrains the cyclic components to fall within the range from 10-bar to 48-bar periods. Clearly, the Stochastic indicator has been dramatically altered by the insertion of the roofing filter.
Dr. Ehlers leaves it to the reader to explore how standard indicators can be improved simply by inserting the roofing filter before the indicator computations are begun.
Key Signal
MyStochastic --> Modified Stochastic Indicator fast line
Trigger --> Modified Stochastic Indicator slow line
Pros and Cons
100% John F. Ehlers definition translation of original work, even variable names are the same. This help readers who would like to use pine to read his book. If you had read his works, then you will be quite familiar with my code style.
Remarks
The 44th script for Blackcat1402 John F. Ehlers Week publication.
Readme
In real life, I am a prolific inventor. I have successfully applied for more than 60 international and regional patents in the past 12 years. But in the past two years or so, I have tried to transfer my creativity to the development of trading strategies. Tradingview is the ideal platform for me. I am selecting and contributing some of the hundreds of scripts to publish in Tradingview community. Welcome everyone to interact with me to discuss these interesting pine scripts.
The scripts posted are categorized into 5 levels according to my efforts or manhours put into these works.
Level 1 : interesting script snippets or distinctive improvement from classic indicators or strategy. Level 1 scripts can usually appear in more complex indicators as a function module or element.
Level 2 : composite indicator/strategy. By selecting or combining several independent or dependent functions or sub indicators in proper way, the composite script exhibits a resonance phenomenon which can filter out noise or fake trading signal to enhance trading confidence level.
Level 3 : comprehensive indicator/strategy. They are simple trading systems based on my strategies. They are commonly containing several or all of entry signal, close signal, stop loss, take profit, re-entry, risk management, and position sizing techniques. Even some interesting fundamental and mass psychological aspects are incorporated.
Level 4 : script snippets or functions that do not disclose source code. Interesting element that can reveal market laws and work as raw material for indicators and strategies. If you find Level 1~2 scripts are helpful, Level 4 is a private version that took me far more efforts to develop.
Level 5 : indicator/strategy that do not disclose source code. private version of Level 3 script with my accumulated script processing skills or a large number of custom functions. I had a private function library built in past two years. Level 5 scripts use many of them to achieve private trading strategy.

[blackcat] L2 Ehlers Laguerre RSI IndicatorLevel: 2
Background
John F. Ehlers introuced Laguerre RSI Indicator in his "Cybernetic Analysis for Stocks and Futures" chapter 14 on 2004.
Function
“Truth and science always triumph over ignorance and superstition.” said by Dr. Ehlers. We can generate superior smoothing with very short filters, it follows that we should be able to create superior indicators using very short data lengths also. The use of shorter data lengths means that we can make the indicators more responsive to changes in the price. The Laguerre RSI will be used as an example.
Key Signal
RSI ---> Laguerre RSI Indicator fast line
RSI(1) ---> Laguerre RSI Indicator slow line
Pros and Cons
100% John F. Ehlers definition translation of original work, even variable names are the same. This help readers who would like to use pine to read his book. If you had read his works, then you will be quite familiar with my code style.
Remarks
The 34th script for Blackcat1402 John F. Ehlers Week publication.
Readme
In real life, I am a prolific inventor. I have successfully applied for more than 60 international and regional patents in the past 12 years. But in the past two years or so, I have tried to transfer my creativity to the development of trading strategies. Tradingview is the ideal platform for me. I am selecting and contributing some of the hundreds of scripts to publish in Tradingview community. Welcome everyone to interact with me to discuss these interesting pine scripts.
The scripts posted are categorized into 5 levels according to my efforts or manhours put into these works.
Level 1 : interesting script snippets or distinctive improvement from classic indicators or strategy. Level 1 scripts can usually appear in more complex indicators as a function module or element.
Level 2 : composite indicator/strategy. By selecting or combining several independent or dependent functions or sub indicators in proper way, the composite script exhibits a resonance phenomenon which can filter out noise or fake trading signal to enhance trading confidence level.
Level 3 : comprehensive indicator/strategy. They are simple trading systems based on my strategies. They are commonly containing several or all of entry signal, close signal, stop loss, take profit, re-entry, risk management, and position sizing techniques. Even some interesting fundamental and mass psychological aspects are incorporated.
Level 4 : script snippets or functions that do not disclose source code. Interesting element that can reveal market laws and work as raw material for indicators and strategies. If you find Level 1~2 scripts are helpful, Level 4 is a private version that took me far more efforts to develop.
Level 5 : indicator/strategy that do not disclose source code. private version of Level 3 script with my accumulated script processing skills or a large number of custom functions. I had a private function library built in past two years. Level 5 scripts use many of them to achieve private trading strategy.

[blackcat] L1 Composite RSI-DMI Reversal IndicatorLevel: 1
Background
The Relative Strength Index (RSI) developed by J. Welles Wilder is a pulse oscillator that measures the speed and change of price movements. The RSI hovers between zero and 100. Traditionally, the RSI is considered overbought when it is above 70 and oversold when below 30. Signals can be generated by looking for divergences and error fluctuations. RSI can also be used to identify the general trend.
The Directional Movement Index (DMI) is an indicator developed by J. Welles Wilder in 1978 that indicates the direction in which the price of an asset is moving. The indicator compares previous highs and lows and draws two lines: a positive directional movement line (+ DI) and a negative directional movement line (-DI). An optional third line called Directional Movement (DX) shows the difference between the lines. When + DI is above -DI there is more upward pressure than downward pressure in price. When -DI is above + DI, the price continues to fall. This indicator can help traders estimate the direction of the trend. Crossovers between the lines are also sometimes used as trading signals to buy or sell.
Function
L1 Composite RSI-DMI Reversal Indicator combines J. Welles Wilder's RSI and DMI indicators together to identify trend reversals.
Key Signal
swinglow --> swing signal
trend --> trend signal to identify top reversal
Pros and Cons
Pros:
1. it exhibit leading character
2. it can disclose top and bottom reversals
Cons:
1. noise exists
2. depends on market and trading pairs
Remarks
Composite J. Welles Wilder indicator
Readme
In real life, I am a prolific inventor. I have successfully applied for more than 60 international and regional patents in the past 12 years. But in the past two years or so, I have tried to transfer my creativity to the development of trading strategies. Tradingview is the ideal platform for me. I am selecting and contributing some of the hundreds of scripts to publish in Tradingview community. Welcome everyone to interact with me to discuss these interesting pine scripts.
The scripts posted are categorized into 5 levels according to my efforts or manhours put into these works.
Level 1 : interesting script snippets or distinctive improvement from classic indicators or strategy. Level 1 scripts can usually appear in more complex indicators as a function module or element.
Level 2 : composite indicator/strategy. By selecting or combining several independent or dependent functions or sub indicators in proper way, the composite script exhibits a resonance phenomenon which can filter out noise or fake trading signal to enhance trading confidence level.
Level 3 : comprehensive indicator/strategy. They are simple trading systems based on my strategies. They are commonly containing several or all of entry signal, close signal, stop loss, take profit, re-entry, risk management, and position sizing techniques. Even some interesting fundamental and mass psychological aspects are incorporated.
Level 4 : script snippets or functions that do not disclose source code. Interesting element that can reveal market laws and work as raw material for indicators and strategies. If you find Level 1~2 scripts are helpful, Level 4 is a private version that took me far more efforts to develop.
Level 5 : indicator/strategy that do not disclose source code. private version of Level 3 script with my accumulated script processing skills or a large number of custom functions. I had a private function library built in past two years. Level 5 scripts use many of them to achieve private trading strategy.

Major Event Price Indicators (Coronavirus Lows)This very simple script adds a corridor for two low price ranges, where Corona started to hit. Useful to visualize where a stock currently trades at, relative to the Corona / Covid-19 crisis.
Can easily be adjusted for different dates regarding any major events, crashes. Useful when you run out of Alarms and just want to see "is that still below or above where it was before ?".
Add as many dates as you want, just alter the names of each indicator.
Built upon the script of vitvlkv.

Function To Candles - Another way to see indicatorsIntroduction
There are different and better way's to see price data, a candlestick chart is one of the best way to see the price since you have access to the open/high/low/close information, this is really efficient and can allow for naked non parametric trading strategies (candlesticks patterns) . But what about making candles out of indicators ? There are tons of studies about candlesticks patterns in price data but none (?) about candlestick patterns using indicator data, therefore i made this script in order to show candles from various indicators, i also made an heikin-ashi mode.
Rsi To Candles
All the indicators are use the open/high/low/close price as input in order to return candles. length control the indicator period.
Stochastic To Candles
The stochastic oscillator is restrained in a range of 0/100, therefore when equal to 0 or 100 the candles can be flat.
Rate Of Change To Candles
The rate of change don't distort price as heavily as other indicators since its based on differencing.
Center Of Gravity To Candles
The center of gravity (cog) is defined from tradingview as "an indicator based on statistics and the Fibonacci golden ratio", its not an indicator i'am familiar with and i don't know if its the same proposed by Elhers. The candles are smooth, high length can flatten the candles heavily making them hard to see.
Correlation Oscillator
In a range of -1/1 this indicator is quite smooth and can also flatten candles.
Patterns And Heikin-Ashi
There are tons of patterns that can be generated from candlesticks, they can be applied to this indicator as well.
The indicator can show an heikin-ashi mode, heikin-ashi candlestick use averaging to plot candles, this is why they appear smoother, some signals generated from heikin-ashi candles are :
Bullish body with no lower shadows = Strong Uptrend
Bearish body with no higher shadows = Strong Downtrend
High range and small body = Indecision/Risk of reversal
Conclusion
I made an indicator able to draw candles from other indicators, those candles contain various information that can generate decision from patterns. I hope you find a use to it, if its the case share your findings with me, maybe that you will even be able find a new candlestick pattern :)
Thanks for reading !

QQE Cross Indicator Alert v2.0 by JustUncleLThis version of the indicator makes a distinction between the types of QQE cross alerts on the chart and now only recommends the Thresh Hold channel exit crosses for BUY/SELL alerts, the other two types of crosses are still there to provide pre-warning of pending BUY/SELL alerts. Also only the BUY/SELL alerts are filtered by Moving Average Filter and/or the new Directional filter (default). The default settings in this version have also been changed, particularly the Moving Averages, to indicate trend changes quicker.
Indicator Project Description:
*** This is a trend following indicator alert that uses fast QQE crosses with Moving Averages for trend direction filtering. QQE or Qualitative Quantitative Estimation is based on the relative strength index, but uses a smoothing technique as an additional transformation. Three crosses can be selected (all selected by default):
RSI signal crossing ZERO (XZERO)
RSI signal crossing Fast RSIatr line (XQQE)
RSI signal exiting the RSI Threshhold Channel (BUY/SELL)
The (BUY/SELL) alerts can be optionally filtered by the Moving Average Combo:
For BUY alert the Close must be above the fast MA and
fast MA (EMA8) > medium MA (EMA20) > slow MA (SMA50).
For SELL alert the Close must be below the fast MA and
fast MA (EMA8) < medium MA (EMA20) < slow MA (SMA50).
and/or Directional filter (default filter):
For BUY alert the Close must be above the slow MA (SMA50) and the directional MA (EMA20) must be green.
For SELL alert the Close must be below the slow MA (SMA50) and the directional MA (EMA20) must be red.
The XZERO and XQQE are not included in the filtering, they are used to indicate pending BUY/SELL alerts, particularly the XZERO.
Note: I have found the XQQE cross can also be quite good alert for BUY/SELL as well, particularly in direction of current trend. The XZERO I have found to be totally unreliable for BUY/SELL alerts.
This indicator should work on any currency pair, most chart timeframes and expiry in 3 to 6 candles for binary option trading. For hourly or longer charts expiry can be longer for binary options, or if available use standard forex trading techniques
Some Hints for using this indicator:
Avoid taking trades in non-trending market, this is normally indicated by a near Horizontal SMA50 line.
Avoid trading when all the moving averages are close together.
When trading 1min and 5min charts, expiry should set to 1-3 candles.
Avoid trading when market choppy, this is normally indicated by the fast EMA8 crossing the EMA20 back and forwards quickly.
High probability trades tend to occur when you get a XQQE followed by a XZERO and then BUY/SELL in the same direction of trend.
Don't trade near nor directly on any major market news (sometime better no trade day).
Please practise this system in DEMO first, before committing any real money. Be patient the more you practise the better and more confident you will be.
I hope you enjoy this indicator, it has proven very effective for me.

Fractal Fade Pro IndicatorA revolutionary contrarian trading indicator that applies chaos theory, fractal mathematics, and market entropy to generate high-probability reverse signals. This indicator fades traditional technical signals, providing BUY signals when conventional indicators say SELL, and SELL signals when they say BUY.
Full Description:
Most traders follow the herd. QFCI does the opposite. It identifies when conventional technical analysis is about to fail by detecting mathematical patterns of exhaustion in market structure.
How It Works (Technical Overview):
The indicator combines three sophisticated mathematical approaches:
Fractal Dimension Analysis: Measures the "roughness" of price movements using fractal mathematics
Market Entropy Calculation: Quantifies the randomness and disorder in price returns using information theory
Phase Space Reconstruction: Analyzes price evolution in multi-dimensional state space from chaos theory
Signal Generation Process:
Step 1: Market Regime Detection
Chaotic Regime: High fractal complexity + rising entropy (avoid trading)
Trending Regime: Low fractal complexity + high phase space distance (fade breakouts)
Mean-Reverting Regime: Very low fractal complexity (fade extremes)
Step 2: Reverse Signal Logic
When traditional indicators would give:
BUY signal (breakout, oversold bounce, volatility spike) → QFCI shows SELL
SELL signal (breakdown, overbought rejection, volatility crash) → QFCI shows BUY
Step 3: Smart Signal Filtering
No consecutive same-direction signals
Adjustable minimum bars between signals
Multiple confirmation layers required
Unique Features:
1. Mathematical Innovation:
Original fractal dimension algorithm (not standard indicators)
Market entropy calculation from information theory
Phase space reconstruction from chaos theory
Multi-regime adaptive logic
2. Trading Psychology Advantage:
Contrarian by design - profits from market overreactions
Fades retail trader mistakes - enters when others are exiting
Reduces overtrading - strict signal frequency controls
3. Clean Visual Interface:
Only BUY/SELL labels - no chart clutter
Clear directional arrows - immediate signal recognition
Built-in alerts - never miss a trade
Recommended Settings:
Default (Balanced Approach):
Fractal Depth: 20
Entropy Period: 200
Min Bars Between Signals: 100
Aggressive Trading:
Fractal Depth: 10-15
Entropy Period: 100-150
Min Bars Between Signals: 50-75
Conservative Trading:
Fractal Depth: 30-40
Entropy Period: 300-400
Min Bars Between Signals: 150-200
Optimal Timeframes:
Primary: Daily, Weekly (best performance)
Secondary: 4-Hour, 12-Hour
Can work on: 1-Hour (with adjusted parameters)
How to Use:
For Beginners:
Apply indicator to chart
Use default settings
Wait for BUY/SELL labels
Enter on next candle open
Use 2:1 risk/reward ratio
Always use stop losses
For Advanced Traders:
Adjust parameters for your trading style
Combine with support/resistance levels
Use volume confirmation
Scale in/out of positions
Track performance by regime
Risk Management Guidelines:
Position Sizing:
Conservative: 1-2% risk per trade
Moderate: 2-3% risk per trade
Aggressive: 3-5% risk per trade (not recommended)
Stop Loss Placement:
BUY signals: Below recent swing low or -2x ATR
SELL signals: Above recent swing high or +2x ATR
Take Profit Targets:
Primary: 2x risk (minimum)
Secondary: Previous support/resistance
Tertiary: Trailing stops after 1.5x risk
IMPORTANT RISK DISCLOSURE
This indicator is for educational and informational purposes only. It is not financial advice. Past performance does not guarantee future results. Trading involves substantial risk of loss and is not suitable for every investor. The risk of loss in trading can be substantial. You should therefore carefully consider whether such trading is suitable for you in light of your financial condition.

Forex indicator By petran Elevate your market analysis with this powerful, all-in-one visual toolkit designed for discretionary traders across Forex, indices, and commodities (metals).
Core Features:
Trading Sessions Overlay: Clear visual bands highlighting the Asian, London, and New York trading sessions directly on your chart. Never miss a market open or a session overlap again.
Smart Daily Levels: Automatically plots the most essential reference points from the previous day:
PDH / PDL (Previous Day High/Low) – Key support and resistance.
PWH / PWL (Previous Week High/Low) – Higher timeframe context.
DO (Day Open) – A crucial intraday pivot level.
Motivational Watermark: A unique and customizable text overlay at the top of your screen. Display your favorite trading quote, rule, or reminder to maintain the right mindset during the trading day.
Clean & Customizable: Designed for clarity. Adjust colors, session times, and watermark text to fit your personal trading style and chart aesthetics.
Why Traders Choose This Indicator:
Saves Time: No more manually drawing sessions or calculating yesterday's levels.
Improves Discipline: The visual sessions and watermark help you trade only during your planned times and follow your rules.
Universal Application: Works seamlessly on any liquid market where session activity and daily ranges matter.
Perfect for traders who rely on price action, session-based strategies, and need a clean, informative chart environment.

Power Law BTC IndicatorPOWER LAW BTC indicator:
A long-term price model that suggests Bitcoin's price follows a power law function over time. Unlike traditional stock market models that assume linear or exponential growth, the power law model suggests that Bitcoin's price scales in a predictable, non-random way over the long run

[FGL] Stochastic ATR Trend IndicatorThis indicator:
Detects trend direction using ATR-based dynamic bands around SMA.
Generates buy/sell signals using Stochastic crossover conditions filtered by trend.
Colors candles to show trend direction.
Plots a visual “trend zone” band on the chart.
INPUT PARAMETERS:
Stochastic Length → Period for the stochastic oscillator.
Smooth K and Smooth D → Smoothing parameters for %K and %D lines.
ATR Length → Period used for SMA-based trend detection.
LOGIC FLOW
Determine trend using long ATR-based SMA channel.
Detect momentum change with Stochastic cross.
Confirm both momentum and price align with trend.
Generate buy/sell signal + change candle color.
STRATEGIC INTERPRETATION
Best use: Trend-following momentum entries.
Avoids: Countertrend false signals by filtering with trend value.
Signals:
Buy: In uptrend + bullish stochastic crossover.
Sell: In downtrend + bearish stochastic crossover.

Grok's xAI Signal (GXS) Indicator for BTC V6Grok's xAI Signal (GXS) Indicator: A Simple Guide
Imagine trying to decide if Bitcoin is a "buy," "sell," or "wait" without staring at 10 different charts. The GXS Indicator does that for you—it's like a smart dashboard for BTC traders, overlaying signals right on your price chart. It boils down complex market clues into one easy score (from -1 "super bearish" to +1 "super bullish") and flashes green/red arrows or shaded zones when action's needed. No fancy math overload; just clear visuals like tiny triangles for trades, colored clouds for trends, and a bottom "mood bar" (green=up vibe, red=down, gray=meh).
At its core, GXS mixes three big-picture checks:
Price Momentum (50% weight): Quick scans of RSI (overbought/oversold vibes), MACD (speed of ups/downs), EMAs (is price riding the trend wave?), and Bollinger Bands (is the market squeezing for a breakout?). This catches short-term "hot or not" energy.
Network Health (30% weight): A simple "NVT" hack using trading volume vs. price to spot if BTC feels undervalued (buy hint) or overhyped (sell warning). It's like checking if the crowd's too excited or chill.
Trend Strength (20% weight): ADX filter ensures signals only fire in "trending" markets (not choppy sideways noise), plus a MACD boost for extra momentum nudge.
Why this approach? BTC's wild—pure price charts give false alarms in flat times, while ignoring volume/network ignores the "why" behind moves. GXS blends old-school TA (reliable for patterns) with on-chain smarts (crypto-specific "under the hood" data) and a trend gate (skips 70% of bad trades). It's conservative: Signals need the score to cross ±0.08 and a strong trend, reducing noise for swing/position traders. Result? Fewer emotional guesses, more "wait for confirmation" patience—perfect for volatile assets like BTC where hype kills.
Quick Tips to Tweak for Better Results
Start with defaults, then experiment on historical charts (backtest via TradingView's strategy tester if pairing with one):
Fewer False Signals: Bump thresholds to ±0.15 (buy/sell)—trades only on stronger conviction, cutting whipsaws by 20-30% in choppy markets. Or raise ADX thresh to 28 for "only big trends."
Faster/Slower Response: Shorten EMAs (e.g., 5/21) or RSI (10) for quicker scalps; lengthen (12/50) for swing holds. Test on 4H/daily BTC.
Volume Sensitivity: If NVT flips too often, extend its length to 20—smooths on-chain noise in bull runs.
Visual Polish: Crank cloud opacity to 80% for subtler fills; toggle off EMAs if they clutter. Enable table for score breakdowns during live trades.
Risk Tip: Always pair with stops (e.g., 2-3% below signals). On BTC, tweak in bull markets (looser thresh) vs. bears (tighter).
In short, GXS is your BTC "sixth sense"—balanced, not black-box. Tweak small, track win rate, and let trends lead. Happy trading!

Time Line Indicator - by LMTime Line Indicator – by LM
Description:
The Time Line Indicator is a simple, clean, and customizable tool designed to visualize specific time periods within each hour directly in a dedicated indicator pane. It allows traders to mark important intraday minute ranges across multiple past hours, providing a clear visual reference for time-based analysis. This indicator is perfect for identifying recurring hourly windows, session patterns, or custom time-based events in your charts.
Unlike traditional overlays, this indicator does not interfere with price candles and draws its lines in a separate pane at the bottom of your chart for clarity.
Key Features:
Custom Hourly Lines:
Draw horizontal lines for a specific minute range within each hour, e.g., from the 45th minute to the 15th minute of the next hour.
Multi-Hour Support:
Choose how many past hours to display. The indicator will replicate the line for each selected hourly period, following the same minute logic.
Automatic Start/End Logic:
If your chosen start minute is in the previous hour, the line correctly begins at that time.
The end minute can cross into the next hour when applicable.
If the selected end minute does not yet exist in the current chart data, the line will extend to the latest available bar.
Dedicated Indicator Pane:
Lines appear in a fixed, non-intrusive y-axis within the indicator pane (overlay=false), keeping your price chart clean.
Customizable Appearance:
Line Color: Choose any color to match your chart theme.
Line Thickness: Adjust the width of the lines for better visibility.
Inputs:
Input Name Type Default Description
Line Color Color Orange The color of the horizontal lines.
Line Thickness Integer 2 The thickness of each line (1–5).
Start Minute Integer 5 The minute within the hour where the line begins (0–59).
End Minute Integer 25 The minute within the hour where the line ends (0–59).
Hours Back Integer 3 Number of past hours to display lines for.
Use Cases:
Intraday Analysis: Quickly visualize recurring minute ranges across multiple hours.
Session Tracking: Mark critical time windows for trading sessions or market events.
Pattern Recognition: Easily identify time-based patterns or setups without cluttering the price chart.
How It Works:
The indicator calculates the nearest bars corresponding to your start and end minutes.
It draws horizontal lines at a fixed y-axis value within the indicator pane.
Lines are drawn for each selected past hour, replicating the chosen minute span.
All logic respects the actual chart data; lines never extend into the future beyond the most recent bar.
Notes:
Overlay is set to false, so lines appear in a dedicated pane below the price chart.
The indicator is fully compatible with any timeframe. Lines adjust automatically to match the chart’s bar spacing.
You can change the number of hours displayed at any time without affecting existing lines.
If you want, I can also draft a shorter “TradingView Store / Public Library description” version under 500 characters for the “Short Description” field — concise and punchy for users scrolling through indicators.

Directional Indicator Crossovers v1[JopAlgo]Directional Indicator Crossovers v1 — the classic DMI, made clearer and easier to act on
We'd like to introduce you to a more relaxed, streamlined version of DI. While it may not seem like it at first glance, we've taken the D+/D- method as a starting point and developed our own version of this indicator: two lines, a smooth green/red field indicating who's in control, and clear crossover alerts for a flip. We deliberately chose the step line representation because it closely matches the candlestick patterns on the chart. Designed to help you react faster—without clutter.
What you’ll see
+DI (green) and −DI (red) using classic Wilder smoothing.
A soft control zone between the lines: green when +DI dominates, red when −DI dominates.
Crossover alerts (no labels, no background flooding)—just the turning points.
Why this helps
Instant bias: the shaded field tells you who’s in control without reading values.
Cleaner execution: minimal visuals keep focus on the handoff (+DI↔−DI) and your price levels.
Actionable by design: built-in alerts fire right at the flip to route into your workflow.
How to read it
Bias: Green zone → buyers lead. Red zone → sellers lead.
Trigger: Consider entries on the DI crossover that aligns with your higher-timeframe context (trend, S/R, OB).
Patience in chop: If flips are frequent in tight ranges, wait for sustained zone dominance or confirm on a higher TF.
Exit/flip: Opposite crossover or a clear loss of dominance.
Settings that matter
DI Length (default 14): Higher = calmer, fewer flips. Lower = faster, more signals.
Visuals: Keep the control zone on for quick reads; hide crossover marks if you prefer pure lines.
Alerts: Enable bullish and bearish DI cross alerts; connect to notifications or webhooks as needed.
Starter presets
Intraday (15m–1H): DI Length 12–14 for quicker handoffs.
Swing (4H–1D): DI Length 14–20 for cleaner signals.
Choppy assets: Nudge length higher to dampen noise.
Where it shines (and limits)
Best: Liquid markets (crypto majors, indices, large caps) where handoffs matter.
Works elsewhere: Still useful on slower pairs; extend length for stability.
Limit: Frequent flips in low-range sessions—pair with HTF bias or structure.
Alerts included
Bullish DI Crossover: +DI crosses above −DI.
Bearish DI Crossover: −DI crosses above +DI.
Attribution & License
Built on the Directional Movement Index concept by J. Welles Wilder Jr. (1978).
Independent Pine v6 implementation (not derived from TradingView’s built-in source).
Released as Open Source (MPL-2.0)—please keep the license header intact.
Disclaimer
For educational purposes only; not financial advice. Trading involves risk. Test first, use clear levels, and manage risk. This project is independent and not affiliated with or endorsed by TradingView.
ICT 369 Sniper MSS Indicator (HTF Bias) - H2LThis script is an ICT (Inner Circle Trader) concept-based trading indicator designed to identify high-probability reversal or continuation setups, primarily focusing on intraday trading using a Higher Timeframe (HTF) directional bias.
Here are the four core components of the indicator:
Higher Timeframe (HTF) Bias Filter (Market Structure Shift - MSS): It determines the overall trend by checking if the current price has broken the most recent high or low swing point of a larger timeframe (e.g., 4H). This establishes a Bullish or Bearish bias, ensuring trades align with the dominant trend.
Fair Value Gap (FVG) and OTE: It identifies price imbalances (FVGs) and calculates the Optimal Trade Entry (OTE) levels (50%, 62%, 70.5%, etc.) within those gaps, looking for price to retrace into these specific areas.
Kill Zones (Timing): It incorporates specific time windows (London and New York Kill Zones, based on NY Time) where institutional trading activity is high, only allowing entry signals during these defined periods.
Signal and Targets: It triggers a Long or Short signal when all criteria are met (HTF Bias, FVG, OTE retracement, and Kill Zone timing). It then calculates and plots suggested trade levels, including a Stop Loss (SL) and three Take Profit targets (TP1, TP2, and a dynamic Runner Target based on the weekly Average True Range or ATR).
In summary, it's a comprehensive tool for traders following ICT principles, automating the confluence check across trend, structure, liquidity, and timing.

nATR*ATR Multiplication Indicator - Optimal Selection Tool forThis indicator is specifically designed as an analysis tool for investors using grid bot strategies. It displays both nATR (Normalized Average True Range) and ATR (Average True Range) values on a single chart screen, calculating the multiplication of these two critical volatility measurements.
Primary Purpose of the Indicator:
To facilitate the selection of the most optimal stock and time period for grid bot trading. The nATR*ATR multiplication provides a hybrid measurement that combines both percentage-based return potential (nATR) and absolute volatility magnitude (ATR).
Importance for Grid Bot Strategy:
High nATR: Greater percentage-based return potential
High ATR: Wider price range = Fewer grid levels = More budget allocation per grid
Formula: Price Range/ATR = Theoretical Grid Count
Usage Advantages:
Test different time periods to find the highest multiplication value
Make optimal stock and time frame selections for grid bot setup
Monitor both nATR and ATR values on a single screen
High multiplication values indicate ideal conditions for grid bots
Technical Features:
Adjustable calculation period (1-500 candles)
Visual alert system (high/low multiplication values)
Real-time value tracking table
SMA-based smoothed calculations
This serves as a reliable guide for grid bot investors in optimal timing and stock selection.

Key Indicators Dashboard (KID)Key Indicators Dashboard (KID) — Comprehensive Market & Trend Metrics
📌 Overview
The Key Indicators Dashboard (KID) is an advanced multi-metric market analysis tool designed to consolidate essential technical, volatility, and relative performance data into a single on-chart table. Instead of switching between multiple indicators, KID centralizes these key measures, making it easier to assess a stock’s technical health, volatility state, trend status, and relative strength at a glance.
🛠 Key Features
⦿ Average Daily Range (ADR %): Measures average daily price movement over a specified period. It is calculated by averaging the daily price range (high - low) over a set number of days (default 20 days).
⦿ Average True Range (ATR): Measures volatility by calculating the average of a true range over a specific period (default 14). It helps traders gauge the typical extent of price movement, regardless of the direction.
⦿ ATR%: Expresses the Average True Range as a percentage of the price, which allows traders to compare the volatility of stocks with different prices.
⦿ Relative Strength (RS): Compares a stock’s performance to a chosen benchmark index (default NIFTYMIDSML400) over a specific period (default 50 days).
⦿ RS Score (IBD-style): A normalized 1–100 rating inspired by Investor’s Business Daily methodology.
How it works: The RS Score is based on a weighted average of price changes over 3 months (40%), 6 months (20%), 9 months (20%), and 12 months (20%).
The raw value is converted into a percentage return, then normalized over the past 252 trading days so the lowest value maps to 1 and the highest to 100.
This produces a percentile-style score that highlights the strongest stocks in relative terms.
⦿ Relative Volume (RVol): Compares a stock's current volume to its average volume over a specific period (default 50). It is calculated by dividing the current volume by the average historical volume.
⦿ Average ₹ Volume (Turnover): Represents the total monetary value of shares traded for a stock. It's calculated by multiplying a day's closing price by its volume, with the final value converted to crores for clarity. This metric is a key indicator of a stock's liquidity and overall market interest.
⦿ Moving Average Extension: Measures how far a stock's current price has moved from from a selected moving average (EMA or SMA). This deviation is normalized by the stock's volatility (ATR%), with a default threshold of 6 ATR used to indicate that the stock is significantly extended and is marked with a selected shape (default Red Flag).
⦿ 52-Weeks High & Low: Measures a stock's current price in relation to its highest and lowest prices over the past year. It calculates the percentage a stock is below its 52-week high and above its 52-week low.
⦿ Market Capitalization: Market Cap represents the total value of all outstanding.
⦿ Free Float: It is the value of shares readily available for public trading, with the Free Float Percentage showing the proportion of shares available to the public.
⦿ Trend: Uses Supertrend indicator to identify the current trend of a stock's price. A factor (default 3) and an ATR period (default 10) is used to signal whether the trend is up or down.
⦿ Minervini Trend Template (MTT): It is a set of technical criteria designed to identify stocks in strong uptrends.
Price > 50-DMA > 150-DMA > 200-DMA
200-DMA is trending up for at least 1 month
Price is at least 30% above its 52-week low.
Price is within at least 25 percent of its 52-week high
Table highlights when a stock meets all above criteria.
⦿ Sector & Industry: Display stock's sector and industry, provides categorical classification to assist sector-based analysis. The sector is a broad economic classification, while the industry is a more specific group within that sector.
⦿ Moving Averages (MAs): Plot up to four customizable Moving Averages on a chart. You can independently set the type (Simple or Exponential), the source price, and the length for each MA to help visualize a stock's underlying trend.
MA1: Default 10-EMA
MA2: Default 20-EMA
MA3: Default 50-EMA
MA4: Default 200-EMA
⦿ Moving Average (MA) Crossover: It is a trend signal that occurs when a shorter-term moving average crosses a longer-term one. This script identifies these crossover events and plots a marker on the chart to visually signal a potential change in trend direction.
User-configurable MAs (short and long).
A bullish crossover occurs when the short MA crosses above the long MA.
A bearish crossover occurs when the short MA crosses below the long MA.
⦿ Inside Bar (IB): An Inside Bar is a candlestick whose entire price range is contained within the range of the previous bar. This script identifies this pattern, which often signals consolidation, and visually marks bullish and bearish inside bars on the chart with distinct colors and labels.
⦿ Tightness: Identifies periods of low volatility and price consolidation. It compares the price range over a short lookback period (default 3) to the average daily range (ADR). When the lookback range is smaller than the ADR, the indicator plots a marker on the chart to signal consolidation.
⦿ PowerBar (Purple Dot): Identifies candles with a strong price move on high volume. By default, it plots a purple dot when a stock moves up or down by at least 5% and has a minimum volume of 500,000. More dots indicate higher volatility and liquidity.
⦿ Squeezing Range (SQ): Identifies periods of low volatility, which can often precede a significant price move. It checks if the Bollinger Bands have narrowed to a range that is smaller than the Average True Range (ATR) for a set number of consecutive bars (default 3).
(UpperBB - LowerBB) < (ATR × 2)
⦿ Mark 52-Weeks High and Low: Marks and labels a stock's 52-Week High and Low prices directly on the chart. It draws two horizontal lines extending from the candles where the highest and lowest prices occurred over the past year, providing a clear visual reference for long-term price extremes.
⏳PineScreener Filters
The indicator’s alert conditions act as filters for PineScreener.
Price Filter: Minimum and maximum price cutoffs (default ₹25 - ₹10000).
Daily Price Change Filter: Minimum and maximum daily percent change (default -5% and 5%).
🔔 Built-in Alerts
Supports alert creation for:
ADR%, ATR/ATR %, RS, RS Rating, Turnover
Moving Average Crossover (Bullish/Bearish)
Minervini Trend Template
52-Week High/Low
Inside Bars (Bullish/Bearish)
Tightness
Squeezing Range (SQ)
⚙️ Customizable Visualization
Switchable between vertical or horizontal layout.
Works in dark/light mode
User-configurable to toggle any indicator ON or OFF.
User-configurable Moving (EMA/SMA), Period/Lengths and thresholds.
⦿ (Optional) : For horizontal table orientation increase Top Margin to 16% in Chart (Canvas) settings to avoid chart overlapping with table.
⚡ Add this script to your chart and start making smarter trade decisions today! 🚀

Enhanced 4H Candle Countdown & High/Low IndicatorBy profitgang
This Pine Script indicator provides real-time tracking of 4-hour timeframe levels with an integrated countdown timer, designed to help traders monitor key support and resistance zones.
Key Features
📊 Visual Elements
4H High/Low Lines: Clear visualization of previous 4-hour candle high and low levels
Range Fill: Subtle background fill between high and low for better context
Mid-Level Line: Shows the middle point of the 4H range
Position Indicator: Visual cue showing current price position within the range
⏰ Countdown Timer
Real-time countdown to next 4H candle close
Customizable table position (9 different locations)
Adjustable text size (6 size options from Tiny to Huge)
Distance calculations showing percentage distance from key levels
🎯 Signal Generation
Long signals when price crosses above 4H low
Short signals when price crosses below 4H high
RSI confluence filter to reduce false signals
Background highlighting for active signals
TradingView alerts compatible
⚙️ Customization Options
Toggle all features on/off independently
Custom colors for all elements
Table positioning (top/middle/bottom + left/center/right)
Text size selection for optimal readability
Alert notifications for level breaks and updates
How It Works
The indicator fetches the previous 4-hour candle's high and low values and displays them as horizontal lines on your current timeframe chart. It continuously calculates the time remaining until the current 4H candle closes and presents this information in a clean, customizable table.
Use Cases
Swing Trading: Identify key 4H support and resistance levels
Intraday Trading: Monitor when new 4H levels will be established
Risk Management: Calculate distance from key levels for position sizing
Multi-timeframe Analysis: Combine with lower timeframe setups
Educational Purpose
This indicator is designed for educational and analytical purposes to help traders understand price action relative to higher timeframe levels. It provides clear visual feedback about market structure and timing.
Settings Groups
Display Settings: Toggle features, positioning, and sizing
Colors: Customize all visual elements
Signal Settings: Configure alert conditions and confluence filters
Compatibility
Works on all timeframes (recommended for 1m to 1H charts)
Compatible with all instruments
Includes proper alert functionality for automated notifications
Optimized for both light and dark themes
This indicator does not provide financial advice. Always conduct your own research and risk management before making trading decisions.

Confluence Indicator: Fib, MACD, SMA 50/200This is a scalping indicator best used on the 1hour and 15min charts

Time-Price Velocity [QuantAlgo]🟢 Overview
The Time-Price Velocity indicator uses advanced velocity-based analysis to measure the rate of price change normalized against typical market movement, creating a dynamic momentum oscillator that identifies market acceleration patterns and momentum shifts. Unlike traditional momentum indicators that focus solely on price change magnitude, this indicator incorporates time-weighted displacement calculations and ATR normalization to create a sophisticated velocity measurement system that adapts to varying market volatility conditions.
This indicator displays a velocity signal line that oscillates around zero, with positive values indicating upward price velocity and negative values indicating downward price velocity. The signal incorporates acceleration background columns and statistical normalization to help traders identify momentum shifts and potential reversal or continuation opportunities across different timeframes and asset classes.
🟢 How It Works
The indicator's key insight lies in its time-price velocity calculation system, where velocity is measured using the fundamental physics formula:
velocity = priceChange / timeWeight
The system normalizes this raw velocity against typical price movement using Average True Range (ATR) to create market-adjusted readings:
normalizedVelocity = typicalMove > 0 ? velocity / typicalMove : 0
where "typicalMove = ta.atr(lookback)" provides the baseline for normal price movement over the specified lookback period.
The Time-Price Velocity indicator calculation combines multiple sophisticated components. First, it calculates acceleration as the change in velocity over time:
acceleration = normalizedVelocity - normalizedVelocity
Then, the signal generation applies EMA smoothing to reduce noise while preserving responsiveness:
signal = ta.ema(normalizedVelocity, smooth)
This creates a velocity-based momentum indicator that combines price displacement analysis with statistical normalization, providing traders with both directional signals and acceleration insights for enhanced market timing.
🟢 How to Use
1. Signal Interpretation and Threshold Zones
Positive Values (Above Zero): Time-price velocity indicating bullish momentum with upward price displacement relative to normalized baseline
Negative Values (Below Zero): Time-price velocity indicating bearish momentum with downward price displacement relative to normalized baseline
Zero Line Crosses: Velocity transitions between bullish and bearish regimes, indicating potential trend changes or momentum shifts
Upper Threshold Zone: Area above positive threshold (default 1.0) indicating strong bullish velocity and potential reversal point
Lower Threshold Zone: Area below negative threshold (default -1.0) indicating strong bearish velocity and potential reversal point
2. Acceleration Analysis and Visual Features
Acceleration Columns: Background histogram showing velocity acceleration (the rate of change of velocity), with green columns indicating accelerating velocity and red columns indicating decelerating velocity. The interpretation depends on trend context: red columns in downtrends indicate strengthening bearish momentum, while red columns in uptrends indicate weakening bullish momentum
Acceleration Column Height: The height of each column represents the magnitude of acceleration, with taller columns indicating stronger acceleration or deceleration forces
Bar Coloring: Optional price bar coloring matches velocity direction for immediate visual trend confirmation
Info Table: Real-time display of current velocity and acceleration values with trend arrows and change indicators
3. Additional Features:
Confirmed vs Live Data: Toggle between confirmed (closed) bar analysis for stable signals or current bar inclusion for real-time updates
Multi-timeframe Adaptability: Velocity normalization ensures consistent readings across different chart timeframes and asset volatilities
Alert System: Built-in alerts for threshold crossovers and direction changes
🟢 Examples with Preconfigured Settings
Default : Balanced configuration suitable for most timeframes and general trading applications, providing optimal balance between sensitivity and noise filtering for medium-term analysis.
Scalping : High sensitivity setup with shorter lookback period and reduced smoothing for ultra-short-term trades on 1-15 minute charts, optimized for capturing rapid momentum shifts and frequent trading opportunities.
Swing Trading : Extended lookback period with enhanced smoothing and higher threshold for multi-day positions, designed to filter market noise while capturing significant momentum moves on 1-4 hour and daily timeframes.

EPS and Sales Magic Indicator V2EPS and Sales Magic Indicator V2
EPS and Sales Magic Indicator V2
Short Title: EPS V2
Author: Trading_Tomm
Platform: TradingView (Pine Script v6)
License: Free for public use under fair usage guidelines
Overview
The EPS and Sales Magic Indicator V2 is a powerful stock fundamental visualization tool built specifically for TradingView users who wish to incorporate earnings intelligence directly onto their price chart. Designed and developed by Trading_Tomm, this upgraded version of the original 'EPS and Sales Magic Indicator' includes an enriched and more insightful presentation of company performance metrics — now with TTM EPS support, advanced color-coding, label sizing, and refined control options.
This indicator is tailored for retail traders, swing investors, and long-term fundamental analysts who need to view Quarter-over-Quarter (QoQ) earnings and revenue changes directly on the price chart without switching tabs or breaking focus.
What Does It Display?
The EPS and Sales Magic Indicator V2 intelligently detects quarterly financial updates and displays the following data points via labels:
1. EPS (Earnings Per Share) – Current Quarterly Value
This is the most recent Diluted EPS published by the company, fetched using TradingView’s request.financial() function.
Displayed in the format: EPS: ₹20.45
2. EPS QoQ Percentage Change
Shows the percentage change in EPS compared to the previous quarter.
Highlights improvement or decline using arrows (up for improvement, down for decline).
Displayed in the format: EPS: ₹20.45 (up 15.3 percent)
3. Sales (Revenue) – Current Quarterly Value
Fetches and displays Total Revenue of the company in ₹Crores for easier Indian-market readability.
Displayed in the format: Sales: ₹460Cr
4. Sales QoQ Percentage Change
Measures and presents the quarter-over-quarter percentage change in total revenue.
Uses arrows to indicate growth or contraction.
Displayed in the format: Sales: ₹460Cr (down 3.8 percent)
5. EPS TTM (Trailing Twelve Months)
You now get the TTM EPS — the sum of the last four quarterly EPS values.
This value provides a better long-term earnings snapshot compared to a single quarter.
Displayed in the format: TTM EPS: ₹78.12
All of these values are automatically calculated and displayed only on the bars where a new financial report is detected, keeping your chart clean and insightful.
Customization Features
This indicator is built with user control in mind, allowing you to personalize how and what you want to see:
Show EPS in Label: Enable or disable the display of EPS and EPS QoQ values.
Show Sales in Label: Toggle the visibility of revenue and sales change percentage.
Color Options for Label Themes: The label background color is automatically determined based on performance.
Green: Both EPS and Sales increased QoQ.
Red: Both decreased.
Orange: One increased and the other decreased.
Gray: Default color (if values are unavailable or mixed).
Label Text Size: Choose from Tiny, Small (default), or Normal.
Visual Design
Placement: The labels are positioned just below the candlesticks using yloc.belowbar, so they do not obstruct price action or interfere with technical indicators.
Anchor: Aligned precisely with the financial reporting bars to maintain clarity in historical comparisons.
Background Style: Clean, semi-transparent styling with soft text colors for comfortable viewing.
How It Works
The indicator relies on TradingView’s powerful request.financial() function to extract fiscal quarterly financials (FQ). Internally, it uses detection logic to identify fresh data updates by comparing current vs. previous values, arithmetic to compute QoQ percentage changes in EPS and Sales, logic to build formatted labels dynamically based on user selections, and conditional color and sizing logic to enhance interpretability.
Use Cases
For Long-Term Investors: Quickly identify if a company’s profitability and revenue are improving over time.
For Swing Traders: Combine recent earnings trends with price action to evaluate if post-result momentum has real backing.
For Technical and Fundamental Traders: Layer it with moving averages, RSI, or volume to create a hybrid analysis environment.
Limitations and Notes
Financial data is provided by TradingView’s financial API, and occasional missing values may occur for less-covered stocks.
This tool does not repaint but depends on the timing of the official financial updates.
All values are rounded and formatted to prioritize readability.
Works best on Daily or higher timeframes (weekly or monthly also supported).
License and Fair Use
This script is free to use and share under TradingView’s open-use guidelines. You may copy, fork, and build upon this indicator for personal or educational purposes, but commercial usage requires attribution to the author: Trading_Tomm.
Future Enhancements (Planned)
Addition of Net Profit (QoQ and TTM)
Inclusion of Operating Margin, Profit Margin, and Book Value
Option to switch between numeric and graphical display (table mode)
Alerts on extreme earnings deviation or sales slumps
Final Thoughts
The EPS and Sales Magic Indicator V2 represents a clean, visual, and smart way to monitor a company’s core performance from your chart screen. It helps you align fundamental strength with technical strategies and provides instant financial clarity, which is especially vital in today’s fast-moving markets.
Whether you’re preparing for an earnings season or scanning past performance to pick your next investment, this indicator saves time, enhances insights, and sharpens decisions.
