Project 1 - Complete with CMF and All IndicatorsProject 1 – Multi-Indicator Suite
This script combines several widely-used technical indicators into a single visual framework.
It is designed to help traders track momentum, trend strength, volume behavior, and money flow without switching between multiple tools.
Included components:
• MACD with dynamic color changes
• RSI with percentage change and directional marker
• ADX with trend-strength shading and Δ% calculation
• CMF (Chaikin Money Flow) with positive/negative flow tracking
• Volume Oscillator for short–long volume pressure
• Auto-updated labels for RSI, ADX, and CMF
• Lightweight visual lines to show momentum changes
Use cases:
• Trend confirmation
• Momentum diagnostics
• Volume-based pressure analysis
• Money-flow direction and strength
• Multi-factor confluence without indicator stacking
This tool does not generate buy/sell signals and does not imply trading outcomes.
It is a visual analytics suite built for discretionary technical analysis.
Search in scripts for "indicators"

Multi EMA + Indicators + Mini-Dashboard + Reversals v6📘 Multi EMA + Indicators + Mini-Dashboard + Reversals v6
🧩 Overview
This indicator is a multi-EMA setup that combines trend, momentum, and reversal analysis in a single visual framework.
It integrates four exponential moving averages (EMAs), key oscillators (RSI, MACD, Stochastic, CCI), volatility filtering (ATR), and a dynamic mini-dashboard that summarizes all signals in real time.
Its purpose is to help traders visually confirm trend alignment, filter valid entries, and identify possible trend continuation or reversal points.
It can display buy/sell arrows, detect reversal candles, and issue alerts when trading conditions are met.
⚙️ Core Components
1. Moving Averages (EMA Setup)
EMA1 (fast) and EMA2 (medium) define the short-term trend and trigger bias.
When the price is above both EMAs → bullish bias.
When below → bearish bias.
EMA3 and EMA4 act as trend filters. Their slopes (up or down) confirm overall momentum and help validate signals.
Each EMA has customizable lengths, sources, and colors for up/down trends.
This “EMA stack” is the foundation of the setup — a structured trend-following framework that adapts to market speed and volatility.
2. Momentum and Confirmation Filters
Each indicator can be individually enabled or disabled for flexibility.
RSI: confirms direction (above/below 50).
MACD: detects momentum crossover (MACD > Signal for bullish confirmation).
Stochastic: identifies trend continuation (K > D for longs, K < D for shorts).
CCI: adds trend bias above/below a threshold.
ATR Filter: filters out small, low-volatility candles to reduce noise.
You can activate only the filters that fit your trading plan — for instance, trend traders often use RSI and MACD, while scalpers may rely on Stochastic and ATR.
3. Reversal Detection
The indicator includes an optional Reversal Section that independently detects potential turning points.
It combines multiple configurable criteria:
Candlestick patterns (Bullish Hammer, Shooting Star).
Large Candle filter — detects unusually large bars (relative to close).
Price-to-EMA distance — identifies overextended moves that might revert.
RSI Divergence — detects potential momentum shifts.
RSI Overbought/Oversold zones (70/30 by default).
Doji Candles — sign of indecision.
A bullish or bearish reversal signal appears when enough selected criteria are met.
All sub-modules can be toggled on/off individually, giving you full control over sensitivity.
4. Signal Logic
Buy and sell signals are triggered when EMA alignment and the chosen confirmations agree:
Buy Signal
→ Price above EMA1 & EMA2
→ Confirmations (RSI/MACD/Stoch/CCI/ATR) pass
→ Trend filters (EMA3/EMA4) point upward
Sell Signal
→ Price below EMA1 & EMA2
→ Confirmations align bearishly
→ Trend filters (EMA3/EMA4) slope downward
Reversal signals can appear independently, even against the current EMA trend, depending on your settings.
5. Visual Dashboard
A mini-dashboard appears near the chart showing:
Current trade bias (LONG / SHORT / NEUTRAL)
EMA3 and EMA4 trend directions (↑ / ↓)
Quick visual bars (🟩 / 🟥) for each filter: RSI, MACD, Stoch, ATR, CCI, EMA filters
Reversal criteria status (Doji, RSI divergence, candle size, etc.)
This panel gives you a compact overview of all indicator states at a glance.
The color of the panel changes dynamically — green for bullish, red for bearish, gray for neutral.
6. Alerts
Built-in alerts allow automation or notifications:
Buy Alert
Sell Alert
Reversal Buy
Reversal Sell
You can connect these alerts to TradingView notifications or external bots for semi-automated execution.
💡 How to Use
✅ Trend-Following Setup
Focus on trades in the direction of EMA1 & EMA2.
Confirm with EMA3 & EMA4 trending in the same direction.
Use RSI/MACD/Stoch filters to ensure momentum supports the trade.
Avoid entries when ATR filter indicates low volatility.
🔄 Reversal Setup
Enable the Reversal section for potential tops/bottoms.
Look for reversal buy signals near support zones or after strong downtrends.
Use RSI divergence or Doji + Hammer signals as confirmation.
Combine with key chart areas (supply/demand or previous swing levels).
⚖️ Combination Approach
Trade continuation signals when all EMAs are aligned and filters are green.
Trade reversals only when at a key area (support/resistance) and confirmed by reversal conditions.
Always check higher-timeframe bias before entering a trade.
🧭 Practical Tips
Use different EMA sets for different timeframes:
9/21/50/100 for swing or trend trades.
5/13/34/89 for intraday scalping.
Turn off filters you don’t use to reduce lag.
Always validate signals with price structure, not just indicator alignment.
Practice in replay mode before live trading.
🗺️ Key Chart Confluence (Highly Recommended)
Although the indicator provides structured signals, its best use is in confluence with:
Support and resistance levels
Supply/demand zones
Trendlines and channels
Liquidity pools
Volume clusters
Signals aligned with strong key areas on the chart tend to have greater reliability than isolated indicator triggers.
I use EMA 1 - 20 Open ; EMA 2 - 20 Close ; EMA 3 - 50 ; EMA 4 - 200 or 100 , but that's me...
⚠️ Important Disclaimer
This indicator is a technical tool, not a guarantee of results.
Trading involves risk, and no signal is ever 100% accurate.
Every trader should develop a personal strategy, use proper risk management, and adapt settings to their instrument and timeframe.
Always combine indicator signals with key chart areas, higher-timeframe context, and your own analysis before taking a trade.

Hidden Impulse═══════════════════════════════════════════════════════════════════
HIDDEN IMPULSE - Multi-Timeframe Momentum Detection System
═══════════════════════════════════════════════════════════════════
OVERVIEW
Hidden Impulse is an advanced momentum oscillator that combines the Schaff Trend Cycle (STC) and Force Index into a comprehensive multi-timeframe trading system. Unlike standard implementations of these indicators, this script introduces three distinct trading setups with specific entry conditions, multi-timeframe confirmation, and trend filtering.
═══════════════════════════════════════════════════════════════════
ORIGINALITY & KEY FEATURES
This indicator is original in the following ways:
1. DUAL-TIMEFRAME STC ANALYSIS
Standard STC implementations work on a single timeframe. This script
simultaneously analyzes STC on both your trading timeframe and a higher
timeframe, providing trend context and filtering out low-probability signals.
2. FORCE INDEX INTEGRATION
The script combines STC with Force Index (volume-weighted price momentum)
to confirm the strength behind price moves. This combination helps identify
when momentum shifts are backed by genuine buying/selling pressure.
3. THREE DISTINCT TRADING SETUPS
Rather than generic overbought/oversold signals, the indicator provides
three specific, rule-based setups:
- Setup A: Classic trend-following entries with multi-timeframe confirmation
- Setup B: Divergence-based reversal entries (highest probability)
- Setup C: Mean-reversion bounce trades at extreme levels
4. INTELLIGENT FILTERING
All signals are filtered through:
- 50 EMA trend direction (prevents counter-trend trades)
- Higher timeframe STC alignment (ensures macro trend agreement)
- Force Index confirmation (validates volume support)
═══════════════════════════════════════════════════════════════════
HOW IT WORKS - TECHNICAL EXPLANATION
SCHAFF TREND CYCLE (STC) CALCULATION:
The STC is a cyclical oscillator that combines MACD concepts with stochastic
smoothing to create earlier and smoother trend signals.
Step 1: Calculate MACD
- Fast MA = EMA(close, Length1) — default 23
- Slow MA = EMA(close, Length2) — default 50
- MACD Line = Fast MA - Slow MA
Step 2: First Stochastic Smoothing
- Apply stochastic calculation to MACD
- Stoch1 = 100 × (MACD - Lowest(MACD, Smoothing)) / (Highest(MACD, Smoothing) - Lowest(MACD, Smoothing))
- Smooth result with EMA(Stoch1, Smoothing) — default 10
Step 3: Second Stochastic Smoothing
- Apply stochastic calculation again to the smoothed stochastic
- This creates the final STC value between 0-100
The dual stochastic smoothing makes STC more responsive than MACD while
being smoother than traditional stochastics.
FORCE INDEX CALCULATION:
Force Index measures the power behind price movements by incorporating volume:
Force Raw = (Close - Close ) × Volume
Force Index = EMA(Force Raw, Period) — default 13
Interpretation:
- Positive Force Index = Buying pressure (bulls in control)
- Negative Force Index = Selling pressure (bears in control)
- Force Index crossing zero = Momentum shift
- Divergences with price = Weakening momentum (reversal signal)
TREND FILTER:
A 50-period EMA serves as the trend filter:
- Price above EMA50 = Uptrend → Only LONG signals allowed
- Price below EMA50 = Downtrend → Only SHORT signals allowed
This prevents counter-trend trading which accounts for most losing trades.
═══════════════════════════════════════════════════════════════════
THE THREE TRADING SETUPS - DETAILED
SETUP A: CLASSIC MOMENTUM ENTRY
Concept: Enter when STC exits oversold/overbought zones with trend confirmation
LONG CONDITIONS:
1. Higher timeframe STC > 25 (macro trend is up)
2. Primary timeframe STC crosses above 25 (momentum turning up)
3. Force Index crosses above 0 OR already positive (volume confirms)
4. Price above 50 EMA (local trend is up)
SHORT CONDITIONS:
1. Higher timeframe STC < 75 (macro trend is down)
2. Primary timeframe STC crosses below 75 (momentum turning down)
3. Force Index crosses below 0 OR already negative (volume confirms)
4. Price below 50 EMA (local trend is down)
Best for: Trending markets, continuation trades
Win rate: Moderate (60-65%)
Risk/Reward: 1:2 to 1:3
───────────────────────────────────────────────────────────────────
SETUP B: DIVERGENCE REVERSAL (HIGHEST PROBABILITY)
Concept: Identify exhaustion points where price makes new extremes but
momentum (Force Index) fails to confirm
BULLISH DIVERGENCE:
1. Price makes a lower low (LL) over 10 bars
2. Force Index makes a higher low (HL) — refuses to follow price down
3. STC is below 25 (oversold condition)
Trigger: STC starts rising AND Force Index crosses above zero
BEARISH DIVERGENCE:
1. Price makes a higher high (HH) over 10 bars
2. Force Index makes a lower high (LH) — refuses to follow price up
3. STC is above 75 (overbought condition)
Trigger: STC starts falling AND Force Index crosses below zero
Why this works: Divergences signal that the current trend is losing steam.
When volume (Force Index) doesn't confirm new price extremes, a reversal
is likely.
Best for: Reversal trading, range-bound markets
Win rate: High (70-75%)
Risk/Reward: 1:3 to 1:5
───────────────────────────────────────────────────────────────────
SETUP C: QUICK BOUNCE AT EXTREMES
Concept: Catch rapid mean-reversion moves when price touches EMA50 in
extreme STC zones
LONG CONDITIONS:
1. Price touches 50 EMA from above (pullback in uptrend)
2. STC < 15 (extreme oversold)
3. Force Index > 0 (buyers stepping in)
SHORT CONDITIONS:
1. Price touches 50 EMA from below (pullback in downtrend)
2. STC > 85 (extreme overbought)
3. Force Index < 0 (sellers stepping in)
Best for: Scalping, quick mean-reversion trades
Win rate: Moderate (55-60%)
Risk/Reward: 1:1 to 1:2
Note: Use tighter stops and quick profit-taking
═══════════════════════════════════════════════════════════════════
HOW TO USE THE INDICATOR
STEP 1: CONFIGURE TIMEFRAMES
Primary Timeframe (STC - Primary Timeframe):
- Leave empty to use your current chart timeframe
- This is where you'll take trades
Higher Timeframe (STC - Higher Timeframe):
- Default: 30 minutes
- Recommended ratios:
* 5min chart → 30min higher TF
* 15min chart → 1H higher TF
* 1H chart → 4H higher TF
* Daily chart → Weekly higher TF
───────────────────────────────────────────────────────────────────
STEP 2: ADJUST STC PARAMETERS FOR YOUR MARKET
Default (23/50/10) works well for stocks and forex, but adjust for:
CRYPTO (volatile):
- Length 1: 15
- Length 2: 35
- Smoothing: 8
(Faster response for rapid price movements)
STOCKS (standard):
- Length 1: 23
- Length 2: 50
- Smoothing: 10
(Balanced settings)
FOREX MAJORS (slower):
- Length 1: 30
- Length 2: 60
- Smoothing: 12
(Filters out noise in 24/7 markets)
───────────────────────────────────────────────────────────────────
STEP 3: ENABLE YOUR PREFERRED SETUPS
Toggle setups based on your trading style:
Conservative Trader:
✓ Setup B (Divergence) — highest win rate
✗ Setup A (Classic) — only in strong trends
✗ Setup C (Bounce) — too aggressive
Trend Trader:
✓ Setup A (Classic) — primary signals
✓ Setup B (Divergence) — for entries on pullbacks
✗ Setup C (Bounce) — not suitable for trending
Scalper:
✓ Setup C (Bounce) — quick in-and-out
✓ Setup B (Divergence) — high probability scalps
✗ Setup A (Classic) — too slow
───────────────────────────────────────────────────────────────────
STEP 4: READ THE SIGNALS
ON THE CHART:
Labels appear when conditions are met:
Green labels:
- "LONG A" — Setup A long entry
- "LONG B DIV" — Setup B divergence long (best signal)
- "LONG C" — Setup C bounce long
Red labels:
- "SHORT A" — Setup A short entry
- "SHORT B DIV" — Setup B divergence short (best signal)
- "SHORT C" — Setup C bounce short
IN THE INDICATOR PANEL (bottom):
- Blue line = Primary timeframe STC
- Orange dots = Higher timeframe STC (optional)
- Green/Red bars = Force Index histogram
- Dashed lines at 25/75 = Entry/Exit zones
- Background shading = Oversold (green) / Overbought (red)
INFO TABLE (top-right corner):
Shows real-time status:
- STC values for both timeframes
- Force Index direction
- Price position vs EMA
- Current trend direction
- Active signal type
═══════════════════════════════════════════════════════════════════
TRADING STRATEGY & RISK MANAGEMENT
ENTRY RULES:
Priority ranking (best to worst):
1st: Setup B (Divergence) — wait for these
2nd: Setup A (Classic) — in confirmed trends only
3rd: Setup C (Bounce) — scalping only
Confirmation checklist before entry:
☑ Signal label appears on chart
☑ TREND in info table matches signal direction
☑ Higher timeframe STC aligned (check orange dots or table)
☑ Force Index confirming (check histogram color)
───────────────────────────────────────────────────────────────────
STOP LOSS PLACEMENT:
Setup A (Classic):
- LONG: Below recent swing low
- SHORT: Above recent swing high
- Typical: 1-2 ATR distance
Setup B (Divergence):
- LONG: Below the divergence low
- SHORT: Above the divergence high
- Typical: 0.5-1.5 ATR distance
Setup C (Bounce):
- LONG: 5-10 pips below EMA50
- SHORT: 5-10 pips above EMA50
- Typical: 0.3-0.8 ATR distance
───────────────────────────────────────────────────────────────────
TAKE PROFIT TARGETS:
Conservative approach:
- Exit when STC reaches opposite level
- LONG: Exit when STC > 75
- SHORT: Exit when STC < 25
Aggressive approach:
- Hold until opposite signal appears
- Trail stop as STC moves in your favor
Partial profits:
- Take 50% at 1:2 risk/reward
- Let remaining 50% run to target
───────────────────────────────────────────────────────────────────
WHAT TO AVOID:
❌ Trading Setup A in sideways/choppy markets
→ Wait for clear trend or use Setup B only
❌ Ignoring higher timeframe STC
→ Always check orange dots align with your direction
❌ Taking signals against the major trend
→ If weekly trend is down, be cautious with longs
❌ Overtrading Setup C
→ Maximum 2-3 bounce trades per session
❌ Trading during low volume periods
→ Force Index becomes unreliable
═══════════════════════════════════════════════════════════════════
ALERTS CONFIGURATION
The indicator includes 8 alert types:
Individual setup alerts:
- "Setup A - LONG" / "Setup A - SHORT"
- "Setup B - DIV LONG" / "Setup B - DIV SHORT" ⭐ recommended
- "Setup C - BOUNCE LONG" / "Setup C - BOUNCE SHORT"
Combined alerts:
- "ANY LONG" — fires on any long signal
- "ANY SHORT" — fires on any short signal
Recommended alert setup:
- Create "Setup B - DIV LONG" and "Setup B - DIV SHORT" alerts
- These are the highest probability signals
- Set "Once Per Bar Close" to avoid false alerts
═══════════════════════════════════════════════════════════════════
VISUALIZATION SETTINGS
Show Labels on Chart:
Toggle on/off the signal labels (green/red)
Disable for cleaner chart once you're familiar with the indicator
Show Higher TF STC:
Toggle the orange dots showing higher timeframe STC
Useful for visual confirmation of multi-timeframe alignment
Info Panel:
Cannot be disabled — always shows current status
Positioned top-right to avoid chart interference
═══════════════════════════════════════════════════════════════════
EXAMPLE TRADE WALKTHROUGH
SETUP B DIVERGENCE LONG EXAMPLE:
1. Market Context:
- Price in downtrend, below 50 EMA
- Multiple lower lows forming
- STC below 25 (oversold)
2. Divergence Formation:
- Price makes new low at $45.20
- Force Index refuses to make new low (higher low forms)
- This indicates selling pressure weakening
3. Signal Trigger:
- STC starts turning up
- Force Index crosses above zero
- Label appears: "LONG B DIV"
4. Trade Execution:
- Entry: $45.50 (current price at signal)
- Stop Loss: $44.80 (below divergence low)
- Target 1: $47.90 (STC reaches 75) — risk/reward 1:3.4
- Target 2: Opposite signal or trail stop
5. Trade Management:
- Price rallies to $47.20
- STC reaches 68 (approaching target zone)
- Take 50% profit, move stop to breakeven
- Exit remaining at $48.10 when STC crosses 75
Result: 3.7R gain
═══════════════════════════════════════════════════════════════════
ADVANCED TIPS
1. MULTI-TIMEFRAME CONFLUENCE
For highest probability trades, wait for:
- Primary TF signal
- Higher TF STC aligned (>25 for longs, <75 for shorts)
- Even higher TF trend in same direction (manual check)
2. VOLUME CONFIRMATION
Watch the Force Index histogram:
- Increasing bar size = Strengthening momentum
- Decreasing bar size = Weakening momentum
- Use this to gauge signal strength
3. AVOID THESE MARKET CONDITIONS
- Major news events (Force Index becomes erratic)
- Market open first 30 minutes (volatility spikes)
- Low liquidity instruments (Force Index unreliable)
- Extreme trending days (wait for pullbacks)
4. COMBINE WITH SUPPORT/RESISTANCE
Best signals occur near:
- Key horizontal levels
- Fibonacci retracements
- Previous day's high/low
- Psychological round numbers
5. SESSION AWARENESS
- Asia session: Use lower timeframes, Setup C works well
- London session: Setup A and B both effective
- New York session: All setups work, highest volume
═══════════════════════════════════════════════════════════════════
INDICATOR WINDOWS LAYOUT
MAIN CHART:
- Price action
- 50 EMA (green/red)
- Signal labels
- Info panel
INDICATOR WINDOW:
- STC oscillator (blue line, 0-100 scale)
- Higher TF STC (orange dots, optional)
- Force Index histogram (green/red bars)
- Reference levels (25, 50, 75)
- Background zones (green oversold, red overbought)
═══════════════════════════════════════════════════════════════════
PERFORMANCE OPTIMIZATION
For best results:
Backtesting:
- Test on your specific instrument and timeframe
- Adjust STC parameters if win rate < 55%
- Record which setup works best for your market
Position Sizing:
- Risk 1-2% per trade
- Setup B can use 2% risk (higher win rate)
- Setup C should use 1% risk (lower win rate)
Trade Frequency:
- Setup B: 2-5 signals per week (be patient)
- Setup A: 5-10 signals per week
- Setup C: 10+ signals per week (scalping)
═══════════════════════════════════════════════════════════════════
CREDITS & REFERENCES
This indicator builds upon established technical analysis concepts:
Schaff Trend Cycle:
- Developed by Doug Schaff (1996)
- Original concept published in Technical Analysis of Stocks & Commodities
- Implementation based on standard STC formula
Force Index:
- Developed by Dr. Alexander Elder
- Described in "Trading for a Living" (1993)
- Classic volume-momentum indicator
The multi-timeframe integration, three-setup system, and specific
entry conditions are original contributions of this indicator.
═══════════════════════════════════════════════════════════════════
DISCLAIMER
This indicator is a technical analysis tool and does not guarantee profits.
Past performance is not indicative of future results. Always:
- Use proper risk management
- Test on demo account first
- Combine with fundamental analysis
- Never risk more than you can afford to lose
═══════════════════════════════════════════════════════════════════
SUPPORT & QUESTIONS
If you find this indicator helpful, please:
- Leave a like and comment
- Share your feedback and results
- Report any bugs or issues
For questions about usage or optimization for specific markets,
feel free to comment below.
═════════════════════════════════════════════════════════════

Custom Bollinger Band Squeeze Screener [Pineify]Custom Bollinger Band Squeeze Screener
Key Features
Multi-symbol scanning: Analyze up to 6 tickers simultaneously.
Multi-timeframe flexibility: Screen across four selectable timeframes for each symbol.
Bollinger Band Squeeze algorithm: Detect volatility contraction and imminent breakouts.
Advanced ATR integration: Measure expansion and squeeze states with custom multipliers.
Customizable indicator parameters: Fine-tune Bollinger and ATR settings for tailored detection.
Visual table interface: Rapidly compare squeeze and expansion signals across all instruments.
How It Works
At the core, this screener leverages a unique blend of Bollinger Bands and Average True Range (ATR) to quantify volatility states for multiple assets and timeframes at once. For each symbol and every selected timeframe, the indicator calculates Bollinger Band width and compares it against ATR levels, offering real-time squeeze (consolidation) and expansion (breakout) signals.
Bollinger Band width is computed using standard deviations around a SMA basis.
ATR is calculated to gauge market volatility independent of price direction.
Squeeze: Triggered when BB width contracts below a multiple of ATR, forecasting lower volatility and set-up for a move.
Expansion: Triggered when BB width expands above a higher ATR multiple, signaling a high-volatility breakout.
Display: Results shown in an intuitive table, marking each status per ticker and TF.
Trading Ideas and Insights
Spot assets poised for volatility-driven breakouts.
Compare squeeze presence across timeframes for optimal entry timing.
Integrate screener results with price action or volume for high-confidence setups.
Use squeeze signals to avoid choppy or non-trending conditions.
Expand and diversify watchlists with multi-symbol coverage.
How Multiple Indicators Work Together
This script seamlessly merges Bollinger Bands and ATR with customized multipliers:
Bollinger Bands identify price consolidation and volatility squeeze zones.
ATR tailors the definition of squeeze and expansion, making signals adaptive to volatility regime changes.
By layering these with multi-symbol/multi-timeframe data, traders access a high-precision view of market readiness for trend acceleration or reversal.
The real synergy is in the screener's ability to visualize volatility states for a diverse asset selection, transforming traditional single-chart analysis into a broad market view.
Unique Aspects
Original implementation: Not a simple trend or scalping indicator; utilizes advanced volatility logic.
Fully multi-symbol and multi-timeframe support uncommon in most screeners.
Custom ATR multipliers for both squeeze and expansion allow traders to match their risk profile and market dynamics.
Visual clarity: Table structure promotes actionable insights and reduces decision fatigue.
How to Use
Add the indicator to your TradingView chart (supports any asset class including crypto, forex, stocks).
Select up to six symbols (tickers) and set your preferred timeframes.
Adjust Bollinger Band Length/Deviation and ATR multipliers to refine squeeze/expansion criteria.
Review the screener table: Look for "SQZ" (squeeze) or "EXP" (expansion) cells for entry/exit ideas.
Combine screener information with other technical or fundamental signals for trade confirmation.
Customization
Symbols: Choose any tickers for scanning.
Timeframes: Select short- to long-term intervals to match your trading style.
Bollinger Band parameters: Modify length and deviation for sensitivity.
ATR multipliers: Set low or high values to adjust squeeze/expansion triggers.
Table size and layout: Adapt display for optimal workflow.
Conclusion
The Bollinger Band Squeeze Screener Pineify delivers an innovative, SEO-friendly multi-asset solution for volatility and trend detection. Harness its original algorithmic design to uncover powerful breakout opportunities and optimize your portfolio. Whether you trade crypto with dynamic volatility or scan stocks for momentum, this tool supercharges your TradingView workflow.

Multi-Symbol and Multi-Timeframe Supertrend Screener [Pineify]Multi-Symbol and Multi-Timeframe Supertrend Screener
Advanced Supertrend screener for TradingView that monitors 6 symbols across 4 timeframes simultaneously. Features customizable ATR periods, visual alerts, and color-coded trend direction displays for efficient market scanning.
Key Features
The Supertrend Screener is a comprehensive multi-symbol market monitoring tool that displays Supertrend indicator signals across multiple assets and timeframes in a single, organized table view. This screener eliminates the need to manually check individual charts by providing real-time trend analysis for up to 6 symbols across 4 different timeframes simultaneously.
How It Works
The screener utilizes the proven Supertrend indicator methodology, which combines Average True Range (ATR) and price action to determine trend direction. The core calculation involves:
Computing the ATR using a customizable period (default: 10)
Applying a multiplication factor (default: 3.0) to create dynamic support/resistance levels
Determining trend direction based on price position relative to these levels
Displaying results through color-coded cells with customizable text labels
The indicator employs the request.security() function to fetch data from multiple symbols and timeframes, ensuring accurate cross-market analysis without chart switching.
Trading Ideas and Insights
This screener excels in several trading scenarios:
Market Overview: Quickly assess overall market sentiment across major cryptocurrencies or forex pairs
Trend Confirmation: Verify trend alignment across multiple timeframes before entering positions
Divergence Spotting: Identify when shorter timeframes diverge from longer-term trends
Opportunity Scanning: Locate assets showing consistent trend direction across all monitored timeframes
Risk Management: Monitor multiple positions simultaneously to spot potential trend reversals
The screener is particularly effective for swing traders and position traders who need to monitor multiple assets without constantly switching between charts.
How Multiple Indicators Work Together
While this screener focuses specifically on the Supertrend indicator, it incorporates several complementary technical analysis components:
ATR Foundation: Uses Average True Range to adapt to market volatility, making the indicator responsive to current market conditions
Multi-Timeframe Analysis: Combines signals from 1-minute, 5-minute, 10-minute, and 30-minute timeframes to provide comprehensive trend perspective
Price Action Integration: The Supertrend calculation inherently incorporates price action by using high, low, and close values
Volatility Adjustment: The ATR-based calculation ensures the indicator adapts to different volatility regimes across various assets
The synergy between these elements creates a robust screening system that accounts for both momentum and volatility , providing more reliable trend identification than single-timeframe analysis.
Unique Aspects
Several features distinguish this screener from standard Supertrend implementations:
Table-Based Display: Presents data in an organized, space-efficient format rather than overlay plots
Customizable Visual Elements: Full control over text labels, colors, and background styling
Multi-Asset Capability: Monitors 6 different symbols simultaneously without performance degradation
Efficient Resource Usage: Optimized code structure minimizes calculation overhead
Professional Presentation: Clean, institutional-grade visual design suitable for trading desks
How to Use
Symbol Configuration: Input your desired symbols in the Symbol section (default includes major crypto pairs)
Timeframe Setup: Configure four timeframes for analysis (default: 1m, 5m, 10m, 30m)
Supertrend Parameters: Adjust the Factor (sensitivity) and ATR Period according to your trading style
Visual Customization: Set custom text labels and colors for up/down trends
Market Analysis: Monitor the table for consistent signals across timeframes and symbols
Interpretation Guide:
- Green cells indicate uptrend (price above Supertrend line)
- Red cells indicate downtrend (price below Supertrend line)
- Look for alignment across multiple timeframes for stronger signal confidence
Customization
The screener offers extensive customization options:
Factor Setting: Adjust sensitivity (higher values = less sensitive, fewer signals)
ATR Period: Modify lookback period for volatility calculation
Text Labels: Customize up/down trend display text
Color Scheme: Full RGB color control for text and background elements
Symbol Selection: Monitor any TradingView-supported symbols
Timeframe Array: Choose any four timeframes for comprehensive analysis
Conclusion
The Supertrend Screener transforms traditional single-chart analysis into an efficient, multi-dimensional market monitoring system. By combining the reliability of the Supertrend indicator with multi-timeframe and multi-symbol capabilities, this tool empowers traders to make more informed decisions with greater market context.
Whether you're managing multiple positions, scanning for new opportunities, or confirming trend direction before entries, this screener provides the comprehensive overview needed for professional trading operations. The clean interface and customizable features make it suitable for traders of all experience levels while maintaining the analytical depth required for serious market analysis.
Perfect for day traders, swing traders, and anyone requiring efficient multi-market trend monitoring in a single view.

Ichimoku Cloud Indicator [TradingFinder] Kinko Hyo Cross Alerts🔵 Introduction
The Ichimoku Cloud (Ichimoku Kinko Hyo) is one of the most powerful and complete trading indicators in technical analysis. Originally developed by Japanese journalist Goichi Hosoda, the Ichimoku system combines multiple tools in one indicator, providing traders with instant insights into trend direction, support and resistance levels, and momentum. Unlike simple moving averages (SMA – Simple Moving Average), the Ichimoku Cloud (Kumo – Cloud) integrates dynamic elements that help traders forecast potential price action with greater clarity.
The Ichimoku Indicator (Ichimoku Signal System) is widely used across global markets, from Forex trading (FX – Foreign Exchange) to stocks, indices, and even cryptocurrencies. Its popularity comes from its ability to generate clear buy signals and sell signals based on the interaction of its components: Tenkan Sen (Conversion Line), Kijun Sen (Base Line), Senkou Span A, Senkou Span B, and Chikou Span (Lagging Line). When combined, these lines create the Ichimoku Cloud, which visually represents the balance between price action and market structure.
Ichimoku Cloud Lines Formulas :
Conversion Line (Tenkan Sen / Conversion Line) : Average of the highest high and lowest low over the past 9 periods => (9-PH + 9-PL) ÷ 2
Base Line (Kijun Sen / Base Line) : Average of the highest high and lowest low over the past 26 periods => (26-PH + 26-PL) ÷ 2
Leading Span A (Senkou Span A / Leading Span A) : Average of the Conversion Line and Base Line, plotted 26 periods ahead => (Tenkan Sen + Kijun Sen) ÷ 2
Leading Span B (Senkou Span B / Leading Span B) : Average of the highest high and lowest low over the past 52 periods, plotted 26 periods ahead => (52-PH + 52-PL) ÷ 2
Lagging Span (Chikou Span / Lagging Span) : Current closing price, plotted 26 periods behind.
One of the biggest advantages of the Ichimoku Trading Strategy (Ichimoku Cloud Trading System) is that it allows traders to identify the market condition at a glance. When the price is above the Kumo (Cloud), it indicates a bullish trend (uptrend). When the price is below the Kumo, the market is in a bearish trend (downtrend). And when the price is inside the cloud, the market is ranging (sideways trend). This simplicity and visual clarity make Ichimoku an essential indicator for both beginner traders and professional analysts.
The Ichimoku Cloud Indicator (Ichimoku Technical Analysis Tool) continues to be one of the most reliable charting methods. Traders often consider it superior to basic moving averages (MA – Moving Average) or exponential moving averages (EMA – Exponential Moving Average), because it not only shows trend direction but also highlights potential future support and resistance levels. With its unique combination of trend analysis, price forecasting, and trading signals, Ichimoku remains a core strategy in modern trading systems.
🔵 How to Use
The Ichimoku Cloud is more than just a set of lines; it’s a complete trading system that helps traders identify trends, momentum, and key support and resistance levels. By combining its five lines Conversion Line, Base Line, Leading Span A, Leading Span B, and Lagging Span traders can develop clear buy and sell strategies.
🟣 Identifying Trend Direction
Bullish Trend (Uptrend) : Price is above the cloud (Kumo), and the cloud is green. Leading Span A is above Leading Span B, signaling strong upward momentum.
Bearish Trend (Downtrend) : Price is below the cloud, and the cloud is red. Leading Span A is below Leading Span B, confirming a downward momentum.
Ranging / Sideways Market : Price is inside the cloud, indicating indecision and consolidation. Traders often avoid opening strong positions during these periods.
🟣 Buy Strategies
Conversion/Base Line Crossover : A buy signal occurs when the Conversion Line (Tenkan Sen) crosses above the Base Line (Kijun Sen). The signal is strongest when this crossover happens above the cloud.
Price Above Base Line : If the price moves above the Base Line while in an uptrend, it confirms bullish momentum and provides a favorable entry point.
Cloud Support Pullback : During a pullback in an uptrend, the price may touch or slightly enter the cloud. Traders can use the cloud as a dynamic support zone for buying opportunities.
Lagging Span Confirmation : Ensure the Lagging Span (Chikou Span) is above the price of 26 periods ago to confirm the strength of the bullish trend.
🟣 Sell Strategies
Conversion/Base Line Crossover : A sell signal is generated when the Conversion Line (Tenkan Sen) crosses below the Base Line (Kijun Sen). This signal is strongest when it occurs below the cloud.
Price Below Base Line : If the price falls below the Base Line in a downtrend, it confirms bearish momentum and strengthens the sell setup.
Cloud Resistance Pullback : During a bounce in a downtrend, the cloud acts as a resistance zone. Traders can enter sell positions when price approaches or touches the cloud from below.
Lagging Span Confirmation : The Lagging Span should be below the price of 26 periods ago, confirming downward momentum.
🟣 Cloud Breakout Signals
A strong buy occurs when the price breaks above the cloud from below, signaling a potential trend reversal.
A strong sell occurs when the price breaks below the cloud from above, indicating a shift toward a bearish trend.
🟣 Combining Signals for Stronger Entries
For higher probability trades, combine multiple signals : trend direction (cloud color and position), crossovers (Tenkan/Kijun), and Lagging Span position.
Avoid trading against the overall trend. For example, avoid buying when price is below a red cloud or selling when price is above a green cloud.
🔵 Setting
Tenkan Sen Period : Lookback period for Conversion Line (default: 9).
Kijun Sen Period : Lookback period for Base Line (default: 26).
Span B Period : Lookback period for Leading Span B, forms one Cloud boundary (default: 52).
Shift Lines : Periods forward for Cloud / backward for Lagging Span (default: 26).
Cross Tenkan/Kijun Alert : Alert on Conversion/Base Line crossover.
Cross Price/Tenkan Alert : Alert when price crosses Tenkan Sen.
Cross Price/Kijun Alert : Alert when price crosses Kijun Sen
🔵 Conclusion
The Ichimoku Cloud (Ichimoku Kinko Hyo) is much more than a simple indicator it is a complete trading system that combines trend detection, momentum analysis, and support/resistance identification in one view. By interpreting the position of price relative to the cloud, the interaction between Tenkan Sen (Conversion Line) and Kijun Sen (Base Line), the leading spans (Senkou Span A and B), and the Chikou Span (Lagging Line), traders can identify potential buy and sell opportunities with higher confidence.
The main advantage of the Ichimoku Cloud is its ability to provide a “one-look equilibrium” snapshot of the market. It highlights bullish trends when the price is above the cloud, bearish conditions when the price is below it, and indecision or transition when the price is inside the cloud. Crossovers, cloud breakouts, and confirmations by the Chikou Span strengthen the trading signals.
However, traders should keep in mind the limitations of the Ichimoku system. It is based on historical data and should not be used in isolation. Combining it with other tools such as RSI, volume analysis, or candlestick patterns can significantly improve accuracy and reduce false signals.

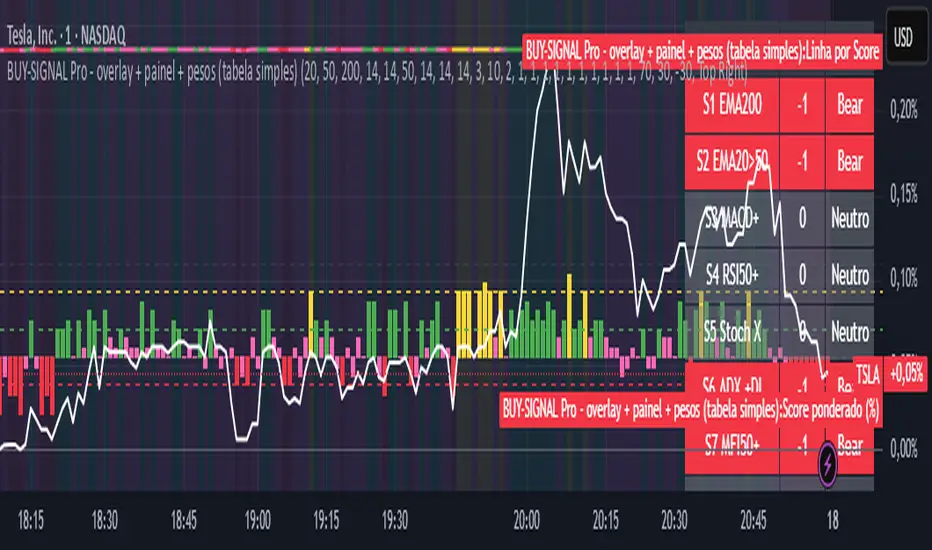
BUY-SIGNAL Pro - 10 Indicators - Strategy Godinho 2Best 10 indicators
Strong buy YELLOW
Buy GREEN
Hold PINK
Sell RED
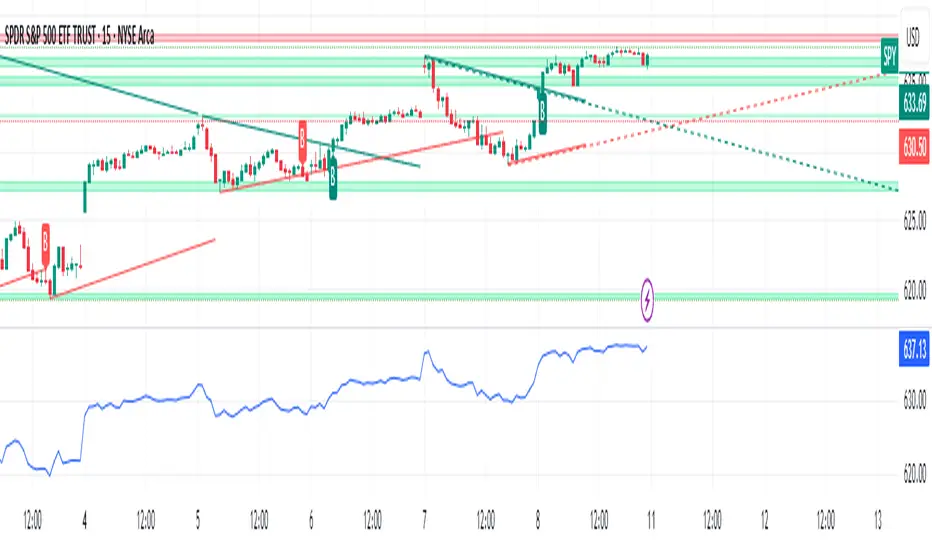
Source-indicatorsSource Indicators – A premium TradingView tool combining automated support/resistance levels, dynamic trendlines, and breakout alerts.
Perfect for spotting key market zones and trend shifts in real-time.
TCP | Market Session | Session Analyzer📌 TCP | Market Session Indicator | Crypto Version
A powerful, real-time market session visualization tool tailored for crypto traders. Track the heartbeat of Asia, Europe, and US trading hours directly on your chart with live session boxes, behavioral analysis, liquidity grab detection, and countdown timers. Know when the action starts, how the market behaves, and where the traps lie.
🔰 Introduction:
Trade the Right Hours with the Right Tools
Time matters in trading. Most significant moves happen during key sessions—and knowing when and how each session unfolds can give you a sharp edge. The TCP Market Session Indicator, developed by Trade City Pro (TCP), puts professional session tracking and behavioral insights at your fingertips.
Whether you're a scalper or swing trader, this indicator gives you the timing context to enter and exit trades with greater confidence and clarity.
🕒 Core Features
• Live Session Boxes :
Highlight active ranges during Asia, Europe, and US sessions with dynamic high/low updates.
• Session Start/End Labels :
Know exactly when each session begins and ends plotted clearly on your chart with context.
• Session Behavior Analysis :
At the end of each session, the indicator classifies the price action as:
- Trend Up
- Trend Down
- Consolidation
- Manipulation
• Liquidity Grab Detection: Automatically detects possible stop hunts (fake breakouts) and marks them on the chart with precision filters (volume, ATR, reversal).
• Session Countdown Table: A live dashboard showing:
- Current active session
- Time left in session
- Upcoming session and how many minutes until it starts
- Utility time converter (e.g. 90 min = 01:30)
• Vertical Session Lines: Visualize past and upcoming session boundaries with customizable history and future range.
• Multi-Day Support: Draw session ranges for previous, current, and future days for better backtesting and forecasting.
⚙️ Settings Panel
Customize everything to fit your trading style and schedule:
• Session Time Settings:
Set the opening and closing time for each session manually using UTC-based minute inputs.
→ For example, enter Asia Start: 0, Asia End: 480 for 00:00–08:00 UTC.
This gives full flexibility to adjust session hours to match your preferred market behavior.
• Enable or Disable Elements:
Toggle the visibility of each session (Asia, Europe, US), as well as:
- Session Boxes
- Countdown Table
- Session Lines
- Liquidity Grab Labels
• Timezone Selection:
Choose between using UTC or your chart’s local timezone for session calculations.
• Customization Options:
Select number of past and future days to draw session data
Adjust vertical line transparency
Fine-tune label offset and spacing for clean layout
📊 Smart Session Boxes
Each session box tracks high, low, open, and close in real time, providing visual clarity on market structure. Once a session ends, the box closes, and the behavior type is saved and labeled ideal for spotting patterns across sessions.
• Asia: Green Box
• Europe: Orange Box
• US: Blue Box
💡 Why Use This Tool?
• Perfect Timing: Don’t get chopped in low-liquidity hours. Focus on sessions where volume and volatility align.
• Pattern Recognition: Study how price behaves session-to-session to build better strategies.
• Trap Detection: Spot manipulation moves (liquidity grabs) early and avoid common retail pitfalls.
• Macro Session Mapping: Use as a foundational layer to align trades with market structure and news cycles.
🔍 Example Use Case
You're watching BTC at 12:45 UTC. The indicator tells you:
The Asia session just ended (label shows “Asia Session End: Trend Up”)
Europe session starts in 15 minutes
A liquidity grab just triggered at the previous high—label confirmed
Now you know who’s active, what the market just did, and what’s about to start—all in one glance.
✅ Why Traders Trust It
• Visual & Intuitive: Fully chart-based, no clutter, no guessing
• Crypto-Focused: Designed specifically for 24/7 crypto markets (not outdated forex models)
• Non-Repainting: All labels and boxes stay as printed—no tricks
• Reliable: Tested across multiple exchanges, pairs, and timeframes
🧩 Built by Trade City Pro (TCP)
The TCP Market Session Indicator is part of a suite of professional tools used by over 150,000 traders. It’s coded in Pine Script v6 for full compatibility with TradingView’s latest capabilities.
🔗 Resources
• Tutorial: Learn how to analyze sessions like a pro in our TradingView guide:
"TradeCityPro Academy: Session Mapping & Liquidity Traps"
• More Tools: Explore our full library of indicators on

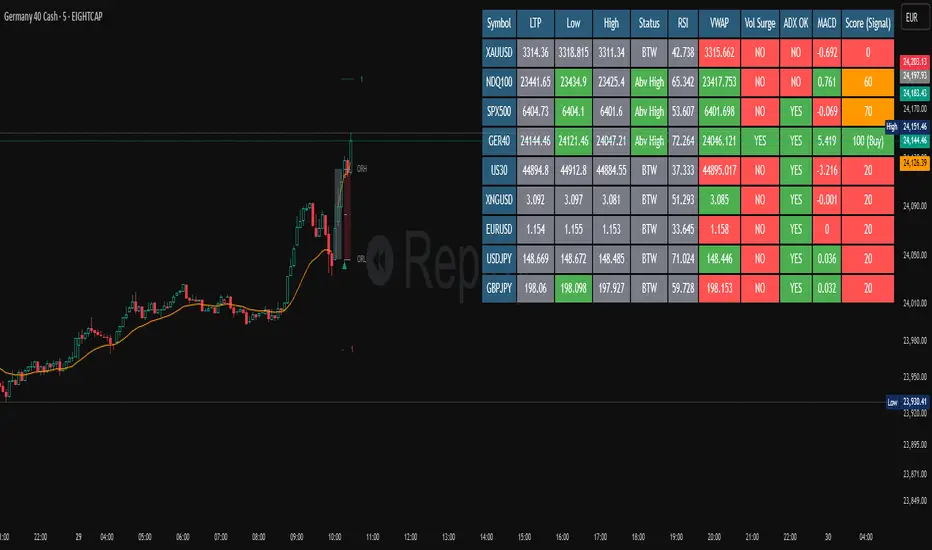
ORB Screener-Multiple Indicators [Marin adjusted]ORB Screener for multiple instruments
You can select the range of the ORB and see different indicators for the selected instruments
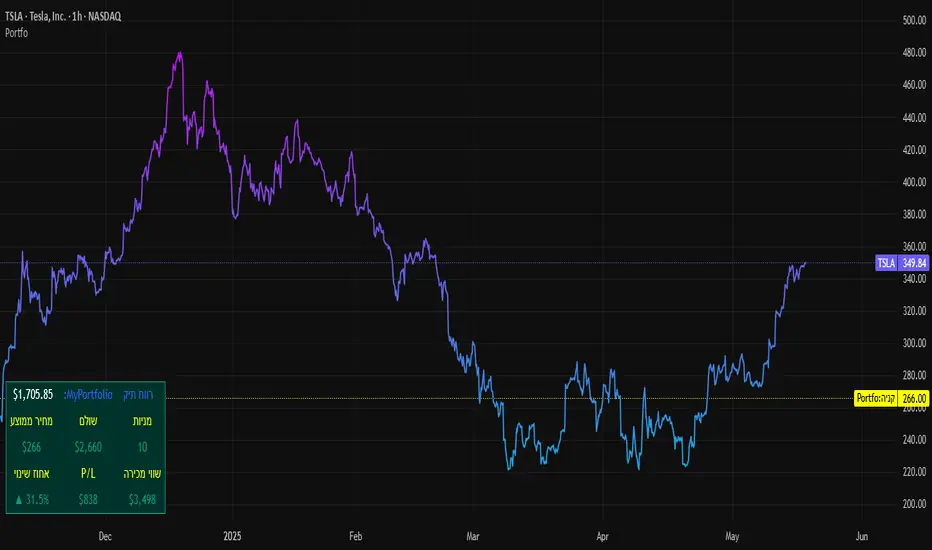
SBC ProtfoSBC Portfo PNL Indicator
Description
The SBC Portfo PNL Indicator is a user-friendly tool designed for Hebrew-speaking traders to track the Profit and Loss (PNL) of their stock portfolios on TradingView charts. It supports up to 5 distinct portfolios, each capable of holding an unlimited number of stocks with unlimited buy commands, allowing real-time monitoring of portfolio performance.
Key Features
- Multi-Portfolio Support: Track up to 5 separate portfolios for different trading strategies or accounts.
- Unlimited Stock Entries: Add unlimited stocks and buy commands per portfolio.
- Detailed Buy Commands: Input for each stock:
- Stock Ticker (e.g., AAPL, TSLA).
- Buy Price (e.g., 150.25).
- Buy Amount (e.g., 10).
- Hebrew-Friendly Interface: Intuitive settings dialog with clear instructions in Hebrew.
- Customizable PNL Tracking: Visualize PNL on charts with real-time updates based on market data.
How to Use
1. Add the Indicator:
- Go to the Indicators menu in TradingView and add the "SBC Portfo" PNL Indicator.
2. Configure Portfolios:
- Open the indicator’s settings dialog.
- For each portfolio (up to 5), enter data in the provided input fields using this format:
PortfolioName:StockTicker:BuyPricexBuyAmount;StockTicker:BuyPricexBuyAmount
Example:
Portfolio1:AAPL:150.25x10;TSLA:266.72x5
- This represents a portfolio named "Portfolio1" with:
- 10 shares of AAPL bought at $150.25.
- 5 shares of TSLA bought at $266.72.
- Repeat for additional portfolios (e.g., Portfolio2, Portfolio3).
- Add multiple buy commands for the same stock if needed (e.g., AAPL:160.50x20).
3. Apply Settings:
- Save settings to display PNL based on current market prices.
4. Monitor PNL:
- View PNL for each portfolio on the chart via tables, labels, or graphical overlays (based on settings).
Input Format
Enter portfolio data manually in the settings dialog, one input field per portfolio:
PortfolioName:StockTicker:BuyPricexBuyAmount;StockTicker:BuyPricexBuyAmount
- PortfolioName: Unique name (e.g., Portfolio1, Growth).
- StockTicker: Stock symbol (e.g., AAPL).
- BuyPrice: Purchase price per share (e.g., 150.25).
- BuyAmount: Number of shares (e.g., 10).
- Use
: to separate portfolio name, ticker, and buy data
x to separate price and amount
; for multiple stocks in the portfolio
Example:
- Portfolio 1: GrowthPortfolio:AAPL:150.25x10;TSLA:266.72x5
- Portfolio 2: DividendPortfolio:KO:55.20x50;PG:145.30x30
Notes
- Hebrew Support: Settings and labels are optimized for Hebrew users.
- Manual Input: Enter portfolio data manually in the settings dialog using the correct format.
- Compatibility: Works with any stock ticker supported by TradingView.
תיאור אינדיקטור SBC Portfo PNL הוא כלי ידידותי למשתמש שתוכנן במיוחד עבור סוחרים דוברי עברית למעקב אחר רווח והפסד (PNL) של תיקי המניות שלהם ישירות בגרפים של TradingView. הוא תומך בעד 5 תיקים נפרדים, כאשר כל תיק יכול להכיל מספר בלתי מוגבל של מניות עם פקודות קנייה בלתי מוגבלות, ומאפשר מעקב בזמן אמת אחר ביצועי התיק.
תכונות עיקריות
- תמיכה בריבוי תיקים: מעקב אחר עד 5 תיקים נפרדים עבור אסטרטגיות מסחר או חשבונות שונים.
- רישום מניות ללא הגבלה: הוספת מספר בלתי מוגבל של מניות ופקודות קנייה לכל תיק.
- פקודות קנייה מפורטות: הזנת נתונים עבור כל מניה:
- סימול המניה (למשל, AAPL, TSLA).
- מחיר קנייה (למשל, 150.25).
- כמות קנייה (למשל, 10).
- ממשק ידידותי לעברית: חלונית הגדרות אינטואיטיבית עם הוראות ברורות בעברית.
- מעקב PNL הניתן להתאמה: הצגת רווח והפסד בגרפים עם עדכונים בזמן אמת בהתבסס על נתוני השוק.
כיצד להשתמש
1. הוספת האינדיקטור:
- נווט לתפריט האינדיקטורים ב-TradingView והוסף את "SBC Portfo PNL Indicator".
2. הגדרת תיקים:
- פתח את חלונית ההגדרות של האינדיקטור.
- עבור כל תיק (עד 5), הזן נתונים בשדות המסופקים בפורמט הבא:
PortfolioName:StockTicker:BuyPricexBuyAmount;StockTicker:BuyPricexBuyAmount
לדוגמה:
Portfolio1:AAPL:150.25x10;TSLA:266.72x5
שורה זו מייצגת תיק בשם "Portfolio1" עם:
- 10 מניות של AAPL שנקנו ב-$150.25.
- 5 מניות של TSLA שנקנו ב-$266.72.
- חזור על התהליך עבור תיקים נוספים (למשל, Portfolio2, Portfolio3).
- ניתן להוסיף פקודות קנייה מרובות לאותה מניה לפי הצורך (למשל, AAPL:160.50x20).
3. החלת ההגדרות:
- שמור את ההגדרות להצגת ה-PNL בהתבסס על מחירי השוק הנוכחיים.
4. מעקב אחר PNL:
- צפה ב-PNL עבור כל תיק בגרף באמצעות טבלאות, תוויות או שכבות גרפיות (בהתאם להגדרות).
פורמט קלט הזן נתוני תיק ידנית בחלונית ההגדרות, שדה קלט אחד לכל תיק: PortfolioName:StockTicker:BuyPricexBuyAmount;StockTicker:BuyPricexBuyAmount
PortfolioName: שם ייחודי (למשל, Portfolio1, Growth).
StockTicker: סימול המניה (למשל, AAPL).
BuyPrice: מחיר רכישה למניה (למשל, 150.25).
BuyAmount: מספר המניות (למשל, 10).
השתמש ב-
: להפרדה בין שם התיק, סימול ונתוני קנייה
x להפרדה בין מחיר וכמות
; להפרדה בין מניות מרובות
דוגמה:
- תיק 1: GrowthPortfolio:AAPL:150.25x10;TSLA:266.72x5
- תיק 2: DividendPortfolio:KO:55.20x50;PG:145.30x30
Release Notes
Version 1.1 includes:
- Calculations for extended hours (Pre-Market & After-Hours).
- Option to display portfolio summary data for stocks not in the portfolio (enable via settings checkbox).
- Table background for better visibility; click to bring table to the front.
- Updated text strings (names, titles, tooltips).
הערות
תמיכה בעברית: ההגדרות והתוויות מותאמות למשתמשים דוברי עברית.
הזנה ידנית: הזן נתוני תיק ידנית בחלונית ההגדרות תוך שימוש בפורמט הנכון.
תאימות: עובד עם כל סימול מניה הנתמך על ידי TradingView.
גרסה 1.1 מכילה:
1. חישובים כוללים שעות מסחר מורחבות (Pre-Market ו-After-Hours).
2. אפשרות להציג נתוני תיק כוללים עבור מניות שאינן בתיק (הפעל באמצעות תיבת סימון בהגדרות).
3. צבע רקע לטבלה לשיפור הנראות; לחיצה על הטבלה מביאה אותה לחזית.
4. תיקון נוסחים (שמות, כותרות, וטולטיפים).
QuantumSync Pulse [ w.aritas ]QuantumSync Pulse (QSP) is an advanced technical indicator crafted for traders seeking a dynamic and adaptable tool to analyze diverse market conditions. By integrating momentum, mean reversion, and regime detection with quantum-inspired calculations and entropy analysis, QSP offers a powerful histogram that reflects trend strength and market uncertainty. With multi-timeframe synchronization, adaptive filtering, and customizable visualization, it’s a versatile addition to any trading strategy.
Key Features
Hybrid Signals: Combines momentum and mean reversion, dynamically weighted by market regime.
Quantum Tunneling: Enhances responsiveness in volatile markets using volatility-adjusted calculations.
3-State Entropy: Assesses market uncertainty across up, down, and neutral states.
Regime Detection: Adapts signal weights with Hurst exponent and volatility ROC.
Multi-Timeframe Alignment: Syncs with higher timeframe trends for context.
Customizable Histogram: Displays trend strength with ADX-based visuals and flexible styling.
How to Use and Interpret
Histogram Interpretation
Positive (Above Zero): Bullish momentum; color intensity shows trend strength.
Negative (Below Zero): Bearish momentum; gradients indicate weakness.
Overlaps: Alignment of final_z (signal) and ohlc4 (price) histograms highlights key price levels or turning points.
Regime Visualization
Green Background: Trending market; prioritize momentum signals.
Red Background: Mean-reverting market; focus on reversion signals.
Blue Background: Neutral state; balance both signal types.
Trading Signals
Buy: Histogram crosses above zero or shows positive divergence between histograms.
Sell: Histogram crosses below zero or exhibits negative divergence.
Confirmation: Match signals with regime background—green for trends, red for ranges.
Customization
Tweak Momentum Length, Entropy Lookback, and Hurst Exponent Lookback for sensitivity.
Adjust color themes and transparency to suit your charts.
Tips for Optimal Use
Timeframes: Use higher timeframes (1h, 4h) for trend context and lower (5m, 15m) for entries.
Pairing: Combine with RSI, MACD, or volume indicators for confirmation.
Backtesting: Test settings on historical data for asset-specific optimization.
Overlaps: Watch for histogram overlaps to identify support, resistance, or reversals.
Simulated Performance
Trending Markets: Histogram stays above/below zero, with overlaps at retracements for entries.
Range-Bound Markets: Oscillates around zero; overlaps signal reversals in red regimes.
Volatile Markets: Quantum tunneling ensures quick reactions, with filters reducing noise.
Elevate your trading with QuantumSync Pulse—a sophisticated tool that adapts to the market’s rhythm and your unique style.

RSI Forecast [Titans_Invest]RSI Forecast
Introducing one of the most impressive RSI indicators ever created – arguably the best on TradingView, and potentially the best in the world.
RSI Forecast is a visionary evolution of the classic RSI, merging powerful customization with groundbreaking predictive capabilities. While preserving the core principles of traditional RSI, it takes analysis to the next level by allowing users to anticipate potential future RSI movements.
Real-Time RSI Forecasting:
For the first time ever, an RSI indicator integrates linear regression using the least squares method to accurately forecast the future behavior of the RSI. This innovation empowers traders to stay one step ahead of the market with forward-looking insight.
Highly Customizable:
Easily adapt the indicator to your personal trading style. Fine-tune a variety of parameters to generate signals perfectly aligned with your strategy.
Innovative, Unique, and Powerful:
This is the world’s first RSI Forecast to apply this predictive approach using least squares linear regression. A truly elite-level tool designed for traders who want a real edge in the market.
⯁ SCIENTIFIC BASIS LINEAR REGRESSION
Linear Regression is a fundamental method of statistics and machine learning, used to model the relationship between a dependent variable y and one or more independent variables 𝑥.
The general formula for a simple linear regression is given by:
y = β₀ + β₁x + ε
Where:
y = is the predicted variable (e.g. future value of RSI)
x = is the explanatory variable (e.g. time or bar index)
β0 = is the intercept (value of 𝑦 when 𝑥 = 0)
𝛽1 = is the slope of the line (rate of change)
ε = is the random error term
The goal is to estimate the coefficients 𝛽0 and 𝛽1 so as to minimize the sum of the squared errors — the so-called Random Error Method Least Squares.
⯁ LEAST SQUARES ESTIMATION
To minimize the error between predicted and observed values, we use the following formulas:
β₁ = /
β₀ = ȳ - β₁x̄
Where:
∑ = sum
x̄ = mean of x
ȳ = mean of y
x_i, y_i = individual values of the variables.
Where:
x_i and y_i are the means of the independent and dependent variables, respectively.
i ranges from 1 to n, the number of observations.
These equations guarantee the best linear unbiased estimator, according to the Gauss-Markov theorem, assuming homoscedasticity and linearity.
⯁ LINEAR REGRESSION IN MACHINE LEARNING
Linear regression is one of the cornerstones of supervised learning. Its simplicity and ability to generate accurate quantitative predictions make it essential in AI systems, predictive algorithms, time series analysis, and automated trading strategies.
By applying this model to the RSI, you are literally putting artificial intelligence at the heart of a classic indicator, bringing a new dimension to technical analysis.
⯁ VISUAL INTERPRETATION
Imagine an RSI time series like this:
Time →
RSI →
The regression line will smooth these values and extend them n periods into the future, creating a predicted trajectory based on the historical moment. This line becomes the predicted RSI, which can be crossed with the actual RSI to generate more intelligent signals.
⯁ SUMMARY OF SCIENTIFIC CONCEPTS USED
Linear Regression Models the relationship between variables using a straight line.
Least Squares Minimizes the sum of squared errors between prediction and reality.
Time Series Forecasting Estimates future values based on historical data.
Supervised Learning Trains models to predict outputs from known inputs.
Statistical Smoothing Reduces noise and reveals underlying trends.
⯁ WHY THIS INDICATOR IS REVOLUTIONARY
Scientifically-based: Based on statistical theory and mathematical inference.
Unprecedented: First public RSI with least squares predictive modeling.
Intelligent: Built with machine learning logic.
Practical: Generates forward-thinking signals.
Customizable: Flexible for any trading strategy.
⯁ CONCLUSION
By combining RSI with linear regression, this indicator allows a trader to predict market momentum, not just follow it.
RSI Forecast is not just an indicator — it is a scientific breakthrough in technical analysis technology.
⯁ Example of simple linear regression, which has one independent variable:
⯁ In linear regression, observations ( red ) are considered to be the result of random deviations ( green ) from an underlying relationship ( blue ) between a dependent variable ( y ) and an independent variable ( x ).
⯁ Visualizing heteroscedasticity in a scatterplot against 100 random fitted values using Matlab:
⯁ The data sets in the Anscombe's quartet are designed to have approximately the same linear regression line (as well as nearly identical means, standard deviations, and correlations) but are graphically very different. This illustrates the pitfalls of relying solely on a fitted model to understand the relationship between variables.
⯁ The result of fitting a set of data points with a quadratic function:
_______________________________________________________________________
🥇 This is the world’s first RSI indicator with: Linear Regression for Forecasting 🥇_______________________________________________________________________
_________________________________________________
🔮 Linear Regression: PineScript Technical Parameters 🔮
_________________________________________________
Forecast Types:
• Flat: Assumes prices will remain the same.
• Linreg: Makes a 'Linear Regression' forecast for n periods.
Technical Information:
ta.linreg (built-in function)
Linear regression curve. A line that best fits the specified prices over a user-defined time period. It is calculated using the least squares method. The result of this function is calculated using the formula: linreg = intercept + slope * (length - 1 - offset), where intercept and slope are the values calculated using the least squares method on the source series.
Syntax:
• Function: ta.linreg()
Parameters:
• source: Source price series.
• length: Number of bars (period).
• offset: Offset.
• return: Linear regression curve.
This function has been cleverly applied to the RSI, making it capable of projecting future values based on past statistical trends.
______________________________________________________
______________________________________________________
⯁ WHAT IS THE RSI❓
The Relative Strength Index (RSI) is a technical analysis indicator developed by J. Welles Wilder. It measures the magnitude of recent price movements to evaluate overbought or oversold conditions in a market. The RSI is an oscillator that ranges from 0 to 100 and is commonly used to identify potential reversal points, as well as the strength of a trend.
⯁ HOW TO USE THE RSI❓
The RSI is calculated based on average gains and losses over a specified period (usually 14 periods). It is plotted on a scale from 0 to 100 and includes three main zones:
• Overbought: When the RSI is above 70, indicating that the asset may be overbought.
• Oversold: When the RSI is below 30, indicating that the asset may be oversold.
• Neutral Zone: Between 30 and 70, where there is no clear signal of overbought or oversold conditions.
______________________________________________________
______________________________________________________
⯁ ENTRY CONDITIONS
The conditions below are fully flexible and allow for complete customization of the signal.
______________________________________________________
______________________________________________________
🔹 CONDITIONS TO BUY 📈
______________________________________________________
• Signal Validity: The signal will remain valid for X bars .
• Signal Sequence: Configurable as AND or OR .
📈 RSI Conditions:
🔹 RSI > Upper
🔹 RSI < Upper
🔹 RSI > Lower
🔹 RSI < Lower
🔹 RSI > Middle
🔹 RSI < Middle
🔹 RSI > MA
🔹 RSI < MA
📈 MA Conditions:
🔹 MA > Upper
🔹 MA < Upper
🔹 MA > Lower
🔹 MA < Lower
📈 Crossovers:
🔹 RSI (Crossover) Upper
🔹 RSI (Crossunder) Upper
🔹 RSI (Crossover) Lower
🔹 RSI (Crossunder) Lower
🔹 RSI (Crossover) Middle
🔹 RSI (Crossunder) Middle
🔹 RSI (Crossover) MA
🔹 RSI (Crossunder) MA
🔹 MA (Crossover) Upper
🔹 MA (Crossunder) Upper
🔹 MA (Crossover) Lower
🔹 MA (Crossunder) Lower
📈 RSI Divergences:
🔹 RSI Divergence Bull
🔹 RSI Divergence Bear
📈 RSI Forecast:
🔮 RSI (Crossover) MA Forecast
🔮 RSI (Crossunder) MA Forecast
______________________________________________________
______________________________________________________
🔸 CONDITIONS TO SELL 📉
______________________________________________________
• Signal Validity: The signal will remain valid for X bars .
• Signal Sequence: Configurable as AND or OR .
📉 RSI Conditions:
🔸 RSI > Upper
🔸 RSI < Upper
🔸 RSI > Lower
🔸 RSI < Lower
🔸 RSI > Middle
🔸 RSI < Middle
🔸 RSI > MA
🔸 RSI < MA
📉 MA Conditions:
🔸 MA > Upper
🔸 MA < Upper
🔸 MA > Lower
🔸 MA < Lower
📉 Crossovers:
🔸 RSI (Crossover) Upper
🔸 RSI (Crossunder) Upper
🔸 RSI (Crossover) Lower
🔸 RSI (Crossunder) Lower
🔸 RSI (Crossover) Middle
🔸 RSI (Crossunder) Middle
🔸 RSI (Crossover) MA
🔸 RSI (Crossunder) MA
🔸 MA (Crossover) Upper
🔸 MA (Crossunder) Upper
🔸 MA (Crossover) Lower
🔸 MA (Crossunder) Lower
📉 RSI Divergences:
🔸 RSI Divergence Bull
🔸 RSI Divergence Bear
📉 RSI Forecast:
🔮 RSI (Crossover) MA Forecast
🔮 RSI (Crossunder) MA Forecast
______________________________________________________
______________________________________________________
🤖 AUTOMATION 🤖
• You can automate the BUY and SELL signals of this indicator.
______________________________________________________
______________________________________________________
⯁ UNIQUE FEATURES
______________________________________________________
Linear Regression: (Forecast)
Signal Validity: The signal will remain valid for X bars
Signal Sequence: Configurable as AND/OR
Condition Table: BUY/SELL
Condition Labels: BUY/SELL
Plot Labels in the Graph Above: BUY/SELL
Automate and Monitor Signals/Alerts: BUY/SELL
Linear Regression (Forecast)
Signal Validity: The signal will remain valid for X bars
Signal Sequence: Configurable as AND/OR
Condition Table: BUY/SELL
Condition Labels: BUY/SELL
Plot Labels in the Graph Above: BUY/SELL
Automate and Monitor Signals/Alerts: BUY/SELL
______________________________________________________
📜 SCRIPT : RSI Forecast
🎴 Art by : @Titans_Invest & @DiFlip
👨💻 Dev by : @Titans_Invest & @DiFlip
🎑 Titans Invest — The Wizards Without Gloves 🧤
✨ Enjoy!
______________________________________________________
o Mission 🗺
• Inspire Traders to manifest Magic in the Market.
o Vision 𐓏
• To elevate collective Energy 𐓷𐓏

RSI Full [Titans_Invest]RSI Full
One of the most complete RSI indicators on the market.
While maintaining the classic RSI foundation, our indicator integrates multiple entry conditions to generate more accurate buy and sell signals.
All conditions are fully configurable, allowing complete customization to fit your trading strategy.
⯁ WHAT IS THE RSI❓
The Relative Strength Index (RSI) is a technical analysis indicator developed by J. Welles Wilder. It measures the magnitude of recent price movements to evaluate overbought or oversold conditions in a market. The RSI is an oscillator that ranges from 0 to 100 and is commonly used to identify potential reversal points, as well as the strength of a trend.
⯁ HOW TO USE THE RSI❓
The RSI is calculated based on average gains and losses over a specified period (usually 14 periods). It is plotted on a scale from 0 to 100 and includes three main zones:
Overbought: When the RSI is above 70, indicating that the asset may be overbought.
Oversold: When the RSI is below 30, indicating that the asset may be oversold.
Neutral Zone: Between 30 and 70, where there is no clear signal of overbought or oversold conditions.
⯁ ENTRY CONDITIONS
The conditions below are fully flexible and allow for complete customization of the signal.
______________________________________________________
🔹 CONDITIONS TO BUY 📈
______________________________________________________
• Signal Validity: The signal will remain valid for X bars .
• Signal Sequence: Configurable as AND/OR .
📈 RSI Conditions:
🔹 RSI > Upper
🔹 RSI < Upper
🔹 RSI > Lower
🔹 RSI < Lower
🔹 RSI > Middle
🔹 RSI < Middle
🔹 RSI > MA
🔹 RSI < MA
📈 MA Conditions:
🔹 MA > Upper
🔹 MA < Upper
🔹 MA > Lower
🔹 MA < Lower
📈 Crossovers:
🔹 RSI (Crossover) Upper
🔹 RSI (Crossunder) Upper
🔹 RSI (Crossover) Lower
🔹 RSI (Crossunder) Lower
🔹 RSI (Crossover) Middle
🔹 RSI (Crossunder) Middle
🔹 RSI (Crossover) MA
🔹 RSI (Crossunder) MA
🔹 MA (Crossover) Upper
🔹 MA (Crossunder) Upper
🔹 MA (Crossover) Lower
🔹 MA (Crossunder) Lower
📈 RSI Divergences:
🔹 RSI Divergence Bull
🔹 RSI Divergence Bear
______________________________________________________
______________________________________________________
🔸 CONDITIONS TO SELL 📉
______________________________________________________
• Signal Validity: The signal will remain valid for X bars .
• Signal Sequence: Configurable as AND/OR .
📉 RSI Conditions:
🔸 RSI > Upper
🔸 RSI < Upper
🔸 RSI > Lower
🔸 RSI < Lower
🔸 RSI > Middle
🔸 RSI < Middle
🔸 RSI > MA
🔸 RSI < MA
📉 MA Conditions:
🔸 MA > Upper
🔸 MA < Upper
🔸 MA > Lower
🔸 MA < Lower
📉 Crossovers:
🔸 RSI (Crossover) Upper
🔸 RSI (Crossunder) Upper
🔸 RSI (Crossover) Lower
🔸 RSI (Crossunder) Lower
🔸 RSI (Crossover) Middle
🔸 RSI (Crossunder) Middle
🔸 RSI (Crossover) MA
🔸 RSI (Crossunder) MA
🔸 MA (Crossover) Upper
🔸 MA (Crossunder) Upper
🔸 MA (Crossover) Lower
🔸 MA (Crossunder) Lower
📉 RSI Divergences:
🔸 RSI Divergence Bull
🔸 RSI Divergence Bear
______________________________________________________
______________________________________________________
🤖 AUTOMATION 🤖
• You can automate the BUY and SELL signals of this indicator.
______________________________________________________
______________________________________________________
⯁ UNIQUE FEATURES
______________________________________________________
Signal Validity: The signal will remain valid for X bars
Signal Sequence: Configurable as AND/OR
Condition Table: BUY/SELL
Condition Labels: BUY/SELL
Plot Labels in the Graph Above: BUY/SELL
Automate and Monitor Signals/Alerts: BUY/SELL
Signal Validity: The signal will remain valid for X bars
Signal Sequence: Configurable as AND/OR
Condition Table: BUY/SELL
Condition Labels: BUY/SELL
Plot Labels in the Graph Above: BUY/SELL
Automate and Monitor Signals/Alerts: BUY/SELL
______________________________________________________
📜 SCRIPT : RSI Full
🎴 Art by : @Titans_Invest & @DiFlip
👨💻 Dev by : @Titans_Invest & @DiFlip
🎑 Titans Invest — The Wizards Without Gloves 🧤
✨ Enjoy the Spell!
______________________________________________________
o Mission 🗺
• Inspire Traders to manifest Magic in the Market.
o Vision 𐓏
• To elevate collective Energy 𐓷𐓏

TrendTwisterV1.5 (Forex Ready + Indicators)A Precision Trend-Following TradingView Strategy for Forex**
HullShiftFX is a Pine Script strategy for TradingView that combines the power of the **Hull Moving Average (HMA)** and a **shifted Exponential Moving Average (EMA)** with multi-layered momentum filters including **RSI** and **dual Stochastic Oscillators**.
It’s designed for traders looking to catch high-probability breakouts with tight risk management and visual clarity.
Chart settings:
1. Select "Auto - Fits data to screen"
2. Please Select "Scale Price Chart Only" (To make the chart not squished)
### ✅ Entry Conditions
**Long Position:**
- Price closes above the 12-period Hull Moving Average.
- Price closes above the 5-period EMA shifted forward by 2 bars.
- RSI is above 50.
- Stochastic Oscillator (12,3,3) %K is above 50.
- Stochastic Oscillator (5,3,3) %K is above 50.
- Hull MA crosses above the shifted EMA.
**Short Position:**
- Price closes below the 12-period Hull Moving Average.
- Price closes below the 5-period EMA shifted forward by 2 bars.
- RSI is below 50.
- Stochastic Oscillator (12,3,3) %K is below 50.
- Stochastic Oscillator (5,3,3) %K is below 50.
- Hull MA crosses below the shifted EMA.
---
## 📉 Risk Management
- **Stop Loss:** Set at the low (for long) or high (for short) of the previous 2 candles.
- **Take Profit:** Calculated at a risk/reward ratio of **1.65x** the stop loss distance.
---
## 📊 Indicators Used
- **Hull Moving Average (12)**
- **Exponential Moving Average (5) **
- **Relative Strength Index (14)**
- **Stochastic Oscillators:**
- %K (12,3,3)
- %K (5,3,3)

StatPivot- Dynamic Range Analyzer - indicator [PresentTrading]Hello everyone! In the following few open scripts, I would like to share various statistical tools that benefit trading. For this time, it is a powerful indicator called StatPivot- Dynamic Range Analyzer that brings a whole new dimension to your technical analysis toolkit.
This tool goes beyond traditional pivot point analysis by providing comprehensive statistical insights about price movements, helping you identify high-probability trading opportunities based on historical data patterns rather than subjective interpretations. Whether you're a day trader, swing trader, or position trader, StatPivot's real-time percentile rankings give you a statistical edge in understanding exactly where current price action stands within historical contexts.
Welcome to share your opinions! Looking forward to sharing the next tool soon!
█ Introduction and How it is Different
StatPivot is an advanced technical analysis tool that revolutionizes retracement analysis. Unlike traditional pivot indicators that only show static support/resistance levels, StatPivot delivers dynamic statistical insights based on historical pivot patterns.
Its key innovation is real-time percentile calculation - while conventional tools require new pivot formations before updating (often too late for trading decisions), StatPivot continuously analyzes where current price stands within historical retracement distributions.
Furthermore, StatPivot provides comprehensive statistical metrics including mean, median, standard deviation, and percentile distributions of price movements, giving traders a probabilistic edge by revealing which price levels represent statistically significant zones for potential reversals or continuations. By transforming raw price data into statistical insights, StatPivot helps traders move beyond subjective price analysis to evidence-based decision making.
█ Strategy, How it Works: Detailed Explanation
🔶 Pivot Point Detection and Analysis
The core of StatPivot's functionality begins with identifying significant pivot points in the price structure. Using the parameters left and right, the indicator locates pivot highs and lows by examining a specified number of bars to the left and right of each potential pivot point:
Copyp_low = ta.pivotlow(low, left, right)
p_high = ta.pivothigh(high, left, right)
For a point to qualify as a pivot low, it must have left higher lows to its left and right higher lows to its right. Similarly, a pivot high must have left lower highs to its left and right lower highs to its right. This approach ensures that only significant turning points are recognized.
🔶 Percentage Change Calculation
Once pivot points are identified, StatPivot calculates the percentage changes between consecutive pivot points:
For drops (when a pivot low is lower than the previous pivot low):
CopydropPercent = (previous_pivot_low - current_pivot_low) / previous_pivot_low * 100
For rises (when a pivot high is higher than the previous pivot high):
CopyrisePercent = (current_pivot_high - previous_pivot_high) / previous_pivot_high * 100
These calculations quantify the magnitude of each market swing, allowing for statistical analysis of historical price movements.
🔶 Statistical Distribution Analysis
StatPivot computes comprehensive statistics on the historical distribution of drops and rises:
Average (Mean): The arithmetic mean of all recorded percentage changes
CopyavgDrop = array.avg(dropValues)
Median: The middle value when all percentage changes are arranged in order
CopymedianDrop = array.median(dropValues)
Standard Deviation: Measures the dispersion of percentage changes from the average
CopystdDevDrop = array.stdev(dropValues)
Percentiles (25th, 75th): Values below which 25% and 75% of observations fall
Copyq1 = array.get(sorted, math.floor(cnt * 0.25))
q3 = array.get(sorted, math.floor(cnt * 0.75))
VaR95: The maximum expected percentage drop with 95% confidence
Copyvar95D = array.get(sortedD, math.floor(nD * 0.95))
Coefficient of Variation (CV): Measures relative variability
CopycvD = stdDevDrop / avgDrop
These statistics provide a comprehensive view of market behavior, enabling traders to understand the typical ranges and extreme moves.
🔶 Real-time Percentile Ranking
StatPivot's most innovative feature is its real-time percentile calculation. For each current price, it calculates:
The percentage drop from the latest pivot high:
CopycurrentDropPct = (latestPivotHigh - close) / latestPivotHigh * 100
The percentage rise from the latest pivot low:
CopycurrentRisePct = (close - latestPivotLow) / latestPivotLow * 100
The percentile ranks of these values within the historical distribution:
CopyrealtimeDropRank = (count of historical drops <= currentDropPct) / total drops * 100
This calculation reveals exactly where the current price movement stands in relation to all historical movements, providing crucial context for decision-making.
🔶 Cluster Analysis
To identify the most common retracement zones, StatPivot performs a cluster analysis by dividing the range of historical drops into five equal intervals:
CopyrangeSize = maxVal - minVal
For each interval boundary:
Copyboundaries = minVal + rangeSize * i / 5
By counting the number of observations in each interval, the indicator identifies the most frequently occurring retracement zones, which often serve as significant support or resistance areas.
🔶 Expected Price Targets
Using the statistical data, StatPivot calculates expected price targets:
CopytargetBuyPrice = close * (1 - avgDrop / 100)
targetSellPrice = close * (1 + avgRise / 100)
These targets represent statistically probable price levels for potential entries and exits based on the average historical behavior of the market.
█ Trade Direction
StatPivot functions as an analytical tool rather than a direct trading signal generator, providing statistical insights that can be applied to various trading strategies. However, the data it generates can be interpreted for different trade directions:
For Long Trades:
Entry considerations: Look for price drops that reach the 70-80th percentile range in the historical distribution, suggesting a statistically significant retracement
Target setting: Use the Expected Sell price or consider the average rise percentage as a reasonable target
Risk management: Set stop losses below recent pivot lows or at a distance related to the statistical volatility (standard deviation)
For Short Trades:
Entry considerations: Look for price rises that reach the 70-80th percentile range, indicating an unusual extension
Target setting: Use the Expected Buy price or average drop percentage as a target
Risk management: Set stop losses above recent pivot highs or based on statistical measures of volatility
For Range Trading:
Use the most common drop and rise clusters to identify probable reversal zones
Trade bounces between these statistically significant levels
For Trend Following:
Confirm trend strength by analyzing consecutive higher pivot lows (uptrend) or lower pivot highs (downtrend)
Use lower percentile retracements (20-30th percentile) as entry opportunities in established trends
█ Usage
StatPivot offers multiple ways to integrate its statistical insights into your trading workflow:
Statistical Table Analysis: Review the comprehensive statistics displayed in the data table to understand the market's behavior. Pay particular attention to:
Average drop and rise percentages to set reasonable expectations
Standard deviation to gauge volatility
VaR95 for risk assessment
Real-time Percentile Monitoring: Watch the real-time percentile display to see where the current price movement stands within the historical distribution. This can help identify:
Extreme movements (90th+ percentile) that might indicate reversal opportunities
Typical retracements (40-60th percentile) that might continue further
Shallow pullbacks (10-30th percentile) that might represent continuation opportunities in trends
Support and Resistance Identification: Utilize the plotted pivot points as key support and resistance levels, especially when they align with statistically significant percentile ranges.
Target Price Setting: Use the expected buy and sell prices calculated from historical averages as initial targets for your trades.
Risk Management: Apply the statistical measurements like standard deviation and VaR95 to set appropriate stop loss levels that account for the market's historical volatility.
Pattern Recognition: Over time, learn to recognize when certain percentile levels consistently lead to reversals or continuations in your specific market, and develop personalized strategies based on these observations.
█ Default Settings
The default settings of StatPivot have been carefully calibrated to provide reliable statistical analysis across a variety of markets and timeframes, but understanding their effects allows for optimal customization:
Left Bars (30) and Right Bars (30): These parameters determine how pivot points are identified. With both set to 30 by default:
A pivot low must be the lowest point among 30 bars to its left and 30 bars to its right
A pivot high must be the highest point among 30 bars to its left and 30 bars to its right
Effect on performance: Larger values create fewer but more significant pivot points, reducing noise but potentially missing important market structures. Smaller values generate more pivot points, capturing more nuanced movements but potentially including noise.
Table Position (Top Right): Determines where the statistical data table appears on the chart.
Effect on performance: No impact on analytical performance, purely a visual preference.
Show Distribution Histogram (False): Controls whether the distribution histogram of drop percentages is displayed.
Effect on performance: Enabling this provides visual insight into the distribution of retracements but can clutter the chart.
Show Real-time Percentile (True): Toggles the display of real-time percentile rankings.
Effect on performance: A critical setting that enables the dynamic analysis of current price movements. Disabling this removes one of the key advantages of the indicator.
Real-time Percentile Display Mode (Label): Chooses between label display or indicator line for percentile rankings.
Effect on performance: Labels provide precise information at the current price point, while indicator lines show the evolution of percentile rankings over time.
Advanced Considerations for Settings Optimization:
Timeframe Adjustment: Higher timeframes generally benefit from larger Left/Right values to identify truly significant pivots, while lower timeframes may require smaller values to capture shorter-term swings.
Volatility-Based Tuning: In highly volatile markets, consider increasing the Left/Right values to filter out noise. In less volatile conditions, lower values can help identify more potential entry and exit points.
Market-Specific Optimization: Different markets (forex, stocks, commodities) display different retracement patterns. Monitor the statistics table to see if your market typically shows larger or smaller retracements than the current settings are optimized for.
Trading Style Alignment: Adjust the settings to match your trading timeframe. Day traders might prefer settings that identify shorter-term pivots (smaller Left/Right values), while swing traders benefit from more significant pivots (larger Left/Right values).
By understanding how these settings affect the analysis and customizing them to your specific market and trading style, you can maximize the effectiveness of StatPivot as a powerful statistical tool for identifying high-probability trading opportunities.

HTC peppermint_07 CCI w signal + s&r RSI
This CCI version enhances the traditional Commodity Channel Index (CCI) by integrating a dynamically calculated Relative Strength Index (RSI) that acts as support and resistance as shown in the screenshot, it can add as a confirmation to the divergence found in the CCI.
Key Features:
Enhanced CCI: The primary plot (black line but customizable) represents the standard CCI, providing insight into price momentum and potential overbought/oversold conditions.
Dynamic RSI Support/Resistance: The upper and lower bands (medium cyan line) are derived from a smoothed RSI, dynamically adjusting to the current market volatility. These bands serve as potential support and resistance levels for the CCI as additional confirmation for the divergence.
Overbought/Oversold Zones: The traditional overbought (+100) and oversold (-100) levels for CCI are marked with horizontal dotted lines.
Benefits:
Improved Entry/Exit Signals: Combining CCI with dynamic RSI support/resistance may offer more precise trading signals compared to using CCI alone.
Dynamic Adaptation: The RSI-based bands adapt to changing market conditions, potentially providing more relevant support and resistance levels.
Divergence Confirmation: dynamic s&r RSI adds confluence to potential trend reversals identified by the CCI.
Potential Usage:
Traders might use this indicator to:
Identify potential overbought/oversold conditions using the CCI and its relationship to the dynamic RSI bands.
Look for breakouts beyond the dynamic support/resistance levels as potential entry points.
Confirm potential trend reversals using RSI divergence (cyan and red label above divergence) signals.
Further Development Considerations:
Customizable Parameters: Allowing users to adjust the CCI length, RSI periods, and smoothing factors would enhance flexibility.
Alert Conditions: Adding alerts for breakouts, overbought/oversold conditions, and divergence signals would improve usability.
Backtesting: Thoroughly backtesting the indicator's performance across different assets and timeframes is essential before using it for live trading.
DISCLAIMER: !!
indicator is a custom technical analysis tool designed for educational and informational purposes only. It should not be construed as financial advice or a recommendation to buy or sell any security. Trading involves substantial risk of loss and may not be suitable for all investors.
Key Points to Consider:
No Guarantee of Profitability: The indicator's past performance is not indicative of future results. No trading strategy can guarantee profits or eliminate the risk of losses. You could lose some or all of your investment.
Use at Your Own Risk: Use of this indicator is solely at your own discretion and risk. You are responsible for your trading decisions. The developers and distributors of this indicator are not liable for any losses incurred as a result of using it.
Not Financial Advice: This indicator does not provide financial advice. Consult with a qualified financial advisor before making any investment decisions.
Backtesting Limitations: Backtested results, if presented, should be viewed with caution. Past performance may not reflect future results due to various factors, including changing market conditions and the limitations of backtesting methodologies.
Indicator Limitations: Technical indicators, including this one, are not perfect. They can generate false signals, and their effectiveness can vary depending on market conditions and the specific parameters used.
Parameter Optimization: Optimizing indicator parameters for past performance can lead to overfitting, which may not translate to future profitability.
No Warranty: The indicator is provided "as is" without any warranty of any kind, either express or implied, including but not limited to warranties of merchantability, fitness for a particular purpose, or non-infringement.
Changes and Updates: The developers may make changes or updates to the indicator without notice.
By using the "HTC peppermint_07 CCI w signal + s&r RSI" indicator, you acknowledge and agree to the terms of this disclaimer. If you do not agree with these terms, do not use the indicator.

Single Candle Entry with Multi-Timeframe [Wang Indicators]
Single candle entry
Overview : The "Single Candle Entry Model" indicator is designed to help traders through a simple yet effective trading strategy. This indicator automatically detects candles that encompass both the high and low of the previous candle, creating key price zones for potential market entries.
- This indicator was developed with the help of @DaveTeaches -
How does it works ?
Detects when a candle trade above the high and below the low of the previous candle
When it occur, the indicator write "SCE" on the candle
The text will be in different color if its bearish or bullish (customizable by user)
Higher Timeframes
Users can enable up to 3 HTF SCE detection to enhance multi timeframe analysis.
Users can select which timeframe he want to use
Boxes will be displayed around High time frame SCE to highlight the HTF candle.
As regular SCE, the indicator will write "SCE" above or under the box
How does it helps users ?
Once the SCE is created, it can be used as a zone.
Levels (30, 50 and 70%) are displayed
Users can customize their apparence as they see fit
The 30 - 50 - 70 levels are support/resistance that the price tend to bounce of off
You might find some success looking for an entry inside the zone at a level if price gives further confirmations such as a lower time frame flip or using other indicators
Alert can be setup on any timeframe
Alternative Shark Harmonic Pattern [TradingFinder] ALT Shark🔵 Introduction
The Alternative Shark harmonic pattern, similar to the original Shark harmonic pattern introduced by Scott Carney, is a powerful tool in technical analysis used to identify potential reversal zones (PRZ) in financial markets.
These harmonic patterns help traders spot key turning points in market trends by relying on specific Fibonacci ratios. The Alternative Shark pattern is particularly unique due to its distinct Fibonacci retracements within the PRZ, which differentiate it from the standard Shark pattern and provide traders with more precise entry and exit signals.
By focusing on harmonic patterns and utilizing tools like the Harmonic Pattern Indicator, traders can easily identify both the Shark and Alternative Shark patterns, making it easier to find PRZs and capture potential trend reversals. This enhanced detection of potential reversal zones allows for better trade optimization and improved risk management.
Incorporating the Alternative Shark pattern into your technical analysis strategy enables you to enhance your trading performance by identifying market reversals with greater accuracy, improving the timing of your trades, and reducing risks associated with sudden market shifts.
🟣 Understanding the Types of Alternative Shark Pattern
The Alternative Shark harmonic pattern, much like the original Shark pattern, forms at the end of price trends and is divided into two types: Bullish and Bearish Alternative Shark patterns.
Bullish Alternative Shark Pattern :
This pattern typically forms at the end of a downtrend, signaling a potential reversal into an uptrend. Traders can use this pattern to identify buy entry points. The image below illustrates the core components of the Bullish Alternative Shark Pattern.
Bearish Alternative Shark Pattern :
Conversely, the Bearish Alternative Shark Pattern appears at the end of an uptrend and signals a potential reversal to a downtrend. This variation allows traders to adjust their strategies for selling. The image below outlines the characteristics of the Bearish Alternative Shark Pattern.
🟣 Differences Between Shark and Alternative Shark Patterns
Although both patterns share similar structures and serve as tools for identifying price reversals, there is one key difference between them :
AB to XA Ratio : In the Shark pattern, the AB leg retraces between 1 and 2 of the XA leg, whereas in the Alternative Shark pattern, this retracement is reduced to 0.382 to 0.618 of the XA leg. This difference in the retracement ratio leads to slightly different trade signals and can affect the timing of entry and exit points.
Other ratios and reversal signals remain consistent between the two patterns, but this difference in the AB to XA ratio provides traders with more nuanced opportunities to optimize their trades.
🔵 How to Use
🟣 Trading with the Bullish Alternative Shark Pattern
The Bullish Alternative Shark Pattern functions similarly to the traditional Bullish Shark, acting as a reversal pattern that helps traders recognize the end of a downtrend and the beginning of an uptrend.
The main distinction lies in the reduced AB retracement, which can offer more refined entry signals. Once the pattern completes, traders can look to enter buy trades and place a stop-loss below the lowest point of the pattern for effective risk management.
🟣 Trading with the Bearish Alternative Shark Pattern
The Bearish Alternative Shark Pattern operates much like the Bearish Shark pattern but with the adjusted AB to XA ratio. This difference provides traders with unique entry points for sell trades. Once the pattern is fully identified, traders can enter short positions, placing a stop-loss above the highest point of the pattern to safeguard against market fluctuations.
🔵 Setting
🟣 Logical Setting
ZigZag Pivot Period : You can adjust the period so that the harmonic patterns are adjusted according to the pivot period you want. This factor is the most important parameter in pattern recognition.
Show Valid Forma t: If this parameter is on "On" mode, only patterns will be displayed that they have exact format and no noise can be seen in them. If "Off" is, the patterns displayed that maybe are noisy and do not exactly correspond to the original pattern.
Show Formation Last Pivot Confirm : if Turned on, you can see this ability of patterns when their last pivot is formed. If this feature is off, it will see the patterns as soon as they are formed. The advantage of this option being clear is less formation of fielded patterns, and it is accompanied by the latest pattern seeing and a sharp reduction in reward to risk.
Period of Formation Last Pivot : Using this parameter you can determine that the last pivot is based on Pivot period.
🟣 Genaral Setting
Show : Enter "On" to display the template and "Off" to not display the template.
Color : Enter the desired color to draw the pattern in this parameter.
LineWidth : You can enter the number 1 or numbers higher than one to adjust the thickness of the drawing lines. This number must be an integer and increases with increasing thickness.
LabelSize : You can adjust the size of the labels by using the "size.auto", "size.tiny", "size.smal", "size.normal", "size.large" or "size.huge" entries.
🟣 Alert Setting
Alert : On / Off
Message Frequency : This string parameter defines the announcement frequency. Choices include: "All" (activates the alert every time the function is called), "Once Per Bar" (activates the alert only on the first call within the bar), and "Once Per Bar Close" (the alert is activated only by a call at the last script execution of the real-time bar upon closing). The default setting is "Once per Bar".
Show Alert Time by Time Zone : The date, hour, and minute you receive in alert messages can be based on any time zone you choose. For example, if you want New York time, you should enter "UTC-4". This input is set to the time zone "UTC" by default.
🔵 Conclusion
The Alternative Shark harmonic pattern, despite its structural similarity to the traditional Shark pattern, introduces a key difference in the AB to XA ratio, making it a valuable addition to the trader’s toolkit. This subtle variation enables traders to pinpoint reversal points with greater accuracy and fine-tune their trading strategies.
As with any technical pattern, it is crucial to use the Alternative Shark pattern in combination with other technical indicators and strong risk management practices. Incorporating this pattern into a broader trading strategy can help traders enhance their ability to detect and capitalize on market reversals more effectively.

Multi-Step FlexiSuperTrend - Indicator [presentTrading]This version of the indicator is built upon the foundation of a strategy version published earlier. However, this indicator version focuses on providing visual insights and alerts for traders, rather than executing trades. This one is mostly for @thorcmt.
█ Introduction and How it is Different
The **Multi-Step FlexiSuperTrend Indicator** is a versatile tool designed to provide traders with a highly customizable and flexible approach to trend analysis. Unlike traditional supertrend indicators, which focus on a single factor or threshold, the **FlexiSuperTrend** allows users to define multiple levels of take-profit targets and incorporate different trend normalization methods.
It comes with several advanced customization features, including multi-step take profits, deviation plotting, and trend normalization, making it suitable for both novice and expert traders.
BTCUSD 6hr Performance
█ Strategy, How It Works: Detailed Explanation
The **Multi-Step FlexiSuperTrend** works by calculating a supertrend based on multiple factors and incorporating oscillations from trend deviations. Here’s a breakdown of how it functions:
🔶 SuperTrend Calculation
At the heart of the indicator is the SuperTrend formula, which dynamically adjusts based on price movements.
🔶 Normalization of Deviations
To enhance accuracy, the **FlexiSuperTrend** calculates multiple deviations from the trend and normalizes them.
🔶 Multi-Step Take Profit Levels
The indicator allows setting up to three take profit levels, which are displayed via price level alerts. lows traders to exit part of their position at various profit intervals.
For more detail, please check the strategy version - Multi-Step-FlexiSuperTrend-Strategy:
and 'FlexiSuperTrend-Strategy'
█ Trade Direction
The **Multi-Step FlexiSuperTrend Indicator** supports both long and short trade directions.
This flexibility allows traders to adapt to trending, volatile, or sideways markets.
█ Usage
To use the **FlexiSuperTrend Indicator**, traders can set up their preferences for the following key features:
- **Trading Direction**: Choose whether to focus on long, short, or both signals.
- **Indicator Source**: The price source to calculate the trend (e.g., close, hl2).
- **Indicator Length**: The number of periods to calculate the ATR and trend (the larger the value, the smoother the trend).
- **Starting and Increment Factor**: These adjust how reactive the trend is to price movements. The starting factor dictates how far the initial trend band is from the price, and the increment factor adjusts subsequent trend deviations.
The indicator then displays buy and sell signals on the chart, along with alerts for each take-profit level.
Local picture
█ Default Settings
The default settings of the **Multi-Step FlexiSuperTrend** are carefully designed to provide an optimal balance between sensitivity and accuracy. Let’s examine these default parameters and their effect on performance:
🔶 Indicator Length (Default: 10)
The **Indicator Length** determines the lookback period for the ATR calculation. A smaller value makes the indicator more reactive to price changes, but may generate more false signals. A longer length smooths the trend and reduces noise but may delay signals.
Effect on performance: Shorter lengths perform better in volatile markets, while longer lengths excel in trending markets.
🔶 Starting Factor (Default: 0.618)
This factor adjusts the starting distance of the SuperTrend from the current price. The smaller the starting factor, the closer the trend is to the price, making it more sensitive. Conversely, a larger factor allows more distance, reducing sensitivity but filtering out false signals.
Effect on performance: A smaller factor provides quicker signals but can lead to frequent false positives. A larger factor generates fewer but more reliable signals.
🔶 Increment Factor (Default: 0.382)
The **Increment Factor** controls how the trend bands adjust as the price moves. It increases the distance of the bands from the price with each iteration.
Effect on performance: A higher increment factor can result in wider stop-loss or trend reversal bands, allowing for longer trends to develop without frequent exits. A lower factor keeps the bands closer to the price and is more suited for shorter-term trades.
🔶 Take Profit Levels (Default: 2%, 8%, 18%)
The default take-profit levels are set at 2%, 8%, and 18%. These values represent the thresholds at which the trader can partially exit their positions. These multi-step levels are highly customizable depending on the trader’s risk tolerance and strategy.
Effect on performance: Lower take-profit levels (e.g., 2%) capture small, quick profits in volatile markets, while higher levels (8%-18%) allow for a more gradual exit in strong trends.
🔶 Normalization Method (Default: None)
The default normalization method is **None**, meaning the deviations are not normalized. However, enabling normalization (e.g., **Max-Min**) can improve the clarity of the indicator’s signals in volatile or choppy markets by smoothing out the noise.
Effect on performance: Using a normalization method can reduce the effect of extreme deviations, making signals more stable and less prone to false positives.

VPSA - Volume Price Spread AnalysisDear Analysts and Traders,
I am pleased to present the latest version of my indicator, based on the logic of analyzing spread and volume. In this version, the indicator examines spread and volume using min-max normalization. The statistical value is captured through Z-Score standardization, and I have added configurable alerts based on the normalized values of spread, volume, and the sigmas for these variables.
Theory and Evolution of the Indicator
The normalization function used in this program allows for the comparison of two values with different ranges on a single chart. The values that reach the highest within the examined range are assigned a value of one. As in previous versions, I have adopted a bar chart where the wider bar represents volume and the narrower bar represents spread. I believe that using normalization is the most intuitive approach, as the standardization in the earlier sVPSA version could cause confusion. This was due to smaller bars for higher actual values and negative bars, which required additional reliance on actual volume data and significant proficiency in using the indicator. These were limitations stemming from the computational aspect of these issues. As in the previously mentioned script, I also used Z-Score standardization here, which serves as a measure of deviation from the mean. This is visualized in the script as the color of the bars, which in the default configuration are as follows: below one sigma - blue; above one sigma up to two sigmas - green; above two sigmas up to three sigmas - red; and above three sigmas - fuchsia. Additionally, I applied an exponential moving average in this indicator to minimize the influence of older candles on the mean. The indicator has been enhanced with configurable alerts, allowing for substantial control over the conditions triggering them. The alerts enable the definition of normalized variable values and sigma values. Furthermore, the program allows for the definition of logical dependencies for these conditions.
Summary
The program I have developed is a synthesis of the most important and useful functions from the indicators I previously created. The indicator is a standalone and powerful tool that facilitates effective analysis of the spread-volume relationship, which is one of the fundamental methods of analysis according to the Wyckoff and VSA methodologies. The alerts introduced in this version provide extensive possibilities for controlling the dynamics of any market.
Should you encounter any errors or have suggestions regarding the indicator, please feel free to contact me.
I wish you successful analyses! All the best!
CatTheTrader

Multiple EMA Indicator [Pineify]TradingView Multiple EMA Indicator: A Comprehensive Trend Analysis Tool
The TradingView Multiple EMA Indicator is a powerful and versatile tool designed to provide traders with a comprehensive view of market trends across multiple timeframes. By incorporating five Exponential Moving Averages (EMAs) with customizable lengths and sources, this indicator offers a nuanced approach to trend analysis, suitable for both novice and experienced traders.
Key Features:
Five customizable EMAs for multi-timeframe analysis
Flexible source inputs for each EMA
Color-coded plots for easy visual interpretation
Overlay functionality for direct price action comparison
How It Works:
This indicator calculates and displays five separate EMAs on your chart, each with its own customizable length and source. The EMAs are color-coded for easy identification:
EMA-1: Red
EMA-2: Light Green
EMA-3: Light Blue
EMA-4: Purple
EMA-5: Yellow
By default, the indicator uses the following settings:
EMA-1: 10-period EMA of close price
EMA-2: 20-period EMA of close price
EMA-3: 50-period EMA of close price
EMA-4: 100-period EMA of close price
EMA-5: 200-period EMA of close price
However, users can easily adjust these settings to suit their specific trading strategies and preferences.
Trading Ideas and Insights:
The Multiple EMA Indicator offers several ways to analyze market trends and generate trading signals:
Trend Identification: The alignment of the EMAs can help identify the overall trend. When shorter-term EMAs are above longer-term EMAs, it suggests an uptrend, and vice versa for a downtrend.
Dynamic Support and Resistance: Each EMA can act as a dynamic support or resistance level. Price bouncing off these levels can indicate potential entry or exit points.
Crossovers: When a shorter-term EMA crosses above a longer-term EMA, it may signal a bullish trend change. Conversely, a bearish signal may occur when a shorter-term EMA crosses below a longer-term EMA.
Trend Strength: The spacing between the EMAs can indicate trend strength. Wide spacing suggests a strong trend, while narrow spacing or intertwining EMAs may indicate consolidation or a weakening trend.
Multi-Timeframe Analysis: By using different EMA lengths, traders can gain insights into short-term, medium-term, and long-term trends simultaneously.
How to Use the Indicator:
Add the indicator to your chart and adjust the input parameters as needed.
Observe the relative positions of the EMAs to identify the overall trend direction.
Look for potential entry signals when price or shorter-term EMAs cross above or below longer-term EMAs.
Use the EMAs as dynamic support and resistance levels for setting stop-loss and take-profit orders.
Combine the Multiple EMA Indicator with other technical analysis tools, such as oscillators or volume indicators, for more comprehensive trading decisions.
Customization Options:
The indicator offers extensive customization options, allowing traders to tailor it to their specific needs:
Adjust the length of each EMA to focus on different timeframes
Change the source of each EMA (e.g., close, open, high, low, HL2, HLC3, OHLC4)
Modify the color and line thickness of each EMA for better visibility
Conclusion:
The TradingView Multiple EMA Indicator is a versatile and powerful tool for trend analysis and trade decision-making. By providing a multi-faceted view of market trends, it enables traders to make more informed decisions based on a comprehensive understanding of price action across various timeframes.
Remember that while this indicator can be a valuable tool in your trading arsenal, it should not be used in isolation. Always combine it with other forms of analysis and proper risk management techniques for the best results.
We hope this indicator enhances your trading experience and contributes to your success in the markets. Happy trading!

Cinnamon_Bear Indicators MA LibraryLibrary "Cinnamon_BearIndicatorsMALibrary"
This is a personal Library of the NON built-in PineScript Moving Average function used to code indicators
ma_dema(source, length)
Double Exponential Moving Average (DEMA)
Parameters:
source (simple float)
length (simple int)
Returns: A double level of smoothing helps to follow price movements more closely while still reducing noise compared to a single EMA.
ma_dsma(source, length)
Double Smoothed Moving Average (DSMA)
Parameters:
source (simple float)
length (simple int)
Returns: A double level of smoothing helps to follow price movements more closely while still reducing noise compared to a single SMA.
ma_tema(source, length)
Triple Exponential Moving Average (TEMA)
Parameters:
source (simple float)
length (simple int)
Returns: A Triple level of smoothing helps to follow price movements even more closely compared to a DEMA.
ma_vwema(source, length)
Volume-Weighted Exponential Moving Average (VWEMA)
Parameters:
source (simple float)
length (simple int)
Returns: The VWEMA weights based on volume and recent price, giving more weight to periods with higher trading volumes.
ma_hma(source, length)
Hull Moving Average (HMA)
Parameters:
source (simple float)
length (simple int)
Returns: The HMA formula combines the properties of the weighted moving average (WMA) and the exponential moving average (EMA) to achieve a smoother and more responsive curve.
ma_ehma(source, length)
Enhanced Moving Average (EHMA)
Parameters:
source (simple float)
length (simple int)
Returns: The EHMA is calculated similarly to the Hull Moving Average (HMA) but uses a different weighting factor to further improve responsiveness.
ma_trix(source, length)
Triple Exponential Moving Average (TRIX)
Parameters:
source (simple float)
length (simple int)
Returns: The TRIX is an oscillator that shows the percentage change of a triple EMA. It is designed to filter out minor price movements and display only the most significant trends. The TRIX is a momentum indicator that can help identify trends and buy or sell signals.
ma_lsma(source, length)
Linear Weighted Moving Average (LSMA)
Parameters:
source (simple float)
length (simple int)
Returns: A moving average that gives more weight to recent prices. It is calculated using a formula that assigns linear weights to prices, with the highest weight given to the most recent price and the lowest weight given to the furthest price in the series.
ma_wcma(source, length)
Weighted Cumulative Moving Average (WCMA)
Parameters:
source (simple float)
length (simple int)
Returns: A moving average that gives more weight to recent prices. Compared to a LSMA, the WCMA the weights of data increase linearly with time, so the most recent data has a greater weight compared to older data. This means that the contribution of the most recent data to the moving average is more significant.
ma_vidya(source, length)
Variable Index Dynamic Average (VIDYA)
Parameters:
source (simple float)
length (simple int)
Returns: It is an adaptive moving average that adjusts its momentum based on market volatility using the formula of Chande Momentum Oscillator (CMO) .
ma_zlma(source, length)
Zero-Lag Moving Average (ZLMA)
Parameters:
source (simple float)
length (simple int)
Returns: Its aims to minimize the lag typically associated with MA, designed to react more quickly to price changes.
ma_gma(source, length, power)
Generalized Moving Average (GMA)
Parameters:
source (simple float)
length (simple int)
power (simple int)
Returns: It is a moving average that uses a power parameter to adjust the weight of historical data. This allows the GMA to adapt to various styles of MA.
ma_tma(source, length)
Triangular Moving Average (TMA)
Parameters:
source (simple float)
length (simple int)
Returns: MA more sensitive to changes in recent data compared to the SMA, providing a moving average that better adapts to short-term price changes.
