Implied Volatility LevelsOverview:
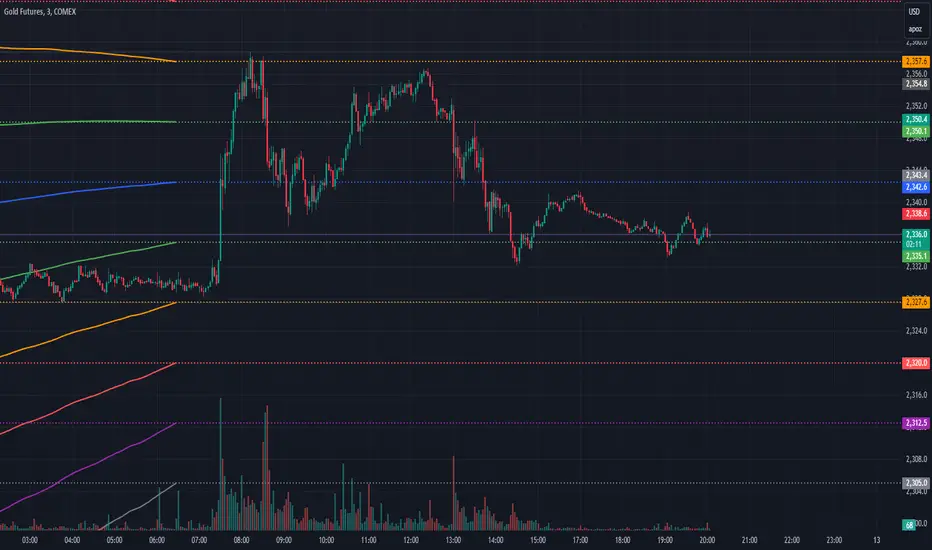
The Implied Volatility Levels Indicator is a powerful tool designed to visualize different levels of implied volatility on your trading chart. This indicator calculates various implied volatility levels based on historical price data and plots them as dynamic dotted lines, helping traders identify significant market thresholds and potential reversal points.
Features:
Multi-Level Implied Volatility: The indicator calculates and plots multiple levels of implied volatility, including the mean and both positive and negative standard deviation multiples.
Dynamic Updates: The levels update in real-time, reflecting the latest market conditions without cluttering your chart with outdated information.
Customizable Parameters: Users can adjust the lookback period and the standard deviation multiplier to tailor the indicator to their trading strategy.
Visual Clarity: Implied volatility levels are displayed using distinct colors and dotted lines, providing clear visual cues without obstructing the view of price action.
Support for Multiple Levels: Includes additional levels (up to ±5 standard deviations) for in-depth market analysis.
How It Works:
The indicator computes the standard deviation of the closing prices over a user-defined lookback period. It then calculates various implied volatility levels by adding and subtracting multiples of this standard deviation from the mean price. These levels are plotted as dotted lines on the chart, offering traders a clear view of the current market's volatility landscape.
Usage:
Identify Key Levels: Use the plotted lines to spot potential support and resistance levels based on implied volatility.
Analyze Market Volatility: Understand how volatile the market is relative to historical data.
Plan Entry and Exit Points: Make informed trading decisions by observing where the price is in relation to the implied volatility levels.
Parameters:
Lookback Period (Days): The number of days to consider for calculating historical volatility (default is 252 days).
Standard Deviation Multiplier: A multiplier to adjust the distance of the levels from the mean (default is 1.0).
This indicator is ideal for traders looking to incorporate volatility analysis into their technical strategy, providing a robust framework for anticipating market movements and potential reversals.
Search in scripts for "key levels"
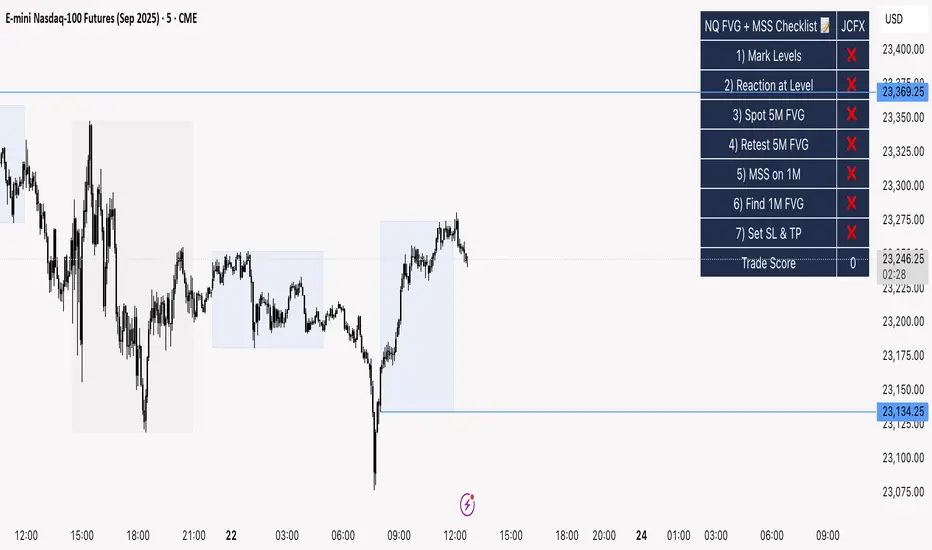
NQ FVG + MSS ChecklistThe NQ FVG + MSS Quick Checklist is a simple yet powerful visual tool for traders focusing on the Nasdaq 100 (NQ) futures. It provides a step-by-step checklist to assess trade setups based on key market concepts like Fair Value Gaps (FVG), Market Structure Shifts (MSS), session highs/lows, and previous day levels.
This indicator helps you quickly see which elements of your trading plan are met before entering a trade. Each checklist item can be manually toggled, and a cumulative Trade Score provides a quick visual guide to setup strength.
Key Features:
Step-by-step checklist for NQ trading setups
Track levels: Session highs/lows & Previous Day High/Low
Spot 5M FVG and Retests
Identify MSS on 1M and find 1M FVG inside MSS
Manual SL & TP guidance
Trade Score for quick setup strength assessment
Fully visible table overlay on top of the chart
How to Use:
Mark session & previous day levels
Observe reaction at key levels (Sweep or Continue)
Identify 5M FVG and any retests
Spot 1M MSS and 1M FVG inside MSS
Set SL/TP based on FVG extremes and next session levels
Check the cumulative Trade Score for setup confirmation
Note: This indicator is manual input-based, letting traders tick off items as they analyze the chart, making it a lightweight trading checklist HUD that stays on top of all chart elements.
Volume Profile (Simple)Simple Volume Profile (Simple)
Master the Market's Structure with a Clear View of Volume
by mercaderoaurum
The Simple Volume Profile (Simple) indicator removes the guesswork by showing you exactly where the most significant trading activity has occurred. By visualizing the Point of Control (POC) and Value Area (VA) for today and yesterday, you can instantly identify the price levels that matter most, giving you a critical edge in your intraday trading.
This tool is specifically optimized for day trading SPY on a 1-minute chart, but it's fully customizable for any symbol or timeframe.
Key Features
Multi-Day Analysis: Automatically plots the volume profiles for the current and previous trading sessions, allowing you to see how today's market is reacting to yesterday's key levels.
Automatic Key Level Plotting: Instantly see the most important levels from each session:
Point of Control (POC): The single price level with the highest traded volume, acting as a powerful magnet for price.
Value Area High (VAH): The upper boundary of the area where 50% of the volume was traded. It often acts as resistance.
Value Area Low (VAL): The lower boundary of the 50% value area, often acting as support.
Extended Levels: The POC, VAH, and VAL from previous sessions are automatically extended into the current day, providing a clear map of potential support and resistance zones.
Customizable Sessions: While optimized for the US stock market, you can define any session time and time zone, making it a versatile tool for forex, crypto, and futures traders.
Core Trading Strategies
The Simple Volume Profile helps you understand market context. Instead of trading blind, you can now make decisions based on where the market has shown the most interest.
1. Identifying Support and Resistance
This is the most direct way to use the indicator. The extended lines from the previous day are your roadmap for the current session.
Previous Day's POC (pPOC): This is the most significant level. Watch for price to react strongly here. It can act as powerful support if approached from above or strong resistance if approached from below.
Previous Day's VAH (pVAH): Expect this level to act as initial resistance. A clean break above pVAH can signal a strong bullish trend.
Previous Day's VAL (pVAL): Expect this level to act as initial support. A firm break below pVAL can indicate a strong bearish trend.
Example Strategy: If SPY opens and rallies up to the previous day's VAH and stalls, this is a high-probability area to look for a short entry, with a stop loss just above the level.
2. The "Open-Drive" Rejection
How the market opens in relation to the previous day's value area is a powerful tell.
Open Above Yesterday's Value Area: If the market opens above the pVAH, it signals strength. The first pullback to test the pVAH is often a key long entry point. The level is expected to flip from resistance to support.
Open Below Yesterday's Value Area: If the market opens below the pVAL, it signals weakness. The first rally to test the pVAL is a potential short entry, as the level is likely to act as new resistance.
3. Fading the Extremes
When price pushes far outside the previous day's value area, it can become overextended.
Reversal at Highs: If price rallies significantly above the pVAH and then starts to lose momentum (e.g., forming bearish divergence on RSI or a topping pattern), it could be an opportunity to short the market, targeting a move back toward the pVAH or pPOC.
Reversal at Lows: Conversely, if price drops far below the pVAL and shows signs of bottoming, it can be a good opportunity to look for a long entry, targeting a reversion back to the value area.
Recommended Settings (SPY Intraday)
These settings are the default and are optimized for scalping or day trading SPY on a 1-minute chart.
Value Area (%): 50%. This creates a tighter, more sensitive value area, perfect for identifying the most critical intraday zones.
Number of Rows: 1000. This high resolution is essential for a low-volatility instrument like SPY, ensuring that the profile is detailed and the levels are precise.
Session Time: 0400-1800 in America/New_York. This captures the full pre-market and core session, which is crucial for understanding the day's complete volume story.
Ready to trade with an edge? Add the Simple Volume Profile (Multi-Day) to your chart now and see the market in a new light!

ALEX - ATR Extensions + ADR + TableALEX - ATR Extensions + ADR + Table
Overview
The ALEX ATR Extensions indicator is a comprehensive volatility and momentum analysis tool that combines Average True Range (ATR), Average Daily Range (ADR), and moving average distance calculations in a single, customizable display. This indicator helps traders assess current price action relative to historical volatility and key moving averages, providing crucial context for risk management and trade planning.
Key Features
Multi-Metric Analysis
- ATR Percentage: Current ATR as a percentage of price for volatility assessment
- ADR Percentage: Average Daily Range as a percentage for typical daily movement
- Low of Day Distance: Distance from current price to daily low
- Moving Average Distance: ATR-normalized distance from 21 and 50 period moving averages
Flexible Moving Average Options
- Configurable MA Types: Choose between EMA or SMA for both 21 and 50 period averages
- Customizable Periods: Adjust moving average lengths to suit your trading style
- Daily Timeframe Data: Uses daily moving averages regardless of chart timeframe
ATR Extension Levels
- Dynamic Price Targets: Calculate extension levels based on ATR multiples from moving averages
- Visual Reference Lines: Optional overlay lines showing ATR extension targets
- Customizable Multipliers: Adjust ATR multipliers for different risk/reward scenarios
Smart Visual Alerts
- Color-Coded Distance Metrics: Automatic color changes based on distance thresholds
- Symbol Plotting: Customizable chart symbols when distance thresholds are exceeded
- Threshold-Based Alerts: Visual cues when price reaches significant ATR distances
Comprehensive Data Table
- Real-Time Metrics: Live updating table with all key measurements
- Customizable Display: Toggle individual metrics on/off based on preference
- Professional Styling: Adjustable colors, fonts, and transparency
How to Use
Volatility Assessment
- High ATR%: Indicates elevated volatility, larger position sizing considerations
- Low ATR%: Suggests compressed volatility, potential for expansion
- ADR% Comparison: Compare current day's range to historical average
Moving Average Analysis
- ATR Distance 21/50: Normalized distance showing how extended price is from key levels
- Positive Values: Price above moving average (bullish positioning)
- Negative Values: Price below moving average (bearish positioning)
- Color Changes: Automatic alerts when reaching threshold levels
Extension Target Planning
- ATR Extension Lines: Visual price targets based on volatility-adjusted projections
- Risk/Reward Planning: Use extension levels for profit target placement
- Breakout Confirmation: Extension levels can confirm breakout validity
Symbol Alert System
- Chart Symbols: Automatic plotting when distance thresholds are breached
- Customizable Triggers: Set your own threshold levels for alerts
- Visual Scanning: Quick identification of extended conditions across multiple charts
Settings
Display Controls
- Show ADR%: Toggle average daily range percentage display
- Show ATR%: Toggle average true range percentage display
- Show LoD Distance: Toggle low of day distance calculation
- Show LoD Price: Toggle actual low of day price display
- Show ATR Distance from 21/50 DMA: Toggle moving average distance metrics
- Show 21/50 DMA Price: Toggle actual moving average price display
- Show ATR Extension Levels: Toggle extension target display in table
Moving Average Configuration
- 21/50 DMA Type: Choose between EMA or SMA calculation methods
- 21/50 DMA Period: Customize moving average lengths
- ADR/ATR Length: Adjust calculation periods for range measurements
Color Thresholds
- Threshold Levels: Set distance levels for color changes (default 2.0 and 5.0)
- Custom Colors: Choose colors for different threshold breaches
- Separate 21/50 Settings: Independent color schemes for each moving average
Symbol Settings
- Show Char Symbol: Toggle symbol plotting for each moving average
- Custom Symbols: Choose any character for chart plotting
- Symbol Colors: Customize colors for visual distinction
- Threshold Levels: Set trigger points for symbol appearance
ATR Extension Lines
- Show Extension Lines: Toggle visual extension level lines
- ATR Multipliers: Customize extension distance (default 2.0x)
- Line Colors: Choose colors for extension level visualization
Table Customization
- Background Color: Adjust table transparency and color
- Text Color: Customize default text appearance
- Font Size: Choose from tiny to huge font options
Advanced Applications
Trend Strength Analysis
- Large ATR distances suggest strong trending moves
- Small ATR distances indicate potential consolidation or reversal zones
- Compare current readings to recent historical ranges
Risk Management
- Use ATR% for position sizing calculations
- Extension levels provide natural profit target zones
- Distance metrics help identify overextended conditions
Multi-Timeframe Context
- Apply to different timeframes for comprehensive analysis
- Daily data provides consistency across all chart intervals
- Combine with weekly/monthly analysis for broader context
Market Regime Identification
- High volatility periods: Increased ATR% readings
- Low volatility periods: Compressed ATR% readings
- Trending markets: Sustained high distance readings
- Consolidating markets: Low distance readings with frequent color changes
Best Practices
Volatility-Adjusted Trading
- Increase position sizes during low volatility periods
- Reduce position sizes during high volatility periods
- Use ATR% for stop-loss placement relative to normal market movement
Extension Level Usage
- Primary targets: 1.5-2.0x ATR extensions
- Secondary targets: 2.5-3.0x ATR extensions
- Avoid chasing prices beyond 3x ATR extensions
Threshold Optimization
- Backtest different threshold levels for your trading style
- Consider market conditions when setting alert levels
- Adjust thresholds based on instrument volatility characteristics
Integration Strategies
- Combine with momentum indicators for confirmation
- Use alongside support/resistance levels
- Incorporate into systematic trading approaches
Technical Specifications
- Compatible with Pine Script v6
- Uses daily timeframe data for consistency
- Optimized for real-time performance
- Works on all chart types and timeframes
- Supports all tradeable instruments
Ideal For
- Swing traders using daily charts
- Position traders seeking volatility context
- Day traders needing intraday reference levels
- Risk managers requiring volatility metrics
- Systematic traders building rule-based strategies
Disclaimer
This indicator is for educational and informational purposes only. It should not be used as the sole basis for trading decisions. Always combine with other forms of analysis, proper risk management techniques, and consider your individual trading plan and risk tolerance. Past performance does not guarantee future results.
Compatible with Pine Script v6 | Optimized for daily timeframe analysis | Works across all markets and instruments

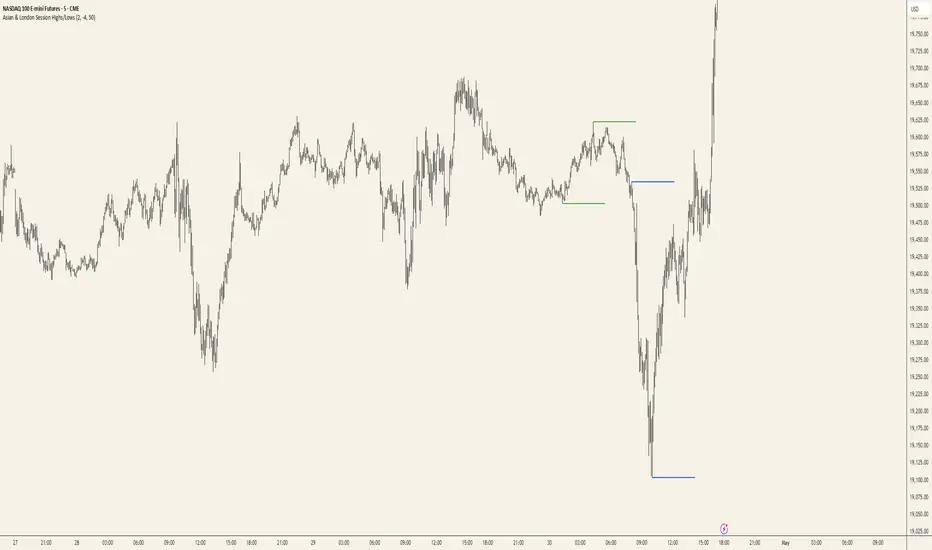
Asian & London Session Highs/LowsAsian & London Session Highs/Lows with Extendable Lines
This TradingView script automatically marks the highs and lows of the Asian and London trading sessions for the most recent day, allowing traders to identify key levels during these active periods. The lines representing the high and low of each session are drawn at the exact price point where the high/low occurred, and they extend to the right for a customizable number of bars, helping to visualize how the price reacts to these key levels after the session ends.
Key Features:
Session High/Low Tracking: Automatically tracks the highest and lowest points for the Asian and London sessions.
Extendable Lines: Lines start at the exact bar where the high/low occurred and can be extended to the right for a specified number of bars.
Timezone Adjustment: Allows you to input a timezone offset to adjust session times based on your local time or desired market time zone.
Customizable Colors & Line Thickness: Adjust the color and thickness of the session high and low lines to suit your visual preferences.
Clear & Precise Levels: Helps identify important support and resistance levels, making it easier to spot market reactions around session highs and lows.
This indicator is perfect for day traders and those looking to trade during specific market hours, offering clear visual markers of session boundaries and critical price levels.
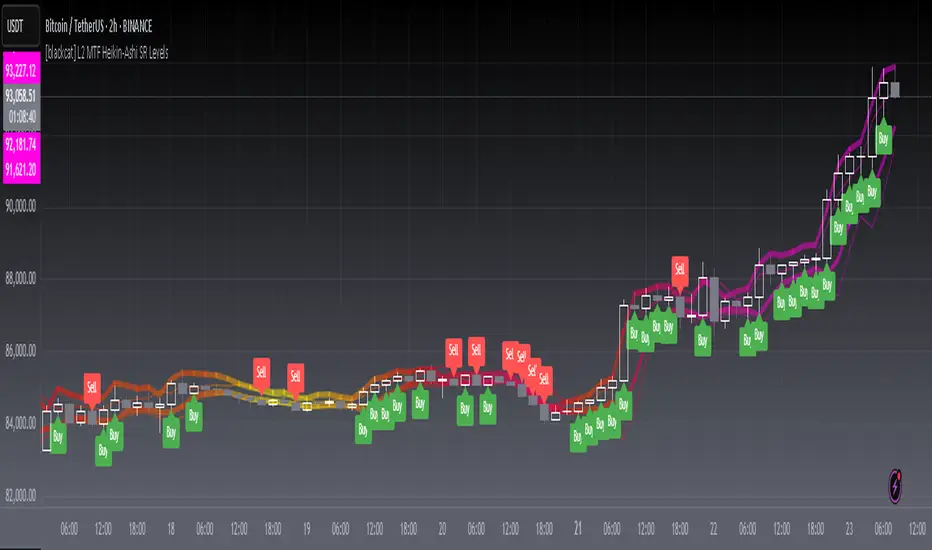
[blackcat] L2 MTF Heikin-Ashi SR LevelsOVERVIEW
The L2 MTF Heikin-Ashi SR Levels indicator is a sophisticated tool designed to help traders identify critical support and resistance levels across multiple timeframes. This script employs Heikin-Ashi candles, which provide a smoothed representation of price action, making it easier to spot trends and reversals. By integrating multi-timeframe analysis, this indicator offers a comprehensive view of market dynamics, enabling traders to make more informed decisions 📊✅.
This indicator not only calculates essential support and resistance levels but also visually represents them on the chart with gradient colors based on Relative Strength Index (RSI) values. Additionally, it features customizable alerts and labels to enhance user experience and ensure timely execution of trades.
FEATURES
Advanced Trend Identification:
Uses Heikin-Ashi candles for smoother price action analysis.
Helps filter out noise and focus on significant trends.
Ideal for both short-term and long-term trading strategies.
Multi-Timeframe Analysis:
Allows users to select different resolutions for deeper insights.
Ensures compatibility with various trading styles and preferences.
Comprehensive Support and Resistance Calculation:
Computes four distinct levels: Support Level 1, Support Level 2, Resistance Level 1, and Resistance Level 2.
Each level serves as a reference point for potential price reversals or continuations.
Gradient Color Visualization:
Employs a spectrum of colors derived from RSI values to represent support and resistance lines.
Enhances readability and helps traders quickly assess market sentiment 🎨.
Dynamic Labels and Alerts:
Automatically generates buy ('Buy') and sell ('Sell') labels when price crosses key levels.
Provides real-time alerts for crossing events, ensuring traders never miss important signals 🔔.
Customizable Parameters:
Offers adjustable Length and Resolution inputs for tailored performance.
Allows traders to fine-tune the indicator according to their unique needs and strategies.
HOW TO USE
Adding the Indicator:
Open your TradingView chart and navigate to the indicators list.
Search for ' L2 MTF Heikin-Ashi SR Levels' and add it to your chart.
Configuring Settings:
Adjust the Length parameter to determine the period over which calculations are made.
A shorter length increases sensitivity, while a longer length smoothens the output.
Choose a specific Resolution to analyze different timeframes simultaneously.
For example, set it to 'D' for daily charts or 'W' for weekly charts.
Interpreting the Chart:
Observe the plotted support and resistance lines on the chart.
Look for price interactions with these levels to identify potential entry and exit points.
Pay attention to the gradient colors, which reflect underlying market momentum.
Setting Up Alerts:
Configure alerts based on the generated signals to receive instant notifications.
Customize alert messages and conditions to suit your trading plan.
Utilizing Labels:
Use the automatically placed buy and sell labels as quick references for decision-making.
Combine these labels with other technical analyses for confirmation.
Backtesting and Optimization:
Thoroughly test the indicator on historical data to evaluate its performance.
Optimize settings and refine your strategy based on backtest results.
Live Trading:
Apply the indicator to live charts and monitor real-time price movements.
Execute trades based on the generated signals and adjust positions accordingly.
Combining with Other Tools:
Integrate this indicator with other technical tools and fundamental analyses for a holistic approach.
Consider using moving averages, oscillators, or volume indicators alongside L2 MTF Heikin-Ashi SR Levels.
LIMITATIONS
Market Volatility:
In highly volatile or ranging markets, the indicator might produce false signals due to erratic price movements 🌪️.
Traders should exercise caution during such periods and consider additional confirmations.
Timeframe Dependency:
The effectiveness of the indicator can vary significantly depending on the chosen timeframe and asset.
Always validate the indicator's performance across different contexts before relying solely on it.
Over-reliance Risk:
While powerful, no single indicator guarantees success in all market conditions.
Combining this tool with other analytical methods enhances reliability and reduces risk.
NOTES
Data Requirements:
Ensure your chart has enough historical data to perform accurate calculations.
Insufficient data may lead to inaccurate or incomplete results.
Demo Testing:
Before deploying the indicator in live trading, conduct extensive testing on demo accounts.
Familiarize yourself with how the indicator behaves under various market scenarios.
Parameter Tuning:
Experiment with different Length and Resolution settings to find what works best for your trading style.
Regularly review and update parameters as market conditions evolve.
Continuous Learning:
Stay updated with the latest developments in technical analysis and trading strategies.
Adapt your use of the indicator based on new insights and experiences.
THANKS
Additionally, gratitude goes to the broader TradingView community for fostering collaboration and knowledge-sharing among traders worldwide. Together, we strive to elevate our understanding and application of financial markets 🌍💡.
Dynamic Support and Resistance ### Indicator: Dynamic Support and Resistance
#### Overview:
The *Dynamic Support and Resistance* indicator is a powerful tool designed to help traders identify key price levels on a chart. It dynamically calculates support and resistance levels based on pivot points and the Average True Range (ATR). The indicator also highlights broken support and resistance zones, providing visual cues for potential trend reversals or continuations.
---
### Key Features:
1. *Dynamic Support and Resistance Levels*:
- The indicator identifies support and resistance levels using pivot highs and lows within a user-defined range.
- These levels are adjusted using the ATR to account for market volatility, making them more responsive to changing market conditions.
2. *Support and Resistance Zones*:
- The indicator draws boxes around the support and resistance levels, with customizable colors and widths.
- The width of the zones is determined by the ATR and a user-defined multiplier, allowing traders to adjust the sensitivity of the zones.
3. *Broken Zones*:
- When price breaks through a support or resistance zone, the zone is highlighted with a distinct color to indicate a potential shift in market sentiment.
- Traders can limit the number of broken zones displayed on the chart to avoid clutter.
4. *Customizable Inputs*:
- *Range Candle Count*: Defines the number of candles analyzed to determine pivot points. Increasing this value will result in fewer but more significant levels, while decreasing it will produce more levels that are sensitive to shorter-term price movements.
- *ATR Period*: Controls the sensitivity of the ATR calculation. A shorter period makes the ATR more responsive to recent price changes, while a longer period smooths it out.
- *Box Width Multiplier*: Adjusts the width of the support and resistance zones. A higher multiplier creates wider zones, which may be useful in more volatile markets.
- *Max Broken Zones*: Limits the number of broken zones displayed on the chart. This helps keep the chart clean and focused on the most recent breaks.
---
### How It Works:
1. *Pivot Points*:
- The indicator identifies pivot highs and lows within the specified range. These pivots serve as the basis for calculating support and resistance levels.
2. *ATR Adjustment*:
- The ATR is used to adjust the support and resistance levels, making them more dynamic and responsive to market volatility.
3. *Zone Creation*:
- Support and resistance zones are drawn as boxes around the pivot levels. The width of these zones is determined by the ATR and the box width multiplier.
4. *Zone Breaks*:
- When price breaks through a zone, the zone is highlighted with a distinct color, and the broken zone is added to an array. If the number of broken zones exceeds the user-defined limit, the oldest broken zone is removed from the chart.
---
### How to Use:
1. *Trend Identification*:
- Use the support and resistance levels to identify key price levels where the market may reverse or consolidate.
- Broken zones can signal potential trend reversals or continuations.
2. *Entry and Exit Points*:
- Traders can use the support and resistance zones as potential entry or exit points. For example, buying near support or selling near resistance.
- Broken zones can be used as confirmation for breakout strategies.
3. *Risk Management*:
- The width of the zones can help traders set stop-loss levels. For example, placing a stop-loss just outside a support or resistance zone.
4. *Customization*:
- Adjust the input parameters to suit your trading style and the specific market conditions. For example, increase the range candle count for longer-term analysis or decrease it for shorter-term trading.
---
### Who Should Use This Indicator?
- *Swing Traders*: Can use the indicator to identify key levels for potential reversals or breakouts.
- *Day Traders*: Can benefit from the dynamic levels and zones, especially in volatile markets.
- *Position Traders*: Can use the indicator to identify long-term support and resistance levels.
- *Breakout Traders*: Can use the broken zones to confirm breakouts and plan their trades accordingly.
---
### Input Parameters and Their Effects:
1. *Range Candle Count*:
- *Increase*: Produces fewer but more significant levels, suitable for longer-term analysis.
- *Decrease*: Produces more levels, sensitive to shorter-term price movements.
2. *ATR Period*:
- *Increase*: Smoothens the ATR, making the levels less sensitive to recent price changes.
- *Decrease*: Makes the ATR more responsive to recent price changes, resulting in more dynamic levels.
3. *Box Width Multiplier*:
- *Increase*: Creates wider zones, suitable for more volatile markets.
- *Decrease*: Creates narrower zones, suitable for less volatile markets.
4. *Max Broken Zones*:
- *Increase*: Displays more broken zones on the chart, providing more historical context.
- *Decrease*: Keeps the chart clean by displaying only the most recent broken zones.
---
### Conclusion:
The *Dynamic Support and Resistance* indicator is a versatile tool that can be adapted to various trading styles and market conditions. By dynamically adjusting to market volatility and highlighting key price levels, it provides traders with valuable insights into potential support and resistance areas. Whether you're a swing trader, day trader, or position trader, this indicator can help you make more informed trading decisions.
---
### Publishing on TradingView:
- *Title*: Dynamic Support and Resistance
- *Description*: A dynamic support and resistance indicator that uses pivot points and ATR to identify key price levels. Includes customizable support/resistance zones and highlights broken zones for breakout trading.
- *Tags*: support, resistance, ATR, pivot points, breakout, trading, indicator
- *Access*: Public or Invite-only, depending on your preference.
This indicator is ready to be published on TradingView, and the detailed description above will help users understand its functionality and how to use it effectively.

Midnight Opening Ranges[TDL]Midnight Opening Range Indicator for TradingView
Description:
The Midnight Opening Range Indicator as taught by Micheal J. Huddleston is a powerful tool designed for traders who want to analyze price action during the critical midnight to 00:30 timeframe. This indicator highlights the opening range for both the current day and previous days, providing valuable insights into market behavior during this specific period. It also calculates and displays deviations from the opening range, as well as allows for custom opening prices to be set, making it highly adaptable to your trading strategy.
Key Features:
Today's Opening Range (00:00 - 00:30):
The indicator plots the high and low of the price range between 00:00 and 00:30 for the current day.
This range is highlighted on the chart, making it easy to identify the initial market movement and potential support/resistance levels.
Previous Days' Opening Ranges:
The indicator also displays the opening ranges for previous days, allowing you to how price reacts off of previous days ranges not just todays.
This feature helps in identifying patterns or recurring behaviors in the market in which price uses this range and previous days ranges throughout the trading day.
Deviations from the Opening Range:
The indicator calculates and plots deviations from the opening range, both above and below the high and low of the range.
These deviations can be used to identify potential breakout or reversal points, giving you an edge in anticipating market moves.
Custom Opening Prices:
The indicator allows you to set custom opening prices, which can be useful if you want to analyze the market based on a specific reference point rather than the default midnight opening.
This feature is particularly useful for traders who follow alternative trading sessions or have specific entry criteria.
Customizable Visuals:
The indicator offers customizable colors and styles for the opening range, deviations, and custom opening prices, allowing you to tailor the visual representation to your preferences.
How to Use:
Identify Key Levels: Use the highlighted opening range to identify key support and resistance levels for the day.
Monitor Deviations: Watch for price movements beyond the opening range deviations to spot potential breakouts or reversals.
Previous Range Data: Use previous days to identify areas of potential AMD.
Set Custom Prices: Adjust the custom opening price to align with your trading strategy or session preferences.
Ideal For:
Day Traders: Perfect for traders who focus on the early hours of the market to capture initial momentum.
Swing Traders: Useful for identifying key levels that could influence price action over several days.
Algorithmic Traders: Can be integrated into automated trading systems to trigger trades based on the opening range and deviations.
Conclusion:
The Midnight Opening Range Indicator is an essential tool for any trader looking to gain an edge in the market by focusing on the critical midnight to 00:30 timeframe. With its ability to highlight opening ranges, calculate deviations, and accommodate custom opening prices, this indicator provides a comprehensive view of market behavior during this pivotal period. Whether you're a day trader, swing trader, or algorithmic trader, this indicator will help you make more informed trading decisions.

Fibonacci Moving Average PlusFibonacci Moving Average Plus is a sophisticated technical indicator that employs the first 15 numbers of the Fibonacci sequence to create dynamic moving average channels. This indicator aims to capture both immediate and long-term price movements by calculating Exponential Moving Averages (EMAs) based on these Fibonacci values. By using Fibonacci-based moving averages for both high and low price points, the indicator generates a visual channel that reflects the ebb and flow of market trends, acting as potential zones of support and resistance. Additionally, the indicator provides midline, retracement, and extension levels rooted in Fibonacci ratios, which are frequently observed as key levels for reversals or trend continuation.
Ideology Behind Using Fibonacci Sequence-Based Moving Averages
The Fibonacci sequence, known for its mathematical harmony and prevalence in natural patterns, is widely utilized in technical analysis to identify potential turning points in markets. In this indicator, the first 15 Fibonacci numbers (5, 8, 13, 21, etc.) are used as the lookback periods for EMAs to capture different layers of market sentiment. These moving averages represent timeframes that are theoretically in alignment with the natural rhythms of market cycles, where key levels—often coinciding with Fibonacci numbers—can act as magnetic points for price.
The Fibonacci high and low channels aim to encapsulate price action, giving traders a sense of whether the market is trending, consolidating, or experiencing reversal pressure. These levels, grounded in both mathematics and market psychology, help traders spot areas where price might face resistance or find support.
Key Features
Fibonacci Moving Average High and Low: This indicator calculates the high and low EMAs based on Fibonacci sequence numbers (e.g., 5, 8, 13, etc.) for enhanced trend analysis.
Golden Pocket Retracement (GPR) and Extension (GPE) Bands: Displays common Fibonacci retracement and extension levels (0.618, 0.65 for retracement, and 1.618, 1.65 for extension).
Midline: Plots the average of the Fibonacci high and low to act as an additional reference level.
Stop-Loss Levels: Provides suggested stop-loss levels based on Fibonacci levels for both long and short positions.
Basic User Guide
Adjust Input Settings:
Input Timeframe: Set a specific timeframe for the Fibonacci moving average calculation, separate from the chart's primary timeframe.
Show Fibonacci MA High/Low: Toggle the visibility of the high and low Fibonacci moving averages.
Show Mid Line: Display a midline for added trend reference.
Show Golden Pocket Bands: Choose to display retracement or extension bands for potential support or resistance zones.
Show Stop-Loss Levels: Enable to visualize potential stop-loss levels for both long and short trades.
Interpretation:
Fibonacci MA High and Low: Use these lines to gauge the general trend. When the price is above both, it may indicate an uptrend; below both, a downtrend.
Golden Pocket Retracement: This zone (between 0.618 and 0.65) is often a key level for potential reversals or support/resistance.
Golden Pocket Extension: The 1.618 and 1.65 levels can indicate potential profit-taking or trend exhaustion points.
Stop-Loss Levels: The calculated stop-loss levels (long SL below and short SL above) can aid in risk management.
Customization:
You can customize the appearance and visibility of each component through the input settings to fit your specific strategy and visual preferences.
This indicator should be used alongside other technical analysis tools to provide a more comprehensive trading approach.
This Indicator would not exist without the original contributions and blessing from Sofien Kaabar

Fibonacci Buy /Sell SignalsHere is a Fibonacci-based Buy/Sell Indicator using retracement levels for potential support and resistance zones. This indicator plots Fibonacci levels and provides buy/sell signals based on price interaction with these levels.
Fibonacci Levels:
Highest high and lowest low over the lookback period.
Key levels: 38.2% (retracement), 50% (midpoint), 61.8% (strong retracement).
Buy Signal: When the price crosses above the 61.8% Fibonacci level (bullish).
Sell Signal: When the price crosses below the 38.2% Fibonacci level (bearish).

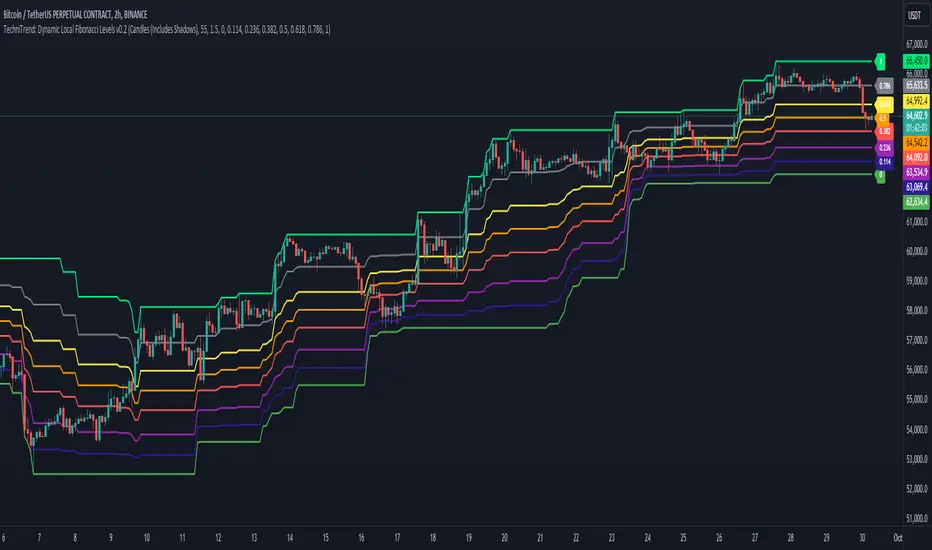
TechniTrend: Dynamic Local Fibonacci LevelsTechniTrend: Dynamic Local Fibonacci Levels
Description: The "Dynamic Local Fibonacci Levels" indicator dynamically displays Fibonacci levels only when the market is experiencing significant volatility. By detecting volatile price movements, this tool helps traders focus on Fibonacci retracement levels that are most relevant during high market activity, reducing noise from calm market periods.
Key Features:
Adaptive Fibonacci Levels: The indicator calculates and plots Fibonacci levels (from 0 to 1) only during periods of high volatility. This helps traders focus on actionable levels during significant price swings.
Customizable Chart Type: Users can choose between Candlestick charts (including shadows) or Line charts (excluding shadows) to determine the high and low price points for Fibonacci level calculations.
Volatility-Based Detection: The Average True Range (ATR) is used to detect significant volatility. Traders can adjust the ATR multiplier to fine-tune the sensitivity of the indicator to price movements.
Fully Customizable Fibonacci Levels: Traders can modify the default Fibonacci levels according to their preferences or trading strategies.
Real-Time Volatility Confirmation: Fibonacci levels are displayed only if the price range between the local high and low exceeds a user-defined volatility threshold, ensuring that these levels are only plotted when the market is truly volatile.
Customization Options:
Chart Type: Select between "Candles (Includes Shadows)" and "Line (Excludes Shadows)" for detecting price highs and lows.
Length for High/Low Detection: Choose the period for detecting the highest and lowest price in the given time frame.
ATR Multiplier for Volatility Detection: Adjust the sensitivity of the volatility threshold by setting the ATR multiplier.
Fibonacci Levels: Customize the specific Fibonacci levels to be displayed, from 0 to 1.
Usage Tips:
Focus on Key Levels During Volatility: This indicator is best suited for periods of high volatility. It can help traders identify potential support and resistance levels that may be more significant in turbulent markets.
Adjust ATR Multiplier: Depending on the asset you're trading, you might want to fine-tune the ATR multiplier to better suit the market conditions and volatility.
Recommended Settings:
ATR Multiplier: 1.5
Fibonacci Levels: Default levels set to 0.00, 0.114, 0.236, 0.382, 0.5, 0.618, 0.786, and 1.0
Length for High/Low Detection: 55
Use this indicator to detect key Fibonacci retracement levels in volatile market conditions and make more informed trading decisions based on price dynamics and volatility.
Artaking 2Components of the Indicator:
Moving Averages:
Short-Term Moving Average (MA): This is a 50-period Simple Moving Average (SMA) applied to the closing price. It is used to track the short-term trend of the market.
Long-Term Moving Average (MA): This is a 200-period SMA used to track the long-term trend.
Day Trading Moving Average: A 20-period SMA is used specifically for day trading signals, focusing on shorter-term price movements.
Purpose:
The crossing of these moving averages (short-term crossing above or below long-term) provides basic buy and sell signals, indicative of potential trend reversals or continuations.
ADX (Average Directional Index) for Trend Strength:
ADX Calculation: The ADX is calculated using a 14-period length with 14-period smoothing. The ADX value indicates the strength of a trend, regardless of direction.
Strong Trend Condition: The indicator considers a trend to be strong if the ADX value is above 25. This threshold helps filter out trades during weak or sideways markets.
Purpose:
To ensure that the strategy only generates signals when there is a strong trend, thus avoiding whipsaws in low volatility or range-bound conditions.
Support Levels:
Support Level Calculation: The indicator calculates the lowest close over the last 100 periods. This level is used to identify significant support zones where the price might find a floor.
Purpose:
Support levels are critical in identifying potential areas where the price might bounce, making them ideal for setting stop losses or identifying buy opportunities.
Volatility Spike (Proxy for News Trading):
ATR (Average True Range) Calculation: The indicator uses a 14-period ATR to measure market volatility. A volatility spike is identified when the ATR is greater than 1.5 times the 14-period SMA of the ATR.
Purpose:
This serves as a proxy for news events or other sudden market movements that could make the market unpredictable. The indicator avoids generating signals during these periods to reduce the risk of being caught in a volatile, potentially news-driven move.
Fibonacci Retracement Levels:
61.8% Fibonacci Level: Calculated from the highest high and lowest low over the long MA period, this retracement level is widely regarded as a significant support or resistance level.
Purpose:
Position traders often use Fibonacci levels to identify potential reversal points. The indicator incorporates the 61.8% level to fine-tune entries and exits.
Candlestick Patterns for Price Action Trading:
Bullish Engulfing Pattern: A bullish reversal pattern where a green candle fully engulfs the previous red candle.
Bearish Engulfing Pattern: A bearish reversal pattern where a red candle fully engulfs the previous green candle.
Purpose:
These patterns are classic signals used in price action trading to identify potential reversals at key levels, especially when they align with other conditions like support/resistance or Fibonacci levels.
Signal Generation:
The indicator generates buy and sell signals by combining the above elements:
Buy Signal:
A buy signal is triggered when:
The short-term MA crosses above the long-term MA (indicating a potential uptrend).
The trend is strong (ADX > 25).
The current price is near or below the 61.8% Fibonacci retracement level, suggesting a potential reversal.
No significant volatility spike is detected, ensuring the market isn’t reacting unpredictably to news.
Sell Signal:
A sell signal is triggered when:
The short-term MA crosses below the long-term MA (indicating a potential downtrend).
The trend is strong (ADX > 25).
The current price is near or above the 61.8% Fibonacci retracement level, suggesting potential resistance.
No significant volatility spike is detected.
Day Trading Signals:
Independent of the main trend signals, the indicator also generates intraday buy and sell signals when the price crosses above or below the 20-period day trading MA.
Price Action Signals:
The indicator can trigger buy or sell signals based purely on price action, such as the occurrence of bullish or bearish engulfing patterns. This is optional and can be enabled or disabled.
Alerts:
The indicator includes built-in alert conditions that notify the trader when a buy or sell signal is generated. This allows traders to act immediately without having to constantly monitor the charts.
Practical Application:
This indicator is versatile and can be used across various trading styles:
Position Trading: The long-term MA, Fibonacci retracement, and ADX provide a solid foundation for identifying long-term trends and potential entry/exit points.
Day Trading: The short-term MA and day trading MA offer quick signals for intraday trading.
Price Action: Candlestick pattern recognition allows for precise entry points based on market sentiment and behavior.
News Trading: The volatility spike filter helps avoid trading during periods of market instability, often driven by news events.
Conclusion:
The Comprehensive Trading Strategy Indicator is a robust tool designed to help traders navigate various market conditions by integrating multiple strategies into a single, coherent framework. It provides clear, actionable signals while filtering out potentially dangerous trades during volatile or weak market conditions. Whether you're a long-term trader, a day trader, or someone who relies on price action, this indicator can be a valuable addition to your trading toolkit.

Average SL% Calculator with TP Levels by GorkiAverage Stop Loss And Take Profit Calculator For Futures Trading by Gorki
Description
The "Average SL% Calculator with TP Levels" script, is a simple tool for traders to plan the trades and check how much loss they are going to receive if they run this strategy. This script calculates the average price of up to four entry points, determines the percentage distance to the stop-loss level, and provides potential loss information based on margin and leverage. Additionally, it includes multiple take-profit levels to help traders systematically capture profits. Visual elements such as horizontal lines and labels make it easy to monitor key levels directly on the chart.
Why To Use This Indicator?
Risk Management: Automatically calculates the percentage distance to the stop-loss level, helping you to understand potential losses.
Profit Optimization: Supports up to four take-profit levels, enabling a structured approach to capturing gains.
Visual Clarity: Displays key levels and important information directly on the chart for easy monitoring.
Alerts: Generates alerts when the price crosses specified levels, ensuring you never miss critical trading signals.
How to Use the Script
Add the Script to Your Chart: Apply the script to your TradingView chart.
Set Input Values: Entry Points: Define up to four limit prices (LIMIT 1, LIMIT 2, LIMIT 3, LIMIT 4).
Stop-Loss: Set your stop-loss price (STOP LOSS).
Take Profits: Specify up to four take-profit levels (Take Profit 1, Take Profit 2, Take Profit 3, Take Profit 4).
Leverage: Input your leverage factor.
Margin: Enter the total margin amount for the trade.
View Calculations: The script will calculate the average entry price, the percentage distance to the stop-loss, and the potential loss based on margin and leverage.
Monitor Levels: Horizontal lines and labels will appear on the chart, showing entry points, stop-loss, and take-profit levels.
Set Alerts: Alerts will trigger when the price crosses your defined levels, helping you to take timely action.
Calculation Details
Average Price: Calculated as the mean of the specified limit prices.
Distance to Stop-Loss: Determined as the percentage difference between the average price and the stop-loss level.
Leveraged Distance: The stop-loss distance percentage multiplied by the leverage factor.
Potential Loss: Calculated by applying the leveraged distance percentage to the margin amount.
Take Profit Percentages: The percentage difference between the average price and each take-profit level.
This comprehensive indicator is a must-have for any trader looking to manage risks effectively while maximizing potential profits. Happy trading!

Smart Money Analysis with Golden/Death Cross [YourTradingSensei]Description of the script "Smart Money Analysis with Golden/Death Cross":
This TradingView script is designed for market analysis based on the concept of "Smart Money" and includes the detection of Golden Cross and Death Cross signals.
Key features of the script:
Moving Averages (SMA):
Two moving averages are calculated: a short-term (50 periods) and a long-term (200 periods).
The intersections of these moving averages are used to determine Golden Cross and Death Cross signals.
High Volume:
The current trading volume is analyzed.
Periods of high volume are identified when the current volume exceeds the average volume by a specified multiplier.
Support and Resistance Levels:
Key support and resistance levels are determined based on the highest and lowest prices over a specified period.
Buy and Sell Signals:
Buy and sell signals are generated based on moving average crossovers, high volume, and the closing price relative to key levels.
Golden Cross and Death Cross:
A Golden Cross occurs when the short-term moving average crosses above the long-term moving average.
A Death Cross occurs when the short-term moving average crosses below the long-term moving average.
These signals are displayed on the chart with text color changes for better visualization.
Using the script:
The script helps traders visualize key signals and levels, aiding in making informed trading decisions based on the behavior of major market players and technical analysis.
Custom candle lighting(CCL) © 2024 by YourTradingSensei is licensed under CC BY-NC-SA 4.0. To view a copy of this license.

Session MasterSession Master Indicator
Overview
The "Session Master" indicator is a unique tool designed to enhance trading decisions by providing visual cues and relevant information during the critical last 15 minutes of a trading session. It also integrates advanced trend analysis using the Average Directional Index (ADX) and Directional Movement Index (DI) to offer insights into market trends and potential entry/exit points.
Originality and Functionality
This script combines session timing, visual alerts, and trend analysis in a cohesive manner to give traders a comprehensive view of market behavior as the trading day concludes. Here’s a breakdown of its key features:
Last 15 Minutes Highlight : The script identifies the last 15 minutes of the trading session and highlights this period with a semi-transparent blue background, helping traders focus on end-of-day price movements.
Previous Session High and Low : The script dynamically plots the high and low of the previous trading session. These levels are crucial for identifying support and resistance and are highlighted with dashed lines and labeled for easy identification during the last 15 minutes of the current session.
Directional Movement and Trend Analysis : Using a combination of ADX and DI, the script calculates and plots trend strength and direction. A 21-period Exponential Moving Average (EMA) is plotted with color coding (green for bullish and red for bearish) based on the DI difference, offering clear visual cues about the market trend.
Technical Explanation
Last 15 Minutes Highlight:
The script checks the current time and compares it to the session’s last 15 minutes.
If within this period, the background color is changed to a semi-transparent blue to alert the trader.
Previous Session High and Low:
The script retrieves the high and low of the previous daily session.
During the last 15 minutes of the session, these levels are plotted as dashed lines and labeled appropriately.
ADX and DI Calculation:
The script calculates the True Range, Directional Movement (both positive and negative), and smoothes these values over a specified length (28 periods by default).
It then computes the Directional Indicators (DI+ and DI-) and the ADX to gauge trend strength.
The 21-period EMA is plotted with dynamic color changes based on the DI difference to indicate trend direction.
How to Use
Highlight Key Moments: Use the blue background highlight to concentrate on market movements in the critical last 15 minutes of the trading session.
Identify Key Levels: Pay attention to the plotted high and low of the previous session as they often act as significant support and resistance levels.
Assess Trend Strength: Use the ADX and DI values to understand the strength and direction of the market trend, aiding in making informed trading decisions.
EMA for Entry/Exit: Use the color-coded 21-period EMA for potential entry and exit signals based on the trend direction indicated by the DI.
Conclusion
The "Session Master" indicator is a powerful tool designed to help traders make informed decisions during the crucial end-of-session period. By combining session timing, previous session levels, and advanced trend analysis, it provides a comprehensive overview that is both informative and actionable. This script is particularly useful for intraday traders looking to optimize their strategies around session close times.

Fib Pivot Points HLThis TradingView indicator allows users to select a specific timeframe (TF) and then analyzes the high, low, and closing prices from the past period within that TF to calculate a central pivot point. The pivot point is determined using the formula (High + Close + Low) / 3, providing a key level around which the market is expected to pivot or change direction.
In addition to the central pivot point, the indicator enhances its utility by incorporating Fibonacci levels. These levels are calculated based on the range from the low to the high of the selected timeframe. For instance, a Fibonacci level like R0.38 would be calculated by adding 38% of the high-low range to the pivot point, giving traders potential resistance levels above the pivot.
Key features of this indicator include:
Timeframe Selection: Users can choose their desired timeframe, such as weekly, daily, etc., for analysis.
Pivot Point Calculation: The indicator calculates the pivot point based on the previous period's high, low, and closing prices within the selected timeframe.
Fibonacci Levels: Adds Fibonacci retracement levels to the pivot point, offering traders additional layers of potential support and resistance based on the natural Fibonacci sequence.
This indicator is particularly useful for traders looking to identify potential turning points in the market and key levels of support and resistance based on historical price action and the Fibonacci sequence, which is widely regarded for its ability to predict market movements.
Example:
Suppose you're analyzing the EUR/USD currency pair using this indicator with a weekly timeframe setting. The previous week's price action showed a high of 1.2100, a low of 1.1900, and the week closed at 1.2000.
Using the formula ( High + Close + Low ) / 3 (High+Close+Low)/3, the pivot point would be calculated as ( 1.2100 + 1.2000 + 1.1900 ) / 3 = 1.2000. Thus, the central pivot point for the current week is at 1.2000.
The range from the low to the high is 1.2100 − 1.1900 = 0.0200 1.2100−1.1900=0.0200.
To calculate a specific Fibonacci level, such as R0.38, you would add 38% of the high-low range to the pivot point: 1.2000 + ( 0.0200 ∗ 0.38 ) = 1.2076 1.2000+(0.0200∗0.38)=1.2076. Thus, the R0.38 Fibonacci resistance level is at 1.2076.
Similarly, you can calculate other Fibonacci levels such as S0.38 (Support level at 38% retracement) by subtracting 38% of the high-low range from the pivot point.
Traders can use the pivot point as a reference for the market's directional bias: prices above the pivot point suggest bullish sentiment, while prices below indicate bearish sentiment. The Fibonacci levels act as potential stepping stones for price movements, offering strategic points for entry, exit, or placing stop-loss orders.

ORB With Buffer, Target & Stop LossThe "ORB With Buffer" is a comprehensive technical analysis tool designed to identify, plot, and visualize key levels associated with price breakouts. It offers a dynamic representation of breakout zones, buffer areas, target levels, and stop-loss levels on both sides of the market.
Key Features:
ORB Levels (Opening Range Breakout):
The indicator identifies and plots the Opening Range Breakout levels, marking the high and low points of the initial trading period. In our case the ORB range is locked to 15 Minutes irrespective of the chart's timeframe.
Buffer Areas for Breakout:
Buffer zones are displayed around the ORB levels, representing a range where traders cant wait to join the direction to counter fake ORB breakouts
Targets:
The indicator calculates and visualizes target levels. Approximately 1% of instrument's price from entry point
Stop Loss Levels:
Stop-loss levels are indicated on both sides of the market, offering traders a clear reference point to manage risk.

Zemog Channels[Zemogtrading]Channels Strategy
User Description:
This Channels strategy is a powerful technical analysis tool that empowers traders with a comprehensive view of the market's support and resistance levels. Designed for both beginners and experienced traders, this strategy brings a systematic and adaptable approach to chart analysis.
Default Parameters:
Swing Length (SL): 45
Higher Timeframe: Daily (D)
Multiplier for Level 2: 3.5
Multiplier for Level 3: 12
How It Works:
Swing Analysis: The Swing Length (SL) parameter allows users to fine-tune the sensitivity of the strategy. A higher SL value provides a more smoothed-out analysis, ideal for a broader market perspective, while a lower value enhances responsiveness to short-term price movements.
Higher Timeframe Insights: The Channels fetches high and low prices from a user-specified higher timeframe (default: Daily). This ensures that the strategy is well-informed by significant price levels from a broader market context.
Dynamic ATR Calculation: The Average True Range (ATR) adapts dynamically to changing market conditions. This ensures that support and resistance levels adjust in real-time based on the prevailing volatility, providing traders with adaptive insights.
Smoothed Support and Resistance: Utilizing a Smoothed Moving Average (SMA), the strategy calculates support and resistance levels based on high and low prices from the higher timeframe. This smoothing effect enhances clarity in identifying key levels, facilitating more informed trading decisions.
Additional Levels: The Channels introduces Level 2 and Level 3 support and resistance zones. Users can customize multipliers for these levels, allowing for the identification of secondary zones for potential market reversals.
Visualization: The strategy vividly plots support and resistance levels on the chart. Green lines indicate support, red lines denote resistance, and yellow lines represent additional support at Level 3.
Using Channels is a versatile tool that equips traders with a deeper understanding of crucial market levels. By seamlessly integrating swing analysis, higher timeframe data, and adaptive calculations, this strategy offers a holistic and user-friendly approach to technical analysis.

Session Levels - Ultimate Range IndicatorSession Levels - Ultimate Range Indicator
Primarily developed for trading the E-MINI Futures Markets like NQ or ES from the CME Group,
but also more than suitable for Crypto or other instruments.
This indicator highlights the chosen session, which can be Globex, Asian, London and New York.
It plots the important levels and also renders the Opening Range as it forms (a.k.a. Initial Balance).
After the 1st hour Opening Range is finished, it can plot the Standard Deviations / Projections.
See below for a complete feature list.
All Opening Ranges on chart and for the New York session the Range Projections are turned on:
s3.tradingview.com
How to use (example):
If you are trading the Nasdaq Futures (NQ!)
Enable the Globex Overnight session. Basically in the Futures Market, the Globex session is everything outside of US trading hours of Stocks. This draws the important overnight levels, like the Low, 25%, 50%, 75% and the High.
Enable the New York Session with Levels and Opening Range. Generally, 70% of the time the 1st hour will put a Low or High of the day.
If the price is trading above the Globex Low, most likely the Low of the Day is formed and the price target for the day will be 1.5x Standard Deviation and 2x Standard Deviation.
[*} Deviation of the Initial Balance depends on the volume ad overall market structure.
** This is not financial advice or any guarantee **
Features:
Show each Session Highlighted on Intraday chart in it's own color (each session can be turned off and has customizable times and color)
Show Line Levels of each session: Low, 25%, 50%, 75% and the High (customizable color)
Show the Opening Range (Initial Balance) of the Asian, London and New York session. Note: NY has more options.
Opening Range is displayed as a box with level lines (customizable color)
Levels are drawn to the end of the NY Cash session (customizable time)
Show IB Standard Deviations 0.5 - 3.0. Calculated from the Opening Range (Initial Balance)
Option to display Higher Timeframe levels: Previous Day Open/Close and Previous Week Open/Close
All level lines and OR boxes size dynamically as the session progresses
Built in Alerts for when price hits key levels. e.g. Alert when price crosses the NY Opening Range High. Or an Alert when the first STDEV is hit.
Option to toggle display of drawings for Today's trading session only, or Show all recent session levels. This keeps the chart clean or not.
Extras:
The NY Opening Range also has a 50% level line
The NY Opening Bar can be highlighted separately
The Level Lines can have small labels turned on/off. Values are only shown on mouse over to keep a clean chart
Keep in mind:
1) This indicator works on all instruments, but on instruments with limited market hours, your chart setting
has to be set to "Extended Hours" otherwise. For example TSLA on NASDAQ.
2) The Exchange Time Zone for the CME Group is Chicago UTC-6. So the session times you configure in the settings menu are based on that timezone too.
3) Globex opens at 5pm CST and closes when the US session starts 8:30CST.
4) When enabling the Alerts in the Indicator settings, be sure to also create an alarm for this indicator using the Alarm function of Tradingview.

Fibonacci Auto Retracement & HTF candles ReferenceAdvanced Higher Timeframe (HTF) Candle & Fibonacci Viewer
Overview:
The Advanced HTF Candle & Fibonacci Viewer is a professional Trading View indicator designed to help traders overlay higher timeframe price structures onto lower timeframe charts. By combining daily candle analysis with precise Fibonacci retracement levels, this tool allows traders to identify critical support and resistance zones, potential breakouts, and retracement opportunities without switching charts.
Special Thanks:
This script includes a small part of coding inspired by Zeiierman, whose work on HTF analysis provided the foundation for visualizing higher timeframe structures. Full credit to Zeiierman for their invaluable contribution to the Trading View community.
Key Features:
1. Multi-Day HTF Range Display
Automatically displays high and low of 1–7 previous days.
Highlights candle bodies and wicks for clear structure visualization.
Ideal for spotting daily ranges and breakout levels.
2. Dynamic Fibonacci Levels
Standard levels: 0%, 11.8%, 23.6%, 38.2%, 50%, 61.8%, 76.4%, 88.2%, 100%.
Optional mid-level lines for intraday support/resistance identification.
Levels adjust automatically to reflect price action direction.
3. Customizable Labels & Colors
Adjustable text size, color, transparency, and offset.
Fully customizable candle and Fibonacci colors.
Mid-level lines can be shown or hidden for a cleaner look.
4. Persistent Levels
Levels remain until the next trading session or breakout, helping track trends and retracements consistently.
5. Multi-Timeframe Optimization
Works on any chart timeframe, from 1-minute to weekly charts.
Provides higher timeframe insight while trading on lower timeframes.
Why Traders Love This Indicator:
View higher timeframe action without switching charts.
Identify high-probability entry and exit zones.
Combine with other indicators for complete market analysis.
Useful for swing traders, day traders, and scalpers alike.
Customization Options:
Number of previous days (1–7)
Show/hide mid-level lines
Show/hide labels
Customize label size, color, and offset
Customize Fibonacci and candle colors
Ideal Use Cases:
Swing Trading: Identify daily key levels for entry, exit, and stop-loss.
Day Trading: Use HTF ranges on intraday charts to spot breakouts and reversals.
Fibonacci Analysis: Locate retracement zones efficiently.
Trend Confirmation: Validate trades with higher timeframe structure.
Summary:
The Advanced HTF Candle & Fibonacci Viewer is a powerful tool for traders seeking clarity, structure, and precision. With higher timeframe insight overlaid on active charts and proper credit to Zeiierman for their HTF coding contribution, this indicator helps traders make informed, confident decisions in any market.

4-Hour Range HighlighterThe 4-Hour Range Highlighter is a powerful visual analysis tool designed for traders operating on lower timeframes (like 5m, 15m, or 1H). It overlays the critical price range of the 4-hour (4H) candlestick onto your chart, providing immediate context from a higher timeframe. This helps you align your intraday trades with the dominant higher-timeframe structure, identifying key support and resistance zones, breakouts, and market volatility at a glance.
Key Features:
Visual Range Overlay: Draws a semi-transparent colored background spanning the entire High and Low of each 4-hour period.
Trend-Based Coloring: Automatically colors the range based on the 4H candle's direction:
Green: Bullish 4H candle (Close > Open)
Red: Bearish 4H candle (Close < Open)
Blue: Neutral 4H candle (Close = Open)
Customizable High/Low Lines: Optional, subtle lines plot the exact high and low of the 4H bar, acting as dynamic support/resistance levels.
Fully Customizable: Easily change colors and toggle visual elements on/off in the settings to match your chart's theme.
How to Use It:
Identify Key Levels: The top and bottom of the shaded area represent significant intraday support and resistance. Watch for price reactions at these levels.
Trade in Context: Use the trend color to gauge sentiment. For example, look for buy opportunities near the low of a bullish (green) 4H range.
Spot Breakouts: A strong candle closing above the high or below the low of the current 4H range can signal a continuation or the start of a new strong move.
Gauge Volatility: A large shaded area indicates a high-volatility 4H period. A small area suggests consolidation or low volatility.
Settings:
Visual Settings: Toggle the background and choose colors for Bullish, Bearish, and Neutral ranges.
Line Settings: Toggle the high/low lines and customize their colors.
Note: This is a visual aid, not a standalone trading system. It provides context but does not generate buy/sell signals. Always use it in conjunction with your own analysis and risk management.
Perfect for Day Traders, Swing Traders, and anyone who needs higher-timeframe context on their chart!
How to Use / Instructions:
After adding the script to your chart, open the settings menu (click on the indicator's name and then the gear icon).
In the "Inputs" tab, you will find two groups: "Visual Settings" and "Line Settings".
In Visual Settings, you can:
Toggle Show 4H Range Background on/off.
Change the Bullish Color, Bearish Color, and Neutral Color for the transparent background.
In Line Settings, you can:
Toggle Show High/Low Lines on/off.
Change the line colors for each trend type.
Adjust the colors to your preference. The default settings use transparency for a clean look that doesn't clutter the chart.

Essa - Market Structure Crystal Ball SystemEssa - Market Structure Crystal Ball V2.0
Ever wished you had a glimpse into the market's next move? Stop guessing and start anticipating with the Market Structure Crystal Ball!
This isn't just another indicator that tells you what has happened. This is a comprehensive analysis tool that learns from historical price action to forecast the most probable future structure. It combines advanced pattern recognition with essential trading concepts to give you a unique analytical edge.
Key Features
The Predictive Engine (The Crystal Ball)
This is the core of the indicator. It doesn't just identify market structure; it predicts it.
Know the Odds: Get a real-time probability score (%) for the next structural point: Higher High (HH), Higher Low (HL), Lower Low (LL), or Lower High (LH).
Advanced Analysis: The engine considers the pattern sequence, the speed (velocity) of the move, and its size to find the most accurate historical matches.
Dynamic Learning: The indicator constantly updates its analysis as new price data comes in.
The All-in-One Dashboard
Your command center for at-a-glance information. No need to clutter your screen!
Market Phase: Instantly know if the market is in a "🚀 Strong Uptrend," "📉 Steady Downtrend," or "↔️ Consolidation."
Live Probabilities: See the updated forecasts for HH, HL, LL, and LH in a clean, easy-to-read format.
Confidence Level: The dashboard tells you how confident the algorithm is in its current prediction (Low, Medium, or High).
🎯 Dynamic Prediction Zones
Turn probabilities into actionable price areas.
Visual Targets: Based on the highest probability outcome, the indicator draws a target zone on your chart where the next structure point is likely to form.
Context-Aware: These zones are calculated using recent volatility and average swing sizes, making them adaptive to the current market conditions.
🔍 Fair Value Gap (FVG) Detector
Automatically identify and track key price imbalances.
Price Magnets: FVGs are automatically detected and drawn, acting as potential targets for price.
Smart Tracking: The indicator tracks the status of each FVG (Fresh, Partially Filled, or Filled) and uses this data to refine its predictions.
🌍 Trading Session Analysis
Never lose track of key session levels again.
Visualize Sessions: See the Asia, London, and New York sessions highlighted with colored backgrounds.
Key Levels: Automatically plots the high and low of each session, which are often critical support and resistance levels.
Breakout Alerts: Get notified when price breaks a session high or low.
📈 Multi-Timeframe (MTF) Context
Understand the bigger picture by integrating higher timeframe analysis directly onto your chart.
BOS & MSS: Automatically identifies Breaks of Structure (trend continuation) and Market Structure Shifts (potential reversals) from up to two higher timeframes.
Trade with the Trend: Align your intraday trades with the dominant trend for higher probability setups.
⚙️ How It Works in Simple Terms
1️⃣ It Learns: The indicator first identifies all the past swing points (HH, HL, LL, LH) and analyzes their characteristics (speed, size, etc.).
2️⃣ It Finds a Match: It looks at the most recent price action and searches through hundreds of historical bars to find moments that were almost identical.
3️⃣ It Analyzes the Outcome: It checks what happened next in those similar historical scenarios.
4️⃣ It Predicts: Based on that historical data, it calculates the probability of each potential outcome and presents it to you.
🚀 How to Use This Indicator in Your Trading
Confirmation Tool: Use a high probability score (e.g., >60% for a HH) to confirm your own bullish analysis before entering a trade.
Finding High-Probability Zones: Use the Prediction Zones as potential areas to take profit, or as reversal zones to watch for entries in the opposite direction.
Gauging Market Sentiment: Check the "Market Phase" on the dashboard. Avoid forcing trades when the indicator shows "😴 Low Volatility."
Confluence is Key: This indicator is incredibly powerful when combined with your existing strategy. Use it alongside supply/demand zones, moving averages, or RSI for ultimate confirmation.
We hope this tool gives you a powerful new perspective on the market. Dive into the settings to customize it to your liking!
If you find this indicator helpful, please give it a Boost 👍 and leave a comment with your feedback below! Happy trading!
Disclaimer: All predictions are probabilistic and based on historical data. Past performance is not indicative of future results. Always use proper risk management.

Malama's KAYCAP Pre-Market Box# Pre-Market Single Candle Range Box
## What Makes This Script Original
While many scripts plot entire pre-market session ranges, this indicator focuses specifically on **a single user-defined candle** within the pre-market period rather than the entire session. This targeted approach allows traders to isolate the most relevant price action from a specific time (default: 4:00 AM EST) that often establishes key levels for the trading day.
## Core Methodology & Technical Implementation
**Single Candle Isolation:**
- Captures OHLC data from one specific minute within pre-market hours (user configurable)
- Differentiates between the candle's body (open/close range) and wicks (high/low extremes)
- Creates four distinct reference levels instead of traditional session high/low boxes
**Dual Box Structure:**
- **Inner Box (Body):** Plots the range between open and close prices of the target candle
- **Outer Boundaries:** Separately plots the high and low of that same candle
- **Visual Differentiation:** Uses different colors and line weights to distinguish body vs. wick levels
**Time-Specific Logic:**
The script uses precise time matching (`hour == boxHour and minute == boxMinute`) to capture data from exactly one candle, rather than aggregating an entire session. This creates four specific price levels:
- Box Top: Higher of open/close (body boundary)
- Box Bottom: Lower of open/close (body boundary)
- Box High: Candle high (wick extreme)
- Box Low: Candle low (wick extreme)
## Why This Approach Differs from Standard Session Boxes
**vs. Full Session Ranges:** Focuses on a single critical minute rather than entire pre-market period
**vs. Traditional S/R:** Creates both body and wick levels from one specific candle
**vs. Opening Range:** Uses pre-market data rather than regular session opening minutes
## Practical Application
The 4:00 AM EST default targets a time when institutional pre-market activity often establishes initial sentiment and key levels. By isolating this specific candle's range:
- **Body levels** often act as initial support/resistance during regular hours
- **Wick extremes** provide broader range boundaries for breakout analysis
- **Precise timing** allows focus on the most statistically relevant pre-market moment
## Technical Considerations
- Requires intraday timeframes (1-minute recommended) to capture specific candle data
- Time settings should match your broker's timezone for accurate candle selection
- Works best on liquid instruments where pre-market activity is meaningful
- The selected candle must exist in your data feed for the levels to plot
## Customization Options
All timing parameters are adjustable:
- Target candle hour and minute
- Pre-market session definition (for context)
- Visual styling for all four level types
This focused approach provides more granular analysis than broad session ranges while maintaining simplicity in execution.
