Higher High / Lower Low StrategyThis is a very simple trend following strategy for Day Trading. The premise is to follow the Moving Average for the trend direction and buy/sell the dips and blips in the trend.
1. In an uptrend, when the candle action offers a "dip", or a lower high, the strategy will then buy on the close of the candle that breaks the high of the previous candle.
2. In a downtrend, when the candle action offers a"blip", or a higher low, the strategy will then sell on the close of the candle that breaks the low of the previous candle.
3. The strategy will go Long only or Short only, not both. It must be manually reversed in the settings when a new trend is established.
4. The start month and year allow you to backtest from then until now. It's not one month at a time.
5. The strategy uses a reversal of the Stochastic %K variable as the exist. The setting for Period K controls the exit for backtesting purposes.
6. The strategy uses a moving average to determine the trend. The setting for the Period MA controls the SMA.
7. The strategy has the option of filtering the number of trades based on the direction of the MACD and/or the Signal line. This can either reduce or increase the probability, and is highly dependent on the price action of the instrument.
WARNING: I am not a licensed financial advisor. This script is intended for entertainment purposes only. I highly recommend you manually enter and exit positions per your own Trading Rules, and do not blindly follow any software or recommendation. Use of this script is elective and at your own discretion, and risk.
If you like this script, please give it a Thumb's Up, and leave a comment. If you would like any custom scripts developed, contact me to discuss it. All of my work here is open and available, free of charge. It can be copied and edited to suit your needs.
Search in scripts for "low"

BB Indicator - Marks High and low of premarket,daily,yesterdayThis indicator marks what is known as the BB system - Marks on your chart the premarket high and low, current intraday high and low and yesterday's high and low. For the style of the line you can only change the colour, if you make the line a different style it shouldn't show up because if it did it makes the lines ugly.
Pick and select which levels you would like using the indicator and you can also turn on and off the labels if you don't want them.

High/Low meterUsing the new 'pinescript' array support to build an High/Low tunnel meter.
Using the Array to save only X HIGHEST HIGHS and Y LOWEST LOWS.
By the X and Y i build a tunnel - X is the top line (highs) and Y bottom line (lows)
Green - Up Trending
Red - Down Trending
Yellow - Reversal / drawback might occur.

ICT - high low indicatorthis script is for new traders who are now getting into ICT trading, simply turn it on and it marks the previous 3 daily highs and lows, 3 weekly highs and lows, and the 3 monthly highs and lows.

[PX] Session LevelHello guys,
this scripts prints the high and low as well as the moving average of a user-defined session.
How does it work?
Basically, as soon as we are in the session range, the indicator will constantly keep track of the high and the low of this range. It also prints the moving average, which can either be a floating or a static line, that represents the latest MA value.
The indicator comes with multiple options to style the printed lines.
If you find this indicator useful, please leave a "like" and hit that "follow" button :)
Have fun and happy trading :)))
P.S: Check my signature if you want to get in touch with me.

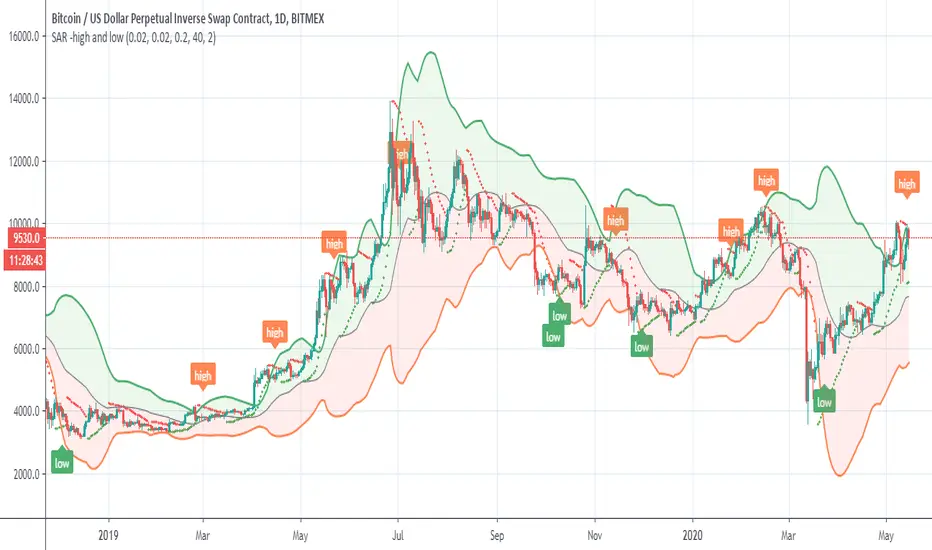
SAR -high and lowSo this model try to find by using regular sar the high and the lows
I think it need more work to make it better
but it just a concept . so it a hybrid of moddified bollinger with regular SAR
the High and Low are highlighted
Pivot Points Percentage Differences (W/ High & Low Indicators)This script is really handy for day trading. This works best on low time frames like the 1 minute or the 5 minute .
To understand what pivot points are you can add other pivot point indicators or just look at the color differences below since every-time that changes it's a new pivot point (which represents a known low or known high with high certainty)
The script shows the most recent percentage move up or down for the last known pivot point based on the pivot point setting data.
Pivot points are generated after 20 bars go by default, but you can set this to whatever you wish in the settings . Just click the gear icon for the script to set these.
You can also set how many bars back to look for what was the last highest percentage move (down or up). This will be important for your day trading strategy.
The idea to trading with this is pretty simple.
You look at the highest percentage moves that were made on pivots up or down and if you notice a current move that has trended down or up to the highest percentage, that makes that a safer bet for shorting or longing.
Of course, sometimes, things move greater or less than normal, so you would set stop losses accordingly.
Hope this helps with your day trading for finding good entry and exit points!
EXAMPLE TRADE SCENARIO
You notice the last high for the last 100 bars was 3% . The price recently rose 3% from a known pivot low. You can put a short on this. You noticed that the average price down was 2% , so if the price drops 2% or close to it you can exit your short and go LONG . You set a stop loss above what you put by an extra percentage to be safe.
I will do an experimental strategy version of this idea if people are interested.

Stochastic RibbonA series of highs and lows of different lengths to create a ribbon-like indicator to emulate the stochastic oscillator's top (100), middle (50) and bottom (0). Traders can determine the strength of the support and resistance by the number of converging lines, choose price points and visualise momentum waves.
Inputs:
Theme: multiple colours/themes (theme 2)
Length: high/low length (14)
Start: plot number to start ribbon on (1)
PlotNumber: number of plots to show; maximum 10 per top, middle, bottom (10)
Example:
Length: 14
Start: 5
PlotNumber: 10

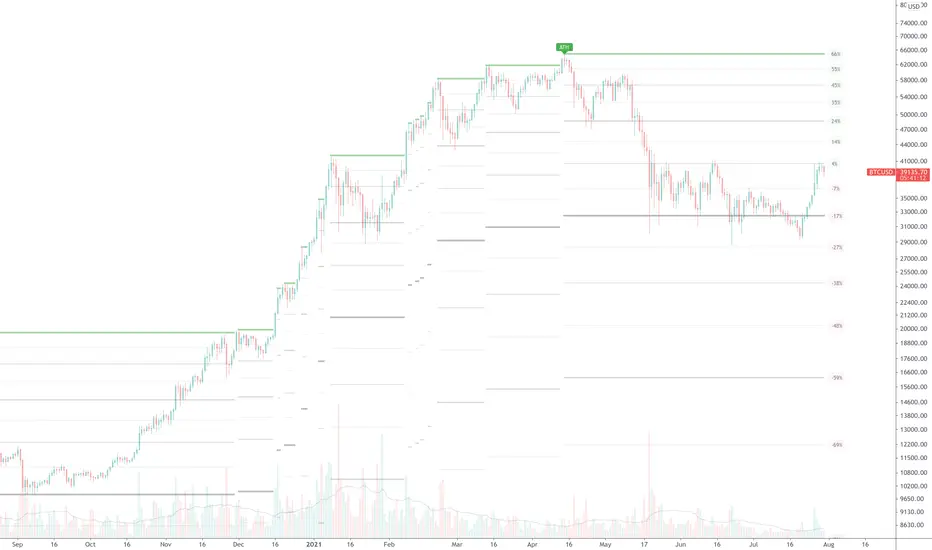
True ATH/ATL w/ labelsPlots the All Time High and All Time Low, with optional labels when a new ATH/ATL is created. Reaches all the way back in history for the true high/low, not limited to the most recent 5000 candles like most scripts. Works on all time frames.
High/Low stopFirst of all let me quote some important points :
• You need stops; a trade without a stop is a gamble.
• You need to know where you’ll put your stop before you enter
a trade.
• Everybody needs hard stops.
• Whenever you change a stop, you may move it only in the direc-
tion of the trade.
There is a variety of techniques available to traders who like to use
trailing stops:
• You can use a multibar low as a trailing stop; for example, you
can keep moving your stop to the lowest low of the last three
bars (but never against your trade).
• You can trail prices with a very short moving average and use its
level for a trailing stop.
• You can use a Chandelier stop—every time the market makes a
new high, move the stop within a certain distance from the top—
either a specific price range or a number based on an ATR (aver-
age true range). Any time your stock makes a new high, you place
your stop within that distance from the top, like hanging a chan-
delier (this method is described in Come into My Trading Room).
• You can use a Parabolic stop .
• You can use a SafeZone stop .
• You can use a Volatility-Drop stop (described below, for the first
time in trading literature).
• You can use a Time Stop to get out of your trade if it does not
move within a certain time. For example, if you enter a day-trade
and the stock does not move within 10 or 15 minutes, it is clearly
not doing what you expected and it is best to scratch that trade.
If you put on a swing trade which you expect to last several
days, but then a week goes by and the stock is still flat, it is
clearly not confirming your analysis and the safest action would
be to get out.
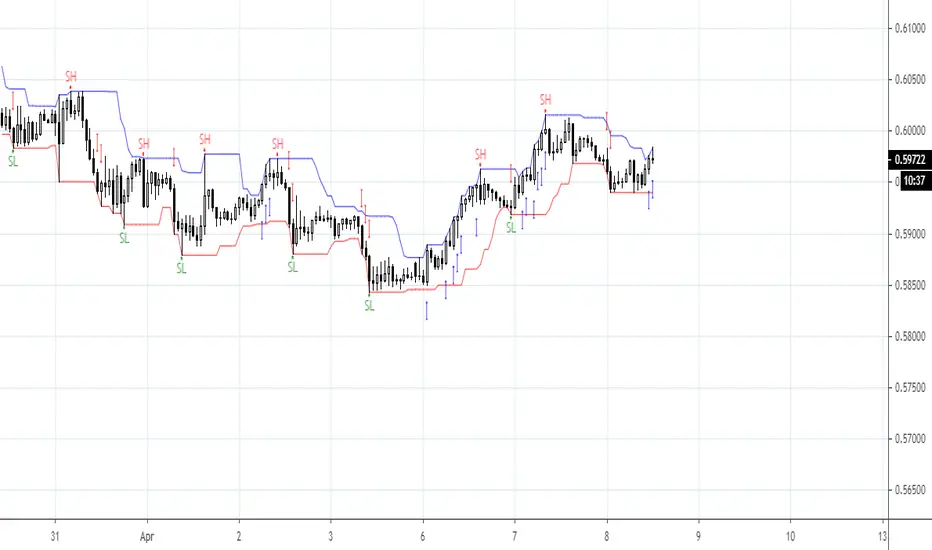
This is a summary taken from Dr Elder book and this indicator i coded from one of his book where he briefly mention this trailing stop technique but don't dive a lot into it, but still i found to be very effective.
You can use even the short stop (the green dots) as an entry point.

Number Bars High/Low BreakoutThis indicator is a visual representation of the price swing indicator and can be seen used alongside it. If both indicators are set at the same input settings the Swing Highs will show when there is a break of the blue line (which indicates the high of the previous "X" number of bars) and the Swing Lows will show when there is a break of the red line (which indicates the low of the previous "X" number of bars)
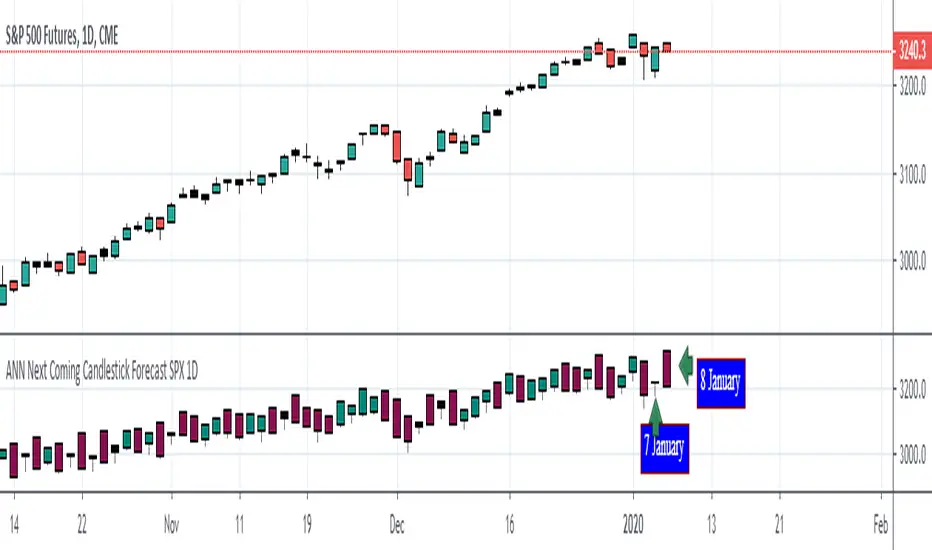
ANN Next Coming Candlestick Forecast SPX 1D v1.0WARNING:
Experimental and incomplete.
Script is open to development and will be developed.
This is just version 1.0
STRUCTURE
This script is trained according to the open, close, high and low values of the bars.
It is tried to predict the future values of opening, closing, high and low values.
A few simple codes were used to correlate expectation with current values. (You can see between line 129 - 159 )
Therefore, they are all individually trained.
You can see in functions.
The average training error of each variable is less than 0.011.
NOTE :
This script is designed for experimental use on S & P 500 and connected instruments only on 1-day bars.
The Plotcandle function is inspired by the following script of alexgrover :
Since we estimate the next values, our error rates should be much lower for all candlestick values. This is just first version to show logic.
I will continue to look for other variables to reach average error = 0.001 - 0.005 for each candlestick status.
Feel free to use and improve , this is open-source.
Best regards.
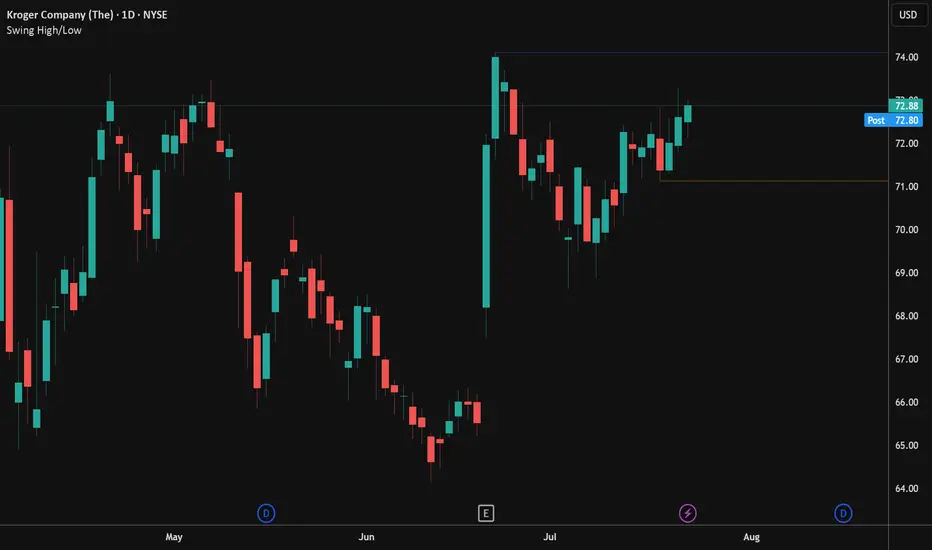
Swing High/LowPlots the swing high and low points based on user configurable look back settings. Also allows you to plot the most recent swing low as a horizontal line for obvious stop point on long setups.
15M 2PM-3PM High/LowThis script will draw horizontal lines based on the high and low values between 2PM and 3PM (inclusive 2PM & 3PM) on 15 minute time frame. This indicator can be used in 15 minute time frame to plot the high and low lines correctly. This indicator can be used for previous day 2PM-3PM range breakout or breakdown trades.

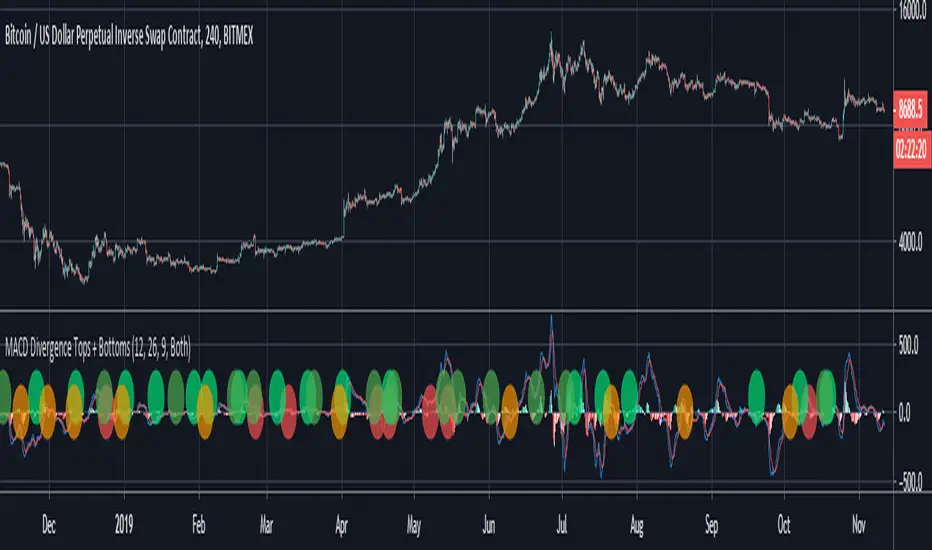
MACD Divergence Tops + BottomsMACD Indicator which plots local peaks and troughs in divergence.
"Classic" Divergence is specified as:
- A higher price, with reduced MACD high --> Potential Sell Point
- A lower price, with higher MACD low --> Potential Buy Point
"Alternative" Divergence is specified as:
- A higher MACD high, with reduced price --> Potential Sell Point
- A lower MACD low, with higher price --> Potential Buy Point
MACD Divergence should be used in combination with other indicators. This indicator identifies local tops and bottoms, with potential for macro trend shifts.
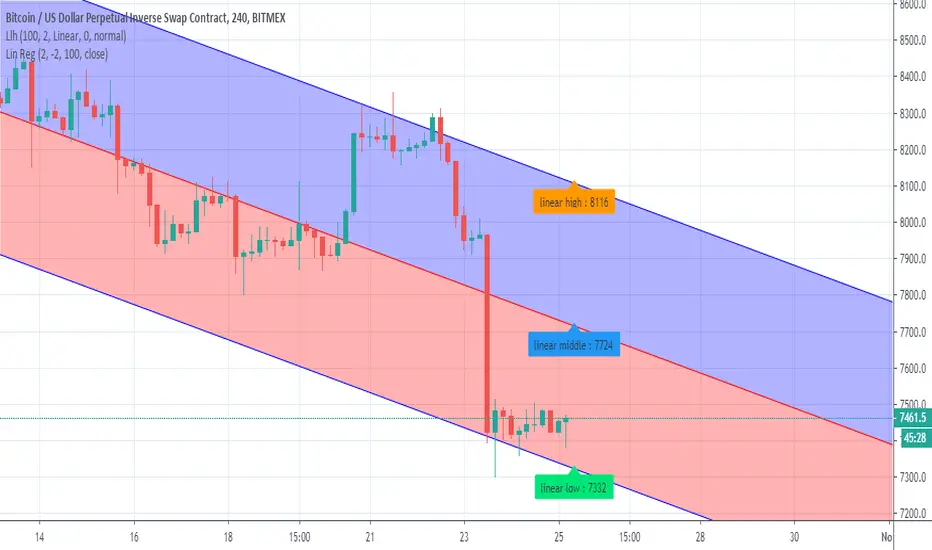
Linear low highcode from linear regression used with author consent
So this metod give us the high the middle and the low of the linear trend
you can use it with regular pivots or by its own in oreder to determine the high and the low
I advise to add linear regression to this indicator
finding the lowEasy script that give you to find low points in much more effective way ,so it very good to find entry
exit can be by fibs , pivot or take profit system etc
but the hardest thing in a trade is to locate where the low is found
so using this special rsi +mtf system of no repaint it more easy to detect it


52 Week High/Low to YesterdayThis script adds the 52 weeks (one year) high/low to the chart but it wouldn't update the value on the current trading day, so that it would remain at the same level for the whole trading day. It can come really handy for day trading the day of the 52 weeks high/low breakout/breakdown.

High/Low Breaker v2Specify Candles back to determine if high/low has been broken. Can choose to either calculate with source of high/low or close.

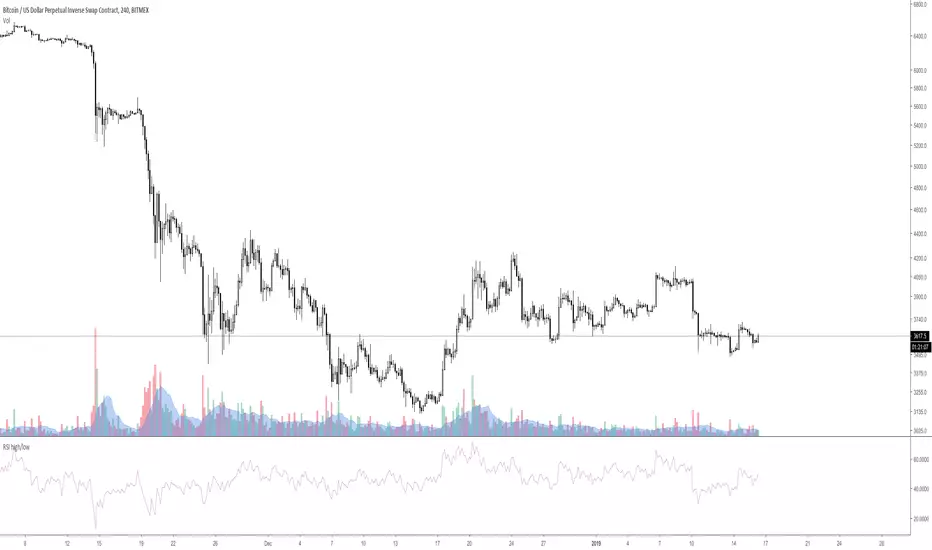
RSI high/low [experiment]This is an experiment.
This is a RSI based on candle high / low instead of close.
If the candle is up / green then the high is used.
If the candle is down / red then the low is used.
Feel free to ask if you have any question.
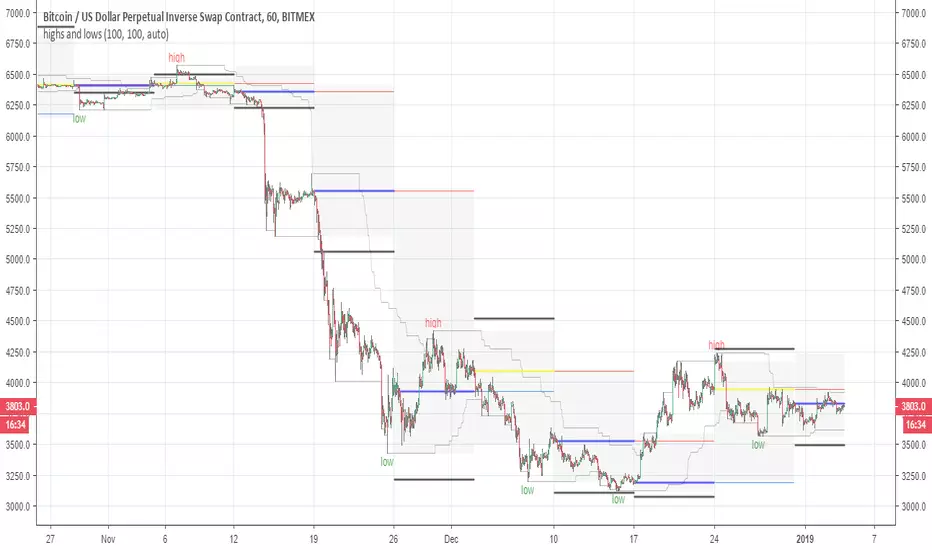
highs and lowsThis system allow you to detect the highs and the lows based on open and close and donchian channel
with this system you can easy find the resistance and the support level
good from 4 hour chart to 5 min chart
The black line are the 10% margin which you can use as you exit point or your stop once we find a low by the donochian cahannel
The system try to help you to find the target of your take profit once you decided to go either short or long
There is no alerts but they can be added if one wish to do it
one can add TP to it or change settings as he wish if want to play with code. I keep it as idea only
main scripts are made from scripts that are open in TV
15 min graph
4 hour graph
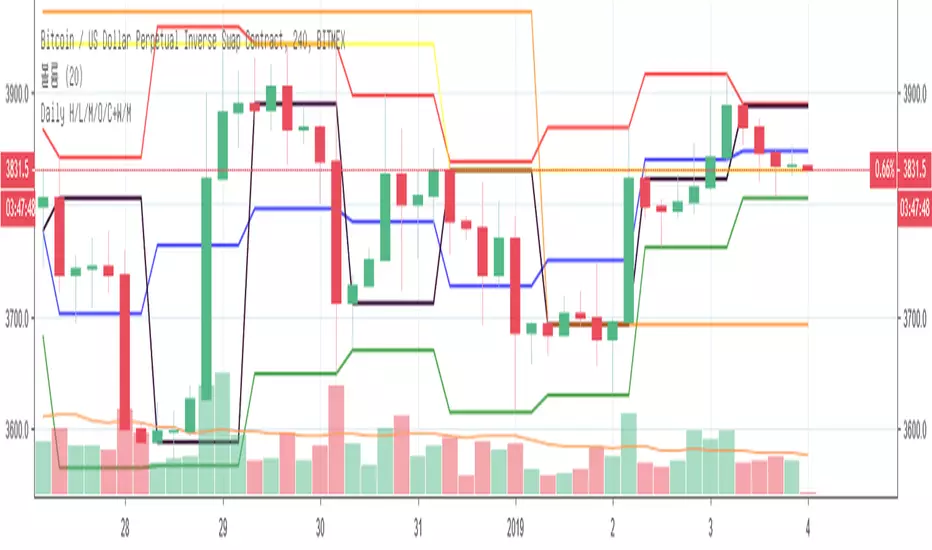
Daily High/Low/Mid/Open/CloseI modify existing scripts about Daily High/Low, Daily Open, Previous Daily Close, etc.
Daily High = red color
Daily Low = green color
Daily Mid = blue color
Daily Open = purple color
Previous Daily Close = black color