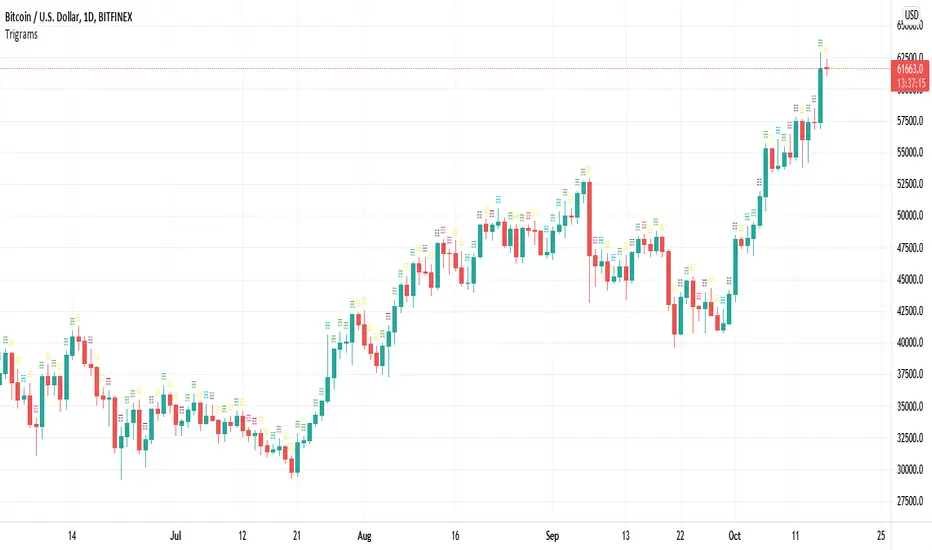
Three Week Tight Pattern IndicatorThree Week Tight Pattern is a consolidation indicator which give extra buy point on strong fundamental stocks. You can read about it from IBD here: www.investors.com
Search in scripts for "pattern"

Trigrams based on Candle PatternThis script matches a Trigram for the current candle from its pattern Bullish/Bearish: Marubozu, Hammer, Inverted Hammer, Spinning Top.
The source for Trigram to candlestick pattern can be found online. I'm missing the reputation to add the link here.
Heaven = Bearish Marubozu
Earth = Bullish Marubozu
Thunder = Bearish Spinning Top
Water = Bullish Inverted Hammer
Mountain = Bullish Hammer
Wind = Bullish Spinning Top
Flame = Bearish Hammer
Lake = Bearish Inverted Hammer
The idea is simple. It takes the current candles pattern to match the Trigram.
Inspired by the Trigram Script from ByzantineSC
Anyways, not sure what use it is yet, but if there is anyone else out there interested in I Ching, Yin/Yang theory and trading, this is for you.
Bull and Bear Marubozus Candlestick PatternMarubozus are an interesting candle pattern wherein the close and open of the candle are also the high / low points of the candle. In other words, a candle with no shadows or wicks.
How reliable are they, though? Probably not very reliable on their own. It may also depend on the size of the candle. You would probably want to incorporate this candle pattern with other filters, like RSI, MACD, to filter trade opportunities.

Bullflag Candlestick pattern
A bull flag is essentially a small consolidation near the top of an upthrust. If we picture it as a candlestick pattern, it should have a big green candlestick + a small body red/green candle near the top of the top big green candle.
This script essentially help you identify these.

L2 Candle Pattern ScalperLevel: 2
Background
Japanese candlesticks provide more detailed and accurate information about price movements compared to bar charts. They provide a graphical representation of the supply and demand behind the price promotions for each period. Each candlestick contains a central part that indicates the distance between the opening and closing of the security being traded, the area called the body.
Scalping is a trading strategy that aims to take advantage of minor changes in the stock price. Traders using this strategy place anywhere from 10 to a few hundred trades in a single day with the belief that small moves in the stock price are easier to catch than large ones. Traders who implement this strategy are known as scalpers. Lots of small wins can easily lead to big wins if a strict exit strategy is used to prevent big losses.
Function
L2 Candle Pattern Scalper utilizes candle pattern to decide long and short entry signal. It use inherent candles' relationship nearby to judge the market trend is up or down and decide to long or short.
Signal
buysmall --> long entry
exitred --> short entry
Pros and Cons
Pros:
1. its response is fast because OHLC candle is the raw source of market
2. it is suitable for scalping because it studies nearby candles to judge very short term trend change
Cons:
1. Mid-long term change is missing from this indicator, although I use fast and slow lines to indicate the mid-term trend.
2. No stop loss or take profit scheme is introduced.
Remarks
This is promising but need efforts to refine it.
Readme
In real life, I am a prolific inventor. I have successfully applied for more than 60 international and regional patents in the past 12 years. But in the past two years or so, I have tried to transfer my creativity to the development of trading strategies. Tradingview is the ideal platform for me. I am selecting and contributing some of the hundreds of scripts to publish in Tradingview community. Welcome everyone to interact with me to discuss these interesting pine scripts.
The scripts posted are categorized into 5 levels according to my efforts or manhours put into these works.
Level 1 : interesting script snippets or distinctive improvement from classic indicators or strategy. Level 1 scripts can usually appear in more complex indicators as a function module or element.
Level 2 : composite indicator/strategy. By selecting or combining several independent or dependent functions or sub indicators in proper way, the composite script exhibits a resonance phenomenon which can filter out noise or fake trading signal to enhance trading confidence level.
Level 3 : comprehensive indicator/strategy. They are simple trading systems based on my strategies. They are commonly containing several or all of entry signal, close signal, stop loss, take profit, re-entry, risk management, and position sizing techniques. Even some interesting fundamental and mass psychological aspects are incorporated.
Level 4 : script snippets or functions that do not disclose source code. Interesting element that can reveal market laws and work as raw material for indicators and strategies. If you find Level 1~2 scripts are helpful, Level 4 is a private version that took me far more efforts to develop.
Level 5 : indicator/strategy that do not disclose source code. private version of Level 3 script with my accumulated script processing skills or a large number of custom functions. I had a private function library built in past two years. Level 5 scripts use many of them to achieve private trading strategy.

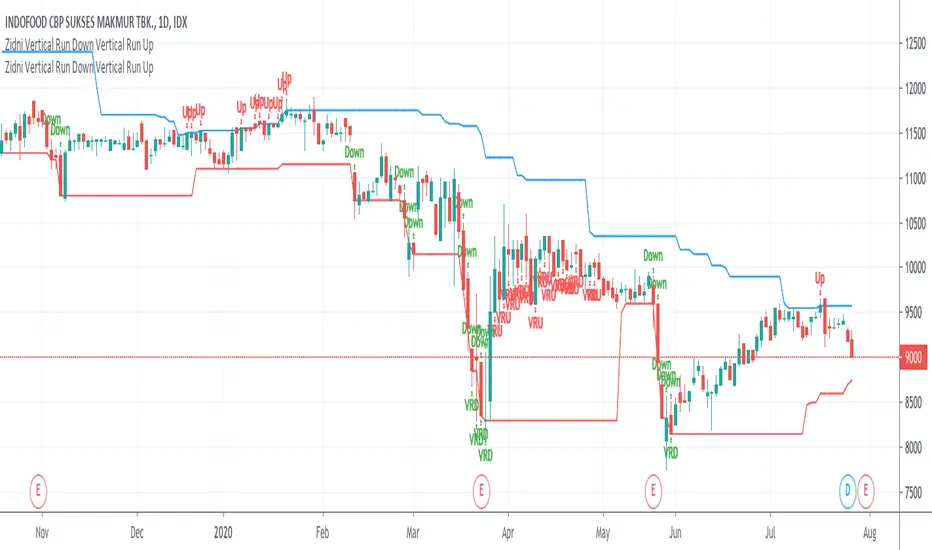
Zidni Vertical Run Down Vertical Run UpVertical Run Down and Vertical Run Up based on Tom Bulkowski Chart Pattern with elaboration in percentage of the drop and up.
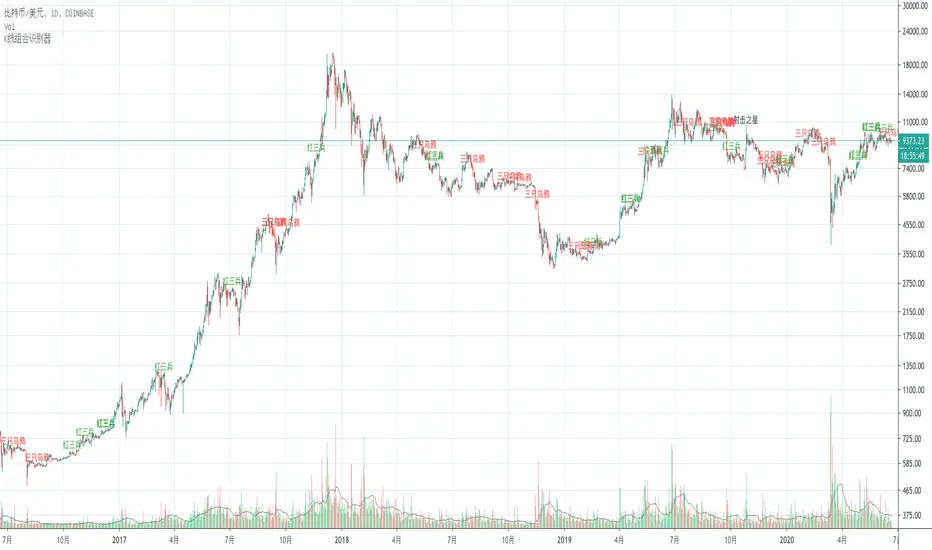
K线组合识别器(Candlestick Pattern Monitor)This is a Candlestick Pattern Monitor which design for Chinese.
这是一个K线组合的识别器。
本脚本的目的在于帮助使用中文的人了解该指标,特别是其用法。同时将该指标代码添加完整的中文注释,方便使用中文的人学习Pine语言。
K线组合是国内技术分析里最常见的分析方式之一。K线组合种类丰富,各类证券类书籍中均有总结,本识别器选取其中几种传播度最高几个K线组合,将其量化,使用机器辅助识别K线组合。
射击之星
射击之星,在股价运行的高位,一根中阳或者大阳线之后出现长上影K线,往往是较为强烈的看空信号,K线的实体部分很小或者为十字线,上影线一般为实体K线的两倍以上。
量化要点:
1 上一根K线须是一根实体高度必须大于最近10根K线实体平均值1.5倍;
2 上影线至少是实体的2倍;
3 下影线不大于实体的0.5倍。
乌云盖顶
乌云盖顶组合,第一根K线为大阳线或者中阳线,第二天跳空高开,第二根K线的开盘价远高于第一根K线的最高价,但是收盘却跌入第一根K线的实体部分,第二根K线收盘价越底,则拐点的信号越明确。
量化要点:
1 跳开,即当前K线开盘价大于上一根收盘价;
2 上一根K线须是一根实体高度必须大于最近10根K线实体平均值1.5倍;
3 当前K线收于前一根K线实体下半部分。
三只乌鸦
三只乌鸦组合的构成,股价上涨的高位区域,一根大阳线之后连续出现三根小阴线,每一根阴线都是跳空高开,但是收在当日最低附近。
量化要点:
1 连续三根阴线;
2 三根阴线的实体都小于最近十根K线实体的平均值。
下跌三部曲
下跌三部曲的构成,一根大阴线或者中阴线之后,随后的交易日连续三根价量逐日萎缩的小阳线,三根小阳线的最高价未能击破前面阴线的开盘价,随即股价重回下跌趋势,并再报收大阴线或者中阴线。
量化要点:
1 组合第一根K线为阴线;
2 组合的第二至第四根K线都为阳线;
3 第四根K线收盘价不高于第一根K线开盘价;
4 第五根K线为阴线,且收盘价低于第二根K线开盘价。
早晨之星
早晨之星由三根K线组合成,第一根是中阴线或者大阴线,第二根是小阳线或者小阴线,第三根为中阳线或者大阳线,如果第二根是十字线,也成为早晨之星,第三根阳线实体切入第一根阴线的实体之内,切入的幅度越大,信号越明确。
量化要点:
1 第一根K线为阴线,且实体高度大于最近十根K线实体的平均值的1.5倍;
2 第二根K线实体高度小于最近十根K线实体的平均值,且上影线小于实体的0.5倍,下影线大于实体的2倍;
3 第三根K线为阳线,且收盘价大于第一根K线开盘价。
红三兵
红三兵构成,三根上涨的小阳K线,如果出现在大跌之后的底部区域或者盘整区域,再配合成交量,往往成为上涨行情的先兆。
量化要点:
1 三根K线均为阳线;
2 三根K线的实体均小于最近十根K线实体的平均值。
指标局限性
因K线组合出现的频次均较高,所以K线组合需结合其他分析方式一起考虑。
Hikkake PatternLifted description from web:
Hikkake means to trap, trick, or ensnare. Primarily, this price pattern seeks to identify inside bar breakouts and profit from their failures.
An inside bar is a price bar that is entirely within the range of the preceding price bar. Inside bars are typical on price charts of most timeframes.
While you’ll often find inside bars in congested markets, they also offer a low-risk entry point for price action traders. The contracted range of an inside bar offers a natural tight stop-loss.
Hence, inside bar breakouts seem attractive. However, if you are patient and focus on identifying false breakouts, you might be able to find more reliable trading setups in the form of Hikkakes.
In a nutshell, the Hikkake pattern offers a systematic approach to trading false inside bar breakouts.
As a filter I incorporated VWAP into the code to only trigger Bullish / Bearish signals when price is Above/Below VWAP respectively. The ATR is used to create a Stop buffer (red cross) for the Entry signal ( green dot ). The R1 and R2 (orange squares) are two possible profit targets that are customizable to different Risk multiples based upon the difference between Entry and Stop.

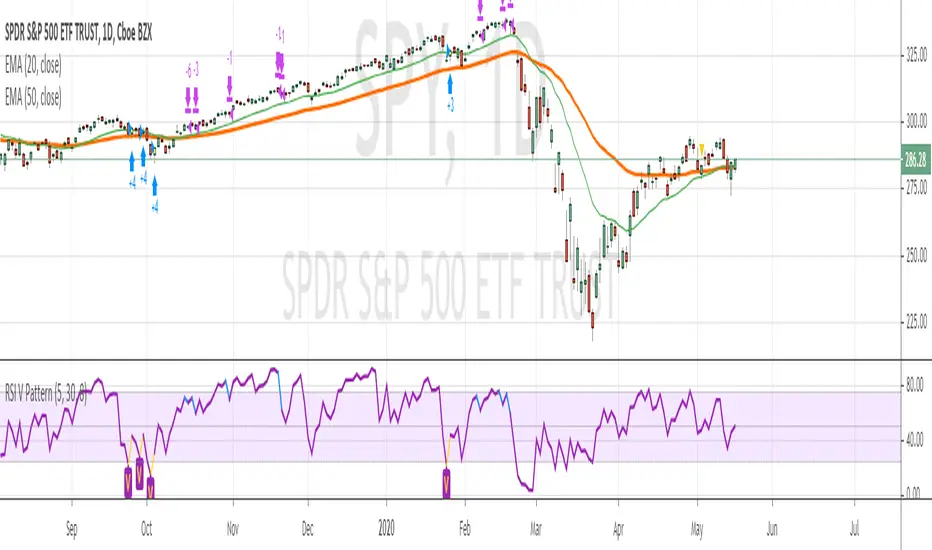
RSI V Pattern IndicatorThis is the indicator version of RSI V Pattern strategy
alertconditions added.
Note: This beta version , I still need to fix the color for the Exit when trade is not in Long ...

RSI V Pattern strategyThis strategy based on RSI for swing trading or short term trading
Strategy Rules
=============
LONG
1. ema20 is above ema50 --- candles are colored green on the chart
2. RSI value sharply coming up
previous candle1 low is previous candle2 low and previous candle1 RSI value is less than previous candle2
current candle RSI value is greater than previous candle1 and crossing above 30
above which makes a V shape on RSI indicator, colored in yellow on the chart , price bar is colored in yellow
3. Enter Long when the above V pattern occurs
EXIT LONG
1. when the RSI reaches 70 , close half position and move stop loss to up
2. when RSI reaches high value 90, close 3/4 position
3. when RSI crossing below 10 OR stopLoss hit , whichever happens first , close whole position
Note : take profit levels are colored in blue on RSI and Price candles
I have tested SPY , QQQ on daily chart , performance results are with 80% win rate and more than 3 profit factor
Happy Trading
Dark Cloud Cover Pattern Trading Setupthis study is another script based on the candlestick pattern . there are a few filters implemented to be applied to the output result to clear out noises. it sounds like finding real Dark Cloud Cover instances are too rare (interesting though!).
Dark Cloud Cover
it is a bearish reversal candlestick pattern where a down candle (typically bearish) opens above the close of the prior up candle (typically bullish) and then closes below the midpoint of the up candle. The five criteria for the Dark Cloud Cover pattern are:
An existing bullish uptrend.
An up (bullish) candle within that uptrend.
A gap up on the following day.
The gap up turns into a down (bearish) candle.
The bearish candle closes below the midpoint of the previous bullish candle.
all these criteria are implemented in code to produce a more accurate result.
please provide me with your valuable comments,
thanks for your attention,

Engulfing Pattern Hello Traders,
Sharing one of my favorite candlestick pattern with everyone. Feel free to use it.
Regards,
Intraday Guruji

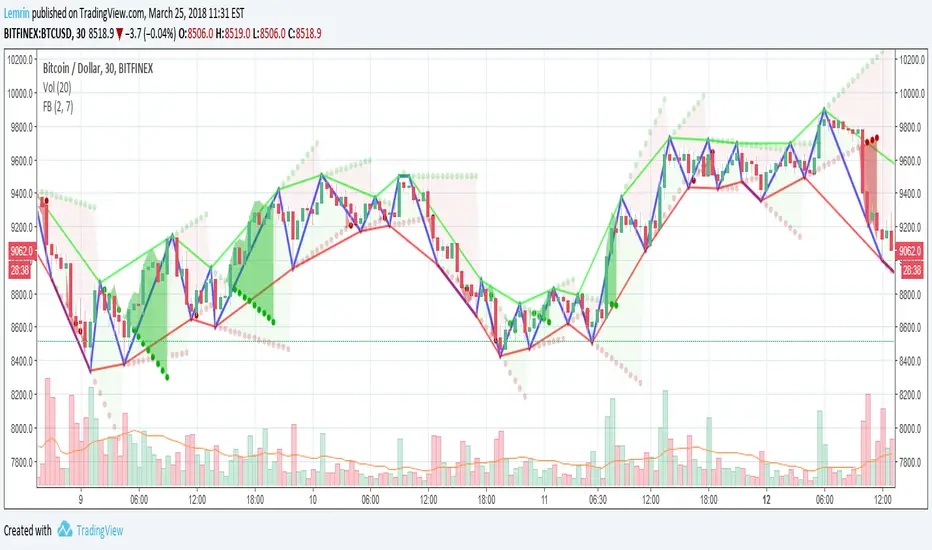
Fractal Breakout V2Version 2 of my fractal pattern aid ( Version 1 ).
I added a bouncing line between the high and low trend lines, connecting consecutive extreme points. I also chased down a pesky bug in the slope calculation...and for now I have disabled the ability to change resolution basis for extreme detection (e.g. 30m on a 1hr chart).
For fun, I added some shading to make it more apparent at a glance what is happening, but if you find it gimmicky, there's an option to turn that off.
I am inexperienced with pattern recognition, so please send feedback if you have any ideas that would make this more useful.
Thanks!
Lemrin
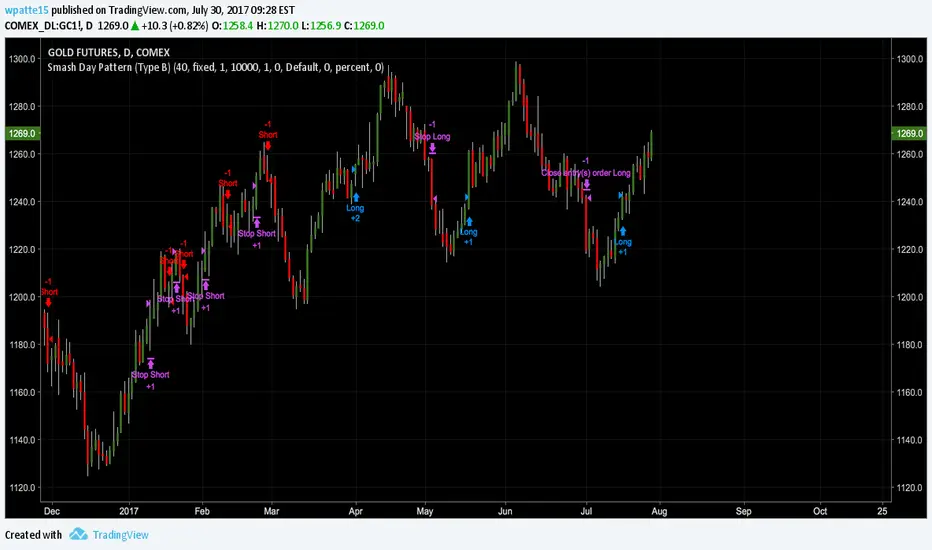
Smash Day Pattern (Type B)oxfordstrat.com
This is a pretty interesting strategy I found at the link above ^. I got pretty subpar results on equity, but on commodities it seems to work well as that is the same conclusion they came to in their research. I dropped the atr code that they had used because I couldn't think of anytime that would trigger where the hard stop would not have triggered already. The only profit exit this strategy uses is the time based exit so perhaps you could look to employ a take profit exit somewhere. Enjoy!

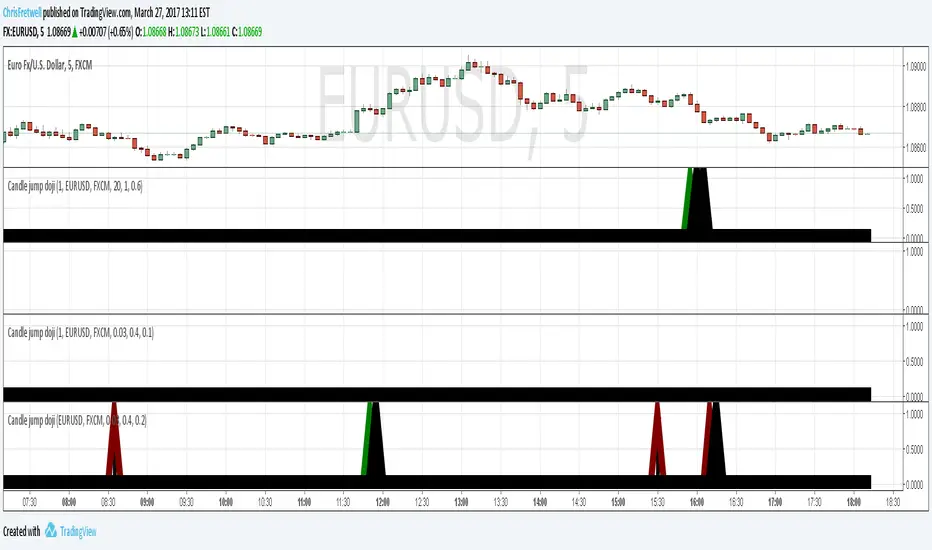
Candle pattern doji-harami just something I wipped together. Unused code still in script and left there for you to experiment with. simple classic doji candle pattern recognition code. Binary option use recommended. red arrow suggest down trade and green for up trade. if market direction fails then a black arrow pops up on next candle. this is to help quickly judge the accuracy while experimenting with input numbers.
Reversal Candle Pattern SetUp
An outside reversal candle set up script with buy/sell signals. Looks simple but it's pretty powerful especially if combined with your choice confirming indicator.
The pattern psychology is this one (Frank Ochoa explanation): " The power behind this pattern lies in the psychology behind the traders involved in this setup. If you have ever participated in a breakout at support or resistance only to have the market reverse sharply against you, then you are familiar with the market dynamics of this setup.
[Basically, market participants are testing the waters above resistance or below support to make sure there is no new business to be done at these levels. When no initiative buyers or sellers participate in range extension, responsive participants have all the information they need to reverse price back toward a new area of perceived value.
As you look at a bullish outside reversal pattern, you will notice that the current bar's low is lower than the
prior bar's low. Essentially, the market is testing the waters below recently established lows to see if a downside
follow-through will occur. When no additional selling pressure enters the market, the result is a flood of buying
pressure that causes a springboard effect, thereby shooting price above the prior bar's highs and creating the
beginning of a bullish advance."


Fakey pattern (Inside Bar False Breakout)Inside Bar + False-Breakout = Fakey pattern
A Fakey pattern can have a pin bar as the false-break bar or not. Fakey’s are a very important and potent price action trading strategy because they can help us identify stop-hunting and provide us with a very good clue as to what price might do next.

PatternsThis indicator is a combine of several indicators . I just put them together . I hope be useful.
best regard

PivotBoss Outside Reversal SetupPATTERN SUMMARY
1. The engulfing bar of a bullish outside reversal setup has a low that is below the prior bar's low (L < L ) and a
close that is above the prior bar's high (C > H ).
2. The engulfing bar of a bearish outside reversal setup has a high that is above the prior bar's high (H > H )
and a close that is below the prior bar's low (C < L ).
3. The engulfing bar is usually 5 to 25 percent larger than the size of the average bar in the lookback period.
PATTERN PSYCHOLOGY
The power behind this pattern lies in the psychology behind the traders involved in this setup. If you have
ever participated in a breakout at support or resistance only to have the market reverse sharply against you, then
you are familiar with the market dynamics of this setup. What exactly is going on at these levels? To understand
this concept is to understand the outside reversal pattern. Basically, market participants are testing the waters
above resistance or below support to make sure there is no new business to be done at these levels. When no
initiative buyers or sellers participate in range extension, responsive participants have all the information they
need to reverse price back toward a new area of perceived value.
As you look at a bullish outside reversal pattern, you will notice that the current bar's low is lower than the
prior bar's low. Essentially, the market is testing the waters below recently established lows to see if a downside
follow-through will occur. When no additional selling pressure enters the market, the result is a flood of buying
pressure that causes a springboard effect, thereby shooting price above the prior bar's highs and creating the
beginning of a bullish advance.
If you recall the child on the trampoline for a moment, you'll realize that the child had to force the bounce
mat down before he could spring into the air. Also, remember Jennifer the cake baker? She initially pushed price
to $20 per cake, which sent a flood of orders into her shop. The flood of buying pressure eventually sent the price
of her cakes to $35 apiece. Basically, price had to test the $20 level before it could rise to $35.
Let's analyze the outside reversal setup in a different light for a moment. One of the reasons I like this setup
is because the two-bar pattern reduces into the wick reversal setup, which we covered earlier in the chapter. If
you are not familiar with candlestick reduction, the idea is simple. You are taking the price data over two or more
candlesticks and combining them to create a single candlestick. Therefore, you will be taking the open, high, low,
and close prices of the bars in question to create a single composite candlestick.
Take a look at Figure 2.13, which illustrates the candlestick reduction of the outside reversal setup.
Essentially, taking the highest high and the lowest low over the two-bar period gives you the range of the
composite candlestick. Then, taking the opening price of the first candle and the closing price of the last candle
will finish off the composite candlestick. Depending on the structure of the bars of the outside reversal setup, the
result of the candlestick reduction will usually be the transformation into a wick reversal setup, which we know to
be quite powerful. Therefore, in many cases the physiology of the outside reversal pattern basically demonstrates
the inherent psychological traits of the wick reversal pattern. This is just another level of analysis that reinforces
my belief in the outside reversal setup.

PivotBoss Wick Reversal SetupPATTERN SUMMARY
1. The body is used to determine the size oftlle reversal wick. A wick tllat is between 2.5 to 3.5 times larger than
the size of the body is ideal.
2. For a bullish reversal wick to exist, tlle close ofthe bar should fall witllin tlle top 35 percent of the overall range
of the candle.
3. For a bearish reversal wick to exist, the close of the bar should fall within the bottom 35 percent of the overall
range of the candle.
PATTERN PSYCHOLOGY
Figure 2-4 shows several types of bullish and bearish reversal wick candlesticks that can all signal
profitable reversal opportunities in the market, especially if these patterns are paired with key pivot levels. In
traditional candlestick jargon, these particular candlesticks would have names ranging from hammer , hanging
man, inverted hammer , shooting star , gravestone doji , or dragonfly doji , depending on where the candle is
placed in a trend. Now you can see why I simply call these candlesticks wicks, or even tails. Instead of fumbling
over the proper naming of these candlesticks , I believe it is more important to know what these patterns
represent. What are they telling you?
Types of Candlestick Reversal Wicks
When the market has been trending lower then suddenly forms a reversal wick candlestick , the likelihood of
a reversal increases since buyers have finally begun to overwhelm the sellers. Selling pressure rules the decline,
but responsive buyers entered the market due to perceived undervaluation. For the reversal wick to open near the
high of the candle, sell off sharply intra-bar, and then rally back toward the open of the candle is bullish , as it
signifies that the bears no longer have control since they were not able to extend the decline of the candle, or the
trend. Instead, the bulls were able to rally price from the lows of the candle and close the bar near the top of its
range, which is bullish - at least for one bar, which hadn't been the case during the bearish trend (see Figure 2.5).
The Stages of a Reversal Wick
Stage 1 Stage 2 Stage 3
Essentially, when a reversal wick forms at the extreme of a trend, the market is telling you that the trend
either has stalled or is on the verge of a reversal. Remember, the market auctions higher in search of sellers, and
lower in search of buyers. When the market over-extends itself in search of market participants, it will find itself
out of value, which means responsive market participants will look to enter the market to push price back toward
an area of perceived value. This will help price find a value area for two-sided trade to take place. When the
market finds itself too far out of value, responsive market participants will sometimes enter the market with
force, which aggressively pushes price in the opposite direction, essentially forming reversal wick candlesticks .
This pattern is perhaps the most telling and common reversal setup, but requires steadfast confirmation in order
to capitalize on its power. Understanding the psychology behind these formations and learning to identify them
quickly will allow you to enter positions well ahead of the crowd, especially if you've spotted these patterns at
potentially overvalued or undervalued areas.

PivotBoss Extreme Reversal SetupPATTERN SUMMARY
1. The first bar of the pattern is about two times larger than the average size of the candles in the lookback
period.
2. The body of the first bar of the pattern should encompass more than 50 percent of the bar's total range, but
usually not more than 85 percent.
3. The second bar of the pattern opposes the first. If the first bar of the pattern is bullish (C > 0), then the second
bar must be bearish (C < 0). If the first bar is bearish (C < 0), then the second bar must be bullish (C > 0).
PATTERN PSYCHOLOGY
The extreme reversal setup is a clever pattern that capitalizes on the ongoing psychological patterns of
investors, traders, and institutions. Basically, the setup looks for an extreme pattern of selling pressure and then
looks to fade this behavior to capture a bullish move higher (reverse for shorts). In essence, this setup is visually
pointing out oversold and overbought scenarios that forces responsive buyers and sellers to come out of the dark
and put their money to work-price has been over-extended and must be pushed back toward a fair area of value
so two-sided trade can take place.
This setup works because many normal investors, or casual traders, head for the exits once their trade
begins to move sharply against them. When this happens, price becomes extremely overbought or oversold,
creating value for responsive buyers and sellers. Therefore, savvy professionals will see that price is above or
below value and will seize the opportunity. When the scared money is selling, the smart money begins to buy, and
Vice versa.
Look at it this way, when the market sells off sharply in one giant candlestick, traders that were short
during the drop begin to cover their profitable positions by buying. Likewise, the traders that were on the
sidelines during the sell-off now see value in lower prices and begin to buy, thus doubling up on the buying
pressure. This helps to spark a sharp v-bottom reversal that pushes price in the opposite direction back toward
fair value.
