Auto AI Trendlines [TradingFinder] Clustering & Filtering Trends🔵 Introduction
Auto AI trendlines Clustering & Filtering Trends Indicator, draws a variety of trendlines. This auto plotting trendline indicator plots precise trendlines and regression lines, capturing trend dynamics.
Trendline trading is the strongest strategy in the financial market.
Regression lines, unlike trendlines, use statistical fitting to smooth price data, revealing trend slopes. Trendlines connect confirmed pivots, ensuring structural accuracy. Regression lines adapt dynamically.
The indicator’s ascending trendlines mark bullish pivots, while descending ones signal bearish trends. Regression lines extend in steps, reflecting momentum shifts. As the trend is your friend, this tool aligns traders with market flow.
Pivot-based trendlines remain fixed once confirmed, offering reliable support and resistance zones. Regression lines, adjusting to price changes, highlight short-term trend paths. Both are vital for traders across asset classes.
🔵 How to Use
There are four line types that are seen in the image below; Precise uptrend (green) and downtrend (red) lines connect exact price extremes, while Pivot-based uptrend and downtrend lines use significant swing points, both remaining static once formed.
🟣 Precise Trendlines
Trendlines only form after pivot points are confirmed, ensuring reliability. This reduces false signals in choppy markets. Regression lines complement with real-time updates.
The indicator always draws two precise trendlines on confirmed pivot points, one ascending and one descending. These are colored distinctly to mark bullish and bearish trends. They remain fixed, serving as structural anchors.
🟣 Dynamic Regression Lines
Regression lines, adjusting dynamically with price, reflect the latest trend slope for real-time analysis. Use these to identify trend direction and potential reversals.
Regression lines, updated dynamically, reflect real-time price trends and extend in steps. Ascending lines are green, descending ones orange, with shades differing from trendlines. This aids visual distinction.
🟣 Bearish Chart
A Bullish State emerges when uptrend lines outweigh or match downtrend lines, with recent upward momentum signaling a potential rise. Check the trend count in the state table to confirm, using it to plan long positions.
🟣 Bullish Chart
A Bearish State is indicated when downtrend lines dominate or equal uptrend lines, with recent downward moves suggesting a potential drop. Review the state table’s trend count to verify, guiding short position entries. The indicator reflects this shift for strategic planning.
🟣 Alarm
Set alerts for state changes to stay informed of Bullish or Bearish shifts without constant monitoring. For example, a transition to Bullish State may signal a buying opportunity. Toggle alerts On or Off in the settings.
🟣 Market Status
A table summarizes the chart’s status, showing counts of ascending and descending lines. This real-time overview simplifies trend monitoring. Check it to assess market bias instantly.
Monitor the table to track line counts and trend dominance.
A higher count of ascending lines suggests bullish bias. This helps traders align with the prevailing trend.
🔵 Settings
Number of Trendlines : Sets total lines (max 10, min 3), balancing chart clarity and trend coverage.
Max Look Back : Defines historical bars (min 50) for pivot detection, ensuring robust trendlines.
Pivot Range : Sets pivot sensitivity (min 2), adjusting trendline precision to market volatility.
Show Table Checkbox : Toggles display of a table showing ascending/descending line counts.
Alarm : Enable or Disable the alert.
🔵 Conclusion
The multi slopes indicator, blending pivot-based trendlines and dynamic regression lines, maps market trends with precision. Its dual approach captures both structural and short-term momentum.
Customizable settings, like trendline count and pivot range, adapt to diverse trading styles. The real-time table simplifies trend monitoring, enhancing efficiency. It suits forex, stocks, and crypto markets.
While trendlines anchor long-term trends, regression lines track intraday shifts, offering versatility. Contextual analysis, like price action, boosts signal reliability. This indicator empowers data-driven trading decisions.
Search in scripts for "pivot points"

Dow Theory Trend StrategyDow Theory Trend Strategy (Pine Script)
Overview
This Pine Script implements a trading strategy based on the core principles of Dow Theory. It visually identifies trends (uptrend, downtrend) by analyzing pivot highs and lows and executes trades when the trend direction changes. This script is an improved version that features refined trend determination logic and strategy implementation.
Core Concept: Dow Theory
The script uses a fundamental Dow Theory concept for trend identification:
Uptrend: Characterized by a series of Higher Highs (HH) and Higher Lows (HL).
Downtrend: Characterized by a series of Lower Highs (LH) and Lower Lows (LL).
How it Works
Pivot Point Detection:
It uses the built-in ta.pivothigh() and ta.pivotlow() functions to identify significant swing points (potential highs and lows) in the price action.
The pivotLookback input determines the number of bars to the left and right required to confirm a pivot. Note that this introduces a natural lag (equal to pivotLookback bars) before a pivot is confirmed.
Improved Trend Determination:
The script stores the last two confirmed pivot highs and the last two confirmed pivot lows.
An Uptrend (trendDirection = 1) is confirmed only when the latest pivot high is higher than the previous one (HH) AND the latest pivot low is higher than the previous one (HL).
A Downtrend (trendDirection = -1) is confirmed only when the latest pivot high is lower than the previous one (LH) AND the latest pivot low is lower than the previous one (LL).
Key Improvement: If neither a clear uptrend nor a clear downtrend is confirmed based on the latest pivots, the script maintains the previous trend state (trendDirection := trendDirection ). This differs from simpler implementations that might switch to a neutral/range state (e.g., trendDirection = 0) more frequently. This approach aims for smoother trend following, acknowledging that trends often persist through periods without immediate new HH/HL or LH/LL confirmations.
Trend Change Detection:
The script monitors changes in the trendDirection variable.
changedToUp becomes true when the trend shifts to an Uptrend (from Downtrend or initial state).
changedToDown becomes true when the trend shifts to a Downtrend (from Uptrend or initial state).
Visualizations
Background Color: The chart background is colored to reflect the currently identified trend:
Blue: Uptrend (trendDirection == 1)
Red: Downtrend (trendDirection == -1)
Gray: Initial state or undetermined (trendDirection == 0)
Pivot Points (Optional): Small triangles (shape.triangledown/shape.triangleup) can be displayed above pivot highs and below pivot lows if showPivotPoints is enabled.
Trend Change Signals (Optional): Labels ("▲ UP" / "▼ DOWN") can be displayed when a trend change is confirmed (changedToUp / changedToDown) if showTrendChange is enabled. These visually mark the potential entry points for the strategy.
Strategy Logic
Entry Conditions:
Enters a long position (strategy.long) using strategy.entry("L", ...) when changedToUp becomes true.
Enters a short position (strategy.short) using strategy.entry("S", ...) when changedToDown becomes true.
Position Management: The script uses strategy.entry(), which automatically handles position reversal. If the strategy is long and a short signal occurs, strategy.entry() will close the long position and open a new short one (and vice-versa).
Inputs
pivotLookback: The number of bars on each side to confirm a pivot high/low. Higher values mean pivots are confirmed later but may be more significant.
showPivotPoints: Toggle visibility of pivot point markers.
showTrendChange: Toggle visibility of the trend change labels ("▲ UP" / "▼ DOWN").
Key Improvements from Original
Smoother Trend Logic: The trend state persists unless a confirmed reversal pattern (opposite HH/HL or LH/LL) occurs, reducing potential whipsaws in choppy markets compared to logic that frequently resets to neutral.
Strategy Implementation: Converted from a pure indicator to a strategy capable of executing backtests and potentially live trades based on the Dow Theory trend changes.
Disclaimer
Dow Theory signals are inherently lagging due to the nature of pivot confirmation.
The effectiveness of the strategy depends heavily on the market conditions and the chosen pivotLookback setting.
This script serves as a basic template. Always perform thorough backtesting and implement proper risk management (e.g., stop-loss, take-profit, position sizing) before considering any live trading.

Harish algo for nifty and bankniftyHarish algo for nifty and banknifty
Overview
Harish Algo - Buy and Sell 11 is a powerful trading indicator designed for intraday traders, incorporating multiple technical analysis concepts to identify potential breakout and breakdown levels. It uses pivot points, exponential moving averages (EMAs), and volatility-based levels to generate buy and sell signals with visual markers for better decision-making.
Features & Functionality
✅ Pivot Points Calculation:
The indicator calculates daily pivot points along with resistance (R1) and support (S1) levels.
Helps in identifying potential reversal or breakout areas.
✅ EMA Trend Confirmation:
Uses three EMAs (21, 55, and 200) to confirm trend direction.
Ensures that buy signals align with uptrends and sell signals align with downtrends.
✅ 15-Minute Candle Analysis for Precision:
Captures the last three 15-minute closes of the previous day.
Computes an average and determines volatility-based price levels to anticipate price movements.
✅ Dynamic Buy & Sell Signals:
Bullish (Buy) Signals:
Price breaks above key resistance levels and EMAs confirm an uptrend.
Displayed as yellow (tiny) or green (small) upward triangles below candles.
Bearish (Sell) Signals:
Price drops below key support levels with EMA confirmation of a downtrend.
Displayed as fuchsia (tiny) or red (small) downward triangles above candles.
✅ Alerts for Trade Execution:
Get notified instantly with alerts when a buy or sell signal is triggered.
✅ Customizable Settings:
Modify EMA lengths and adjust parameters to fit different trading strategies.
Usage & Benefits
🔹 Helps traders identify potential entry and exit points with precision.
🔹 Reduces false signals by combining pivot points, EMAs, and price action.
🔹 Works best for intraday traders in the Indian stock markets, but can be applied to other markets as well.
🔹 Suitable for both beginners and experienced traders looking for a structured approach to trading.
How to Use
Add the indicator to your chart.
Observe the plotted pivot points, EMAs, and price levels.
Watch for triangle markers (buy/sell signals).
Use alerts to receive real-time notifications.
Combine with your own risk management strategy for best results.
🔹 Works on all timeframes but optimized for intraday trading.
Disclaimer
📢 This indicator is for educational purposes only and should not be considered financial advice. Always perform your own analysis before taking trades.

measure last swing [keypoems]MEASURE LAST SWING
Version: v0.0.7
An indicator for measuring market swings and calculating position sizing based on pivot points and risk parameters. Helps traders visualize price swings and automatically compute position sizes based on their desired risk amount.
FEATURES:
• Identifies and tracks last pivot point in price action
• Displays visual measurements of price swing
• Calculates position sizes based on risk parameters
• Supports major futures contracts with automatic multiplier detection
HOW IT WORKS:
The indicator detects pivot highs and lows using your specified pivot strength, then draws measurement lines and calculates position sizes based on your risk parameters. It automatically cleans up old drawings when new pivot points are identified.
INPUT PARAMETERS:
General Settings:
• Risk Amount - Amount you want to risk per trade
• Pivot Strength - Bars required on either side to confirm a pivot
• Offset - Number of bars to offset the vertical line
Visual Settings:
• Horizontal and Vertical Lines - Customizable colors, widths (1-4), and styles
• Labels - Adjustable text color and size
CONTRACT MULTIPLIERS:
Automatically detects and applies the correct multiplier:
• ES (E-mini S&P 500): 50.0
• MES (Micro E-mini S&P 500): 5.0
• NQ (E-mini Nasdaq): 20.0
• MNQ (Micro E-mini Nasdaq): 2.0
• YM (E-mini Dow): 5.0
• MYM (Micro E-mini Dow): 0.5
• Other symbols: 1.0 (default)
DISPLAY ELEMENTS:
1. Horizontal line showing the level of the last pivot point
2. Vertical line measuring the distance to current price
3. Distance label showing point distance
4. Risk/Position label showing risk amount and calculated position size
POSITION SIZING:
Position Size = Floor(Risk Amount / (Distance in Points × Contract Multiplier))
IDEAL FOR:
• Measuring price swings for technical analysis
• Position sizing based on risk management rules
• Identifying potential entry and exit points
• Visual analysis of market structure
• Risk management automation

Support/Resistance Strength [UAlgo]The Support/Resistance Strength indicator is a tool designed for traders seeking a precise understanding of key support and resistance levels in the market. This tool dynamically identifies and visualizes support and resistance zones based on pivot points and strength criteria, providing traders with actionable insights for better decision-making.
By incorporating features such as ATR-based or percentage-based channel calculations, customizable strength thresholds, and intuitive visualization of key levels, the indicator caters to traders of various skill levels and strategies. It also adapts dynamically to market conditions, allowing users to identify frequently tested zones with minimal manual input.
🔶 Key Features
Dynamic Support and Resistance Zones
Automatically detects significant support and resistance levels using pivot high and low calculations.
Offers ATR-based or percentage-based channel customization to cater to diverse trading styles.
Customizable Parameters
Lookback period for pivot calculations, strength threshold, and maximum stored pivots are fully adjustable.
Display options for showing specific numbers of recent support/resistance lines.
Intuitive Visualization
Highlights key support and resistance levels with color-coded lines and labels.
Includes percentage deviation from the current price for quick assessment.
Interactive Updates
Continuously updates support and resistance levels to reflect changing market dynamics.
Displays pivot points visually for enhanced clarity.
Can be used effectively on various timeframes, from intraday to daily and weekly charts.
🔶 Interpreting the Indicator
Identifying Key Levels
Support levels are indicated by green (lime) lines and resistance levels by red lines. The transparency of colors is adjustable for visual preference.
Labels display the exact price level and the percentage difference from the current price.
Strength Threshold
The "Minimum S/R Strength" parameter defines how frequently a level must be tested to be considered significant.
Higher strength values indicate zones that have been tested more frequently, suggesting stronger support or resistance.
Pivot Points
The indicator marks pivot high and low points on the chart to provide a visual representation of the calculated levels.
Dynamic Updates
The indicator adapts to the most recent price action. If the price moves above a resistance level or below a support level, the color of the lines and labels will dynamically change to reflect the current price positioning.
🔶 Disclaimer
Use with Caution: This indicator is provided for educational and informational purposes only and should not be considered as financial advice. Users should exercise caution and perform their own analysis before making trading decisions based on the indicator's signals.
Not Financial Advice: The information provided by this indicator does not constitute financial advice, and the creator (UAlgo) shall not be held responsible for any trading losses incurred as a result of using this indicator.
Backtesting Recommended: Traders are encouraged to backtest the indicator thoroughly on historical data before using it in live trading to assess its performance and suitability for their trading strategies.
Risk Management: Trading involves inherent risks, and users should implement proper risk management strategies, including but not limited to stop-loss orders and position sizing, to mitigate potential losses.
No Guarantees: The accuracy and reliability of the indicator's signals cannot be guaranteed, as they are based on historical price data and past performance may not be indicative of future results.

Swing Points [CrossTrade]The "Swing Points" indicator is designed to help identify key swing points, trends, and potential support and resistance areas on a trading chart. This indicator overlays on the price chart and offers several features for enhanced market analysis.
Swing Point Identification: The indicator identifies swing highs and lows (pivot points) over a user-defined period. These points are crucial in understanding market reversals and momentum.
Swing Points Display: Users have the option to visually display these pivot points on the chart. Swing highs are marked with a red "H" above the bar, and swing lows with a green "L" below the bar, aiding in quick visual identification.
Center Line Calculation and Display: A dynamic center line is calculated using the pivot points, providing a baseline that adapts to market movements. The center line's appearance changes based on its position relative to the current price, making it a useful trend indicator.
Support and Resistance Levels: The indicator plots horizontal support and resistance lines based on the swing lows and highs, respectively. This feature helps traders identify potential areas of price consolidation or breakout.
Customization Options: Users can customize the period for swing point calculation and choose whether to display the pivot points, center line, and support/resistance levels.
Alert Features
Swing High Break Alert: An alert is triggered when a new swing high is detected, signaling a potential upward momentum shift.
Swing Low Break Alert: This alert activates when a new swing low is formed, possibly indicating a downward momentum shift.
Center Line Trend Color Change Alert: Alerts users when the center line changes its trend color, which could signify a change in overall market trend direction.

Statistical RSI Pivot Reversal Indicator [UAlgo]🔶 Idea
The "Statistical RSI Pivot Reversal Indicator " is designed to enhance traditional RSI analysis by incorporating statistical methods to identify potential reversal points more accurately. The core concept is to detect frequently occurring pivot points in the RSI data, which can indicate strong support or resistance levels. By analyzing the most frequent RSI values at these pivots, the script provides traders with clearer signals for potential market reversals, helping to improve the timing of entry and exit points in their trading strategies.
🔶 Key Features
Enhanced RSI Analysis:
This script calculates the Relative Strength Index (RSI) based on user-defined parameters and identifies pivot points in the RSI data. By analyzing these pivots, it detects the most frequently occurring RSI values at support and resistance levels.
Signal Filtering Options:
Filter buy and sell signals based on whether the RSI is in overbought (above 70) or oversold (below 30) conditions, enhancing the reliability of signals.
Visual and Alert Features:
Visual Signals: The script plots the RSI, the most frequent high and low RSI values, and buy/sell signals on the chart.
Alerts: Set up custom alerts for buy and sell conditions, ensuring you never miss a trading opportunity.
🔶 Disclaimer
The "Statistical RSI Pivot Reversal Indicator " script is intended for educational and informational purposes only.
It does not constitute financial advice or investment recommendations.
Trading financial instruments involves risk, and it is possible to lose more than your initial investment. Past performance is not indicative of future results.

Fib Pivot Points HLThis TradingView indicator allows users to select a specific timeframe (TF) and then analyzes the high, low, and closing prices from the past period within that TF to calculate a central pivot point. The pivot point is determined using the formula (High + Close + Low) / 3, providing a key level around which the market is expected to pivot or change direction.
In addition to the central pivot point, the indicator enhances its utility by incorporating Fibonacci levels. These levels are calculated based on the range from the low to the high of the selected timeframe. For instance, a Fibonacci level like R0.38 would be calculated by adding 38% of the high-low range to the pivot point, giving traders potential resistance levels above the pivot.
Key features of this indicator include:
Timeframe Selection: Users can choose their desired timeframe, such as weekly, daily, etc., for analysis.
Pivot Point Calculation: The indicator calculates the pivot point based on the previous period's high, low, and closing prices within the selected timeframe.
Fibonacci Levels: Adds Fibonacci retracement levels to the pivot point, offering traders additional layers of potential support and resistance based on the natural Fibonacci sequence.
This indicator is particularly useful for traders looking to identify potential turning points in the market and key levels of support and resistance based on historical price action and the Fibonacci sequence, which is widely regarded for its ability to predict market movements.
Example:
Suppose you're analyzing the EUR/USD currency pair using this indicator with a weekly timeframe setting. The previous week's price action showed a high of 1.2100, a low of 1.1900, and the week closed at 1.2000.
Using the formula ( High + Close + Low ) / 3 (High+Close+Low)/3, the pivot point would be calculated as ( 1.2100 + 1.2000 + 1.1900 ) / 3 = 1.2000. Thus, the central pivot point for the current week is at 1.2000.
The range from the low to the high is 1.2100 − 1.1900 = 0.0200 1.2100−1.1900=0.0200.
To calculate a specific Fibonacci level, such as R0.38, you would add 38% of the high-low range to the pivot point: 1.2000 + ( 0.0200 ∗ 0.38 ) = 1.2076 1.2000+(0.0200∗0.38)=1.2076. Thus, the R0.38 Fibonacci resistance level is at 1.2076.
Similarly, you can calculate other Fibonacci levels such as S0.38 (Support level at 38% retracement) by subtracting 38% of the high-low range from the pivot point.
Traders can use the pivot point as a reference for the market's directional bias: prices above the pivot point suggest bullish sentiment, while prices below indicate bearish sentiment. The Fibonacci levels act as potential stepping stones for price movements, offering strategic points for entry, exit, or placing stop-loss orders.

Smart Money Oscillator [ChartPrime]The "Smart Money Oscillator " is a premium and discount zone oscillator with BOS and CHoCH built in for further analysis of price action. This indicator works by first determining the the premium and discount zones by using pivot points and high/lows. The top of this oscillator represents the current premium zone while the bottom half of this oscillator represents the discount zone. This oscillator functionally works like a stochastic oscillator with more sophisticated upper and lower bounds generated using smart money concept theories. We have included a moving average to allow the user to visualize the currant momentum in the oscillator. Another key feature we have included lagging divergences to help traders visualize potential reversal conditions.
Understanding the concepts of Premium and Discount zones, as well as Break of Structure (BoS) and Change of Character (CHoCH), is crucial for traders using the Smart Money Oscillator. These concepts are rooted in market structure analysis, which involves studying price levels and movements.
Premium Zone is where the price is considered to be relatively high or 'overbought'. In this zone, prices have risen significantly and may indicate that the asset is becoming overvalued, potentially leading to a reversal or slowdown in the upward trend.
The Discount Zone represents a 'discount' or 'oversold' area. Here, prices have fallen substantially, suggesting that the asset might be undervalued. This could be an indicator of a potential upward reversal or a pause in the downward trend.
Break of Structure (BoS) is about the continuation of a trend. In a bullish trend, a BoS is identified by the break of a recent higher high. In a bearish trend, it's the break of a recent Lower Low. BoS indicates that the trend is strong and likely to continue in its current direction. It's a sign of strength in the prevailing trend, whether up or down.
Change of Character (CHoCH) is an indication of a potential end to a trend. It occurs when there's a significant change in the market's behavior, contradicting the current trend. For example, in an uptrend characterized by higher highs and higher lows, a CHoCH may occur if a new high is formed but then is followed by an impulsive move downwards. This suggests that the bullish trend may be weakening and a bearish reversal could be imminent. CHoCH is essentially a sign of trend exhaustion and potential reversal.
With each consecutive BoS, the signal line of the oscillator will deepen in color. This allows you to visually see the strength of the current trend. The maximum strength of the trend is found by keeping track of the maximum number of consecutive BoS's within a window of 10. This calculation excludes periods without any BoS's to allow for a more stable max.
Quick Update is a feature that implements a more aggressive algorithm to update the highs and lows. Instead of updating the pivot points exclusively to update the range levels, it will attempt to use the current historical highs/lows to update the bounds. This results in a more responsive range at the cost of stability. There are pros and cons for both settings. With Quick Update disabled, the indicator will allow for strong reversals to register without the indicator maxing out. With Quick Update enabled, the indicator will show shorter term extremes with the risk of the signal being pinned to the extremities during strong trends or large movements. With Quick Update disabled, the oscillator prioritizes stability, using a more historical perspective to set its bounds. When Quick Update is enabled, the oscillator becomes more responsive, adjusting its bounds rapidly to reflect the latest market movements.
The Scale Offset feature allows the indicator to break the boundaries of the oscillator. This can be useful when the market is breaking highs or lows allowing the user to identify extremities in price. With Scale Offset disabled the oscillator will always remain inside of the boundaries because the extremities will be updated instantly. When this feature is enabled it will update the boundaries one step behind instead of updating it instantly. This allows the user to more easily see overbought and oversold conditions at the cost of incurring a single bar lag to the boundaries. Generally this is a good idea as this behavior makes the oscillator more sensitive to recent price spikes or drops, reflecting sudden market movements more accurately. It accentuates the extremities of the market conditions, potentially offering a more aggressive analysis. The main trade-off with the Scale Offset feature is between sensitivity and potential overreaction. It offers a more immediate and exaggerated reflection of market conditions but might also lead to misinterpretations in certain scenarios, especially in highly volatile markets.
Divergence is used to predict potential trend reversals. It occurs when the price of an asset and the reading of an oscillator move in opposite directions. This discrepancy can signal a weakening of the current trend and possibly indicate a potential reversal.
Divergence doesn't always lead to a trend reversal, but it's a warning sign that the current trend might be weakening. Divergence can sometimes give false signals, particularly in strongly trending markets where the oscillator may remain in overbought or oversold conditions for extended periods. The lagging nature of using pivot points to calculate divergences means that all divergences are limited by the pivot look forward input. The upside of using a longer look forward is that the divergences will be more accurate. The obvious con here is that it will be more delayed and might be useless by the time it appears. Its recommended to use the built in divergences as a way to learn how these are formed so you can make your own in real time.
By default, the oscillator uses a smoothing of 3 to allow for a more price like behavior while still being rather smooth compared to raw price data. Conversely, you can increase this value to make this indicator behave smoother. Something to keep in mind is that the amount of delay from real time is equal to half of the smoothing period.
We have included a verity of alerts in this indicator. Here is a list of all of the available alerts: Bullish BOS, Bearish BOS, Bullish CHoCH, Bearish CHoCH, Bullish Divergence, Hidden Bullish Divergence, Bearish Divergence, Hidden Bearish Divergence, Cross Over Average, Cross Under Average.
Below are all of the inputs and their tooltips to get you started:
Settings:
Smoothing: Specifies the degree of smoothing applied to the oscillator. Higher values result in smoother but potentially less responsive signals.
Average Length: Sets the length of the moving average applied to the oscillator, affecting its sensitivity and smoothness.
Pivot Length: Specifies the forward-looking length for pivot points, affecting how the oscillator anticipates future price movements. This directly impacts the delay in finding a pivot.
Max Length: Sets the maximum length to consider for calculating the highest values in the oscillator.
Min Length: Defines the minimum length for calculating the lowest values in the oscillator.
Quick Update: Activates a faster update mode for the oscillator's extremities, which may result in less stable range boundaries.
Scale Offset: When enabled, delays updating minimum and maximum values to enhance signal directionality, allowing the signal to occasionally exceed normal bounds.
Candle Color: Enables coloring of candles based on the current directional signal of the oscillator.
Labels:
Enable BOS/CHoCH Labels: Activates the display of BOS (Break of Structure) and CHoCH (Change of Character) labels on the chart.
Visual Padding: Turns on additional visual padding at the top and bottom of the chart to accommodate labels. Determines the amount of visual padding added to the chart for label display.
Divergence:
Divergence Pivot: Defines the number of bars to the right of the pivot in divergence calculations, influencing the oscillator's responsiveness.
Divergence Pivot Forward: Directly impacts latency. Longer periods results in more accurate results at the sacrifice of delay.
Upper Range: Sets the upper range limit for divergence calculations, influencing the oscillator's sensitivity to larger trends.
Lower Range: Determines the lower range limit for divergence calculations, affecting the oscillator's sensitivity to shorter trends.
Symbol: Allows selection of the label style for divergence indicators, with options for text or symbolic representation.
Regular Bullish: Activates the detection and marking of regular bullish divergences in the oscillator.
Hidden Bullish: Enables the identification and display of hidden bullish divergences.
Regular Bearish: Turns on the feature to detect and highlight regular bearish divergences.
Hidden Bearish: Activates the functionality for detecting and displaying hidden bearish divergences.
Color:
Bullish: Determines the minimum/maximum color gradient for bullish signals, impacting the chart's visual appearance.
Bearish: Defines the minimum/maximum color gradient for bearish signals, affecting their visual representation.
Average: Specifies the color for the average line of the oscillator, enhancing chart readability.
CHoCH: Sets the color for bullish/bearish CHoCH (Change of Character) signals.
Premium/Discount: Determines the color for the premium/discount zone in the oscillator's visual representation.
Text Color: Sets the color for the text in BoS/CHoCH labels.
Regular Bullish: Defines the color used to represent regular bullish divergences.
Hidden Bullish: Specifies the color for hidden bullish divergences.
Regular Bearish: Determines the color for hidden bearish divergences.
Divergence Text Color: Specifies the color for the text in divergence labels.

Auto Phivots S/R [DM]Greetings colleagues
Today I share the classic pivot points indicator
Added options:
Standard levels
Fibonacci levels "up to 261'8"
Logarithmic scale option
//Pivot Points Standard
//Pivot Points Standard — is a technical indicator that is used to determine the levels
//at which price may face support or resistance. The Pivot Points indicator consists of
//a pivot point (PP) level and several support (S) and resistance (R) levels.
//
//Calculation
//PP, resistance and support values are calculated in different ways, depending on
//the type of the indicator, specified by the Type field in indicator inputs. To
//calculate PP and support/resistance levels, the values OPENcurr, OPENprev, HIGHprev,
//LOWprev, CLOSEprev are used, which are the values of the current open and previous
//open, high, low and close, respectively, on the indicator resolution. The indicator
//resolution is set by the input of the Pivots Timeframe. If the Pivots Timeframe is set
//to AUTO (the default value), then the increased resolution is determined by the
//following algorithm:
//
//for intraday resolutions up to and including 15 min, DAY (1D) is used
//for intraday resolutions more than 15 min, WEEK (1W) is used
//for daily resolutions MONTH is used (1M)
//for weekly and monthly resolutions, 12-MONTH (12M) is used

Pivot Point Daily prediction bitcoin - by Simon-RoseThis is an additional Script to my recent Pivot Point indicator scripts which will show you the next days pivot points based on the actual price range.
This is useful if you are trading right before a new day and want to know how the next bdays pivot points may be placed.
If you have any questions or suggestions pls write me :)
Happy trading
Cheers
Daily Pivots:
Weekly Version:
Monthly Version:

Support and Resistance Breakout Signals [MarkitTick]💡 This indicator provides a comprehensive, automated system for identifying, tracking, and trading Support and Resistance (S/R) breakouts. By synthesizing classic Swing High and Swing Low pivot analysis with Multi-Timeframe (HTF) capabilities and Volume confirmation, it transforms raw price action into actionable structural data. It is designed to declutter charts by automatically managing active levels and highlighting significant market structure shifts (Higher Highs, Lower Lows) alongside verified breakout signals.
✨ Originality and Utility
While many indicators draw static pivot points, this tool distinguishes itself through "State Management." It treats Support and Resistance not just as historical markers, but as active zones that evolve.
Dynamic Level Management: Instead of flooding the chart with infinite lines, the script uses arrays to store a specific number of recent levels. As price action progresses, invalid or broken levels are removed or updated, keeping the analysis focused on current relevance.
Multi-Timeframe Confluence: Uniquely, it allows you to overlay higher timeframe support and resistance levels (e.g., Daily levels on a 4-hours chart) without changing your chart view, enabling top-down analysis instantly.
Market Structure Labeling: It automatically tags pivot points with Dow Theory labels (HH, LH, LL, HL), aiding traders in instantly recognizing trend direction without manual charting.
🔬 Methodology and Concepts
The script operates on three core technical pillars:
● Swing Pivot Detection
The foundation is the detection of local extrema using a "Left/Right" bar lookback mechanism. A Swing High is identified when a high is greater than the L bars preceding it and the R bars following it. This confirms a fractal peak or valley.
Note on Confirmation: Because the script waits for R bars to close to confirm a pivot, the lines appear retroactively. However, the extension of these lines and subsequent breakout signals occur in real-time.
● Breakout Logic with Volume Integration
A breakout is triggered when the Close price crosses an active S/R line.
Resistance Break: Current Close > Resistance Level (and Previous Close ≤ Level).
Support Break: Current Close < Support Level (and Previous Close ≥ Level).
Volume Confirmation: An optional filter requires the breakout bar's volume to exceed a Moving Average of volume, ensuring momentum backs the move.
● Time Decay
To mimic the reduced relevance of stale levels, the script includes a "Time Decay" feature. If a level is not interacted with for a user-defined number of bars, it is automatically purged from the system, ensuring the chart reflects only fresh interest levels.
🎨 Visual Guide
The indicator uses a specific color-coding and labeling system to convey information quickly:
● Support & Resistance Lines
Red Lines (Thin): Represent active Resistance levels on the current timeframe.
Green Lines (Thin): Represent active Support levels on the current timeframe.
Fuchsia Lines (Thick): Represent Higher Timeframe (HTF) Resistance levels.
Aqua Lines (Thick): Represent Higher Timeframe (HTF) Support levels.
● Market Structure Labels
Located at the pivot points, these text labels define the trend structure:
HH / LH: Higher High / Lower High (Red Text).
LL / HL: Lower Low / Higher Low (Green/Aqua Text).
HTF-R / HTF-S: Indicates major structural pivots from the higher timeframe.
● Breakout Signals
When a valid break occurs, a label appears above or below the bar:
Blue Triangle Up (▲): Bullish breakout through resistance.
Blue Triangle Down (▼): Bearish breakout through support.
Number in Label: Indicates the cumulative count of breaks for that specific trend sequence (e.g., "1" is the first break, "2" is the second).
The breakout count represents the intensity of the move. A reading greater than 1 signals exceptional market strength, indicating the penetration of multiple Key Levels (Support or Resistance) within a single candle.
📖 How to Use
Trend Continuation: In an uptrend (sequence of HH/HL), wait for a Blue Triangle Up (▲) occurring at a Red Resistance line. This signals the continuation of the trend.
Trend Reversal: Watch for a "Structure Break." If price is making Higher Highs, but then breaks a Green Support line (generating a ▼ signal) and forms a Lower Low (LL), the trend may be reversing.
HTF "Bounce" Plays: Use the thick Fuchsia/Aqua lines as major zones. If price approaches a thick Aqua line (HTF Support) and fails to break it, look for LTF bullish structure (HH/HL) to form for an entry.
Volume Filtering: Enable the "Volume Confirmation" setting to filter out "fakeouts" (breaks on low volume).
⚙️ Inputs and Settings
● Swing Settings
Left/Right Bars: Determines the sensitivity of the pivot detection. Higher numbers = fewer, more significant pivots.
Max Stored Levels: How many S/R lines to keep in memory at once.
Max Break Labels: Limits visual clutter by capping the number of signal labels.
● Usability & HTF
Enable Time Decay: If true, deletes lines that are older than "Decay Period" bars.
Enable HTF Levels: Toggles the display of higher timeframe pivots.
HTF Timeframe: Select the specific timeframe for the macro view (e.g., "D" for Daily).
● Analysis
Volume Confirmation: Toggles the requirement for volume to be above its average for a signal to fire.
Show Market Structure: Toggles the HH/LL text labels.
🔍 Deconstruction of the Underlying Scientific and Academic Framework
The script's logic is rooted in Fractal Geometry and Auction Market Theory .
● Mandelbrot's Fractals: The use of `leftBars` and `rightBars` is a direct application of identifying market fractals. Markets are self-similar across timeframes; a pivot on a 5-minute chart is structurally identical to one on a Weekly chart. This script exploits this property by allowing nested timeframe analysis (LTF inside HTF).
● Memory of Price (Behavioral Finance): Support and resistance lines represent zones where market participants have previously established value (Price Memory). The "Breakout" signal is mathematically significant because it represents a shift in the supply/demand equilibrium. When price closes beyond a stored array value (the pivot price), it signifies that the aggressive limit orders that created the pivot have been exhausted or withdrawn, validating a new search for value.
⚠️ Disclaimer
All provided scripts and indicators are strictly for educational exploration and must not be interpreted as financial advice or a recommendation to execute trades. I expressly disclaim all liability for any financial losses or damages that may result, directly or indirectly, from the reliance on or application of these tools. Market participation carries inherent risk where past performance never guarantees future returns, leaving all investment decisions and due diligence solely at your own discretion.

Smart Divergence Scanner═══════════════════════════════════════════════════════════════════════════════
DivScan Pro - User Guide
═══════════════════════════════════════════════════════════════════════════════
OVERVIEW
────────────────────────────────────────────────────────────────────────────────
DivScan Pro is a multi-indicator divergence scanner that detects potential
reversal points by analyzing 10+ technical indicators simultaneously.
Optimized for 5m and 15m timeframes.
SIGNAL ICONS
────────────────────────────────────────────────────────────────────────────────
▲ Green Triangle (Below Bar) = BUY Signal
Strong bullish divergence confirmed by volume + RSI oversold
▼ Red Triangle (Above Bar) = SELL Signal
Strong bearish divergence confirmed by volume + RSI overbought
▲ Faded Green Triangle = Weak BUY
Bullish divergence detected but filters not fully met
▼ Faded Red Triangle = Weak SELL
Bearish divergence detected but filters not fully met
H Red "H" Label = Pivot High Point
L Green "L" Label = Pivot Low Point
DIVERGENCE LABELS
────────────────────────────────────────────────────────────────────────────────
┌─────────┐
│ MC │ Aqua Box (Bottom) = Bullish Divergence
│ RS │ Shows which indicators detected divergence
│ 3 │ Number = total indicator count
└─────────┘
┌─────────┐
│ MC │ Purple Box (Top) = Bearish Divergence
│ VW │ Shows which indicators detected divergence
│ MF │ Number = total indicator count
│ 3 │
└─────────┘
INDICATOR ABBREVIATIONS
────────────────────────────────────────────────────────────────────────────────
MC = MACD Line
MH = MACD Histogram
RS = RSI (Relative Strength Index)
ST = Stochastic
CC = CCI (Commodity Channel Index)
MO = Momentum
OB = OBV (On Balance Volume)
VW = VWMACD (Volume Weighted MACD)
CF = CMF (Chaikin Money Flow)
MF = MFI (Money Flow Index)
EX = External Indicator
DIVERGENCE LINES
────────────────────────────────────────────────────────────────────────────────
─────── Solid Aqua Line = Bullish Regular Divergence
Price: Lower Low | Indicator: Higher Low
Suggests: Potential upward reversal
─────── Solid Purple Line = Bearish Regular Divergence
Price: Higher High | Indicator: Lower High
Suggests: Potential downward reversal
- - - - Dashed Lime Line = Bullish Hidden Divergence
Price: Higher Low | Indicator: Lower Low
Suggests: Trend continuation (uptrend)
- - - - Dashed Red Line = Bearish Hidden Divergence
Price: Lower High | Indicator: Higher High
Suggests: Trend continuation (downtrend)
HOW TO USE
────────────────────────────────────────────────────────────────────────────────
1. WAIT FOR STRONG SIGNALS
Look for solid ▲ or ▼ triangles (not faded)
These have volume + RSI confirmation
2. CHECK CONFLUENCE
More indicators = stronger signal
Label shows "3" or higher = high confidence
3. CONFIRM WITH PRICE ACTION
Wait for candle confirmation after signal
Look for support/resistance levels
4. RECOMMENDED SETTINGS FOR SCALPING (5m/15m)
• Pivot Period: 3
• Min Confirmations: 2
• Max Lookback: 50
• Wait Confirmation: ON
SETTINGS QUICK REFERENCE
────────────────────────────────────────────────────────────────────────────────
MAIN
Pivot Period How many bars to identify pivot (lower = more signals)
Pivot Source Close or High/Low for pivot detection
Divergence Type Regular, Hidden, or Both
Max Pivots Maximum pivot points to scan
Max Lookback Maximum bars to look back
Min Confirmations Minimum indicators required (higher = fewer but stronger)
Wait Confirmation Wait for bar close before signal
DISPLAY
Labels Full (MC), Abbrev (M), or None
Show Count Display number of confirming indicators
Show Lines Draw divergence lines on chart
Show Pivots Mark H/L pivot points
Last Only Show only most recent divergence
Show MA 50/200 Display moving averages
INDICATORS
Toggle each indicator ON/OFF for divergence scanning
ALERTS
────────────────────────────────────────────────────────────────────────────────
Available alerts in TradingView:
• Bullish Regular Divergence
• Bearish Regular Divergence
• Bullish Hidden Divergence
• Bearish Hidden Divergence
• Any Bullish Divergence
• Any Bearish Divergence
TIPS
────────────────────────────────────────────────────────────────────────────────
✓ Higher "Min Confirmations" = fewer signals but higher accuracy
✓ Use with support/resistance levels for best entries
✓ Strong signals (solid triangles) have better win rate
✓ Multiple indicator confluence (3+) = highest probability trades
✓ Always use stop loss - divergence can fail
═══════════════════════════════════════════════════════════════════════════════
DivScan Pro v1.0
═══════════════════════════════════════════════════════════════════════════════

Pivot Point Zones [JOAT]Pivot Point Zones — Multi-Formula Pivot Levels with ATR Zones
Pivot Point Zones calculates and displays traditional pivot points with five formula options, enhanced with ATR-based zones around each level. This creates more practical trading zones that account for price noise around key levels—because price rarely reacts at exact mathematical levels.
What Makes This Indicator Unique
Unlike basic pivot point indicators, Pivot Point Zones:
Offers five different pivot calculation formulas in one indicator
Creates ATR-based zones around each level for realistic reaction areas
Pulls data from higher timeframes automatically
Displays clean labels with exact price values
Provides a comprehensive dashboard with all levels
What This Indicator Does
Calculates pivot points using Standard, Fibonacci, Camarilla, Woodie, and more formulas
Draws horizontal lines at Pivot, R1-R3, and S1-S3 levels
Creates ATR-based zones around each level for realistic price reaction areas
Displays labels with exact price values
Updates automatically based on higher timeframe closes
Provides fills between zone boundaries for visual clarity
Pivot Formulas Explained
// Standard Pivot - Classic (H+L+C)/3 calculation
pp := (pivotHigh + pivotLow + pivotClose) / 3
r1 := 2 * pp - pivotLow
s1 := 2 * pp - pivotHigh
r2 := pp + pivotRange
s2 := pp - pivotRange
// Fibonacci Pivot - Uses Fib ratios for level spacing
r1 := pp + 0.382 * pivotRange
r2 := pp + 0.618 * pivotRange
r3 := pp + 1.0 * pivotRange
// Camarilla Pivot - Tighter levels for intraday
r1 := pivotClose + pivotRange * 1.1 / 12
r2 := pivotClose + pivotRange * 1.1 / 6
r3 := pivotClose + pivotRange * 1.1 / 4
// Woodie Pivot - Weights current close more heavily
pp := (pivotHigh + pivotLow + 2 * close) / 4
// TD Pivot - Conditional based on open/close relationship
x = pivotClose < pivotOpen ? pivotHigh + 2*pivotLow + pivotClose :
pivotClose > pivotOpen ? 2*pivotHigh + pivotLow + pivotClose :
pivotHigh + pivotLow + 2*pivotClose
pp := x / 4
Formula Characteristics
Standard — Classic pivot calculation. Balanced levels, good for swing trading.
Fibonacci — Uses 0.382, 0.618, and 1.0 ratios. Popular with Fibonacci traders.
Camarilla — Tighter levels derived from range. Excellent for intraday mean-reversion.
Woodie — Weights current close more heavily. More responsive to recent price action.
TD — Conditional calculation based on open/close relationship. Adapts to bar type.
Zone System
Each pivot level includes an ATR-based zone that provides a more realistic area for potential price reactions:
// ATR-based zone width calculation
float atr = ta.atr(atrLength)
float zoneHalf = atr * zoneWidth / 2
// Zone boundaries around each level
zoneUpper = level + zoneHalf
zoneLower = level - zoneHalf
This accounts for market noise and helps avoid false breakout signals at exact level prices.
Visual Features
Pivot Lines — Horizontal lines at each calculated level
Zone Fills — Transparent fills between zone boundaries
Level Labels — Labels showing level name and exact price (e.g., "PP 45123.50")
Color Coding :
- Yellow: Pivot Point (PP)
- Red gradient: Resistance levels (R1, R2, R3) - darker = further from PP
- Green gradient: Support levels (S1, S2, S3) - darker = further from PP
Color Scheme
Pivot Color — Default: #FFEB3B (yellow) — Central pivot point
Resistance Color — Default: #FF5252 (red) — R1, R2, R3 levels
Support Color — Default: #4CAF50 (green) — S1, S2, S3 levels
Zone Transparency — 85-90% transparent fills around levels
Dashboard Information
The on-chart table (bottom-right corner) displays:
Selected pivot type (Standard, Fibonacci, etc.)
R3, R2, R1 resistance levels with exact prices
PP (Pivot Point) highlighted
S1, S2, S3 support levels with exact prices
Inputs Overview
Pivot Settings:
Pivot Type — Formula selection (Standard, Fibonacci, Camarilla, Woodie, TD)
Pivot Timeframe — Higher timeframe for OHLC data (default: D = Daily)
ATR Length — Period for zone width calculation (default: 14)
Zone Width — ATR multiplier for zone size (default: 0.5)
Level Display:
Show Pivot (P) — Toggle central pivot line
Show R1/S1 — Toggle first resistance/support levels
Show R2/S2 — Toggle second resistance/support levels
Show R3/S3 — Toggle third resistance/support levels
Show Zones — Toggle ATR-based zone fills
Show Labels — Toggle price labels at each level
Visual Settings:
Pivot/Resistance/Support Colors — Customizable color scheme
Line Width — Thickness of level lines (default: 2)
Extend Lines Right — Project lines forward on chart
Show Dashboard — Toggle the information table
How to Use It
For Intraday Trading:
Use Daily pivots on intraday charts (15m, 1H)
Pivot point often acts as the day's "fair value" reference
Camarilla levels work well for intraday mean-reversion
R1/S1 are the most commonly tested levels
For Swing Trading:
Use Weekly pivots on daily charts
Standard or Fibonacci formulas work well
R2/S2 and R3/S3 become more relevant
Zone boundaries provide realistic entry/exit areas
For Support/Resistance:
R levels above price act as resistance targets
S levels below price act as support targets
Zone boundaries are more realistic than exact lines
Multiple formula confluence adds significance
Alerts Available
DPZ Cross Above Pivot — Price crosses above central pivot
DPZ Cross Below Pivot — Price crosses below central pivot
DPZ Cross Above R1/R2 — Price breaks resistance levels
DPZ Cross Below S1/S2 — Price breaks support levels
Best Practices
Match pivot timeframe to your trading style (Daily for intraday, Weekly for swing)
Use zones instead of exact levels for more realistic expectations
Camarilla is best for mean-reversion; Standard/Fibonacci for breakouts
Combine with other indicators for confirmation
— Made with passion by officialjackofalltrades

Pivots + MAs ISRSPivots + MAs ISRS is a complete market-structure tool designed for traders who want clear institutional levels combined with trend confirmation from moving averages and Fibonacci zones.
This indicator helps you identify breakouts, pullbacks, and reversal points with much higher accuracy.
It combines the best of three worlds:
🔹 1. Advanced Pivot Points (Standard TV Engine)
Includes every major professional pivot type:
Traditional
Fibonacci
Woodie
Classic
DM
Camarilla
You can choose pivot anchors such as:
Daily, Weekly, Monthly, Quarterly, Yearly, and extended periods (2, 3, 5, and 10 years).
✔ Fully customizable colors
✔ Show/hide each level individually
✔ Dynamic labels (left or right)
✔ Works with intraday + extended sessions
🔹 2. Built-in Moving Averages
The indicator includes:
3 EMAs to measure trend direction and momentum
A 5-period SMA for micro-structure and scalping precision
Great for identifying confluences between trend direction + pivot levels.
🔹 3. FiboISRS Zones
Fibonacci-based zones designed to enhance price-reaction detection:
Retracement levels
Liquidity zones
Confluences with EMAs + Pivot Points
Perfect for spotting high-probability reversal areas.
🎯 What This Indicator Helps You Do
✔ See active institutional levels on any timeframe
✔ Detect real breakouts (not fakeouts) using Pivots + MAs
✔ Identify clean pullbacks into key zones
✔ Spot reactions at S1/S2/S3 or R1/R2/R3
✔ Keep your chart clean with minimal noise
Works extremely well on:
Crypto with solid liquidity
Major indices (SPX, NASDAQ, Dow)
Forex
Gold and commodities
🧠 Pro Tip
The highest-probability setups occur when price touches:
👉 A Pivot Level
👉 An EMA (20, 50, or 200)
👉 A FiboISRS zone
When these three overlap, the market often reacts strongly.
⚡ Creator
Indicator created by Ismael Robles (ISRS) to bring a clean, institutional-grade structure to everyday traders.

Daily Backtest Pivots Problem with the built-in Pivot Points Standard indicator in backtesting/replay mode:
The default "Pivot Points Standard" indicator is excellent on live charts, but it becomes completely unusable for proper backtesting or bar-replay because it always calculates and displays the current day’s pivot points (P, R1, R2, S1, S2, etc.) using the high/low/close of the still-forming current day — even when you're replaying historical bars.
Example:
When replaying or backtesting September 8 at 08:00 (Asian session), the indicator already shows the final R1, R2, S1, S2 for the entire September 8 daily candle, even though in real trading at that moment you would have no idea where the day will close or what the final daily range will be. This creates massive look-ahead bias and makes any strategy that uses daily pivots impossible to test realistically.
Desired behavior (historical accuracy):
During backtesting or bar replay, the indicator should only plot:
The previous day’s completed pivot levels (which were actually known at the start of the current day)
NO current-day pivot levels at all (or only plot them after the daily candle is closed)
Many custom pivot scripts already do exactly this (they only show the prior day’s levels throughout the current day), which is why people abandon the built-in indicator for backtesting.
Elliott Wave Expert AdvisorElliott Wave Expert Advisor - Professional Wave Analysis Tool
OVERVIEW
--------
The Elliott Wave Expert Advisor is a comprehensive Pine Script indicator designed for TradingView that automates Elliott Wave analysis and generates high-probability trading signals. Built on Ralph Nelson Elliott's Wave Principle, this indicator identifies impulse wave patterns, validates them against strict Elliott Wave rules, and provides precise entry points with calculated risk management levels.
CORE FUNCTIONALITY
------------------
1. TREND DETECTION
- Dual Moving Average system (Fast/Slow MA)
- MACD confirmation for trend strength
- Automatic trend classification (Uptrend/Downtrend/Sideways)
- Only generates signals aligned with main trend
2. SWING POINT DETECTION
- Automatic pivot high/low identification
- Configurable sensitivity (lookback periods)
- Minimum swing size filtering to reduce noise
- ZigZag visualization connecting swing points
3. WAVE IDENTIFICATION
- 5-wave impulse pattern recognition (1-2-3-4-5)
- 3-wave corrective pattern detection (A-B-C)
- Wave labels displayed on chart
- Color-coded validation status (Blue = Valid, Orange = Pending)
4. ELLIOTT WAVE RULES VALIDATION
Strictly enforces three cardinal rules:
- Rule 1: Wave 2 never retraces more than 100% of Wave 1
- Rule 2: Wave 3 is never the shortest impulse wave
- Rule 3: Wave 4 never overlaps Wave 1 price territory
5. FIBONACCI ANALYSIS
- Automatic Fibonacci retracement calculations (23.6%, 38.2%, 50%, 61.8%, 78.6%)
- Fibonacci extension projections (100%, 161.8%, 261.8%)
- Wave 3 and Wave 5 target projections
- Fibonacci-based Take Profit levels
6. SIGNAL GENERATION
- Entry signals at Wave 2 completion (catch Wave 3)
- Entry signals at Wave 4 completion (catch Wave 5)
- Automatic Stop Loss placement below/above pivot points
- Multiple Take Profit targets (TP1 at 1.618 extension, TP2 at Wave 5 projection)
- Risk/Reward ratio calculation and filtering
- Minimum R:R threshold (default 1.5:1)
7. VISUAL ELEMENTS
- Pivot markers (H/L) showing swing highs and lows
- ZigZag lines connecting swing points
- Wave number labels (1-2-3-4-5) with validation colors
- Entry signal arrows (Green = BUY, Red = SELL)
- Stop Loss lines (Red dashed)
- Take Profit lines (Green dashed and dotted)
- Real-time status dashboard showing:
* Number of pivots detected
* Wave count progress (X/5)
* Pattern validation status
* Market trend direction
* Signal active status
* Helpful tips and guidance
OPTIMAL USAGE
-------------
• Timeframes: H1, H4, D1 (avoid M1-M5 due to noise)
• Markets: Forex majors (EUR/USD, GBP/USD), Gold (XAU/USD), Major Cryptocurrencies
• Market Conditions: Strong trending markets (avoid ranging/sideways conditions)
• Risk Management: Never risk more than 1-2% per trade
• Position Sizing: Based on calculated Stop Loss distance
CONFIGURATION PARAMETERS
------------------------
Trend Detection:
- MA Fast Period (default: 20)
- MA Slow Period (default: 50)
- MACD settings (12/26/9)
Swing Detection:
- Pivot Lookback Left/Right (default: 10/10, reduce to 5/5 for M15)
- Min Swing Size % (default: 0.1%, reduce to 0.05% for M15)
Wave Detection:
- Min Wave Size % (default: 0.5%, reduce to 0.2-0.3% for smaller timeframes)
Risk Management:
- SL Buffer % (default: 0.1%)
- TP1 Fibonacci Ratio (default: 1.618)
- Min Risk/Reward (default: 1.5)
Visualization:
- Toggle visibility for MAs, ZigZag, Wave Labels, Signals, SL/TP
- Customizable colors for all elements
- Optional trend background coloring
IMPORTANT NOTES
---------------
• Elliott Wave analysis is subjective - this indicator implements one specific interpretation
• Works best in trending markets; automatically suppresses signals in sideways conditions
• Signals are NOT repainting after pivot confirmation
• Not a "holy grail" - combine with other analysis and proper risk management
• Requires patience - quality setups are infrequent but high-probability
• Always backtest on historical data before live trading
ELLIOTT WAVE THEORY BACKGROUND
------------------------------
Elliott Wave Theory, developed by Ralph Nelson Elliott in the 1930s, proposes that market prices move in predictable wave patterns driven by investor psychology. An impulse wave consists of five sub-waves (three in the trend direction, two corrections), followed by a three-wave correction. This indicator automates the identification of these patterns and validates them against Elliott's original rules.
DISCLAIMER
----------
This indicator is for educational and informational purposes only. Past performance does not guarantee future results. Always conduct your own analysis and never trade with money you cannot afford to lose. The indicator provides signals based on technical analysis patterns and does not constitute financial advice.
VERSION
-------
v1.0 - Initial Release
Pine Script v5
Created: 2024
SUPPORT
-------
For detailed usage instructions, refer to the included documentation:
- usage_guide.md - Complete user manual with examples
- elliott_rules.md - Elliott Wave theory reference and implementation details

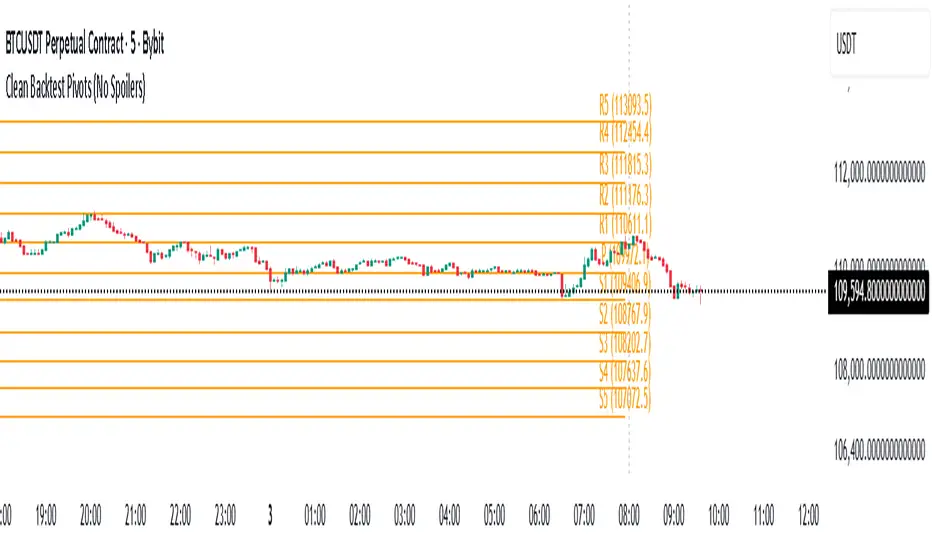
PHD-Points
The PHD Pivot Points indicator is a professional-grade support and resistance tool that calculates key price levels based on previous day's price action and current intraday data. It provides traders with multiple reference points for identifying potential reversal zones, breakout levels, and strategic entry/exit positions.
Key Components
1. Previous Day Pivot Point (P)
White Line - The main pivot level calculated from previous day's High, Low, and Close
Formula: P = (Previous High + Previous Low + Previous Close) / 3
Serves as the central reference point for the trading day
Often acts as a psychological support/resistance level
2. Previous Day Support Levels (D1, D2, D3)
Brown Lines - Three support levels below the previous day's pivot
D1 (Support 1): First support level, closest to pivot
D2 (Support 2): Second support level, medium-strength
D3 (Support 3): Third support level, strongest support
Calculated using previous day's high and low ranges
3. Previous Day Resistance Levels (H1, H2, H3)
Yellow-Brown Lines - Three resistance levels above the previous day's pivot
H1 (Resistance 1): First resistance level, closest to pivot
H2 (Resistance 2): Second resistance level, medium-strength
H3 (Resistance 3): Third resistance level, strongest resistance
Calculated using previous day's high and low ranges
4. Today's Pivot Point (PT)
Dark Red Line - Dynamic pivot point that updates throughout the current trading session
Formula: PT = (Current High + Current Low + Current Close) / 3
Provides real-time trend reference for intraday trading
Helps identify intraday momentum and trend strength
5. Today's Dynamic Levels (DD1-DD3, HH1-HH3)
Calculated but not plotted by default
These values represent current session's support and resistance levels
Can be used for advanced intraday analysis
Trading Applications
Support and Resistance Trading
Price tends to bounce at D1, D2, D3 levels (potential buy zones)
Price tends to stall or reverse at H1, H2, H3 levels (potential sell zones)
Breaks above/below these levels signal trend strength
Trend Identification
Price above P = Bullish bias
Price below P = Bearish bias
PT line angle shows intraday momentum direction
Pivot and Wick Boxes with Break Signals v2█ OVERVIEW
The "Pivot and Wick Boxes with Break Signals v2" is an advanced Pine Script® technical analysis tool that identifies pivot points (highs and lows) on the chart and draws customizable boxes based on the wicks of pivot candles. It is ideal for traders using price action strategies, helping to identify key support and resistance levels and potential breakout trading opportunities. With flexible settings, a volume filter, and label grouping, the indicator ensures clarity and precision on the chart.
█ CONCEPTS
The indicator modifies how zones are drawn, displaying boxes on the latest candle rather than extending from the zones based on pivot candle wicks. This approach prevents visual clutter on the chart, allowing simultaneous use of other indicators without sacrificing clarity.
Why are wicks important?Wicks of pivot candles indicate significant market reactions in key areas. Depending on the context, they may signal rejection, testing, or absorption of support or resistance levels. Long wicks often appear where large players are active, and the marked zones are frequently retested. The indicator enables quick identification and observation of their impact on future price movements.
█ FEATURES
Pivot Detection: Identifies pivot points (highs and lows) based on a user-defined lookback period (Pivot Length), with options to display boxes for high and low pivot candle wicks separately.
Customizable Boxes: Draws boxes based on pivot candle wicks with adjustable border colors, background gradients, border styles (solid, dashed, dotted), and border widths.
Breakout Signals: Generates buy (green upward triangle) and sell (red downward triangle) signals when the price breaks through a pivot and the candle closes on the opposite side, indicating potential trend continuation. If the price approaches a pivot zone but fails to break it, this may suggest a potential trend reversal or the end of a correction.
Volume Filter: Optional volume-based signal filter that requires breakouts to have a volume exceeding a user-defined multiplier of the average volume over a specified period. Note: the volume filter will not work on markets where volume data is unavailable.
Label Grouping: Automatically groups overlapping pivot labels to avoid chart clutter, displaying only key price levels.
█ HOW TO USE
Add to Chart: Apply the indicator to your TradingView chart via the Pine Editor or Indicators menu.
Configure Settings:
Pivot Settings: Adjust Pivot Length to change the sensitivity of pivot detection—the value represents the number of candles, which equals the delay in displaying the pivot. Larger values generate fewer pivots, but they are generally more significant. Set Max High Pivot Boxes and Max Low Pivot Boxes to control the number of displayed boxes.
Signal Settings: Enable Use Volume Filter for Signals to require higher volume for breakouts, and adjust Average Volume Multiplier and Average Volume Period. A volume multiplier of 1 means the filter allows pivots with a volume equal to or greater than the average volume over the specified period.
Box Styling: Configure border colors, background gradients, line thickness, and border styles for high and low pivot boxes.
Interpreting Signals:
Buy Signal: A green triangle below the bar indicates a breakout above a high pivot box, suggesting potential continuation of an uptrend.
Sell Signal: A red triangle above the bar indicates a breakout below a low pivot box, suggesting potential continuation of a downtrend.
Non-Breakout Zones: If the price approaches a pivot zone but fails to break it, it may indicate a potential trend reversal or the end of a correction (e.g., price rejection at a resistance level in a downtrend or a support level in an uptrend).
Overlapping Zones: If pivot zones overlap, it indicates the level has been tested multiple times, suggesting its significance in the market.
Use signals in conjunction with other technical analysis tools for confirmation.
Monitoring Levels: Use labeled pivot levels as potential support and resistance zones for trade planning.
█ APPLICATIONS
Price Action Trading: Use pivot levels as support and resistance zones. For example, in an uptrend, you can look for buying opportunities near low pivot zones (support), where price often bounces after testing the wick of a pivot candle. Combining with other indicators, such as Fibonacci levels, enhances the significance of pivot zones—if they align with Fibonacci levels and are accompanied by high volume, the zone is considered stronger.
Breakout Strategies: Trade based on breakout signals from key pivot zones. A buy signal after a breakout from a high pivot with confirmed volume may indicate continued upward movement. Using the indicator with other tools, such as moving averages or RSI, can help confirm the strength of the breakout.
Practical Approach:
The more frequently a zone is tested in a short period, the higher the risk of a breakout, as supply or demand may be exhausted.
The longer a zone holds without breaking, the more significant it becomes for the market, both psychologically and technically.
As the saying goes: “A zone is strong until it breaks—when it does, a strong move often follows.”
How to observe?
Strong bounces from a zone indicate that demand or supply remains active.
Weaker bounces or price lingering near the level may suggest the market is preparing for a breakout.
█ NOTES
Test the indicator across different timeframes and markets (stocks, forex, crypto) to optimize settings for your trading style.
The volume filter will not work on markets where volume data is unavailable. In such cases, disable the volume filter in the settings.
For best results, use on high-liquidity markets when the volume filter is enabled.

Multi-Timeframe SMTSummery
The Multi-Timeframe SMT indicator is designed to identify and visualize Higher Timeframe (HTF) data on a Lower Timeframe (LTF) chart, allowing traders to see the broader market context without changing their current chart's resolution. It accurately draws pivots and SMT divergences from higher timeframes on the corresponding candles of your current lower timeframe chart.
Its core features include:
Multi-Timeframe Analysis: Configure and monitor pivots on up to four independent timeframes, from intraday to monthly.
Customizable Pivot Detection: Define the strength of pivots by adjusting the number of bars to the left and right.
SMT Divergence: Automatically identifies bullish and bearish SMT divergences by comparing the price action of the main chart symbol with a chosen correlated asset.
Early SMT Detection: A unique feature that monitors a lower "detection timeframe" to provide early warnings of potential SMT setups before they're confirmed on the main timeframe. Note that this early detection is only shown on timeframes equal to or lower than the "Detection timeframe" you have set.
Visual Cues & Alerts: Clear on-chart labels, lines, and fully customizable alerts notify you of confirmed pivots and SMT divergences, ensuring you don't miss key opportunities.
Important Nuance Regarding Pivot Label Display
Due to a self-imposed limit within this script's drawing management logic, the indicator might quickly reach its drawing capacity if you enable pivot crosses for multiple timeframes simultaneously. When this internal drawing limit is exceeded, the script is designed to automatically remove the oldest drawings to make space for new ones.
Therefore, to ensure optimal performance and visibility of the most recent and relevant pivots, it's highly recommended to only enable the "Show Pivot Crosses" option for one timeframe at a time. If you wish to view pivots for a different timeframe, simply disable the pivot crosses for the currently active timeframe and then enable them for your desired one. This approach prevents the rapid cycling and disappearance of pivot labels, providing a clearer and more stable visual experience.
In-Depth Explanation of the Logic
This script is built on two primary concepts: pivot points and Smart Money Technique (SMT) divergence. It systematically collects historical data on multiple timeframes, identifies pivots, and then compares them between two assets to find divergences.
Pivot Point Identification
A pivot is a turning point in the market. A pivot high is a candle that has a higher high than the candles to its immediate left and right. Conversely, a pivot low is a candle with a lower low than its neighbors.
How it Works in the Script:
The script tracks the highest high and lowest low for each period of the selected timeframe (e.g., for each 4-hour candle). When a new high-timeframe candle closes, it stores that high/low value and its bar index in an array. The checkForPivot() function then checks if a recently stored high or low qualifies as a pivot.
Key Inputs:
Left Strength (leftBars1): The number of candles to the left that must have a lower high (for a pivot high) or higher low (for a pivot low).
Right Strength (rightBars1): The number of candles to the right that must meet the same criteria.
For example, with Left Strength and Right Strength both set to 3, a pivot high is only confirmed when its high is greater than the highs of the 3 previous high-timeframe candles and the 3 subsequent high-timeframe candles. Increasing these values will identify more significant, longer-term pivots.
Smart Money Technique (SMT) Divergence
SMT Divergence is a concept popularized by The Inner Circle Trader (ICT). It occurs when two closely correlated assets fail to move in sync. For instance, if Asset A makes a higher high but Asset B fails to do so and instead makes a lower high, this creates a bearish SMT divergence. It suggests that the "smart money" may not be supporting the move in Asset A, signaling a potential reversal.
Bearish SMT: Main asset makes a higher high, while the correlated asset makes a lower high. This is a potential sell signal.
Bullish SMT: Main asset makes a lower low, while the correlated asset makes a higher low. This is a potential buy signal.
How it Works in the Script:
Data Request: For each timeframe, the script uses the request.security() function to fetch the high and low data for both the main chart symbol (syminfo.tickerid) and the chosen Comparison Asset.
Pivot Comparison: When a new pivot is confirmed on the main asset, the script checks if a corresponding pivot also formed on the comparison asset at the same time.
Divergence Check: It then compares the direction of the pivots. For a bearish SMT, it checks if the main asset's new pivot high is higher than its previous pivot high, while the comparison asset's new pivot high is lower than its previous one. The logic is reversed for bullish SMT.
Visualization: If a divergence is found, the script draws a red (bearish) or green (bullish) line connecting the two pivots on your chart and places an "SMT" label.
Early SMT Detection
This is a proactive feature designed to give you a heads-up. Waiting for a 4-hour or daily pivot to form can take a long time. The early detection system looks for SMT divergences on a much smaller, user-defined Detection timeframe (e.g., 15-minute).
How it Works in the Script:
Awaiting Setup: After a primary pivot (Pivot A) is formed on the main timeframe (e.g., a Daily pivot high), the script begins monitoring.
Intraday Monitoring: It then watches the Detection timeframe (e.g., 15-minute) for smaller intraday pivots.
Potential Divergence: It looks for an intraday pivot that forms a divergence against the primary Pivot A.
Watchline & Alert: When this "potential" divergence occurs, the script draws a dashed white line and triggers a "Potential SMT" alert. This isn't a confirmed SMT on the main timeframe yet, but it's a powerful early warning that one may be forming.
Drawing & Object Management
To keep the chart clean and prevent performance issues, the script manages its drawings (lines and labels) efficiently. It stores them in arrays and uses a drawing limit to automatically delete the oldest drawings as new ones are created, ensuring your TradingView remains responsive.
How to Use the Indicator
Configuration
Enable Timeframes: Use the checkboxes (Enable Timeframe 1, Enable Timeframe 2, etc.) to activate the timeframes you want to monitor. It's often best to start with one or two to keep the chart clean.
Select Timeframes: Choose the higher timeframes you want to analyze (e.g., 240 for 4-hour, D for Daily, W for Weekly).
Set Pivot Strength: The default of 3 for Left/Right strength is a good starting point. Increase it to find more significant market structure points or decrease it for more frequent, shorter-term pivots.
Configure SMT:
Check Enable SMT for the timeframes where you want to detect divergence.
Enter a Comparison Asset . This is crucial. Ensure the assets are correlated.
To use the early warning system, check Enable early SMT detection and select an appropriate Detection timeframe (e.g., 15 or 60 minutes for a Daily analysis).

CDP - Counter-Directional-Pivot🎯 CDP - Counter-Directional-Pivot
📊 Overview
The Counter-Directional-Pivot (CDP) indicator calculates five critical price levels based on the previous day's OHLC data, specifically designed for multi-timeframe analysis. Unlike standard pivot points, CDP levels are calculated using a unique formula that identifies potential reversal zones where price action often changes direction.
⚡ What Makes This Script Original
This implementation solves several technical challenges that existing pivot indicators face:
🔄 Multi-Timeframe Consistency: Values remain identical across all timeframes (1m, 5m, 1h, daily) - a common problem with many pivot implementations
🔒 Intraday Stability: Uses advanced value-locking technology to prevent the "stepping" effect that occurs when pivot lines shift during the trading session
💪 Robust Data Handling: Optimized for both liquid and illiquid stocks with enhanced data synchronization
🧮 CDP Calculation Formula
The indicator calculates five key levels using the previous day's High (H), Low (L), and Close (C):
CDP = (H + L + C) ÷ 3 (Central Decision Point)
AH = 2×CDP + H – 2×L (Anchor High - Strong Resistance)
NH = 2×CDP – L (Near High - Moderate Resistance)
AL = 2×CDP – 2×H + L (Anchor Low - Strong Support)
NL = 2×CDP – H (Near Low - Moderate Support)
✨ Key Features
🎨 Visual Elements
📈 Five Distinct Price Levels: Each with customizable colors and line styles
🏷️ Smart Label System: Shows exact price values for each level
📋 Optional Value Table: Displays all levels in an organized table format
🎯 Clean Chart Display: Minimal visual clutter while maximizing information
⚙️ Technical Advantages
🔐 Session-Locked Values: Prices are locked at market open, preventing intraday shifts
🔄 Multi-Timeframe Sync: Perfect consistency between daily and intraday charts
✅ Data Validation: Built-in checks ensure reliable calculations
🚀 Performance Optimized: Efficient code structure for fast loading
💼 Trading Applications
🔄 Reversal Zones: AH and AL often act as strong turning points
💥 Breakout Confirmation: Price movement beyond these levels signals trend continuation
🛡️ Risk Management: Use levels for stop-loss and take-profit placement
🏗️ Market Structure: Understand daily ranges and potential price targets
📚 How to Use
🚀 Basic Setup
Add the indicator to your chart (works on any timeframe)
Customize colors for easy identification of support/resistance zones
Enable the value table for quick reference of exact price levels
📈 Trading Strategy Examples
🟢 Long Bias: Look for bounces at NL or AL levels
🔴 Short Bias: Watch for rejections at NH or AH levels
💥 Breakout Trading: Enter positions when price decisively breaks through anchor levels
↔️ Range Trading: Use CDP as the central reference point for range-bound markets
🎯 Advanced Strategy Combinations
RSI Integration for Enhanced Signals: 📊
📉 Oversold Bounces: Combine RSI below 30 with price touching AL/NL levels for high-probability long entries
📈 Overbought Rejections: Look for RSI above 70 with price rejecting AH/NH levels for short opportunities
🔍 Divergence Confirmation: When RSI shows bullish divergence at support levels (AL/NL) or bearish divergence at resistance levels (AH/NH), it often signals stronger reversal potential
⚡ Momentum Confluence: RSI crossing 50 while price breaks through CDP can confirm trend direction changes
⚙️ Configuration Options
🎨 Line Customization: Adjust width, style (solid/dashed/dotted), and colors
👁️ Display Preferences: Toggle individual levels, labels, and value table
📍 Table Position: Place the value table anywhere on your chart
🔔 Alert System: Get notifications when price crosses key levels
🔧 Technical Implementation Details
🎯 Data Reliability
The script uses request.security() with lookahead settings to ensure historical accuracy while maintaining real-time functionality. The value-locking mechanism prevents the common issue where pivot levels shift during the trading day.
🔄 Multi-Timeframe Logic
⏰ Intraday Charts: Display previous day's calculated levels as stable horizontal lines
📅 Daily Charts: Show current day's levels based on yesterday's OHLC
🔍 Consistency Check: All timeframes reference the same source data
🤔 Why CDP vs Standard Pivots?
Counter-Directional Pivots often provide more accurate reversal points than traditional pivot calculations because they incorporate the relationship between high/low ranges and closing prices more effectively. The formula creates levels that better reflect market psychology and institutional trading behaviors.
💡 Best Practices
💧 Use on liquid markets for most reliable results
📊 RSI Combination: Add RSI indicator for overbought/oversold confirmation and divergence analysis
📊 Combine with volume analysis for confirmation
🔍 Consider multiple timeframe analysis (daily levels on hourly charts)
📝 Test thoroughly in paper trading before live implementation
💪 Example Market Applications
NASDAQ:AAPL AAPL - Tech stock breakouts through AH levels
$NYSE:SPY SPY - Index trading with CDP range analysis
NASDAQ:TSLA TSLA - Volatile stock reversals at AL/NL levels
⚠️ This indicator is designed for educational and analytical purposes. Always combine with proper risk management and additional technical analysis tools.

Gann Swing PointsIndicator Logic
This is a GANN-style swing indicator that classifies bars based on their high/low structure relative to the previous bar.
I strongly encourage you to replay bars on Tradingview using this indicator to get a sense of how it creates pivot (or swing) points
Bar Classification:
Up-Bar (direction: 'up'): Higher High and Higher Low (HH/HL)
Down-Bar (direction: 'down'): Lower High and Lower Low (LH/LL)
Outside-Bar (generates 2 directions):
Green: 'down' then 'up'
Red: 'up' then 'down'
Inside-Bar: No direction generated (HL/LH)
Swing Line Logic
The swing line continues in the current direction until n opposite directions are detected.
n is the "n-direction" parameter (commonly set to 2, so 2 consecutive opposite direction is needed to turn the swing)
When n opposing directions occur, the swing turns, creating a pivot point
Inside bar is ignored, so e.g up-bar -> inside-bar -> up-bar generates "up", "up" direction
A top pivot is formed when the swing turns down
A bottom pivot is formed when it turns up
Note: This swing logic is inherently lagging — it only confirms tops/bottoms after the fact
This swing structure gives the system a clear and noise-resistant way to identify pivot points (swing-points)

Intraday Pivot Highs & Lows (Asia London NY)Intraday Pivot Highs & Lows (Asia London NY)
Script Description
This TradingView indicator is optimized for Forex, scalping, intraday, and day trading strategies. It accurately plots Pivot Points and levels, high/low, support and resistance levels. These are clearly identified to aid the trader during killzone sessions and session opens. Ideal for scalp trading, intraday sessions, and leveraging SMT (Smart Money Techniques). Utilize these Price Levels effectively during London Open, NY Open, and the Asia Session, utilizing Market Structure to pinpoint key levels and reversal zones for successful trading. Improve your Trade Setups, recognize reliable Chart Patterns, identify critical Price Pivots, and trade confidently off Institutional Levels.
This script marks the intraday pivot highs, lows and midpoints retracement levels for
Asia
London
New York
It also plots the previous day's high, low, midpoint, and 0.618 Fibonacci retracement levels, providing traders with critical price reference points for making intraday trading decisions.
Originality & Usefulness
This indicator uniquely integrates pivot calculations across three major Forex sessions (Asia, London, NY), clearly delineating session boundaries.
It enhances visibility by using distinct styling
solid for New York
dashed for London
dotted lines for Asia
And colour co-ordinated labeling, improving traders' ability to identify important intraday price action zones efficiently. Unlike standard pivot indicators, this script emphasizes session-specific trading dynamics.
### Key Features ###
Session-Based Levels: Automatically plots high, low, midpoint, and Fibonacci (.618) levels for each major session (Asia, London, NY).
Distinct Visual Cues: Lines and labels use session-specific styles and colors to easily differentiate between sessions.
Previous Day Reference: Clearly plots and labels yesterday's high, low, midpoint, and Fibonacci levels.
Flexible Visibility: Traders can set timeframe visibility to maintain clean charts on higher timeframes.
### How It Works
At the start of next day's session, previous session lines are cleared, ensuring the chart remains uncluttered.
High, low, midpoint, and Fibonacci retracement levels (.618) are dynamically calculated and displayed at the close of each session.
All session levels remain visible until the start of the next respective session, providing continuous actionable insights.
Trading Application:
Session highs and lows act as strong intraday support and resistance zones.
Midpoints and Fibonacci levels are effective for identifying potential reversal zones and retracements.
Daily levels provide a broader context, useful for gauging intraday volatility and range.
### Limitations and Considerations ##
Best used on liquid assets with clear session-based price action, such as Forex major pairs, if used on indexes make sure they contain 24 hour price action not just New York session.
This indicator is designed to streamline intraday trading by clearly marking essential pivot points and session-based levels, significantly improving traders' market context and decision-making accuracy. Can be used to enhance SMT decision making when scalping killzones.
