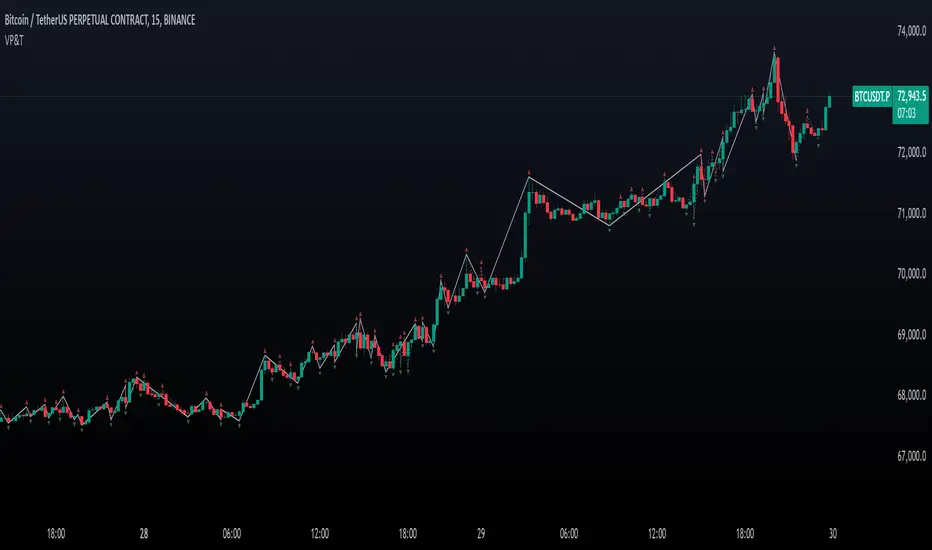
Pivot deviation code from linear regression used
pivots taken from
so we hybrid the two of them, so insted the linear regression we use the P point of the pivot
the aime here is to see better the true resitance and support level that tradition pivot is missing
Search in scripts for "pivot"

™TradeChartist Fib Extensions™TradeChartist Fib Extensions is a free to use script that helps traders plot Fibonacci Extensions on chart. Even though Trading View has a Fib extensions tool, some traders may prefer a plotting script like this with Fib plot lines extending across the whole of the chart to track historic prices in relation to Fib extensions drawn.
----To draw Fib extensions for uptrend ,
1. Choose a Pivot Low point (LL or a HL) as Pivot 1
2. Choose a Pivot High point (must be higher than Pivot 1) as Pivot 2
3. Choose a Pivot Low point (must be lower than Pivot 2, must be Higher than Pivot 1)
----To draw Fib extensions for downtrend,
1. Choose a Pivot High point (HH or a LH) as Pivot 1
2. Choose a Pivot Low point (must be lower than Pivot 1) as Pivot 2
3. Choose a Pivot High point (must be higher than Pivot 2 and lower than Pivot 1)
Negative extensions of -23.6% and -61.8% fib plots may be useful for some to spot reversals or to set stop losses.
Higher levels can be used if price goes beyond 161.8%
This is a free to use indicator. Give a thumbs up or leave a comment if you like the script
Check my 'Scripts' page to see other published scripts. Get in touch with me if you would like access to my invite-only scripts for a trial before deciding on a paid access for a period of your choice. Half-Yearly, Annual and Lifetime access available on invite-only scripts along with 1hr Team Viewer intro session.


SilverHawk Trendline BreakoutsSilverHawk Trendline Breakouts
This indicator automatically draws trendlines from recent pivot highs and lows, projecting them forward to identify potential breakouts.
Features:
• Dynamic trendline zones based on pivot points (wicks or body option)
• Breakout signals when price crosses the projected line
• Volatility-adjusted target (TP) lines
• Built-in alerts for bullish/bearish breakouts, TP hits, and SL hits
Settings:
• Period: lookback length for pivot detection (default 10)
• Type: Wicks or Body for pivot calculation
• Extend: projection length in bars (25, 50, or 75)
• Show Targets: toggle TP lines on/off
Best suited for H1 to H4 timeframes on Forex pairs or indices for trend continuation setups. Use with proper risk management and confirmation.
Educational tool only. Not financial advice. Trading involves risk.

Valid Pullbacks and Trend by kpt. GonzoThis script helps identify valid pullbacks. Based on the marked pullbacks, it can draw both internal and external structure trendlines.
A pullback is marked with a small triangle above or below the candle that created the local high or low.
A new local high is marked with a red triangle above the candle if at least one subsequent candle has a low lower than the low of the candle that created the new local high.
A new local low is marked with a green triangle below the candle if at least one subsequent candle has a high higher than the high of the candle that created the new local low.
Based on the marked local highs and lows, the internal structure trendline is created by simply connecting all highs and lows with a line.
The external structure is drawn in a similar way, but only highs and lows that have broken the previous structure are connected. This helps focus on important pivots and better understand the market structure.
SPY 4 Hour Swing TraderThe purpose of this script is to spot 4 hour pivots that indicate ~30 trading day swings. As VIX starts to drop options trading will get more boring and as we get back on the bull and can benefit from swing trading strategy. Swing trading doesn't make a whole lot of sense when VIX is above 28. Seems to get best results on 4 hour chart for this one. This indicator spots a go long opportunity when the 5 ema crosses the 13 ema on the 4 hour along with the RSI > 50 and the ADX > 20 and Stoichastic values (smoothed line < 80 or line < 90) and close > last candle close and the True Range < 6. It also spots uses a couple different means to determine when to exit the trade. Sell condition is primarily when the 13 ema crosses the 5 ema and the MACD line crosses below the signal line and the smoothed Stoichastic appears oversold (greater than 60) and slop of RSI < -.2. Stop Losses and Take Profits are configurable in Inputs along with ability to include short trades plus other MACD and Stoichastic settings. If a stop loss is encountered the trade will close. Also once twice the expected move is encountered partial profits will taken and stop losses and take profits will be re-established based on most recent close. Also a VIX above 28 will trigger any open positions to close. If trying to use this for something other than SPXL it is best to update stop losses and take profit percentages and check backtest results to ensure proper levels have been selected and the script gives satisfactory results.

SPY 1 Hour Swing TraderThe purpose of this script is to spot 1 hour pivots that indicate ~5 to 6 trading day swings. Results indicate that swings are held approximately 5 to 6 trading days on average, over the last 6 years. This indicator spots a go long opportunity when the 5 ema crosses the 13 ema on the 1 hour along with the RSI > 50. It also spots uses a couple different means to determine when to exit the trade. Sell condition is primarily when the 13 ema crosses the 5 ema and the MACD line crosses below the signal line and the smoothed Stoichastic appears oversold (greater than 60). Stop Losses and Take Profits are configurable in Inputs along with ability to include short trades plus other MACD and Stoichastic settings. If a stop loss is encountered the trade will close. Also once twice the expected move is encountered partial profits will taken and stop losses and take profits will be re-established based on most recent close. Once long trades are exited, short trades will be initiated if recent conditions appeared oversold and input option for short trading is enabled. If trying to use this for something other than SPXL it is best to update stop losses and take profit percentages and check backtest results to ensure proper levels have been selected and the script gives satisfactory results.

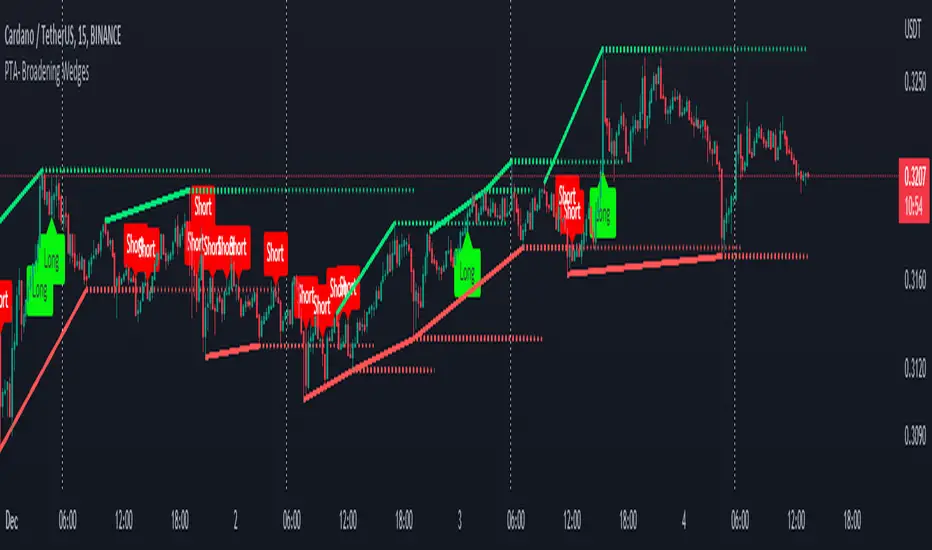
Pro Trading Art - Broadening WedgesThis indicator will create lines on the chart based on last two pivot high and low.
These line will create broadening wedges.
Trader can make trade when price break last wedge point.
Trader can identify breaking point with the help of dotted line.
About the Indicator Input
Pivot Length
This is a pivot look back length for both direction.
Auto Pitchfork, Fib Retracement and Zig Zag by DGTPitchfork is a technical indicator for a quick and easy way for traders to identify possible levels of support and resistance of an asset's price. It is presents and based on the idea that the market is geometric and cyclical in nature
Developed by Alan Andrews, so sometimes called Andrews’ Pitchfork
It is created by placing three points at the end of previous trends
Schiff and Modified Pitchfork is a technical analysis tool derived from Andrews' Pitchfork
In general, traders will purchase the asset when the price falls near the support of either the center trendline or the lowest trendline. Conversely, they'll sell the asset when it approaches the resistance of either the center line or the highest trendline.
█ Study OPTIONS
Auto Pitchfork , the main aim of the study
Pivots threshold can be customized by “Deviation” and “Depth” input options
Pitchfork Type selection, available options Andrews' Pitchfork (Original), Schiff and Modified Pitchfork
Ability to set ALERTs for the Pitchfork Levels
Ability to add customized levels (all level lines customizable)
Auto Fib Retracement – This is the build-in study of TradingView, slight changes applied to fit with Auto Pitchfork
Zig Zag – Derived from build-in Auto Fib Retracement with some customization options.
█ Usage Tips :
Andrews' Pitchfork (Original) best fit in a Strong Trending Market
Schiff and Modified Pitchfork better with Correcting or Sideways Market. Modified Pitchfork is almost identical to a Parallel Chanel
Disclaimer :
Trading success is all about following your trading strategy and the indicators should fit within your trading strategy, and not to be traded upon solely
The script is for informational and educational purposes only. Use of the script does not constitute professional and/or financial advice. You alone have the sole responsibility of evaluating the script output and risks associated with the use of the script. In exchange for using the script, you agree not to hold dgtrd TradingView user liable for any possible claim for damages arising from any decision you make based on use of the script

swing tradeTHIS strategy is based on the
franklin ochao swing trade book
confirmed bullish - when ever stock closed above R2 (more bullish)
when ever stock closed between R1 AND R2 (moderatly bullish or consolidation phase with respect to previous trend)
entry1 for more bullish trend is buy at every dips means when ever price low below pivot when it open above the pivot
entry2 for more bullish trend is buy at low is below s1
keep strictly stoploss at s1 of previous day (r2 close day)
trend reversal is possible once stock close below s1 in 1hr time frame
virgin cpr or missed pivot is added a advantage
For bearish mode this vice verse
RVC-Daily_PivotsPurpose: Fibonacci Pivot levels + Gann levels calculation and display on Chart automatically.
Mainly expected to use these for intraday trading on NIFTY and BankNifty
Display R1/R2/R3 - Pivot - S1/S2/S3 levels
Also display GANN Levels of
720- / 540- / 360- / 270-/ 180- / 90- / 45-
45+ / 90+ / 180+ / 270+ / 360+ /540+ /720 +
Same pivot levels are useful for any equity - support and resistance levels.
Levels indicated are only for reference and not meant for trading purpose.

CPR WidthThe indicator shows the width of the Central Pivot Range. Frank Ochoa call it It Pivot Range Histogram in his book.
Use it in conjunction with the Central Pivot Range indicator.
Below is the interpretation of the reading.
CPR Width > 0.5 - Sideways or Trading Range Day,
CPR Width > 0.75 - increases the likelihood of sideways trading behavior,
CPR Width < 0.5 - Trending type of day,
CPR Width < 0.25 - increases the likelihood of a trending market.
The above reading only increases the likely-hood of the possibility and not always right.

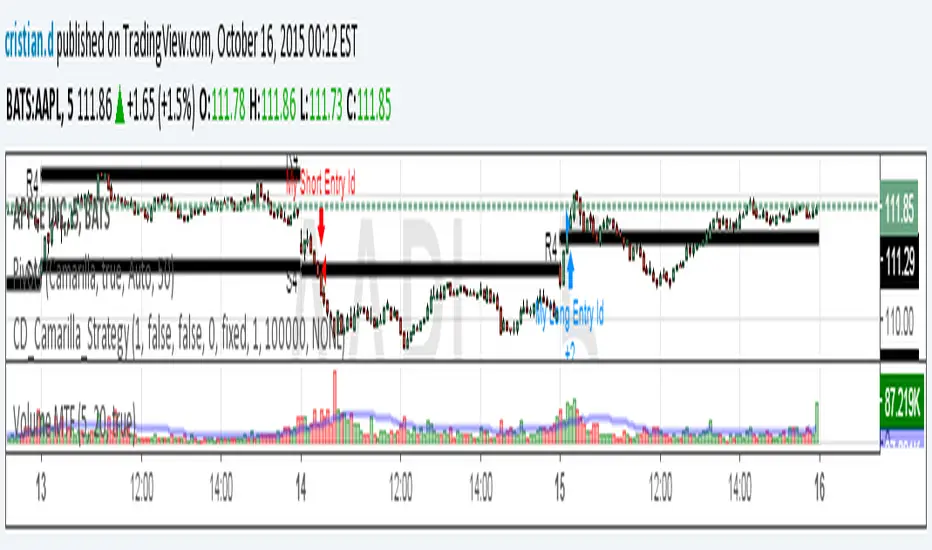
Camarilla Strategy - breakouts of H4 and L4Breakout strategy of H4 and L4 levels. Manual entries and exits - higher profits BUT because I am a novice in pinescript,
Can someone please:
1. Show me how to add exit strategy lines : close> ema(close,3) for exit short and opposite for long. I added myself but I can't make it to work in relation to camarilla entries; instead it shows all ema crossings..
2.Why some entries over/above my pivots are not shown.. Example:11.15 AM (short) and 13.10 PM (long) AAPL, October 15, today? Today would've been 3 signals, not one..
Thank you in advance for any advice. I am a strong Camarilla follower, but I am not a coder.
Short-Term Weekly Refuges (Shelters)## // Introduction //
══════════════
Short-Term Weekly Refuges (Shelters) (WR or RS) is a structural analysis indicator designed to track price action during the current week. It combines a configurable ZigZag with Fibonacci retracements anchored to recent phases, using the Weekly Opening Price (W.O.P.) as a key reference level.
This indicator is optimized for 4H timeframe but also works on 1H and 15min charts.
## // Theoretical Foundation of the Indicator //
═══════════════════════════════
The WR (RS) indicator provides a structural framework for following price action during the current trading week.
The core concept: Recent ZigZag phases, combined with the Weekly Opening Price, create dynamic support and resistance levels that institutional traders often monitor and use for intraweek positioning. The indicator allows you to select which recent phase (1-10) serves as the Fibonacci anchor.
## // Indicator Objectives //
══════════════════
1) Display a configurable ZigZag showing recent price structure with numbered phases (1 = most recent). Users should configure the ZigZag parameters based on whether they are analyzing a Major Degree Pattern (larger swings, less noise) or a Minor Degree Pattern (smaller swings, more detail), following standard Elliott Wave terminology. Configure the ZigZag to match the degree of your analysis: use higher Depth values for Major Degree Patterns, or lower values for Minor Degree Patterns.
2) Draw Fibonacci retracements on a user-selected phase, with two modes:
• "On ZigZag": Traditional Fibonacci on the selected phase.
• "Relative to W.O.P.": Fibonacci from phase anchor (i0) to Weekly Opening Price.
3) Show Weekly Opening Price lines as horizontal references, with the current week's line extended into the future.
4) Provide Pivot Up/Down markers for additional confirmation of local highs and lows.
5) Support multiple simultaneous indicator loads with visual identifier labels to distinguish between different analysis degrees (e.g., "Major Degree Pattern" vs "Minor Degree Pattern").
6) Optional Embedded Indicator: Enable Intraday Shelters (RID) - percentage-based support/resistance levels calculated from the Daily Opening Price, useful for 1H and 15min trading.
## // Key Features //
══════════════
• **Flexible ZigZag**: Adjustable Depth, Deviation, and Backstep parameters to adapt to any asset's volatility.
• **Phase Selection**: Choose from the 10 most recent phases for Fibonacci anchoring.
• **Dual Fibonacci Modes**: Trace on the ZigZag phase itself, or relative to the Weekly Opening Price.
• **New Age Color Palette**: Professional Fibonacci color scheme used by old school experienced traders.
• **Weekly Opening Price (W.O.P.)**: Historical weekly opens plus current week projection.
• **"Show Only W.O.P." Mode**: Isolate just the Weekly Opening Price line for cleaner charts on non-4H timeframes.
• **Optional Intraday Shelters (RID)**: 11 percentage levels (±0.382%, ±1%, ±1.5%, ±2%, ±2.5%) based on Daily Opening Price.
• **Multi-Load Support**: Visual identifier tags and Large Label for running multiple indicator instances simultaneously.
## // Recommended Workflow //
═════════════════════
1) Load the indicator on a 4H chart.
2) Adjust ZigZag parameters (Depth, Deviation) until the phases match your visual analysis of recent price structure.
3) Select the phase you want to use as Fibonacci anchor (typically Phase 2, 3 or higher).
4) Choose Fibonacci mode: "On ZigZag" for phase analysis, or "Relative to W.O.P." for analysis based on weekly opening price context.
5) Monitor how price interacts with the Fibonacci levels and Weekly Opening Price throughout the week.
6) Optionally enable RID for intraday precision on 1H or 15min charts.
## // Integration with Other Refuge Indicators //
════════════════════════════════
WR (RS) is part of a complete refuge-based analysis ecosystem:
• LTR (RLP) (Long-Term Refuges): For automatic determination of the predominant phase of a ZigZag, which institutional investors choose as the basis for a Fibo whose levels calculate the projection for order placement over the following months and years.
• LTRS (RLPS) (Simple Long-Term Refuges): Simplified version of LTR in which the known coordinates of the predominant phases (obtained with the LTR indicator) of one or up to five assets are easily captured for permanent long-term operation.
• WR (RS) (Short-Term Weekly Refuges): (This indicator) For short-term tactical analysis (4H, 1H) based on chosen phases of a ZigZag that define Fibo levels generated during the near past week(s) and probably effective in the present week.
• IDR (RID) (Intra-Day Refuges): For daily operations relying on intraday levels on timeframes of 1H or less. Ideal for scalping traders.
By combining LTR, LTRS, WR and IDR, you obtain a multi-level framework that allows you to operate with clarity at any time horizon, from intraday positions to investments spanning months and years.
## // Additional Notes //
════════════════
1) Default parameters are optimized for volatile assets (crypto, tech stocks). For forex or less volatile instruments, consider reducing Deviation to 3-8%.
2) The "Phase in Development" (dashed line) shows the tentative current ZigZag segment that may still change as new bars form.
3) Bug reports, improvement proposals for the ZigZag generator, pattern determination, or Fibo composition, etc., will be greatly appreciated and taken into account for a future version. Best regards and happy hunting.
(Sorry: Spanish translation erased trying to avoid confusing publishing banning rules).

TLADe GEX Dashboard - ES/SPX/SPY Gamma Exposure LevelsA professional framework for Gamma Exposure analysis on S&P 500 instruments.
━━━━━━━━━━━━━━━━━━━━━━━━━━━━
WHAT THIS INDICATOR DOES
This indicator visualizes key strategic levels derived from Gamma Exposure (GEX) analysis — the zones where dealer hedging flows create measurable support and resistance.
What you see:
- Call Walls — resistance zones where dealers hedge against upside
- Put Walls — support zones where dealers hedge against downside
- Zero Gamma — the structural pivot between mean-reversion and trend
- Expected Move bands — statistical range boundaries
- GEX Histogram — gamma distribution profile directly on chart
━━━━━━━━━━━━━━━━━━━━━━━━━━━━
KEY FEATURES
▸ Ticker Switcher
Select ES, SPX, or SPY directly in settings.
Data converts automatically. One script, three instruments.
▸ GEX Profile Histogram
See gamma distribution as horizontal bars on your chart.
Instantly spot where positioning clusters.
▸ Color Themes
Choose between Boreal, Classic, or Lady Trader palettes.
▸ Level Toggles
Show/hide level groups independently:
GEX Levels | System Levels | Structure Levels
▸ Rich Tooltips
Hover for details: GEX values, Call/Put ratio, Hold/Break probabilities.
▸ Flip Detection
When price crosses a level, it automatically updates role and style (solid → dashed).
━━━━━━━━━━━━━━━━━━━━━━━━━━━━
HOW TO READ THE LEVELS
Each line represents a zone where price reaction is statistically probable:
- Thick solid lines = level not yet crossed
- Dashed lines = level flipped (price crossed through)
- Cyan/Teal or Green = potential support (Put Walls)
- Pink/Red = potential resistance (Call Walls)
- Gray = structural levels (Zero Gamma, Vol Bands, PDH/PDL)
The indicator shows structure, not predictions.
Use it to identify where the market is likely to react — not which direction it will go.
━━━━━━━━━━━━━━━━━━━━━━━━━━━━
PRO TIP: CONFLUENCE
This tool is most powerful when combined with your own analysis.
Highest-probability setups occur when GEX levels align with:
Price action zones (support/resistance, order blocks)
Volume Profile (HVN/LVN, VWAP)
Technical structure (prior highs/lows, trend lines)
One level alone is information. Confluence is edge.
━━━━━━━━━━━━━━━━━━━━━━━━━━━━
ABOUT THE DATA
The levels shown use a static snapshot for demonstration.
For current session data, export fresh scripts from the TLADe terminal at tradelikeadealer.com
━━━━━━━━━━━━━━━━━━━━━━━━━━━━
DISCLAIMER
This tool is for informational and educational purposes only.
It does not constitute financial advice. Trading involves significant risk.
Past structure does not guarantee future behavior.


Turki alghamdiThis indicator is an advanced Pivot-based SuperTrend designed to provide maximum clarity for traders. It visually displays: - Exact entry candle - Dynamic stop loss - Up to 3 R-based profit targets - Clear trend direction

CPR PROCPR Pro - Central Pivot Range Indicator
A complete CPR trading toolkit with multi-timeframe support.
█ FEATURES
- CPR Zone (TC, BC, PP) - Daily, Weekly, or Monthly
- Support & Resistance Levels (S1-S3, R1-R3)
- Virgin CPR Detection - Highlights untested CPR zones (yellow)
- CPR Width Analysis - Narrow (breakout) vs Wide (range) days
- VWAP with 10 anchor options
- Trend EMA
- Dashboard with real-time bias & levels
- Customizable colors per timeframe
█ HOW TO USE
- BULLISH: Price above CPR - look for longs
- BEARISH: Price below CPR - look for shorts
- VIRGIN CPR: Untested zones = strong magnets
- NARROW CPR: Expect breakout day
- WIDE CPR: Expect range day
█ COLORS
- Daily CPR: Blue
- Weekly CPR: Green
- Monthly CPR: Orange
- Virgin CPR: Yellow

Swing High Low ZigZag v3.0 BajaSwing High/Low Pivot - Designed to help easily spot peaks and bottoms for quicker drawing of trendlines and other drawings as well as alerts without needing to zoom in a whole lot.

Pivot Points High Low (%-Auslenkung)Marks swing highs and lows only when the price deviation between opposite pivots exceeds a user-defined percentage threshold.

RSI Breakout Zones█ OVERVIEW
“RSI Breakout Zones” is a technical analysis tool that identifies significant zones on the chart based on the Relative Strength Index (RSI). The indicator maps overbought (OB) and oversold (OS) zones using boxes, then extends them until the next zone of the same type is detected, highlighting breakout points to aid in trade entry decisions. These zones often serve as areas of consolidation, support, or resistance.
█ CONCEPTS
The indicator identifies overbought (above 70) and oversold (below 30) zones, drawing boxes that extend until the next zone of the same type (OB for OB, OS for OS) is detected. Breakout signals are generated when the price crosses the zone boundaries, indicating potential shifts in market momentum.
Why are RSI zones important? These zones represent areas of extreme market sentiment, often leading to corrections or reversals. Overbought zones suggest potential selling pressure, while oversold zones indicate buying opportunities. After a breakout, a zone may switch roles, e.g., from support to resistance or vice versa, making it a key element in price action analysis. Larger zones, formed during high volatility, may attract price for retests due to stronger imbalances in buyer/seller dynamics. Consolidation often occurs within these zones as the market seeks equilibrium before further moves. However, in strong trends, zones may be decisively broken without immediate pullbacks, and their significance depends on their position relative to key support and resistance levels.
█ FEATURES
- RSI Zone Detection: Calculates RSI with a customizable length (default 14) and identifies overbought/oversold zones based on user-defined levels (default 70/30), drawing boxes that dynamically adjust to price action within the zone.
- Customizable Boxes: Zones extend until the next zone of the same type is detected. The indicator draws zones with adjustable colors for overbought (red) and oversold (green) areas, with options for box and zone transparency.
- Breakout Signals: Generates upward (green triangle) and downward (red triangle) breakout signals when the price crosses the top or bottom of a zone. Signals appear below or above the bar, indicating potential trade entry points.
- Midline: Automatically draws a dashed line at the midpoint of each zone, helping traders assess price behavior within the zone and potential halfway retests.
- Box Management: Option to remove outdated boxes.
- Alerts: Built-in support for alerts on breakout signals, enabling traders to receive notifications for key zone crossings.
█ HOW TO USE
Add to Chart: Apply the indicator to your TradingView chart via the Pine Editor or Indicators menu.
Configure Settings:
- RSI Settings: Adjust RSI Length (default 14), Overbought Level (default 70), and Oversold Level (default 30) to tailor zone detection sensitivity—higher lengths smooth signals for longer-term analysis.
- Box Settings: Configure colors and transparency for overbought (red) and oversold (green) zones, including box transparency (default 90) and zone transparency (default 90).
- Signal Settings: Customize breakout signal colors (green for upward, red for downward) and enable/disable keeping boxes after RSI normalization.
Interpreting Signals:
- Upward Breakout Signal: A green triangle below the bar indicates a breakout, suggesting potential bullish momentum and trend continuation or reversal.
- Downward Breakout Signal: A red triangle above the bar indicates a breakout, suggesting potential bearish momentum.
- RSI Zones: If the price re-enters a zone after a breakout, it may signal a false breakout or consolidation; persistent zones can act as future support/resistance levels. Consolidation often occurs within these zones as the market seeks equilibrium.
- Use signals alongside other technical analysis tools for confirmation, such as moving averages (to confirm trend direction), Fibonacci levels (to identify key price zones), or volume indicators (to validate breakout strength). Analyze RSI zones on higher timeframes for stronger signals due to broader market context.
█ APPLICATIONS
- Momentum Trading: Use RSI zones as overbought/oversold filters. In an uptrend, look for buying opportunities on upward breakouts, and in a downtrend, on downward breakouts. Combining with MACD crossovers, Fibonacci levels, or pivot points enhances zone significance.
- Inter-Zone Trading: Utilize breakouts from one RSI zone and hold the position until reaching the next zone, which may act as a target level or reversal point.
█ NOTES
- Test the indicator across different timeframes and markets (stocks, forex, crypto) to optimize RSI length and levels for your trading style.
- For best results, use in trending markets where RSI extremes are more predictive; in ranging markets, additional filters are recommended to reduce false signals.
- Always combine with risk management; RSI zones alone do not guarantee reversals, and false breakouts may occur in low-liquidity environments.

PT FinderThis is mostly helpful to find potential price targets for Daytrades on the daily chart (if stronger resistances / supports are too far away).
Shows highs / lows of nearby "pivot" candles (higher high / lower low than both candles around) - depending on expected trade direction. Based on my experience these can be potential (albeit weak) resistance / support.
If it shows values only in the wrong trade direction: set a checkmark at "Invert bullish / bearish price targets" in the indicator settings
Also shows the ADR (blue line = yesterday's close MINUS Average Day Range) - which is helpful for Daytrades to see what price movement you could potentially expect for the day!
As a nice bonus it also shows gaps as yellow areas - in case you maybe missed them because you zoomed in / out too much on your daily chart.
More infos: www.reddit.com

Pivot Points LIVE [CHE]Title:
Pivot Points LIVE Indicator
Subtitle:
Advanced Pivot Point Analysis for Real-Time Trading
Presented by:
Chervolino
Date:
September 24, 2024
Introduction
What are Pivot Points?
Definition:
Pivot Points are technical analysis indicators used to determine potential support and resistance levels in financial markets.
Purpose:
They help traders identify possible price reversal points and make informed trading decisions.
Overview of Pivot Points LIVE :
A comprehensive indicator designed for real-time pivot point analysis.
Offers advanced features for enhanced trading strategies.
Key Features
Pivot Points LIVE Includes:
Dynamic Pivot Highs and Lows:
Automatically detects and plots pivot high (HH, LH) and pivot low (HL, LL) points.
Customizable Visualization:
Multiple options to display markers, price labels, and support/resistance levels.
Fractal Breakouts:
Identifies and marks breakout and breakdown events with symbols.
Line Connection Modes:
Choose between "All Separate" or "Sequential" modes for connecting pivot points.
Pivot Extension Lines:
Extends lines from the latest pivot point to the current bar for trend analysis.
Alerts:
Configurable alerts for breakout and breakdown events.
Inputs and Configuration
Grouping Inputs for Easy Customization:
Source / Length Left / Length Right:
Pivot High Source: High price by default.
Pivot Low Source: Low price by default.
Left and Right Lengths: Define the number of bars to the left and right for pivot detection.
Colors: Customizable colors for pivot high and low markers.
Options:
Display Settings:
Show HH, LL, LH, HL markers and price labels.
Display support/resistance level extensions.
Option to show levels as a fractal chaos channel.
Enable fractal breakout/down symbols.
Line Connection Mode:
Choose between "All Separate" or "Sequential" for connecting lines.
Line Management:
Set maximum number of lines to display.
Customize line colors, widths, and styles.
Pivot Extension Line:
Visibility: Toggle the display of the last pivot extension line.
Customization: Colors, styles, and width for extension lines.
How It Works - Calculating Pivot Points
Pivot High and Pivot Low Detection:
Pivot High (PH):
Identified when a high price is higher than a specified number of bars to its left and right.
Pivot Low (PL):
Identified when a low price is lower than a specified number of bars to its left and right.
Higher Highs, Lower Highs, Higher Lows, Lower Lows:
Higher High (HH): Current PH is higher than the previous PH.
Lower High (LH): Current PH is lower than the previous PH.
Higher Low (HL): Current PL is higher than the previous PL.
Lower Low (LL): Current PL is lower than the previous PL.
Visual Elements
Markers and Labels:
Shapes:
HH and LH: Downward triangles above the bar.
HL and LL: Upward triangles below the bar.
Labels:
Optionally display the price levels of HH, LH, HL, and LL on the chart.
Support and Resistance Levels:
Extensions:
Lines extending from pivot points to indicate potential support and resistance zones.
Chaos Channels:
Display levels as a fractal chaos channel for enhanced trend analysis.
Fractal Breakout Symbols:
Buy Signals: Upward triangles below the bar.
Sell Signals: Downward triangles above the bar.
Slide 7: Line Connection Modes
All Separate Mode:
Description:
Connects pivot highs with pivot highs and pivot lows with pivot lows separately.
Use Case:
Ideal for traders who want to analyze highs and lows independently.
Sequential Mode:
Description:
Connects all pivot points in the order they occur, regardless of being high or low.
Use Case:
Suitable for identifying overall trend direction and momentum.
Pivot Extension Lines
Purpose:
Trend Continuation:
Visualize the continuation of the latest pivot point's price level.
Customization:
Colors:
Differentiate between bullish and bearish extensions.
Styles:
Solid, dashed, or dotted lines based on user preference.
Width:
Adjustable line thickness for better visibility.
Dynamic Updates:
The extension line updates in real-time as new bars form, providing ongoing trend insights.
Alerts and Notifications
Configurable Alerts:
Fractal Break Arrow:
Triggered when a breakout or breakdown occurs.
Long and Short Signals:
Specific alerts for bullish breakouts (Long) and bearish breakdowns (Short).
Benefits:
Timely Notifications:
Stay informed of critical market movements without constant monitoring.
Automated Trading Strategies:
Integrate with trading bots or automated systems for executing trades based on alerts.
Customization and Optimization
User-Friendly Inputs:
Adjustable Parameters:
Tailor pivot detection sensitivity with left and right lengths.
Color and Style Settings:
Match the indicator aesthetics to personal or platform preferences.
Line Management:
Maximum Lines Displayed:
Prevent chart clutter by limiting the number of lines.
Dynamic Line Handling:
Automatically manage and delete old lines to maintain chart clarity.
Flexibility:
Adapt to Different Markets:
Suitable for various financial instruments including stocks, forex, and cryptocurrencies.
Scalability:
Efficiently handles up to 500 labels and 100 lines for comprehensive analysis.
Practical Use Cases
Identifying Key Support and Resistance:
Entry and Exit Points:
Use pivot levels to determine optimal trade entry and exit points.
Trend Confirmation:
Validate market trends through the connection of pivot points.
Breakout and Breakdown Strategies:
Trading Breakouts:
Enter long positions when price breaks above pivot highs.
Trading Breakdowns:
Enter short positions when price breaks below pivot lows.
Risk Management:
Setting Stop-Loss and Take-Profit Levels:
Utilize pivot levels to place strategic stop-loss and take-profit orders.
Slide 12: Benefits for Traders
Real-Time Analysis:
Provides up-to-date pivot points for timely decision-making.
Enhanced Visualization:
Clear markers and lines improve chart readability and analysis efficiency.
Customizable and Flexible:
Adapt the indicator to fit various trading styles and strategies.
Automated Alerts:
Stay ahead with instant notifications on key market events.
Comprehensive Toolset:
Combines pivot points with fractal analysis for deeper market insights.
Conclusion
Pivot Points LIVE is a robust and versatile indicator designed to enhance your trading strategy through real-time pivot point analysis. With its advanced features, customizable settings, and automated alerts, it equips traders with the tools needed to identify key market levels, execute timely trades, and manage risks effectively.
Ready to Elevate Your Trading?
Explore Pivot Points LIVE and integrate it into your trading toolkit today!
Q&A
Questions?
Feel free to ask any questions or request further demonstrations of the Pivot Points LIVE indicator.
