Keltner Channels - signal providerThis enhanced channel for pro traders visually indicates enhanced entry or exit signal based on the position of the underlying within the channel. Remember: EVERY TREND HAS ITS RETRACEMENTS - with this indicator you will avoid entering in full uptrend (bearing more downside risk than upside) or exiting (shorting) at max downtrend.
To be used together with the trend on higher timeframes (especially for the interpretation of the baseline)
Upper part = potential sell signal (especially in overall downtrends)
Lower part = potential buy signal (especially in overall uptrends)
Basis = potential buy signal (especially in strong uptrends)
= potential sell signal (especially in overall downtrends)
Search in scripts for "pro"

Filter Trend1. Indicator Name
Premium EMA Ribbon Filter (Pro Version)
(Advanced Trend & Momentum Filtering System Based on EMA Ribbons)
2. One-Line Introduction
A professional trend-analysis indicator that blends an advanced noise-filtering algorithm with an EMA ribbon system to extract only the pure bullish/bearish trend while smoothing out market noise.
3. Overall Description (7+ lines)
The Premium EMA Ribbon Filter is more than just a set of EMAs.
It analyzes the structure of a fast, medium, and slow EMA ribbon—along with the spacing and alignment between them—to determine whether the market is in a bullish trend, bearish trend, or a neutral/noise-heavy zone.
The core of this indicator is its noise-reduction algorithm and trend-strength calculation system.
Instead of relying on simple EMA cross signals, it evaluates how consistently the ribbon maintains bullish/bearish alignment over a specified period and highlights only strong trends with color coding, while weak or noisy areas are displayed in gray.
This helps traders avoid confusing or false signals and clearly focus only on the “meaningful zones.”
A Triple-Smoothing System is applied to create smoother, more refined ribbon movements, forming a stable “premium trend curve” that is less affected by short-term volatility.
As a result, this indicator works effectively for scalping, swing trading, and long-term trend following—staying true to the principle of removing noise and highlighting only the core market flow.
4. Short Advantages (6 items)
① Complete Noise Filtering
Using EMA ribbon comparison + tolerance logic, false reversals are largely eliminated, leaving only stable trend phases.
② Highly Readable Color System
Bullish trends are mint, bearish trends are red, and neutral/noise zones are gray—instantly visualizing market conditions.
③ Trend Strength Visualization
Not only trend direction but also trend strength is displayed via dynamic color transparency.
④ Smooth, Premium-Style Ribbon Design
Triple-smoothing creates a refined, luxury-level smoothness in movement.
⑤ Works Across All Timeframes
From 1-minute scalping to daily/weekly macro trend analysis.
⑥ Excellent Real-Trading Compatibility
Works extremely well when combined with ATR, SuperTrend, and volume-based indicators.
Indicator Manual (Required Section)
📌 Understanding the Core Concept
The indicator uses three EMAs (e.g., 20/50/100) arranged as a ribbon to analyze the structural alignment of the trend.
When the EMAs are cleanly aligned Top → Middle → Bottom, the market is in a bullish trend.
When aligned Bottom → Middle → Top, the market is in a bearish trend.
The indicator further evaluates the ribbon spread (gap) and the consistency of alignment to compute trend strength.
Noisy market conditions are shaded gray to clearly indicate “uncertain/indecisive” zones.
⚙️ Settings Description
Option Description
Fast EMA Most sensitive EMA; detects early trend signals
Mid EMA Stabilizes the primary trend direction
Slow EMA Defines the broader, long-term trend flow
Trend Lookback The period used to analyze trend strength
Noise Tolerance (%) Higher values = stronger noise removal
Smoothing Steps Controls how smooth the ribbon becomes
📈 Example Recognition
A bullish continuation/entry scenario forms when:
EMAs align in the order Fast → Mid → Slow (top side)
Ribbon color shifts into mint (strong bullish trend)
The ribbon begins to expand while price stays above the ribbon
📉 Example Recognition
A bearish continuation/entry occurs when:
EMAs align Fast → Mid → Slow (bottom side)
Ribbon color remains red
After contracting, the ribbon expands again during renewed downside strength
🧪 Recommended Usage
Combine with volume-based indicators (OBV, Volume Profile) → enhanced strong-trend detection
Use with SuperTrend or ATR Stop → clearer stop-loss placement
Combine with RSI/Stoch → avoid counter-trend entries in overheated conditions
Higher leverage traders should use higher tolerance settings
🔒 Cautions
EMA ribbons are trend-following tools; signals may weaken in ranging/sideways markets.
Never rely solely on this indicator—always confirm with volume, price patterns, or structure.
Very low Lookback values may cause excessive re-entry signals.
In high-volatility environments, ribbon spacing can contract/expand rapidly—use with caution.

able zone# able zone
## 📋 Overview
**able zone** is an advanced Support & Resistance zone detection indicator optimized for **15-minute timeframe trading**. It combines Price Action, Volume Profile, and intelligent zone analysis to identify high-probability trading areas with precise entry and exit points.
## 🎯 Core Features
### 1. **Zone Detection Methods**
- **Auto Detect**: Automatically finds the best zones using combined analysis
- **Price Action**: Based on pivot points and price structure
- **Volume Profile**: Identifies High Volume Nodes (HVN) where most trading occurred
- **Combined**: Uses all methods together for comprehensive analysis
### 2. **Zone Types & Colors**
- 🟢 **Support Zones** (Green): Price tends to bounce up from these areas
- 🔴 **Resistance Zones** (Red): Price tends to reverse down from these areas
- 🟣 **HVN Zones** (Purple): High volume areas from Volume Profile
- **Strong Zones**: Darker colors indicate zones with more touches (higher reliability)
### 3. **Zone Strength Indicators**
- **Labels**: "S3" = Support with 3 touches, "R5" = Resistance with 5 touches
- **Touch Count**: More touches = stronger zone
- **Min Touch Count Setting**: Adjust to filter weak zones (default: 3)
## ⚙️ Settings Guide
### **Zone Detection Settings**
- **Detection Method**: Choose your preferred analysis method
- **Lookback Period** (50-500): How many bars to analyze (default: 200)
- For 15min: 200 bars = ~50 hours of data
- Shorter = Recent zones only
- Longer = Historical zones included
- **Min Touch Count** (2-10): Minimum touches to qualify as a zone (default: 3)
- **Zone Thickness %** (0.1-2.0): How thick the zones appear (default: 0.5)
- Based on ATR for dynamic sizing on 15min chart
### **Zone Colors**
Fully customizable colors for:
- Support Zone (default: Green)
- Resistance Zone (default: Red)
- Strong Support/Resistance (darker shades)
- Volume Profile Zone (default: Purple)
### **Zone Touch Detection**
- **Enable Touch Alerts**: Get notifications when price enters zones
- **Touch Distance %** (0.1-1.0): How close to zone counts as "touch" (default: 0.3%)
- On 15min chart, this gives early warning signals
- **Show Touch Markers**: Visual indicators when price touches zones
- 🔺 = Support touch (potential buy)
- 🔻 = Resistance touch (potential sell)
- 💎 = HVN touch (watch for breakout/rejection)
### **Volume Profile Integration**
- **Show VP Zones**: Display high volume node zones
- **VP Resolution** (20-50): Number of price levels analyzed (default: 30)
- **POC Line** (orange): Point of Control - highest volume price level
- **POC Width**: Line thickness (1-3)
- **Show HVN**: Display High Volume Node zones
- **HVN Threshold** (0.5-0.9): Volume % to qualify as HVN (default: 0.7)
### **Display Options**
- **Zone Labels**: Show S/R labels with touch count
- **Zone Border Lines**: Dotted lines at zone boundaries
- **Extend Zones Right**: Project zones into future
- **Max Visible Zones** (5-50): Maximum number of zones displayed (default: 20)
- Adjust based on chart clarity needs
- **Info Table**: Real-time information dashboard
## 📊 Info Table Explained
The info table (top-right corner) provides real-time zone analysis:
### **Row 1: ZONE Header**
- Shows current timeframe (15m)
- Total active zones
- "able" branding
### **Row 2: 🎯 TOUCH Status**
- **RES**: Currently touching resistance (⚠️ potential reversal down)
- **SUP**: Currently touching support (🚀 potential bounce up)
- **HVN**: Currently in high volume area (⚡ watch for direction)
- **FREE**: Not near any zone (⏳ wait for setup)
- Progress bar shows proximity strength
- Arrows indicate zone type
### **Row 3: 🟢 SUP - Support Zones**
- Number of active support zones below current price
- Progress bar shows relative quantity
- More support = stronger floor
### **Row 4: 🔴 RES - Resistance Zones**
- Number of active resistance zones above current price
- Progress bar shows relative quantity
- More resistance = stronger ceiling
### **Row 5: 🟣 HVN - High Volume Nodes**
- Number of HVN zones (from Volume Profile)
- These are areas where most trading activity occurred
- Often act as magnets for price
### **Row 6: 📍 NEAR - Nearest Zone**
- Shows closest zone type (SUP/RES/HVN)
- Distance in % to nearest zone
- Arrow shows if zone is above or below
### **Row 7: POSITION - Price Position**
- **HIGH**: Price near range top (70%+) - watch for resistance
- **MID**: Price in middle range (30-70%) - neutral zone
- **LOW**: Price near range bottom (<30%) - watch for support
- Shows exact position % in lookback range
### **Row 8: ═ SIGNAL ═**
- **🚀 BUY**: Touching support zone (entry opportunity)
- **⚠️ SELL**: Touching resistance zone (exit/short opportunity)
- **⚡ WATCH**: At HVN (prepare for breakout or rejection)
- **⏳ WAIT**: No clear setup (be patient)
## 🎓 Trading Strategy for 15-Minute Timeframe
### **Basic Setup**
1. Set timeframe to **15 minutes**
2. Use **Auto Detect** or **Combined** method
3. Set **Lookback Period**: 200 bars (~50 hours)
4. Set **Min Touch Count**: 3 (proven zones)
### **Entry Signals**
#### **Long Entry (Buy)**
- Price touches green support zone
- Table shows "🚀 BUY" signal
- Look for bullish candle pattern (hammer, engulfing)
- Volume increases on bounce
- **Best Entry**: Bottom of support zone
- **Stop Loss**: Below support zone (1-2 ATR)
- **Target**: Next resistance zone or 2:1 RR
#### **Short Entry (Sell)**
- Price touches red resistance zone
- Table shows "⚠️ SELL" signal
- Look for bearish candle pattern (shooting star, engulfing)
- Volume increases on rejection
- **Best Entry**: Top of resistance zone
- **Stop Loss**: Above resistance zone (1-2 ATR)
- **Target**: Next support zone or 2:1 RR
#### **HVN Breakout Strategy**
- Price approaches purple HVN zone
- Table shows "⚡ WATCH"
- Wait for breakout with strong volume
- **If breaks up**: Go long, target next resistance
- **If breaks down**: Go short, target next support
### **Zone Strength Rules**
- **S5+ or R5+**: Very strong zones (high probability)
- **S3-S4 or R3-R4**: Reliable zones (good setups)
- **S2 or R2**: Weak zones (use caution)
### **Best Trading Times (15min)**
- **London Open**: 08:00-12:00 GMT (high volume)
- **NY Open**: 13:00-17:00 GMT (high volatility)
- **Overlap**: 13:00-16:00 GMT (best setups)
- **Avoid**: Asian session low volatility periods
### **Risk Management**
- Never risk more than 1-2% per trade
- Use stop loss ALWAYS (place outside zones)
- Take partial profits at 1:1, let rest run to 2:1 or 3:1
- If price consolidates in zone > 3 candles, exit
## ⚠️ Important Notes
### **When Zones Work Best**
✅ Clear trending markets
✅ After significant price movements
✅ At session opens (London/NY)
✅ When multiple zones align
✅ Strong zone with 5+ touches
### **When to Be Cautious**
❌ During major news releases (use economic calendar)
❌ Very low volume periods
❌ Price consolidating inside zone
❌ Weak zones with only 2 touches
❌ Conflicting signals from multiple indicators
### **15-Minute Specific Tips**
- **Lookback 200**: Captures 2-3 trading days of zones
- **Touch Distance 0.3%**: Early signals on 15min moves
- **Max Zones 20**: Keeps chart clean but comprehensive
- **Watch POC**: Often acts as pivot on 15min
- **Volume spike + zone touch** = high probability setup
## 🔧 Recommended Settings for 15min
### **Conservative Trader**
- Detection Method: Combined
- Min Touch Count: 4
- Max Zones: 15
- Touch Distance: 0.2%
### **Aggressive Trader**
- Detection Method: Auto Detect
- Min Touch Count: 2
- Max Zones: 25
- Touch Distance: 0.5%
### **Volume Profile Focused**
- Detection Method: Volume Profile
- Show HVN: Yes
- HVN Threshold: 0.6
- Show POC: Yes
## 📈 Example Trade Scenario (15min)
**Setup**: BTC/USD on 15-minute chart
1. Price approaching green support zone at $42,000
2. Zone label shows "S4" (touched 4 times)
3. Table shows "🚀 BUY" signal
4. Volume increasing on approach
5. Bullish hammer candle forms
**Entry**: $42,050 (bottom of zone)
**Stop Loss**: $41,900 (below zone)
**Target 1**: $42,350 (2:1 RR)
**Target 2**: Next resistance at $42,650
**Result**: Price bounces, hits Target 1 in 3 candles (~45min)
## 💡 Pro Tips
1. **Combine with trend**: Trade in direction of higher timeframe trend
2. **Multiple touches**: Zones with 5+ touches are highest probability
3. **Volume confirmation**: Always check volume on zone touch
4. **POC magnet**: Price often returns to POC line
5. **False breakouts**: If price barely breaks zone and returns = strong signal
6. **Zone-to-zone**: Trade from support to resistance, resistance to support
7. **Time of day**: Best setups occur during peak volume hours
8. **Chart timeframe**: Use 1H to confirm trend, 15min for entry
9. **News avoidance**: Close trades before high-impact news
10. **Zone clusters**: Multiple zones together = strong area
---
**Created by able** | Optimized for 15-minute trading
**Version**: 1.0 | Compatible with TradingView Pine Script v5
For support and updates, enable alerts and monitor the info table in real-time!

CVD [able0.1]# CVD Overlay iOS Style - Complete User Guide
## 📖 Table of Contents
1. (#what-is-cvd)
2. (#installation-guide)
3. (#understanding-the-display)
4. (#reading-the-info-table)
5. (#settings--customization)
6. (#trading-strategies)
7. (#common-mistakes-to-avoid)
---
## 🎯 What is CVD?
**CVD (Cumulative Volume Delta)** tracks the **difference between buying and selling pressure** over time.
### Simple Explanation:
- **Positive CVD** (Orange) = More buying than selling = Bulls winning
- **Negative CVD** (Gray) = More selling than buying = Bears winning
- **Rising CVD** = Increasing buying pressure = Potential uptrend
- **Falling CVD** = Increasing selling pressure = Potential downtrend
### Why It Matters:
CVD helps you see **who's really in control** of the market - not just price movement, but actual buying/selling volume.
---
## 🚀 Installation Guide
### Step 1: Open Pine Editor
1. Go to TradingView
2. Click the **"Pine Editor"** tab at the bottom of the screen
3. Click **"New"** or open an existing script
### Step 2: Copy & Paste the Code
1. Select all existing code (Ctrl+A / Cmd+A)
2. Delete it
3. Copy the entire CVD iOS Style code
4. Paste it into Pine Editor
### Step 3: Add to Chart
1. Click **"Save"** button (or Ctrl+S / Cmd+S)
2. Click **"Add to Chart"** button
3. The indicator will appear on your chart!
### Step 4: Initial Setup
- The indicator appears as an **overlay** on your price chart
- You'll see an **orange/gray line** following price
- An **info table** appears in the top-right corner
---
## 📊 Understanding the Display
### Main Chart Elements:
#### 1. **CVD Line** (Orange/Gray)
- **Orange Line** = Positive CVD (buying pressure)
- **Gray Line** = Negative CVD (selling pressure)
- This line moves with your price chart but shows volume delta
#### 2. **CVD Zone** (Shaded Area)
- Light shaded box around the CVD line
- Shows the "range" of CVD movement
- Helps visualize CVD boundaries
#### 3. **Center Line** (Dotted)
- Gray dotted line in the middle of the zone
- Represents the "neutral" point
- CVD crossing this = shift in market control
#### 4. **Reference Asset Line** (Light Gray)
- Shows Bitcoin (BTC) price movement for comparison
- Helps you see if your asset moves with or against BTC
- Can be changed to any asset you want
#### 5. **CVD Label**
- Shows current CVD value
- Positioned above/below zone to avoid overlap
- Updates in real-time
#### 6. **Reset Background** (Very Light Gray)
- Appears when CVD resets
- Indicates a new calculation period
---
## 📋 Reading the Info Table
The info table (top-right) shows **8 key metrics**:
### Row 1: **Header**
```
╔═ CVD able ═╗ | 15m | ████████ | able
```
- **CVD able** = Indicator name + creator
- **15m** = Current timeframe
- **████████** = Visual decoration
- **able** = Creator signature
### Row 2: **CVD Value**
```
CVD▲ | 7.39K | ████████ | █
█
█
```
- **CVD▲** = CVD with trend arrow
- ▲ = CVD increasing
- ▼ = CVD decreasing
- ► = CVD unchanged
- **7.39K** = Actual CVD number
- **Progress Bar** = Visual strength (darker = stronger)
- **Vertical Bars** = Height shows intensity
### Row 3: **Delta**
```
◆DELTA | -1.274K | ████░░░░ | ░
░
```
- **Delta** = Volume change THIS BAR ONLY
- **Negative** = More selling this bar
- **Positive** = More buying this bar
- Shows **immediate** pressure (not cumulative)
### Row 4: **UP Volume**
```
UP↑ | -1.263K | ████████ | █
█
█
```
- Total **buying volume** this bar
- Higher = Stronger buying pressure
- Green/Orange vertical bars = Bullish strength
### Row 5: **DOWN Volume**
```
DN↓ | 2.643K | ████████ | ░
░
░
```
- Total **selling volume** this bar
- Higher = Stronger selling pressure
- Gray vertical bars = Bearish strength
### Row 6-7: **Reference Asset** (if enabled)
```
══ REF ══ | ══════ | ████████ | █
█
PRICE▲ | 4130.300 | ████████ | █
█
```
- **REF** = Reference asset header
- **PRICE▲** = Reference price with trend
- Shows if BTC (or chosen asset) is rising/falling
- Compare with your chart to see correlation
### Row 8: **Market Status**
```
◄STATUS► | NEUT | ████░░░░ | ▒
▒
```
- **BULL** = CVD positive + Delta positive = Strong buying
- **BEAR** = CVD negative + Delta negative = Strong selling
- **NEUT** = Mixed signals = Wait for clarity
**Status Colors:**
- **Orange background** = Bullish (good for long)
- **Gray background** = Bearish (good for short)
- **White background** = Neutral (no clear signal)
---
## ⚙️ Settings & Customization
### Main Settings (⚙️)
#### **CVD Reset**
- **None** = CVD never resets (from beginning of data)
- **On Higher Timeframe** = Resets when HTF candle closes
- 15m chart → Resets hourly
- 1h chart → Resets daily
- Recommended for most traders
- **On Session Start** = Resets at market open
- **On Visible Chart** = Resets from leftmost visible bar
#### **Precision**
- **Low (Fast)** = Uses 1m data, faster but less accurate
- **Medium** = Uses 5m data, balanced (recommended)
- **High** = Uses 15m data, most accurate but slower
#### **Cumulative**
- ✅ On = CVD accumulates over time (recommended)
- ❌ Off = Shows only current bar delta
#### **Show Labels**
- ✅ On = Shows CVD value label on chart
- ❌ Off = Cleaner chart, no label
#### **Show Info Table**
- ✅ On = Shows info table (recommended for beginners)
- ❌ Off = Hide table for minimalist view
---
### 🎨 iOS Style Colors
You can customize **every color** to match your chart theme:
#### **Primary Colors**
- **Primary (Orange)** = Main bullish color (#FF9500)
- **Secondary (Gray)** = Main bearish color (#8E8E93)
- **Background** = Table background (#FFFFFF)
- **Text** = Text color (#1C1C1E)
#### **Bullish/Bearish**
- **Bullish (Orange)** = Positive CVD color
- **Bearish (Gray)** = Negative CVD color
- **Opacity** = Zone transparency (0-100%)
- **Show Zone** = Enable/disable shaded area
#### **Table Colors** (📋)
- **Header Background** = Top row background
- **Header Text** = Top row text color
- **Cell Background** = Data cells background
- **Cell Text** = Data cells text color
- **Border** = Table border color
- **Accent Background** = Special rows background
- **Alert Background** = Warning/status background
---
### 📊 Reference Asset Settings
#### **Enable**
- ✅ On = Shows reference asset line
- ❌ Off = Hide reference asset
#### **Symbol**
- Default: `BINANCE:BTCUSDT`
- Can change to any asset:
- `BINANCE:ETHUSDT` (Ethereum)
- `SPX` (S&P 500)
- `DXY` (US Dollar Index)
- Any ticker symbol
#### **Color & Width**
- Customize line appearance
- Width: 1-4 (thickness)
---
## 💡 Trading Strategies
### Strategy 1: CVD Divergence (Beginner-Friendly)
**What to Look For:**
- Price making **higher highs** but CVD making **lower highs** = Bearish divergence
- Price making **lower lows** but CVD making **higher lows** = Bullish divergence
**How to Trade:**
1. Wait for divergence to form
2. Look for confirmation (price reversal, candlestick pattern)
3. Enter trade in divergence direction
4. Stop loss beyond recent high/low
**Example:**
```
Price: /\ /\ /\ (higher highs)
CVD: /\ / \/ (lower highs) = Bearish signal
```
### Strategy 2: CVD Trend Following (Intermediate)
**What to Look For:**
- **Strongly rising CVD** + **rising price** = Strong uptrend
- **Strongly falling CVD** + **falling price** = Strong downtrend
**How to Trade:**
1. Wait for CVD and price moving in same direction
2. Enter on pullbacks to support/resistance
3. Stay in trade while CVD trend continues
4. Exit when CVD trend breaks
**Signals:**
- CVD ▲▲▲ + Price ↑ = Go LONG
- CVD ▼▼▼ + Price ↓ = Go SHORT
### Strategy 3: CVD + Reference Asset (Advanced)
**What to Look For:**
- Your asset **rising** but BTC (reference) **falling** = Relative strength
- Your asset **falling** but BTC (reference) **rising** = Relative weakness
**How to Trade:**
1. Compare CVD movement with BTC
2. If your CVD rises faster than BTC = Buy signal
3. If your CVD falls faster than BTC = Sell signal
4. Use for **pair trading** or **asset selection**
### Strategy 4: Volume Delta Confirmation
**What to Look For:**
- **Large positive Delta** = Strong buying this bar
- **Large negative Delta** = Strong selling this bar
**How to Trade:**
1. Price breaks resistance + Large positive Delta = Confirmed breakout
2. Price breaks support + Large negative Delta = Confirmed breakdown
3. Use Delta to **confirm** price moves, not predict them
**Rules:**
- Delta > 2x average = Very strong pressure
- Delta near zero at key level = Weak move, likely false breakout
---
## 🎓 Reading Real Scenarios
### Scenario 1: Strong Buying Pressure
```
Table Shows:
CVD▲ | 12.5K | ████████ | ████ (CVD rising)
◆DELTA | +2.8K | ████████ | ▲ (Positive delta)
UP↑ | 3.1K | ████████ | ████ (High buy volume)
DN↓ | 0.3K | ██░░░░░░ | ░ (Low sell volume)
◄STATUS► | BULL | ████████ | ████ (Orange background)
```
**Interpretation:** Strong buying, good for LONG trades
### Scenario 2: Distribution (Hidden Selling)
```
Table Shows:
CVD► | 8.2K | ████░░░░ | ▒▒ (CVD flat)
◆DELTA | -1.5K | ████████ | ▼ (Negative delta)
UP↑ | 0.8K | ███░░░░░ | ░ (Low buy volume)
DN↓ | 2.3K | ████████ | ████ (High sell volume)
◄STATUS► | BEAR | ████████ | ░░░░ (Gray background)
```
**Interpretation:** Price may look stable, but selling increasing = Prepare for drop
### Scenario 3: Neutral/Choppy Market
```
Table Shows:
CVD► | 5.1K | ████░░░░ | ▒ (CVD sideways)
◆DELTA | +0.2K | ██░░░░░░ | ─ (Small delta)
UP↑ | 1.2K | ████░░░░ | ▒ (Medium buy)
DN↓ | 1.0K | ████░░░░ | ▒ (Medium sell)
◄STATUS► | NEUT | ████░░░░ | ▒▒ (White background)
```
**Interpretation:** No clear direction = Stay out or reduce position size
---
## ⚠️ Common Mistakes to Avoid
### Mistake 1: Trading on CVD Alone
- ❌ **Wrong:** "CVD is rising, I'll buy immediately"
- ✅ **Right:** "CVD is rising, let me check price structure, support/resistance, and wait for confirmation"
### Mistake 2: Ignoring Delta
- ❌ **Wrong:** Looking only at cumulative CVD
- ✅ **Right:** Watch both CVD (trend) and Delta (momentum)
- Delta shows **immediate** pressure changes
### Mistake 3: Wrong Timeframe
- ❌ **Wrong:** Using 1m chart with High Precision (too slow)
- ✅ **Right:** Match precision to timeframe:
- 1m-5m → Low Precision
- 15m-1h → Medium Precision
- 4h+ → High Precision
### Mistake 4: Not Using Reset
- ❌ **Wrong:** Using "None" reset for intraday trading
- ✅ **Right:** Use "On Higher Timeframe" to see fresh CVD each session
### Mistake 5: Overtrading Neutral Status
- ❌ **Wrong:** Forcing trades when STATUS = NEUT
- ✅ **Right:** Only trade clear BULL or BEAR status
### Mistake 6: Ignoring Reference Asset
- ❌ **Wrong:** Trading altcoin without checking BTC
- ✅ **Right:** Always check if BTC CVD agrees with your asset
---
## 🔥 Pro Tips
### Tip 1: Multi-Timeframe Analysis
- Check CVD on **3 timeframes**:
- Lower TF (15m) = Entry timing
- Current TF (1h) = Trade direction
- Higher TF (4h) = Overall trend
### Tip 2: Volume Confirmation
- Big price move + Small Delta = **Weak move** (likely reversal)
- Small price move + Big Delta = **Strong accumulation** (continuation)
### Tip 3: CVD Reset Zones
- Pay attention to **reset backgrounds** (light gray)
- Often marks **session starts** = High volatility periods
### Tip 4: Divergence + Status
- Bearish divergence + STATUS = BEAR = **Strongest short signal**
- Bullish divergence + STATUS = BULL = **Strongest long signal**
### Tip 5: Color Psychology
- **Orange** (Bullish) is **warm** = Buying energy
- **Gray** (Bearish) is **cool** = Selling pressure
- Train your eye to read colors instantly
### Tip 6: Table as Quick Scan
- Glance at table without reading numbers:
- **All orange** = Bullish
- **All gray** = Bearish
- **Mixed** = Wait
---
## 📱 Quick Reference Card
| Signal | CVD | Delta | Status | Action |
|--------|-----|-------|--------|--------|
| **Strong Buy** | ▲▲ High | ++ Positive | BULL | Long Entry |
| **Strong Sell** | ▼▼ Low | -- Negative | BEAR | Short Entry |
| **Divergence Buy** | ▲ Rising | Price ▼ | → BULL | Long Setup |
| **Divergence Sell** | ▼ Falling | Price ▲ | → BEAR | Short Setup |
| **Neutral** | → Flat | ~0 Near Zero | NEUT | Stay Out |
| **Accumulation** | → Flat | ++ Positive | NEUT→BULL | Watch for Breakout |
| **Distribution** | → Flat | -- Negative | NEUT→BEAR | Watch for Breakdown |
---
## 🆘 Troubleshooting
### Issue: "Indicator not showing"
- **Solution:** Make sure overlay=true in code, re-add to chart
### Issue: "Table overlaps with price"
- **Solution:** Change table position in code or use TradingView's "Move" feature
### Issue: "CVD line too far from price"
- **Solution:** This is normal! CVD is volume-based, not price-based. Focus on CVD direction, not position
### Issue: "Too many lines on chart"
- **Solution:** Disable "Show Zone" and "Show Labels" in settings for cleaner view
### Issue: "Calculations too slow"
- **Solution:** Change Precision to "Low (Fast)" or use higher timeframe
### Issue: "Reference asset not showing"
- **Solution:** Check if "Enable" is ON and symbol is valid (e.g., BINANCE:BTCUSDT)
---
## 🎬 Getting Started Checklist
- Install indicator on TradingView
- Set precision to "Medium"
- Set reset to "On Higher Timeframe"
- Enable info table
- Add reference asset (BTC)
- Practice reading the table on demo account
- Test on different timeframes (15m, 1h, 4h)
- Compare CVD with your current strategy
- Paper trade for 1 week before going live
- Keep a trading journal of CVD signals
---
## 📚 Summary
**CVD shows WHO is winning: Buyers or Sellers**
**Key Points:**
1. **Orange/Rising CVD** = Buying pressure = Bullish
2. **Gray/Falling CVD** = Selling pressure = Bearish
3. **Delta** = Immediate momentum THIS BAR
4. **Status** = Overall market condition
5. **Always confirm** with price action & other indicators
**Remember:**
- CVD is a **tool**, not a crystal ball
- Use with proper risk management
- Practice makes perfect
- Stay disciplined!
---
**Created by: able**
**Version:** iOS Style v1.0
**Contact:** For questions, refer to TradingView community
Happy Trading! 🚀📈

Smart RSI Composite [DotGain]Summary
Do you want to know the "True Direction" of the market without getting distracted by noise on a single timeframe?
The Smart RSI Composite simplifies market analysis by aggregating momentum data from 10 different timeframes (5m to 12M) into a single, easy-to-read Histogram.
Instead of looking at 10 separate charts or dots, this indicator calculates the Average RSI of the entire market structure. It answers one simple question: "Is the market predominantly Bullish or Bearish right now?"
⚙️ Core Components and Logic
This indicator works like a consensus mechanism for momentum:
Data Aggregation: It pulls RSI values from 10 customizable slots (Default: 5m, 15m, 1h, 4h, 1D, 1W, 1M, 3M, 6M, 12M). All slots are enabled by default.
Smart Averaging: It calculates the arithmetic mean of all active timeframes. If the 5m chart is bearish but the Monthly chart is bullish, this indicator balances them out to show you the net result.
Histogram Visualization: The result is plotted as a histogram centered around the 50-line (Neutral).
🚦 How to Read the Histogram
The histogram bars indicate the aggregate strength of the trend based on the Average RSI:
🟩 DARK GREEN (Strong Bullish)
Condition: Average RSI > 60.
Meaning: The market is in a strong uptrend across most timeframes. Momentum is firmly on the buyers' side.
🟢 LIGHT GREEN (Weak Bullish)
Condition: Average RSI between 50 and 60.
Meaning: Slight bullish bias. The bulls are in control, but momentum is not yet extreme.
🔴 LIGHT RED (Weak Bearish)
Condition: Average RSI between 40 and 50.
Meaning: Slight bearish bias. The bears are taking control.
🟥 DARK RED (Strong Bearish)
Condition: Average RSI < 40.
Meaning: The market is in a strong downtrend across most timeframes. Momentum is firmly on the sellers' side.
Visual Elements
Center Line (50): This acts as the Zero-Line. Above 50 is bullish, below 50 is bearish.
Zone Lines (30/70): Dashed lines indicate the traditional Overbought/Oversold levels applied to the aggregate average.
Key Benefit
The Smart RSI Composite acts as a powerful Macro Trend Filter .
Pro Tip: Never go long if the Histogram is Dark Red, and avoid shorting when it is Dark Green. Use this tool to align your trades with the overall market momentum.
Have fun :)
Disclaimer
This "Smart RSI Composite" indicator is provided for informational and educational purposes only. It does not, and should not be construed as, financial, investment, or trading advice.
The signals generated by this tool (both "Buy" and "Sell" indications) are the result of a specific set of algorithmic conditions. They are not a direct recommendation to buy or sell any asset. All trading and investing in financial markets involves substantial risk of loss. You can lose all of your invested capital.
Past performance is not indicative of future results. The signals generated may produce false or losing trades. The creator (© DotGain) assumes no liability for any financial losses or damages you may incur as a result of using this indicator.
You are solely responsible for your own trading and investment decisions. Always conduct your own research (DYOR) and consider your personal risk tolerance before making any trades.

Market Energy & Direction DashboardMarket Energy & Direction Dashboard - Daytrading
Overview
A comprehensive real-time market internals dashboard that combines NYSE TICK, NYSE Advance-Decline (ADD) momentum, VIX direction, and relative volume into a single visual traffic light system with intelligent signal synthesis. Designed for active daytraders who need instant confirmation of market direction and energy based on momentum alignment across all major internals.
What It Does
This indicator synthesizes multiple market internals using directional momentum analysis rather than static thresholds to provide clear, actionable signals:
• Traffic Light System: Single glance confirmation of market state
o Bright Green: Maximum bullish - all internals aligned (TICK + ADD rising + VIX falling + volume)
o Bright Red: Maximum bearish - all internals aligned (TICK + ADD falling + VIX rising + volume)
o Yellow: Exhaustion warning - TICK at extremes, potential reversal imminent
o Moderate Colors: Partial alignment - some confirmation but not complete
o Gray: Choppy, neutral, or conflicting signals
• Real-Time Dashboard displays:
o Current TICK value with exhaustion warnings
o Current ADD with directional momentum indicator (↑ rising = breadth improving, ↓ falling = breadth deteriorating, ± compression)
o VIX level with directional indicator (↓ declining = bullish, ↑ rising = bearish, ± compression = neutral)
o Relative volume (current vs 20-period average)
o Composite status message synthesizing all data into clear directional summary
Key Features
✓ Momentum-based analysis - all indicators show direction/change, not just levels ✓ Intelligent signal hierarchy from "Maximum" to "Moderate" based on internal alignment ✓ ADD directional momentum - catches breadth shifts early, works in all market conditions ✓ VIX directional analysis - shows if fear is increasing, decreasing, or stagnant ✓ Color-coded traffic light for instant decision making ✓ Detects TICK/ADD divergences (conflicting signals = caution) ✓ Exhaustion warnings at extreme TICK levels (±1000+) ✓ Composite status messages - "Maximum Bull", "Strong Bull", "Moderate Bull", etc. ✓ Customizable thresholds for all parameters ✓ Moveable dashboard (9 position options) ✓ Built-in alerts for all signal strengths, exhaustion, and divergences
How To Use
Setup:
1. Add indicator to your main trading chart (SPY, ES, NQ, etc.)
2. Default settings work well for most traders, but you can customize:
o TICK Extreme Level (default 1000)
o ADD Compression Threshold (default 100 - detects when breadth is stagnant)
o VIX Elevated Level (default 20)
o VIX Compression Threshold (default 2% - detects low volatility)
o Volume Threshold (default 1.5x average)
3. Position dashboard wherever convenient on your chart
Reading The Signals:
Signal Hierarchy (Strongest to Weakest):
MAXIMUM SIGNALS ⭐ (Brightest colors - All 4 internals aligned)
• "✓ MAXIMUM BULL": TICK bullish + ADD rising (↑) + VIX falling (↓) + Volume elevated
o This is the holy grail setup - all momentum aligned, highest conviction longs
• "✓ MAXIMUM BEAR": TICK bearish + ADD falling (↓) + VIX rising (↑) + Volume elevated
o Perfect storm bearish - all momentum aligned, highest conviction shorts
STRONG SIGNALS (Bright colors - Core internals aligned)
• "✓ STRONG BULL": TICK bullish + ADD rising (↑)
o Strong confirmation even without VIX/volume - breadth supporting the move
• "✓ STRONG BEAR": TICK bearish + ADD falling (↓)
o Strong confirmation - both momentum and breadth deteriorating
MODERATE SIGNALS (Faded colors - Partial confirmation)
• "MODERATE BULL": TICK bullish but ADD not confirming direction
o Proceed with caution - momentum present but breadth questionable
• "MODERATE BEAR": TICK bearish but ADD not confirming direction
o Proceed with caution - selling but breadth not fully participating
WARNING SIGNALS
• "⚠ EXHAUSTION" (Yellow): TICK at ±1000+ extremes
o Potential reversal zone - prepare to fade or take profits
o Often marks blow-off tops or capitulation bottoms
NEUTRAL/AVOID
• "CHOPPY/NEUTRAL" (Gray): Conflicting signals or low conviction
o Stay out or reduce size significantly
Individual Indicator Interpretation:
TICK:
• Green: Bullish momentum (>+300)
• Red: Bearish momentum (<-300)
• Yellow: Exhaustion (±1000+)
• Gray: Neutral
ADD (Advance-Decline):
• Green (↑): Breadth improving - more stocks participating in the move
• Red (↓): Breadth deteriorating - fewer stocks participating
• Gray (±): Breadth stagnant - no clear participation trend
VIX:
• Green (↓): Fear declining - healthy environment for rallies
• Red (↑): Fear rising - risk-off mode, supports downward moves
• Gray (±): Volatility compression - often precedes explosive moves
Volume:
• Green: High conviction (>1.5x average)
• Gray: Low conviction
Trading Strategy:
1. Wait for "MAXIMUM" or "STRONG" signals for highest probability entries
o Maximum signals = go full size with confidence
o Strong signals = good conviction, normal position sizing
2. Confirm directional alignment:
o For longs: Want ADD ↑ (rising) and VIX ↓ (falling)
o For shorts: Want ADD ↓ (falling) and VIX ↑ (rising)
3. Use exhaustion warnings (yellow) to:
o Take profits on existing positions
o Prepare counter-trend entries
o Tighten stops
4. Avoid "MODERATE" signals unless you have strong conviction from other analysis
o These work best as confirmation for existing setups
o Not strong enough to initiate new positions alone
5. Never trade "CHOPPY/NEUTRAL" signals
o Gray means stay out - preserve capital
o Wait for clear alignment
6. Watch for divergences:
o Price making new highs but ADD ↓ (falling) = distribution warning
o Price making new lows but ADD ↑ (rising) = potential bottom
o Divergence alert will notify you
Best Practices:
• Use on 1-5 minute charts for daytrading
• Combine with your price action or technical setup (support/resistance, trendlines, patterns)
• The dashboard confirms when to take your setup, not what setup to take
• Most effective during regular market hours (9:30 AM - 4:00 PM ET) when volume is present
• The strongest edge comes from "MAXIMUM" signals - wait for these for best risk/reward
• Pay special attention to ADD direction - it's the most predictive breadth indicator
• VIX compression (gray ±) often signals upcoming volatility expansion - prepare for bigger moves
Customization Option
All thresholds are adjustable in settings:
• TICK Extreme: Higher = fewer exhaustion warnings (try 1200-1500 for less sensitivity)
• ADD Compression Threshold: Change detection sensitivity
o Default 100 = balanced
o Lower (50) = more sensitive to small breadth changes
o Higher (200-300) = only shows major breadth shifts
• VIX Elevated: Adjust for current volatility regime (15-25 typical range)
• VIX Compression Threshold:
o Default 2% = balanced
o Lower (0.5-1%) = catches subtle VIX changes
o Higher (3-5%) = only shows significant VIX moves
• Volume Threshold: Lower for quieter stocks/times, higher for more confirmation
Alerts Available
• Maximum Bullish: All 4 internals aligned bullish (TICK + ADD↑ + VIX↓ + Volume)
• Maximum Bearish: All 4 internals aligned bearish (TICK + ADD↓ + VIX↑ + Volume)
• Strong Bullish: TICK bullish + ADD rising
• Strong Bearish: TICK bearish + ADD falling
• Exhaustion Warning: TICK at extreme levels
• Divergence Warning: TICK and ADD directions conflicting
Understanding the Signal Synthesis
The indicator uses intelligent logic to combine all internals:
"MAXIMUM" Signals require:
• TICK direction (bullish/bearish)
• ADD momentum (rising/falling) in same direction
• VIX direction (falling for bulls, rising for bears)
• Volume elevated (>1.5x average)
"STRONG" Signals require:
• TICK direction (bullish/bearish)
• ADD momentum (rising/falling) in same direction
• (VIX and volume are bonuses but not required)
"MODERATE" Signals:
• TICK showing direction
• But ADD not confirming or contradicting
• Weakest actionable signal
This hierarchy ensures you know exactly how much conviction the market has behind any move.
Technical Details
• Pulls real-time data from NYSE TICK (USI:TICK), NYSE ADD (USI:ADD), and CBOE VIX
• ADD direction calculated using bar-to-bar change with compression detection
• VIX direction calculated using bar-to-bar percentage change
• Volume calculation uses 20-period simple moving average
• Dashboard updates every bar
• No repainting - all calculations based on closed bar data
Who This Is For
• Active daytraders of stocks, futures (ES/NQ), and options
• Scalpers needing quick directional confirmation with multiple internal alignment
• Swing traders looking to time intraday entries with maximum confluence
• Volatility traders who monitor VIX behavior
• Market makers and professionals who trade based on breadth and internals
• Anyone who monitors market internals but wants intelligent synthesis vs raw data
Tips For Success
Trading Philosophy:
• Quality over quantity - wait for "MAXIMUM" signals for best results
• One "MAXIMUM" signal trade is worth five "MODERATE" signal trades
• Gray/neutral is not a sign of missing opportunity - it's protecting your capital
Signal Confidence Levels:
1. MAXIMUM (95%+ confidence) - Trade these aggressively with full size
2. STRONG (80-85% confidence) - Trade these with normal position sizing
3. MODERATE (60-70% confidence) - Only if confirmed by strong technical setup
4. CHOPPY/NEUTRAL - Do not trade, wait for clarity
Advanced Techniques:
• Breadth divergences: Watch for price making new highs while ADD shows ↓ (falling) = major warning
• VIX/Price divergences: Rallies with rising VIX (↑) are usually false moves
• Volume confirmation: "MAXIMUM" signals with 2x+ volume are the absolute best
• Compression zones: When both ADD and VIX show compression (±), expect explosive breakout soon
• Sequential signals: Back-to-back "MAXIMUM" signals in same direction = strong trending day
Common Patterns:
• Opening surge with "MAXIMUM BULL" that shifts to "EXHAUSTION" (yellow) = fade the high
• Selloff with "MAXIMUM BEAR" followed by ADD ↑ (rising) divergence = potential reversal
• Choppy morning followed by "MAXIMUM" signal afternoon = best trending opportunity
Example Scenarios
Perfect Bull Entry:
• Bright green signal box
• TICK: +650
• ADD: +1200 (↑)
• VIX: 18.30 (↓)
• Volume: 2.3x
• Status: "✓ MAXIMUM BULL" → ALL SYSTEMS GO - Take aggressive long positions
Strong Bull (Good Confidence):
• Green signal box (slightly less bright)
• TICK: +500
• ADD: +800 (↑)
• VIX: 19.50 (±)
• Volume: 1.2x
• Status: "✓ STRONG BULL" → Good long setup - breadth confirming even without VIX/volume
Caution Bull (Moderate):
• Faded green signal box
• TICK: +400
• ADD: +900 (↓)
• VIX: 20.10 (↑)
• Volume: 0.9x
• Status: "MODERATE BULL" → CAUTION - TICK bullish but breadth deteriorating and VIX rising = weak rally
Exhaustion Warning:
• Yellow signal box
• TICK: +1350 ⚠
• ADD: +2100 (↑)
• VIX: 17.20 (↓)
• Volume: 1.8x
• Status: "⚠ EXHAUSTION" → Take profits or prepare to fade - TICK overextended despite good internals
Divergence Setup (Potential Reversal):
• Faded green signal
• TICK: +300
• ADD: +1800 (↓)
• VIX: 21.50 (↑)
• Volume: 1.6x
• Status: "MODERATE BULL" → WARNING - Price rallying but breadth collapsing and fear rising = distribution
Perfect Bear Entry:
• Bright red signal box
• TICK: -780
• ADD: -1600 (↓)
• VIX: 24.80 (↑)
• Volume: 2.5x
• Status: "✓ MAXIMUM BEAR" → Perfect short setup - all momentum bearish with conviction
Compression (Wait Mode):
• Gray signal box
• TICK: +50
• ADD: -200 (±)
• VIX: 16.40 (±)
• Volume: 0.7x
• Status: "CHOPPY/NEUTRAL" → STAY OUT - Volatility compression, no conviction, await breakout
Performance Optimization
Best Market Conditions:
• Works excellent in trending markets (up or down)
• Particularly powerful during high-volume sessions (first/last hours)
• "MAXIMUM" signals most reliable during 9:45-11:00 AM and 2:00-3:30 PM ET
Less Effective During:
• Lunch period (11:30 AM - 1:30 PM) - lower volume reduces signal quality
• Low-volatility environments - compression signals dominate
• Major news events in first 5 minutes - wait for internals to stabilize
Recommended Use Cases:
• Scalping: Trade only "MAXIMUM" signals for quick 5-15 minute moves
• Daytrading: Use "MAXIMUM" and "STRONG" signals for position entries
• Swing entries: Use "MAXIMUM" signals for optimal intraday entry timing
• Exit timing: Use "EXHAUSTION" (yellow) warnings to take profits
________________________________________
Pro Tip: Create a dedicated workspace with this indicator on SPY/ES/NQ charts. Set alerts for "MAXIMUM BULL", "MAXIMUM BEAR", and "EXHAUSTION" signals. Most professional traders only trade the "MAXIMUM" setups and ignore everything else - this alone can dramatically improve win rates.

deKoder | Ultra High Timeframe Moving Average & Log StDev BandsdeKoder | Ultra High Timeframe Moving Average & Log StDev Bands
Identify long-term statistical extremes and map the core trend with the deKoder | uHTF MA indicator. Designed for macro analysis, this tool uses ultra high timeframe moving averages and logarithmic standard deviation bands to frame price action, providing clear signals for when an asset is statistically cheap, fairly priced, or expensive.
KEY FEATURES
• Ultra High Timeframe (uHTF) Moving Average:
• Acts as a dynamic long term fair value equilibrium line. Choose from periods like 1-Year, 2-Year, or 'Long Time'.
• Select your MA type: SMA, EMA, Hull MA, or a Rolling VWAP .
• Automatically fetches optimal data (4H/D) for smoother plotting on lower timeframes.
• Probabilistic Logarithmic Bands:
• The bands are calculated using log-standard deviation , creating a framework that adapts to exponential growth. As such, your chart price scale should be set to log.
• ~68% of price action typically occurs between the ±1σ bands (fair value zone).
• Trading in the ±1σ to ±2σ channel is typical in a strongly trending market. Moves towards the ±3σ bands can indicate that the market is becoming overextended. Expect strong price moves here and pay attention for signs of reversal.
• Bitcoin Halving Timeline:
• Integrated vertical lines and labels for all Bitcoin halvings.
• Correlates technical extremes with fundamental scarcity events.
• 4-Year Cycle Visual Aid:
• The background color cycle highlights yearly changes.
• Red years have historically aligned with bear markets, while the subsequent green zone has marked accumulation phases.
• Note: The bands provide the primary information - the background color is a contextual guide based on historical patterns around the BTC 4 year halving cycle that may not persist in future. It's quite possible that the market will act differently going forward considering the new types participants such as ETFs and government reserve funds.
HOW TO USE & INTERPRET
• Fair Value & Extremes:
• Price between ±1σ Bands: The asset is trading within a statistically fair value range.
• Price at +2σ / +3σ Bands: The asset is statistically expensive. Statistically, the price is overextended in this region, although you do NOT want to fade it based only upon this information.
• Price at -2σ / -3σ Bands: The asset is statistically cheap. These zones have frequently coincided with the end of bear markets and profound long-term buying opportunities.
• Dynamic Support & Resistance:
• The uHTF MA and its bands tend to act as support and resistance areas of interest on daily, weekly and monthly charts.
INPUTS & CUSTOMIZATION
• Toggles : Master switch for the MA, Bands, and Halving markers.
• uHTF Moving Average Filter : Select instrument (default: BITSTAMP:BTCUSD), price source, MA length, and type.
• Colours : Fine-tune the appearance of all elements.
PRO TIPS
• While created for Bitcoin, this principle will work well on other high-growth assets and major indices.
• The most reliable signals occur on the Daily, Weekly and Monthly timeframes.
• This is a lagging, macro-filter indicator. It is not for timing short-term entries but for confirming the long-term trend and cycle phase.
"Be Fearful When Others Are Greedy and Greedy When Others Are Fearful." - The deKoder | uHTF MA is here to help you quantify that greed and fear on a macro scale.

FTAP PRO TREND This indicator plots the 20- and 200-period exponential moving averages on the chart with a coloring rule and an entry signal based on the start bar of the FTAP method
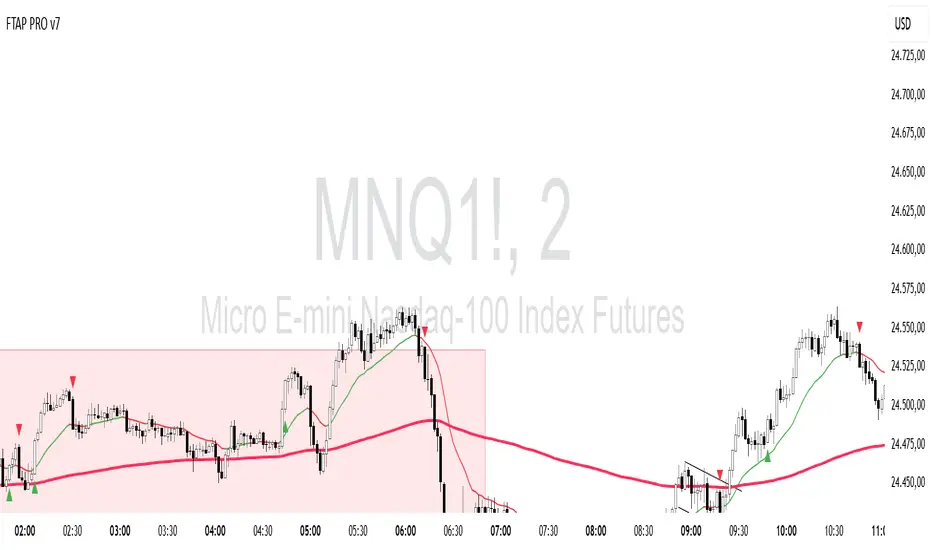
FTAP PRO TREND This indicator plots the 20 and 200 exponential moving averages, colors the 20-period average, and plots the entry signal from the start bar (power bar).

Stochastic BTC OptimizedEnhanced Stochastic for Bitcoin (BTC) – Optimized for Daily Timeframe
This enhanced Stochastic oscillator is specifically fine-tuned for BTC/USD on the 1D timeframe, leveraging historical data from Bitstamp (2011–2025) to minimize false signals and maximize reliability in Bitcoin's volatile swings.
Unlike the classic Stochastic (14, 3, 3), this version uses optimized parameters:
- K Period = 21 – smoother reaction, better suited for BTC’s macro cycles
- D Period = 3, Smooth K = 3 – reduces noise while preserving responsiveness
- Overbought = 85, Oversold = 15 – accounts for BTC’s tendency to trend strongly within extreme zones without immediate reversal
✅ Smart Signal Logic:
Buy/sell signals appear only when %K crosses %D inside the oversold (≤15) or overbought (≥85) zones, and only the first signal is shown to avoid whipsaws.
Visual Enhancements:
- Thick lines when %K/%D are in overbought/oversold zones
- Green/red background highlights on valid signals
- Optional up/down arrows for clear entry visualization
- Customizable colors, line widths, and transparency
🔒 No alerts included – clean, focused on price action and momentum.
💡 Pro Tip: For even higher accuracy, use this indicator in combination with a long-term trend filter (e.g., EMA 200). The oscillator excels in ranging or retracement phases but should not be used alone in strong parabolic moves.
Based on Mozilla Public License v2.0 – feel free to use, modify, and share. Perfect for swing traders and long-term Bitcoin analysts seeking high-probability reversal zones.
перевод на русский
Улучшенный Stochastic для Bitcoin (BTC) — оптимизирован для дневного таймфрейма
Этот улучшенный осциллятор Stochastic специально настроен под BTC/USD на дневном графике, с учётом исторических данных Bitstamp (2011–2025), чтобы минимизировать ложные сигналы и повысить надёжность в условиях высокой волатильности биткоина.
В отличие от классического Stochastic (14, 3, 3), эта версия использует оптимизированные параметры:
- Период K = 21 — более плавная реакция, лучше соответствует макроциклам BTC
- Период D = 3, Сглаживание K = 3 — снижает шум, сохраняя отзывчивость
- Уровень перекупленности = 85, перепроданности = 15 — учитывает склонность BTC к сильным трендам в экстремальных зонах без немедленного разворота
✅ Интеллектуальная логика сигналов:
Покупка/продажа отображается только при пересечении %K и %D внутри зоны перепроданности (≤15) или перекупленности (≥85), и только первый сигнал фиксируется, чтобы избежать «хлыстов».
Улучшенная визуализация:
- Жирные линии, когда %K/%D находятся в экстремальных зонах
- Зелёный/красный фон при появлении сигналов
- Опциональные стрелки для чёткого отображения точек входа
- Настройка цветов, толщины линий и прозрачности
🔒 Без алертов — чистый инструмент, сфокусированный на цене и импульсе.
💡 Совет профессионала: для ещё большей точности используйте этот индикатор вместе с трендовым фильтром (например, EMA 200). Осциллятор лучше всего работает в фазах консолидации или отката, но не стоит применять его в одиночку во время сильных параболических движений.
На основе Mozilla Public License v2.0 — свободно используйте, модифицируйте и делитесь. Идеален для свинг-трейдеров и аналитиков Bitcoin, ищущих зоны с высокой вероятностью разворота.

EMA Trend Pro [Hedging & Fixed Risk]
This strategy is a comprehensive trend-following system designed to capture significant market movements while strictly managing risk. It combines multiple Exponential Moving Averages (EMAs) for trend identification, ADX for trend strength filtering, and Volume confirmation to reduce false signals.
Key Features:
Hedging Mode Compatible: The script is designed to handle Long and Short positions independently. This is ideal for markets where trends can reverse quickly or for traders who prefer hedging logic (requires hedging=true in strategy settings).
Professional Risk Management: Unlike standard strategies that use fixed contract sizes, this script calculates Position Size based on Risk. You can define a fixed risk per trade (e.g., 1% of equity or $100 fixed risk). The script automatically adjusts the lot size based on the Stop Loss distance (ATR).
Multi-Stage Take Profit: The strategy scales out positions at 3 different levels (TP1, TP2, TP3) to lock in profits while letting the remaining position ride the trend.
Strategy Logic:
Trend Identification:
Long Entry: EMA 7 > EMA 14 > EMA 21 > EMA 144 (Bullish Alignment).
Short Entry: EMA 7 < EMA 14 < EMA 21 < EMA 144 (Bearish Alignment).
Filters:
ADX Filter: Entries are only taken if ADX (14) > Threshold (default 20) to ensure the market is trending, avoiding chopping ranging markets.
Volume Filter: Current volume must exceed the 20-period SMA volume by 10% to confirm momentum.
Exits & Trade Management:
Stop Loss: Dynamic SL based on ATR (e.g., 1.8x ATR).
Breakeven: Once TP1 is hit, the Stop Loss is automatically moved to Breakeven to protect capital.
Take Profits:
TP1: 1x Risk Distance (30% pos)
TP2: 2x Risk Distance (50% pos)
TP3: 3x Risk Distance (Remaining pos)
Settings Guide:
Risk Type: Choose between "Percent" (of equity) or "Fixed Amount" (USD).
Risk Value: Input your desired risk (e.g., 1.0 for 1% risk).
Fee %: Set your exchange's Taker fee (e.g., 0.05 or 0.06) for accurate backtesting.
ADX Threshold: Adjust to filter out noise (Higher = Stricter trend requirement).
Disclaimer: This script is for educational and backtesting purposes only. Past performance does not guarantee future results. Please use proper risk management.

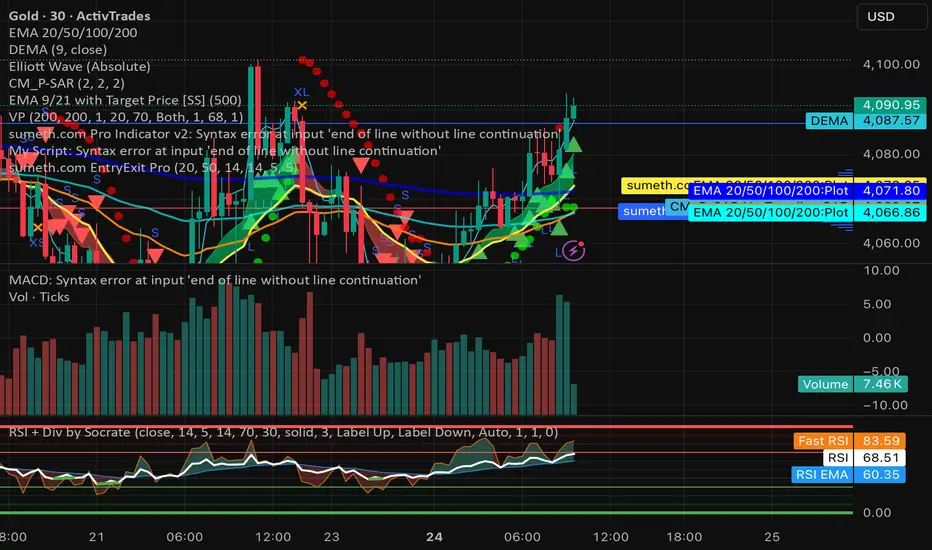
sumeth.com EntryExit ProA professional multi-filter trading tool combining price action, pattern detection, dynamic trend filters, RSI/MACD confirmations, and breakout logic. Designed for precise entry & exit in any market.
deKoder | HTF3 - Multi-Timeframe Candle DisplaydeKoder | HTF3 - Multi-Timeframe Candle Display
Overview
HTF3 is a powerful multi-timeframe analysis tool that displays higher timeframe candles directly on your current lower timeframe chart. When trading lower timeframes it is sometimes easy to lose sight of the higher timeframe context. HTF3 enables better trading decisions by keeping your analysis aligned with the dominant trend.
Key Features
• Multi-Timeframe Support : Display daily, weekly, or any custom higher timeframe candles
• Visual Candle Representation : Clear OHLC candles with customizable colors
• Range Display : Show previous candle ranges with dotted center lines
• Trading Signals : Automatic breakout and rejection signals with arrow markers
• Flexible Positioning : Adjustable horizontal offset for optimal placement
• Real-time Updates : Current higher timeframe candle builds in real-time
Use Cases
• Swing Traders : Maintain daily/weekly context on intraday charts
• Position Traders : Align entries with higher timeframe structure
• Breakout Traders : Identify key levels from previous candle ranges
• Market Analysis : Quickly assess multi-timeframe alignment
Configuration
• Timeframe : Select higher timeframe to display (default: D)
• X-Offset : Adjust horizontal positioning (-4 to 50)
• Show Candles : Toggle candle display
• Show Range : Toggle previous candle high/low ranges
• Signals : Display breakout/rejection signals
• Customize bull/bear colors and text appearance
How to Use
1. Select your desired higher timeframe in the settings
2. Adjust offset for optimal positioning
3. Use the range lines to identify potential liquidity zones
4. Watch for signal arrows indicating breakouts/rejections
5. Combine with your existing strategy for confirmation
Pro Tips
• Use daily candles on 1H/4H charts for swing trading context
• The signals are not intended as standalone buy/sell triggers. They should only be used as confluence for your main trade idea

Universal Scalper Indicator [Crypto/Forex/Gold]Universal Scalper Pro is an all-in-one scalping system designed for the 15-Minute Timeframe. It automates the analysis of trend, volatility, and risk management into a single, high-contrast dashboard.
Unlike standard crossover indicators, this system filters out low-volatility "noise" using a built-in ADX engine and automatically calculates dynamic Stop Loss and Take Profit levels based on market volatility (ATR).
It is engineered to work universally on:
Crypto (BTC, ETH, SOL, Altcoins)
Commodities (Gold, Silver, Oil)
Forex (Major & Minor Pairs)
Stocks (High volume tech stocks like NVDA, TSLA)
📈 How It Works (The Strategy)
1. The Trend Engine (9/21 EMA) The core logic utilizes a Fast (9) and Slow (21) Exponential Moving Average crossover.
Bullish Signal: The 9 EMA crosses above the 21 EMA.
Bearish Signal: The 9 EMA crosses below the 21 EMA. This specific combination is chosen for its responsiveness to 15-minute intraday trends.
2. The Noise Filter (ADX > 15) To prevent "whipsaws" (fake signals during sideways markets), the script includes a Volatility Filter based on the Average Directional Index (ADX).
Signals are rejected if the ADX is below 15.
This ensures you only receive alerts when there is sufficient momentum to sustain a move.
3. Dynamic Risk Management (ATR) The script uses the Average True Range (ATR) to calculate Stop Loss and Take Profit levels that adapt to the specific asset's volatility.
Stop Loss: Placed at 1.5x ATR from the entry. (Tight enough to preserve capital, wide enough to survive standard market noise).
Take Profit: Placed at 2.0x ATR from the entry. (Provides a healthy 1:1.3 Risk/Reward ratio).
🚀 Key Features
Universal Dashboard: A bottom-right panel displays the live Trend Status, Entry Price, Stop Loss, and Take Profit. It automatically formats decimals for any asset (e.g., 2 decimals for Gold, 5 for Forex, 8 for Crypto).
"Sticky" Memory: The dashboard retains the prices of the last valid signal, allowing you to manage your trade even after the signal candle closes.
Trend Cloud: A visual Green/Red zone between the EMAs helps you instantly identify the market bias.
Unified Alerts: A single alert setup ("Any alert() function call") sends the Asset Name, Entry, SL, and TP directly to your phone.
🛠️ How to Use
Timeframe: Set your chart to 15 Minutes (15m).
Wait for the Signal: Look for the "BUY" (Green) or "SELL" (Red) label on the chart.
Check the Dashboard: Ensure the "STATUS" is BULLISH (for buys) or BEARISH (for sells). If the status says "WAIT", do not trade.
Execute: Enter the trade using the exact Stop Loss and Take Profit levels shown on the dashboard.
⚠️ Risk Disclaimer
Trading financial markets involves high risk and may not be suitable for all investors. This indicator is a technical analysis tool and does not constitute financial advice. Past performance is not indicative of future results. Always practice with a demo account before trading real capital.

🔥 SMC Reversal Engine v3.5 – Clean FVG + DashboardSMC Reversal Engine v3.5 – Clean FVG + Dashboard
The SMC Reversal Engine is a precision-built Smart Money Concepts tool designed to help traders understand market structure the single most important foundation in reading price action. It reveals how institutions move liquidity, where structure shifts occur, and how Fair Value Gaps (FVGs) align with these changes to signal potential reversals or continuations.
Understanding How It Works
At its core, the script detects CHoCH (Change of Character) and BOS (Break of Structure)—the two key turning points in institutional order flow. A CHoCH shows that the market has reversed intent (for example, from bearish to bullish), while a BOS confirms a continuation of the current trend. Together, they form the backbone of structure-based trading.
To refine this logic, the engine uses fractal pivots clusters of candles that confirm swing highs and lows. Fractals filter out noise, identifying points where price truly changes direction. The script lets you set this sensitivity manually or automatically adapts it depending on the timeframe. Lower fractal sensitivity captures smaller intraday swings for scalpers, while higher sensitivity locks onto major swing structures for swing and position traders.
The dashboard gives you a real-time reading of the trend, the last high and low, and what the market is likely to do next—for example, “Expect HL” or “Wait for LH.” It even tracks the accuracy of these structure predictions over time, giving an educational feedback loop to help you learn price behavior.
Fair Value Gaps and Tap Entries
Fair Value Gaps (FVGs) mark moments when price moves too quickly, leaving inefficiencies that institutions often revisit. When price taps into an FVG, it often acts as a high-probability entry zone for reversals or continuations. The script automatically detects, extends, and deletes old FVGs, keeping only relevant zones visible for a clean chart.
Traders can enable markTapEntry to visually confirm when an FVG gets filled. This is a simple but powerful trigger that often aligns with CHoCH or BOS moments.
Recommended Settings for Different Traders
For Scalpers, use a lower HTF structure such as 1 minute or 5 minutes. Keep Auto Fractals on for faster reaction, and limit FVG zones to 2–3. This gives you a clean, real-time reflection of order flow.
For Intraday Traders, 15-minute to 1-hour structure gives the perfect balance between reactivity and stability. Fractal sensitivity around 3–5 captures the most actionable levels without excessive noise.
For Swing Traders, use 4-hour, 1-day, or even 3-day structure. The chart becomes smoother, showing higher-order CHoCH and BOS that define true institutional transitions. Combine this with EMA confirmation for higher conviction.
For Position or Macro Traders, select Weekly or Monthly structure. The dynamic label system expands automatically to keep more historical BOS/CHoCH points visible, allowing you to see long-term shifts clearly.
Educational Value
This indicator is built to teach traders how to see structure the way professionals and smart money do. You’ll learn to recognize how markets transition from one phase to another from accumulation to manipulation to expansion. Each CHoCH or BOS helps you decode where liquidity is being taken and where new intent begins.
The included SMC Quick Guide explains each structural cue right on your chart. Within days of using it, you’ll start noticing patterns that reveal how price really moves, instead of guessing based on indicators.
Settings and How to Use Them
Everything in the SMC Reversal Engine is designed to adapt to your trading style and help you read structure like a professional.
When you open the Inputs Panel, you’ll see sections like Fractal Settings, FVG Settings, Buy/Sell Confirmation, and Educational Tools.
Under Fractal Settings, you can choose the higher timeframe (HTF) that defines structure—from minutes to weeks. The Auto Fractal Sensitivity option automatically adjusts how tight or wide swing points are detected. Lower sensitivity captures short-term fluctuations (great for scalpers), while higher values filter noise and isolate major swing highs and lows (perfect for swing traders).
The Fair Value Gap (FVG) options manage imbalance zones—the footprints of institutional orders. You can show or hide these zones, extend them into the future, and control how long they remain before auto-deletion. The Mark Entry When FVG is Tapped option places a small label when price revisits the gap—a potential entry signal that aligns with smart money logic.
EMA Confirmation adds a layer of confluence. The script can automatically scale EMA lengths based on timeframe, or you can input your preferred values (for example, 9/21 for intraday, 50/200 for swing). Require EMA Crossover Confirmation helps filter false moves, keeping you trading only with aligned momentum.
The Educational section gives traders visual reinforcement. When enabled, you’ll see tags like HH (Higher High), HL (Higher Low), LH (Lower High), and LL (Lower Low). These show structure shifts in real time, helping you learn visually what market structure really means. The Cheat Sheet panel summarizes each term, always visible in the corner for quick reference.
Early Top Warnings use wick size and RSI divergence to signal when price may be overextended—a useful heads-up before potential CHoCH formations.
Finally, the Narrative and Accuracy System translates structure into simple English—messages like Trend Bullish → Wait for HL or BOS Bearish → Expect LL. Over time, you can monitor how accurate these expectations have been, training your pattern recognition and confidence.
Pro Tips for Getting the Most Out of the SMC Reversal Engine
1. Start on Higher Timeframes First: Begin on the 4H or Daily chart where structure is cleaner and signals have more weight. Then scale down for entries once you grasp directional intent.
2. Use FVGs for Context, Not Just Entries: Observe how price behaves around unfilled FVGs—they often act as magnets or barriers, offering insight into where liquidity lies.
3. Combine With HTF Bias: Always trade in the direction of your higher timeframe trend. A bullish weekly BOS means lower timeframes should ideally align bullishly for optimal setups.
4. Clean Charts = Clear Mind: Use Minimal Mode when focusing on price action, then toggle the educational tools back on to review structure for learning.
5. Don’t Chase Every CHoCH or BOS: Focus on significant breaks that align with broader context and liquidity sweeps, not minor fluctuations.
6. Accuracy Rate Is a Feedback Tool: Use the accuracy stat as a reflection of consistency—not a trade trigger.
7. Build Narrative Awareness: Read the on-chart narrative messages to reinforce structured thinking and stay disciplined.
8. Practice Replay Mode: Step through past structures to visually connect CHoCH, BOS, and FVG behavior. It’s one of the best ways to train pattern recognition.
Summary
* Detects CHoCH and BOS automatically with fractal precision
* Identifies and manages Fair Value Gaps (FVGs) in real time
* Displays a smart dashboard with accuracy tracking
* Adapts label visibility dynamically by timeframe
* Perfect for both learning and trading with institutional clarity
This tool isn’t about predicting the market—it’s about understanding it. Once you can read structure, everything else in trading becomes secondary.

Super momentum DBSISuper momentum DBSI: The Ultimate Guide
1. What is this Indicator?
The Super momentum DBSI is a "Consensus Engine." Instead of relying on a single line (like an RSI) to tell you where the market is going, this tool calculates 33 distinct technical indicators simultaneously for every single candle.
It treats the market like a democracy. It asks 33 mathematical "voters" (Momentum, Trend, Volume, Volatility) if they are Bullish or Bearish.
If 30 out of 33 say "Buy," the score is high (Yellow), and the trend is extremely strong.
If only 15 say "Buy," the score is low (Teal), and the trend is weak or choppy.
2. Visual Guide: How to Read the Numbers
The Scores
Top Number (Bears): Represents Selling Pressure.
Bottom Number (Bulls): Represents Buying Pressure.
The Colors (The Traffic Lights)
The colors are your primary signal. They tell you who is currently winning the war.
🟡 YELLOW (Dominance):
This indicates the Winning Side.
If the Bottom Number is Yellow, Bulls are in control.
If the Top Number is Yellow, Bears are in control.
🔴 RED (Weakness):
This appears on the Top. It means Bears are present but losing.
🔵 TEAL (Weakness):
This appears on the Bottom. It means Bulls are present but losing.
3. Trading Strategy
Scenario A: The "Strong Buy" (Long Entry)
The Setup: You are looking for a shift in momentum where Buyers overwhelm Sellers.
Watch the Bottom Number: Wait for it to turn Yellow.
Confirm Strength: Ensure the score is above 15 and rising (e.g., 12 → 18 → 22).
Check the Top: The Top Number should be Red and low (below 10).
Trigger: Enter on the candle close.
Scenario B: The "Strong Sell" (Short Entry)
The Setup: You are looking for Sellers to crush the Buyers.
Watch the Top Number: Wait for it to turn Yellow.
Confirm Strength: Ensure the score is above 15 and rising.
Check the Bottom: The Bottom Number should be Teal and low.
Trigger: Enter on the candle close.
Scenario C: The "No Trade Zone" (Choppy Market)
The Setup: The market is confused.
Visual: Top is Red, Bottom is Teal.
Meaning: NOBODY IS WINNING. There is no Yellow number.
Action: Do not trade. This usually happens during lunch hours, weekends, or right before big news. This filter alone will save you from many false breakouts.
4. What is Inside? (The 33 Indicators)
To give you confidence in the signals, here is exactly what the script is checking:
Group 1: Momentum (Oscillators)
Detects if price is moving fast.
RSI (Relative Strength Index)
CCI (Commodity Channel Index)
Stochastic
Williams %R
Momentum
Rate of Change (ROC)
Ultimate Oscillator
Awesome Oscillator
True Strength Index (TSI)
Stoch RSI
TRIX
Chande Momentum Oscillator
Group 2: Trend Direction
Detects the general path of the market.
13. MACD
14. Parabolic SAR
15. SuperTrend
16. ALMA (Moving Average)
17. Aroon
18. ADX (Directional Movement)
19. Coppock Curve
20. Ichimoku Conversion Line
21. Hull Moving Average
Group 3: Price Action
Detects where price is relative to averages.
22. Price vs EMA 20
23. Price vs EMA 50
24. Price vs EMA 200
Group 4: Volume & Force
Detects if there is money behind the move.
25. Money Flow Index (MFI)
26. On Balance Volume (OBV)
27. Chaikin Money Flow (CMF)
28. VWAP (Intraday)
29. Elder Force Index
30. Ease of Movement
Group 5: Volatility
Detects if price is pushing the outer limits.
31. Bollinger Bands
32. Keltner Channels
33. Donchian Channels
5. Pro Tips for Success
Don't Catch Knives: If the Bear score (Top) is Yellow and 25+, do not try to buy the dip. Wait for the Yellow score to break.
Exit Early: If you are Long and the Yellow Bull score drops from 28 to 15 in one candle, TAKE PROFIT. The momentum has died.
Use Higher Timeframes: This indicator works best on 15m, 1H, and 4H charts. On the 1m chart, it may be too volatile.

Coinbase Premium Index (Custom Tickers)📊 Coinbase Premium Index (Auto Symbol Support)
1. Overview
The Coinbase Premium Index is a widely used indicator to gauge the sentiment difference between US institutional investors (Coinbase Pro) and global retail/futures traders (Binance).
This script calculates the percentage difference between the Coinbase (USD pair) price and the Binance (USDT pair) price.
2. Key Features
🔄 Auto Symbol Matching (New): You no longer need to manually change tickers when switching charts.
If you are looking at a SOL/USDT chart, the indicator automatically detects "SOL" and compares COINBASE:SOLUSD vs BINANCE:SOLUSDT.
🛠 Manual Mode: Includes a manual override option if you wish to compare specific fixed tickers (e.g., strictly BTC).
🎨 Dynamic Visuals:
Histogram: Color-coded bars (Green/Red) indicate positive or negative premiums.
Smart Label: Displays the real-time premium value on the chart. The label color adapts to the trend, and hovering over it shows a Tooltip confirming exactly which tickers are being compared.
3. How to Interpret
The premium indicates the flow of funds and buying pressure:
🟢 Positive Premium (Green Bar):
Coinbase Price > Binance Price
Interpretation: Strong buying pressure from US institutions or spot whales. Often considered a Bullish signal.
🔴 Negative Premium (Red Bar):
Coinbase Price < Binance Price
Interpretation: Strong selling from US investors, or overheated buying in the offshore futures market (Binance). Often considered a Bearish or mean-reversion signal.
4. Settings Guide
Ticker Mode:
Auto (Current Chart): Automatically sets the comparison based on your current chart's base currency (Recommended).
Manual (Custom): Uses the specific tickers defined in the manual input fields below.
Manual Inputs: Enter tickers here if using Manual Mode (Default: COINBASE:BTCUSD vs BINANCE:BTCUSDT).
Bar & Label Settings: Customize colors, transparency, and the vertical position (Y-Offset) of the data label to fit your chart layout.

Stochastic Pro+ Suite📚 What Is the Stochastic Oscillator?
The stochastic oscillator is a momentum indicator comparing a security's closing price to its price range over a set number of periods. The %K line represents the raw stochastic value, while the %D line is a smoothed moving average of %K.
Stochastic helps identify:
Overbought and oversold conditions
Bullish and bearish crossovers
Momentum shifts before price reversals
It is widely used in both trending and ranging markets.
💡 What Makes This Suite Different?
This script supercharges the traditional stochastic with a multi-timeframe engine , divergence detection , and a highly customizable visual suite , including:
✅ Core Features:
- Multi-Timeframe (%K, %D, Spread): Pulls stochastic data from any higher timeframe for improved signal quality.
- Custom Overbought/Oversold Levels: Fully adjustable OB/OS thresholds (default: 80/20).
- %K-%D Spread Histogram: View the difference between %K and %D visually as a histogram.
- Color-coded Cross Highlights: Optional background shading for key crossover events in OB/OS zones (high probability reversal areas).
🔍 Divergence Detection (Optional):
- Bullish Divergence: Price makes lower lows while %K makes higher lows.
- Bearish Divergence: Price makes higher highs while %K makes lower highs.
- Customizable pivot lookbacks and range filters to control divergence strictness.
- Visual divergence labels plotted directly on the oscillator.
🎛️ Fully Toggleable Visuals:
Show/hide %K, %D, OB/OS lines, spread histogram, background highlight, and divergence — all via simple checkboxes.
🔔 Alerts:
Set alerts for both bullish and bearish divergences — ideal for swing, day, or trend reversal strategies.
⚙️ Use Cases
- Spot exhaustion in overbought/oversold zones
- Confirm or filter entries with divergence signals
- Monitor multiple timeframes without switching charts
- Use as a signal tool in confluence with price action or volume indicators
⚠️ Disclaimer
This tool is for educational and informational purposes only. It does not constitute financial advice, trading advice, or investment guidance. Always do your own research and consult a qualified financial advisor before making trading decisions.

Flout Ranges + STDVs [bilal]# Flout Ranges + STDVs
## What It Does
Automatically draws FLOUT, CBDR, and ASIA session ranges with standard deviation levels and highlight zones. Perfect for ICT-style trading and session-based strategies.
## Main Features
**📊 Session Ranges**
- FLOUT, CBDR, and ASIA ranges drawn automatically
- Works for both Indices and Forex (just toggle Forex Mode)
- Customizable colors and labels for each range
**📈 Standard Deviation Levels**
- Shows key STDV levels from your ranges
- FLOUT: -6 to +6 from midpoint
- CBDR/ASIA: 0 to 7 from range low
- Helps identify expansion targets and reversal zones
**🎯 Highlight Zones**
- Zone 1 (default 3.5-4.0 STDV): Common reversal area
- Zone 2 (default 5.5-6.0 STDV): Extended targets
- Shaded boxes make them easy to spot
- Automatically extends forward into London session
**📐 Smart Trendlines**
- Connects the open prices at key times
- Switches to X-pattern on trending FLOUT days
- Helps identify directional bias
## Quick Setup
1. Add indicator to your 1-5 minute chart
2. Toggle **Forex Mode** if trading forex (otherwise leave off for indices)
3. Turn on STDV lines for the ranges you want to see
4. Adjust highlight zones if needed (defaults work great)
## Why Use This?
- **Save Time**: No more manual drawing of ranges and levels
- **Stay Consistent**: Same levels calculated every session
- **Better Entries**: Use STDV zones for high-probability setups
- **Cleaner Charts**: Toggle what you need, hide what you don't
## Pro Tips
💡 Watch for reactions at 3.5-4.0 STDV zones - these are prime reversal areas
💡 Combine multiple ranges for allignements setups
---
*All times in New York timezone. Best used on 1-5 minute charts.*

Cumulative Volume Delta (HA Option)# **📘 Ultimate Guide to Trading With CVD Heikin Ashi (CVD+)**
## **🔍 What This Indicator Shows**
This tool plots **Cumulative Volume Delta (CVD)** as candlesticks—optionally transformed into **Heikin Ashi CVD candles**.
Instead of price, each candle represents the *battle between buyers and sellers* within your chosen timeframe.
**Volume Delta = Buying Volume – Selling Volume**
CVD takes all deltas and stacks them cumulatively, showing who is controlling the auction *over time*.
With Heikin Ashi smoothing layered on top, trend detection becomes cleaner, letting you see the “true pressure” behind price moves.
---
# **💡 Why CVD Is a Game Changer**
Most traders only see price.
Serious traders watch **pressure**.
CVD exposes what price hides:
* Absorption
* Hidden accumulation
* Seller exhaustion
* Fake breakouts
* True reversals
* Momentum strength / weakness
* Smart money footprint
When combined with Heikin-Ashi smoothing, you get delta trends with way less noise and fewer fake flips.
---
# **📈 How to Actually Use It (The Edge)**
## **1. Spot True Trend vs. Fake Trend**
If **price goes up** but **CVD goes down**, that’s:
* Passive sellers absorbing
* A weak rally
* High probability of reversal
If **price pulls back** but **CVD keeps rising**, that’s:
* Secret accumulation
* A continuation setup
* Great dip-buy opportunity
**Rule of thumb:**
🔹 *Follow the CVD trend, not the price noise.*
---
## **2. Catch Reversals Early**
Watch for:
### **🔻 Bearish Reversal Signals**
* CVD makes a **lower high**
* Heikin Ashi CVD prints **red bodies with rising upper shadows**
* Price makes one final push up on low delta
This is classic distribution → the drop usually follows fast.
### **🔹 Bullish Reversal Signals**
* CVD forms a **higher low**
* HA CVD flips from red to green with full bodies
* Price still looks weak = bottom forming
This is exactly how pros catch bottoms early.
---
## **3. Identify Absorption Levels**
If price hits a level multiple times but CVD keeps climbing (or falling), that level is being defended.
Example:
* Price stalls at support
* CVD keeps rising
= **Buyers absorbing sells → high-probability bounce**
Opposite works for resistance.
---
## **4. Validate Breakouts**
A breakout with *weak or negative CVD* is usually a trap.
A breakout with **strong, rising HA CVD** is real.
If CVD diverges from the breakout direction → fade it.
If CVD confirms → ride it.
---
## **5. Use Heikin Ashi to Stay in Trends**
HA smoothing removes the nasty chop of raw delta data.
Look for:
* Consecutive **full-body teal candles = strong buying wave**
* Consecutive **full-body red candles = strong selling wave**
* Small-bodied candles after a trend = momentum dying
This keeps you in winners longer and cuts losers faster.
---
# **🎯 Practical Trading Playbook**
### **A) Long Setup**
1. Price pullback into support
2. CVD stays bullish or makes a higher low
3. HA CVD flips green or prints a strong body
4. Enter long
5. Stop under CVD structural low
### **B) Short Setup**
1. Price pushes into resistance
2. CVD forms bearish divergence
3. HA CVD prints red bodies
4. Enter short
5. Stop above CVD swing high
### **C) Chop Filter**
No clear HA CVD trend = avoid trading → stop donating money to the market.
---
# **🧠 Tips for Mastery**
* Use lower timeframe delta (1m–5m) for scalping entries
* Use a higher anchor timeframe (1D) to define direction
* When price trends but CVD is flat → expect a fakeout
* When CVD trends but price is flat → expect a breakout
* Trade WITH delta, fade AGAINST delta
---
# **⚠️ Important Notes**
* Crypto = full tick-by-tick volume → CVD is extremely accurate
* Stocks = depends on your broker/data vendor
* Futures = best signal-to-noise ratio
* If your symbol has no volume → indicator will warn you
---
# **📥 Recommended Settings**
* **Anchor timeframe**: 1D or 4H
* **Lower timeframe**: 1m, 3m, or 5m
* **Heikin Ashi**: ON for trend filtering, OFF for raw delta
---
# **🔥 Final Word**
Price can lie.
Delta usually doesn’t.
CVD + Heikin Ashi gives you the closest thing to reading the market’s heartbeat in real time.
Use it to confirm breakouts, detect reversals early, identify real trend strength, and avoid getting caught in manipulation.
If you learn to read CVD well…
you stop trading price, and start trading the **intent** behind the price.

VOSC+RSI Pro-Trend V22 (Bollinger Integration) [PersianDev]this is an extention of andicator volume osc and rsi

ITC Market Structure ProWith this tool you can see market structure, set session, daylow, dayhigh, multiple moving avg., fvg...
Every feature can by witched off or on to have more clarity watching price action - and everything is in one indicator, so you don't need to have stack off them!
Detailed description will try to provide later...
PS Thanks for LuxAlgo - I have use some of their fine work to combine all-in-one! Hoping it's not against the rules - if so, I will remove my tool.
PS Everything is rewritten to pine6
