AI-Powered ScalpMaster Pro [By TraderMan]🧠 AI-Powered ScalpMaster Pro How It Works
📊 What Is the Indicator and What Does It Do?
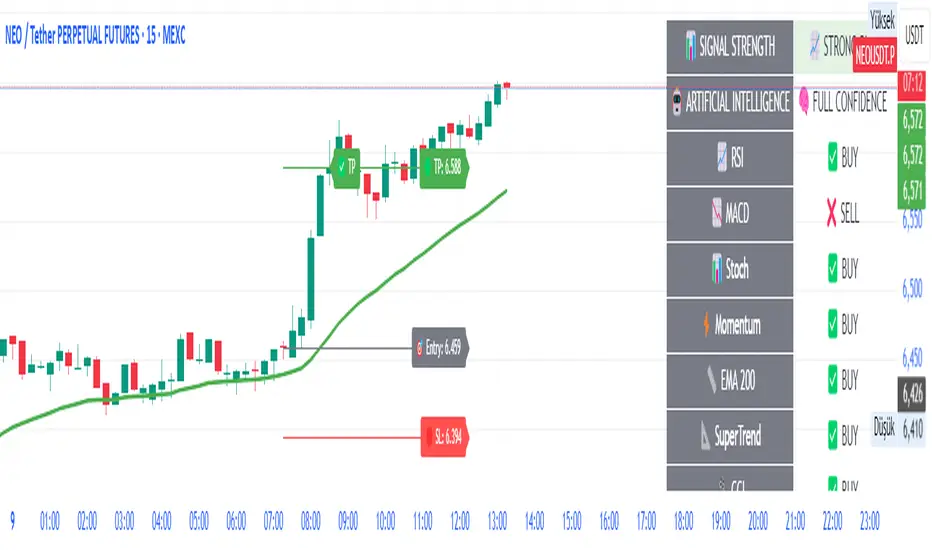
🧠 AI-Powered ScalpMaster Pro is a powerful technical analysis tool designed for scalping (short-term, fast-paced trading) in financial markets such as forex, crypto, or stocks. It combines multiple technical indicators (RSI, MACD, Stochastic, Momentum, EMA, SuperTrend, CCI, and OBV) to identify market trends and generate AI-driven buy (🟢) or sell (🔴) signals. The goal is to help traders seize profitable scalping opportunities with quick and precise decisions. 🚀
Key Features:
🧠 AI-Driven Logic: Analyzes signals from multiple indicators to produce reliable trend signals.
📈 Signal Strength: Displays buy (bull) and sell (bear) signal strength as percentages.
✅ Success Rate: Tracks the performance of the last 5 trades and calculates the success rate.
🎯 Entry, TP, and SL Levels: Automatically sets entry points, take profit (TP), and stop loss (SL) levels.
📏 EMA Zone: Analyzes price movement around the EMA 200 to confirm trend direction.
⚙️ How Does It Work?
The indicator uses a scoring system by combining the following technical indicators:
RSI (14): Evaluates whether the price is in overbought or oversold zones.
MACD (12, 26, 9): Analyzes trend direction and momentum.
Stochastic (%K): Measures the speed of price movement.
Momentum: Checks the price change over the last 10 bars.
EMA 200: Determines the long-term trend direction.
SuperTrend: Tracks trends based on volatility.
CCI (20): Measures price deviation from its normal range.
OBV ROC: Analyzes volume changes.
Each indicator generates a buy (bull) or sell (bear) signal. If 6 or more indicators align in the same direction (e.g., bullScore >= 6 for buy), the indicator produces a strong trend signal:
📈 Strong Buy Signal: bullScore >= 6 and bullScore > bearScore.
📉 Strong Sell Signal: bearScore >= 6 and bearScore > bullScore.
🔸 Neutral: No dominant direction.
Additionally, the EMA Zone feature confirms the trend based on the price’s position relative to a zone around the EMA 200:
Price above the zone and sufficiently distant → Uptrend (UP). 🟢
Price below the zone and sufficiently distant → Downtrend (DOWN). 🔴
Price within the zone → Neutral. 🔸
🖥️ Display on the Chart
Table: A table in the top-right corner shows the status of all indicators (✅ Buy / ❌ Sell), signal strength (as %), success rate, and results of the last 5 trades.
Lines and Labels:
🎯 Entry Level: A gray line at the price level when a new signal is generated.
🟢 TP (Take Profit): A green line showing the take-profit level.
🔴 SL (Stop Loss): A red line showing the stop-loss level.
EMA Zone: The EMA 200 and its surrounding colored zone visualize the trend direction (green: uptrend, red: downtrend, gray: neutral).
📝 How to Use It?
Platform Setup:
Add the indicator to the TradingView platform.
Customize settings as needed (e.g., EMA length, risk/reward ratio).
Monitoring Signals:
Check the table: Look for 📈 STRONG BUY or 📉 STRONG SELL signals to prepare for a trade.
AI Text: Trust signals more when it says "🧠 FULL CONFIDENCE" (success rate ≥ 50%). Be cautious if it says "⚠️ LOW CONFIDENCE."
Entering a Position:
🟢 Buy Signal:
Table shows "📈 STRONG BUY" and bullScore >= 6.
Price is above the EMA Zone (green zone).
Entry: Current price (🎯 entry line).
TP: 2% above the entry price (🟢 TP line).
SL: 1% below the entry price (🔴 SL line).
🔴 Sell Signal:
Table shows "📉 STRONG SELL" and bearScore >= 6.
Price is below the EMA Zone (red zone).
Entry: Current price (🎯 entry line).
TP: 2% below the entry price (🟢 TP line).
SL: 1% above the entry price (🔴 SL line).
Position Management:
If the price hits TP, the trade closes profitably (✅ Successful).
If the price hits SL, the trade closes with a loss (❌ Failed).
Results are updated in the "Last 5 Trades" section of the table.
Risk Management:
Default risk/reward ratio is 1:2 (1% risk, 2% reward).
Always adjust position size based on your capital.
Consider smaller lot sizes for "⚠️ LOW CONFIDENCE" signals.
💡 Tips
Timeframe: Use 1-minute, 5-minute, or 15-minute charts for scalping.
Market Selection: Works best in volatile markets (e.g., BTC/USD, EUR/USD).
Confirmation: Ensure the EMA Zone trend aligns with the signal.
Discipline: Stick to TP and SL levels, avoid emotional decisions.
⚠️ Warnings
No indicator is 100% accurate. Always use additional analysis (e.g., support/resistance).
Be cautious during high-volatility periods (e.g., news events).
The success rate is based on past performance and does not guarantee future results.
Search in scripts for "profitable"
Mutanabby_AI | Fresh Algo V24Mutanabby_AI | Fresh Algo V24: Advanced Multi-Mode Trading System
Overview
The Mutanabby_AI Fresh Algo V24 represents a sophisticated evolution of multi-component trading systems that adapts to various market conditions through advanced operational configurations and enhanced analytical capabilities. This comprehensive indicator provides traders with multiple signal generation approaches, specialized assistant functions, and dynamic risk management tools designed for professional market analysis across diverse trading environments.
Primary Signal Generation Framework
The Fresh Algo V24 operates through two fundamental signal generation approaches that accommodate different market perspectives and trading philosophies. The Trending Signals Mode serves as the primary trend-following mechanism, combining Wave Trend Oscillator analysis with Supertrend directional signals and Squeeze Momentum breakout detection. This mode incorporates ADX filtering that requires values exceeding 20 to ensure sufficient trend strength exists before signal activation, making it particularly effective during sustained directional market movements where momentum persistence creates profitable trading opportunities.
The Contrarian Signals Mode provides an alternative approach targeting reversal opportunities through extreme market condition identification. This mode activates when the Wave Trend Oscillator reaches critical threshold levels, specifically when readings surpass 65 indicating potential bearish reversal conditions or drop below 35 suggesting bullish reversal opportunities. This methodology proves valuable during overextended market phases where mean reversion becomes statistically probable.
Advanced Filtering Mechanisms
The system incorporates multiple sophisticated filtering mechanisms designed to enhance signal quality and reduce false positive occurrences. The High Volume Filter requires volume expansion confirmation before signal activation, utilizing exponential moving average calculations to ensure institutional participation accompanies price movements. This filter substantially improves signal reliability by eliminating low-conviction breakouts that lack adequate volume support from professional market participants.
The Strong Filter provides additional trend confirmation through 200-period exponential moving average analysis. Long position signals require price action above this benchmark level, while short position signals necessitate price action below it. This ensures strategic alignment with longer-term trend direction and reduces the probability of trading against major market movements that could invalidate shorter-term signals.
Cloud Filter Configuration System
The Fresh Algo V24 offers four distinct cloud filter configurations, each optimized for specific trading timeframes and market approaches. The Smooth Cloud Filter utilizes the mathematical relationship between 150-period and 250-period exponential moving averages, providing stable trend identification suitable for position trading strategies. This configuration generates signals exclusively when price action aligns with cloud direction, creating a more deliberate but highly reliable signal generation process.
The Swing Cloud Filter employs modified Supertrend calculations with parameters specifically optimized for swing trading timeframes. This filter achieves optimal balance between responsiveness and stability, adapting effectively to medium-term price movements while filtering excessive market noise that typically affects shorter-term analytical systems.
For active intraday traders, the Scalping Cloud Filter utilizes accelerated Supertrend calculations designed to capture rapid trend changes effectively. This configuration provides enhanced signal generation frequency suitable for compressed timeframe strategies. The advanced Scalping+ Cloud Filter incorporates Hull Moving Average confirmation, delivering maximum responsiveness for ultra-short-term trading while maintaining signal quality through additional momentum validation processes.
Specialized Assistant Functionality
The system includes two distinct assistant modes that provide supplementary market analysis capabilities. The Trend Assistant Mode activates advanced cloud analysis overlays that display dynamic support and resistance zones calculated through adaptive volatility algorithms. These levels automatically adjust to current market conditions, providing visual guidance for identifying trend continuation patterns and potential reversal areas with mathematical precision.
The Trend Tracker Mode concentrates on long-term trend identification by displaying major exponential moving averages with color-coded fill areas that clarify directional bias. This mode maintains visual simplicity while providing comprehensive trend context evaluation, enabling traders to quickly assess broader market direction and align shorter-term strategies accordingly.
Dynamic Risk Management System
The integrated risk management system automatically adapts across all operational modes, calculating stop loss and take profit targets using Average True Range multiples that adjust to current market volatility. This approach ensures consistent risk parameters regardless of selected operational mode while maintaining relevance to prevailing market conditions.
Stop loss placement occurs at dynamically calculated distances from entry points, while three progressive take profit targets establish at customizable ATR multiples respectively. The system automatically updates these levels upon trend direction changes, ensuring current market volatility influences all risk calculations and maintains appropriate risk-reward ratios throughout trade management.
Comprehensive Market Analysis Dashboard
The sophisticated dashboard provides real-time market analysis including volatility measurements, institutional activity assessment, and multi-timeframe trend evaluation across five-minute through four-hour periods. This comprehensive market context assists traders in selecting appropriate operational modes based on current market characteristics rather than relying exclusively on historical performance data.
The multi-timeframe analysis ensures mode selection considers broader market context beyond the primary trading timeframe, improving overall strategic alignment and reducing conflicts between different temporal market perspectives. The dashboard displays market state classification, volatility percentages, institutional activity levels, current trading session information, and trend pressure indicators with professional formatting and clear visual hierarchy.
Enhanced Trading Assistants
The Fresh Algo V24 includes specialized trading assistant features that complement the primary signal generation system. The Reversal Dot functionality identifies potential reversal points through Wave Trend Oscillator analysis, displaying visual indicators when crossover conditions occur at extreme levels. These reversal indicators provide early warning signals for potential trend changes before they appear in the primary signal system.
The Dynamic Take Profit Labels feature automatically identifies optimal profit-taking opportunities through RSI threshold analysis, marking potential exit points at multiple levels for long positions and corresponding levels for short positions. This automated profit management system helps traders optimize exit timing without requiring constant manual monitoring of technical indicators.
Advanced Alert System
The comprehensive alert system accommodates all operational modes while providing granular notification control for various signal types and risk management events. Traders can configure separate alerts for normal buy signals, strong buy signals, normal sell signals, strong sell signals, stop loss triggers, and individual take profit target achievements.
Cloud crossover alerts notify traders when trend direction changes occur, providing early indication of potential strategy adjustments. The alert system includes detailed trade setup information, timeframe data, and relevant entry and exit levels, ensuring traders receive complete context for informed decision-making without requiring constant chart monitoring.
Technical Foundation Architecture
The Fresh Algo V24 combines multiple proven technical analysis components including Wave Trend Oscillator for momentum assessment, Supertrend for directional bias determination, Squeeze Momentum for volatility analysis, and various exponential moving averages for trend confirmation. Each component contributes specific market insights while the unified system provides comprehensive market evaluation through their mathematical integration.
The multi-component approach reduces dependency on individual indicator limitations while leveraging the analytical strengths of each technical tool. This creates a robust analytical framework capable of adapting to diverse market conditions through appropriate mode selection and parameter optimization, ensuring consistent performance across varying market environments.
Market State Classification
The indicator incorporates advanced market state classification through ADX analysis, distinguishing between trending, ranging, and transitional market conditions. This classification system automatically adjusts signal sensitivity and filtering parameters based on current market characteristics, optimizing performance for prevailing conditions rather than applying static analytical approaches.
The volatility measurement system calculates current market activity levels as percentages, providing quantitative assessment of market energy and helping traders select appropriate operational modes. Institutional activity detection through volume analysis ensures signal generation aligns with professional market participation patterns.
Implementation Strategy Considerations
Successful implementation requires careful matching of operational modes to prevailing market conditions and individual trading objectives. Trending modes demonstrate optimal performance during directional markets with sustained momentum characteristics, while contrarian modes excel during range-bound or overextended market conditions where reversal probability increases.
The cloud filter configurations provide varying degrees of confirmation strength, with smoother settings reducing false signal occurrence at the expense of some responsiveness to price changes. Traders must balance signal quality against signal frequency based on their risk tolerance and available trading time, utilizing the comprehensive customization options to optimize performance for their specific requirements.
Multi-Timeframe Integration
The system provides seamless multi-timeframe analysis through the integrated dashboard, displaying trend alignment across multiple time horizons from five-minute through four-hour periods. This analysis helps traders understand broader market context and avoid conflicts between different temporal perspectives that could compromise trade outcomes.
Session analysis identifies current trading session characteristics, providing context for expected market behavior patterns and helping traders adjust their approach based on typical session volatility and participation levels. This geographic market awareness enhances strategic decision-making and improves timing for trade execution.
Advanced Visualization Features
The indicator includes sophisticated visualization capabilities through gradient candle coloring based on MACD analysis, providing immediate visual feedback on momentum strength and direction. This enhancement allows rapid market assessment without requiring detailed indicator analysis, improving efficiency for traders managing multiple instruments simultaneously.
The cloud visualization system uses color-coded fill areas to clearly indicate trend direction and strength, with automatic adaptation to selected operational modes. This visual clarity reduces analytical complexity while maintaining comprehensive market information display through professional chart presentation.
Performance Optimization Framework
The Fresh Algo V24 incorporates performance optimization features including signal strength classification, automatic parameter adjustment based on market conditions, and dynamic filtering that adapts to current volatility levels. These optimizations ensure consistent performance across varying market environments while maintaining signal quality standards.
The system automatically adjusts sensitivity levels based on selected operational modes, ensuring appropriate responsiveness for different trading approaches. This adaptive framework reduces the need for manual parameter adjustments while maintaining optimal performance characteristics for each operational configuration.
Conclusion
The Mutanabby_AI Fresh Algo V24 represents a comprehensive solution for professional trading analysis, combining multiple analytical approaches with advanced visualization and risk management capabilities. The system's strength lies in its adaptive multi-mode design and sophisticated filtering mechanisms, providing traders with versatile tools for various market conditions and trading styles.
Success with this system requires understanding the relationship between different operational modes and their optimal application scenarios. The comprehensive dashboard and alert system provide essential market context and trade management support, enabling systematic approach to market analysis while maintaining flexibility for individual trading preferences.
The indicator's sophisticated architecture and extensive customization options make it suitable for traders at all experience levels, from those seeking systematic signal generation to advanced practitioners requiring comprehensive market analysis tools. The multi-timeframe integration and adaptive filtering ensure consistent performance across diverse market conditions while providing clear guidelines for strategic implementation.

Fundur - Market Sentiment A Fundur - Market Sentiment A: Complete Trading Indicator Guide
Indicator Overview
The Fundur - Market Sentiment A is a revolutionary multi-timeframe sentiment analysis indicator that combines advanced ZigZag pivot detection, wave-based structure analysis, and comprehensive market sentiment evaluation into one powerful trading tool. This indicator is designed to identify high-probability reversal points and trend continuations by analyzing market sentiment across 11 different timeframes simultaneously.
What Makes Market Sentiment A Unique?
Market Sentiment A is a sophisticated ZigZag system that utilizes the Market Sentiment B oscillator to perform advanced on-chart analysis against price action. By introducing Histogram-Correlated ZigZag Analysis - a breakthrough methodology that correlates sentiment histogram waves with actual price pivots to identify validated market extremes. Unlike static pivot indicators, Market Sentiment A provides dynamic analysis that adapts to changing market conditions while maintaining precise accuracy in pivot identification.
Core Methodology
The indicator operates on the principle that market sentiment oscillates in measurable waves that precede price movements. By analyzing sentiment patterns across multiple timeframes and correlating them with histogram wave behavior, traders can identify precise entry and exit points with quantifiable strength ratings and comprehensive wave event analysis.
Key Features
🎯 Revolutionary ZigZag System
Histogram-Correlated Detection : Unique correlation between sentiment waves and price pivots
Dynamic Speed Control : High, Medium, Low sensitivity settings for different market conditions
Validated Extremes : Only confirmed pivots are marked with comprehensive validation system
Real-Time Correlation : Live correlation between histogram turns and price extremes
📊 Multi-Timeframe Sentiment Engine
11 Timeframe Analysis : Simultaneous analysis across periods from 8 to 987 bars
Advanced Sentiment Calculation : Proprietary algorithm combining multiple sentiment factors
Momentum Wave Integration : 34-period momentum waves for trend context
Dynamic Smoothing : Optional smoothing for cleaner signals
🧠 Intelligent Wave Event Tracking
Green Wave Events : Bullish histogram wave analysis with comprehensive event detection
Red Wave Events : Bearish histogram wave analysis with detailed event tracking
Event Deduplication : Advanced system prevents duplicate event detection
10+ Event Types : MPIV, HTURN, TRI, SW, VOL, MDIV, HDIV, PDIV and more
⚖️ Advanced Strength Rating System
0-100 Strength Score : Comprehensive strength calculation for every pivot
Multi-Factor Analysis : Based on wave events, trend context, structure, and sentiment
Real-Time Calculation : Dynamic strength scoring as conditions change
Strength Breakdown : Detailed tooltip showing strength components
🎨 Sophisticated Visual System
Validated Pivot Labels : Clear ✓ markers for confirmed extremes
Structure Analysis : HH/HL/LH/LL structure identification with trend context
Dynamic ZigZag Lines : Connecting validated extremes with trend-based coloring
Bar Coloring Options : Momentum swings and market sentiment bar coloring
Comprehensive Tooltips : Detailed information on hover for every pivot
Setup Guide
Step 1: Adding the Indicator
Open TradingView and navigate to your desired chart
Click the "Indicators" button or press "/" key
Search for "Fundur - Market Sentiment A"
Add the indicator to your chart
Step 2: Core System Configuration
ZigZag System Settings
✅ Enable ZigZag System: ON (Core functionality)
ZigZag Speed : Choose based on your trading style:
High Speed : Most sensitive, fastest detection (2-bar lookback) - Best for scalping
Medium Speed : Balanced approach (3-bar lookback) - Recommended for most traders
Low Speed : Most reliable, slower detection (4-bar lookback) - Best for swing trading
✅ Show ZigZag Lines: ON (Visual connection of validated pivots)
Bar Coloring Settings
⚠️ Momentum Swings: OFF (Avoid visual clutter initially)
✅ Market Sentiment: ON (Primary sentiment-based bar coloring)
Step 3: Label Display Configuration
Essential Labels (Recommended Settings)
✅ Show Validated Pivots (✓): ON (Core validated extremes)
⚠️ Show Potential Turns (●): OFF (Reduces noise - enable once familiar)
⚠️ Show Structure Labels: OFF (Start clean, enable for advanced analysis)
⚠️ Include Trend in Structure Labels: OFF (Advanced feature)
✅ Show Strength Rating (💪): ON (Critical for trade quality assessment)
⚠️ Show Market Sentiment Wave Events: OFF (Advanced feature for later)
Label Visual Customization
Label Coloring : Standard (Highs=Red, Lows=Green)
Label Size : Normal
Label Transparency : 0%
Text Transparency : 0%
Step 4: Alert System Setup
✅ Enable Alerts: ON
⚠️ Alert Potential Bullish Turns: OFF (Disabled by design to prevent noise)
⚠️ Alert Potential Bearish Turns: OFF (Disabled by design to prevent noise)
✅ Alert ONLY on Confirmed Extremes: ON (High-quality signals only)
✅ Include Wave Events in Confirmed Alerts: ON (Comprehensive context)
Basic Trading Guide
Understanding the Dynamic ZigZag System
Market Sentiment A is fundamentally a Dynamic ZigZag System that displays validated highs and lows on your price chart. The indicator uses Market Sentiment B wave calculations internally to determine when sentiment waves finish, but these histograms and oscillators are NOT displayed on your chart .
What You See on Your Chart:
✓ Validated Highs : Red checkmarks marking confirmed resistance levels
✓ Validated Lows : Green checkmarks marking confirmed support levels
ZigZag Lines : Connecting validated extremes to show market structure
💪 Strength Ratings : 0-100 scores indicating signal quality
Structure Labels : HH/HL/LH/LL showing trend context
How Validation Works (Behind the Scenes):
High Validation : Uses Market Sentiment B wave analysis to confirm when a price high represents a true resistance level
Low Validation : Uses Market Sentiment B wave analysis to confirm when a price low represents a true support level
Dynamic Detection : Continuously monitors sentiment waves to validate extremes in real-time
Quality Filtering : Only displays the most significant highs and lows based on wave completion
Key Trading Concept:
Focus entirely on the validated highs and lows displayed on your chart. These represent dynamic support and resistance levels that have been confirmed by underlying sentiment analysis. The histogram and oscillator calculations happen internally - your trading decisions should be based on price action around these validated levels.
Entry Strategies
Primary Strategy: Dynamic Support/Resistance Reversals
Setup : Wait for validated pivot with ✓ marker and strength rating displayed on chart
Entry Timing : Enter on the bar when validation occurs or on pullback to the validated level
Direction : Counter-trend to the validated extreme (buy at validated lows/support, sell at validated highs/resistance)
Confirmation : Look for strength rating above 60 for higher probability setups
Structure Context : Consider overall trend using HH/HL/LH/LL structure labels
Secondary Strategy: ZigZag Trend Continuation
Setup : Identify trend direction using consecutive validated highs and lows
Entry : Enter in trend direction when price pulls back to previous validated level
Confirmation : Look for structure labels confirming trend (HH/HL for uptrend, LH/LL for downtrend)
Strength Filter : Use strength ratings above 70 for trend continuation entries
Stop Loss Methodology
For Long Positions (Validated Lows) : Place stop below the validated low price level
For Short Positions (Validated Highs) : Place stop above the validated high price level
Alternative Method : Use previous validated extreme in opposite direction as stop level
Structure-Based Method : Use significant validated levels that would invalidate the trade setup
Buffer Consideration : Add small buffer beyond validated level to account for wicks and spread
Profit Taking Strategy
For Long Positions (Validated Low Entries):
Target 1 : Previous validated high shown on chart (75% of position)
Target 2 : Next significant validated high or key resistance level (50% of remaining 25% = 12.5% of original position)
Target 3 : Extended targets using ZigZag structure analysis and trend context (remaining 12.5% of original position)
Management : Move stop loss to breakeven once first target (TP1) is executed
For Short Positions (Validated High Entries):
Target 1 : Previous validated low shown on chart (75% of position)
Target 2 : Next significant validated low or key support level (50% of remaining 25% = 12.5% of original position)
Target 3 : Extended targets using ZigZag structure analysis and trend context (remaining 12.5% of original position)
Management : Move stop loss to breakeven once first target (TP1) is executed
ZigZag Structure Trading Approach
Sideways Markets : Trade between validated highs and lows - buy at support, sell at resistance
Trending Markets : Use validated levels as pullback entry points in trend direction
Structure Breaks : Watch for breaks of significant validated levels to signal trend changes
Range Identification : Use consecutive validated highs and lows to identify trading ranges
Breakout Trading : Enter when price breaks beyond validated levels with strong momentum
Strength Rating Interpretation
Understanding the 0-100 Strength Score
The strength rating combines multiple factors:
Base Strength (25 points) : Fundamental pivot validation
Wave Events (12 points each) : Number and quality of wave events detected
Trend Context (5-10 points) : Alignment with overall trend direction
Structure Quality (3-8 points) : HH/HL/LH/LL structure strength
Sentiment Position (5-10 points) : Extreme sentiment readings
Momentum Context (5 points) : Momentum divergence confirmation
Strength Categories
90-100 : Exceptional strength - Highest probability setups
75-89 : Strong signal - High confidence trades
60-74 : Good signal - Solid trading opportunities
45-59 : Moderate signal - Use additional confirmation
30-44 : Weak signal - Proceed with caution
Below 30 : Very weak - Generally avoid
Wave Event Reference (Calculation Background)
Understanding Wave Events in Strength Calculations
Wave events are used internally by Market Sentiment A to calculate strength ratings and validate pivots. While these events may appear in alert messages or tooltips, they are not meant for direct trading decisions - they are calculation components that contribute to the overall strength score.
Key Wave Events (For Reference Only)
MPIV↑/MPIV↓ : Momentum pivot detection used in validation process
HTURN : Histogram turn identification used for wave completion
TRI↑/TRI↓ : Triangle pattern detection contributing to strength calculation
SW : Small wave indication affecting pivot quality assessment
VOL : Volume spike detection adding to strength scoring
MDIV↑/MDIV↓ : Momentum divergence contributing to validation strength
HDIV↑/HDIV↓ : Histogram divergence used in pivot confirmation
PDIV↑/PDIV↓ : Price divergence analysis for strength enhancement
How Wave Events Affect Your Trading
Strength Score Impact : More events generally result in higher strength ratings for validated pivots
Alert Context : Events may be mentioned in alerts to provide background on signal quality
Focus on Results : Instead of analyzing individual events, focus on the final strength rating and validated pivot levels
Trust the System : The indicator processes these events automatically - your job is to trade the validated highs and lows
Analysis Setups
Setup 1: Scalping Configuration (1-5 minute charts)
Core Settings:
ZigZag Speed: High (fastest detection for quick scalps)
Show Validated Pivots: ON
Show Strength Rating: ON
Bar Coloring: Market Sentiment
Visual Settings:
Label Size: Small (reduce visual clutter)
ZigZag Lines: ON
Potential Turns: ON (for immediate signals)
Trading Approach:
Focus on strength ratings above 70 for scalp entries
Quick entries at validated highs/lows with immediate execution
Tight stops just beyond validated levels
Target previous validated pivots shown on chart for quick profits
Use ZigZag structure to identify rapid reversal opportunities
Setup 2: Day Trading Configuration (5-15 minute charts)
Core Settings:
ZigZag Speed: Medium (balanced approach)
Show Validated Pivots: ON
Show Strength Rating: ON
Include Wave Events: ON (for context)
Visual Settings:
Label Size: Normal
Show Structure Labels: ON (for trend context)
ZigZag Lines: ON with trend coloring
Trading Approach:
Wait for strength ratings above 60 for quality setups
Use HH/HL/LH/LL structure labels for trend bias
Combine reversal trades at extremes with trend continuation at pullbacks
Hold positions targeting next validated pivot levels
Use ZigZag structure analysis for entry timing and market context
Setup 3: Swing Trading Configuration (1-4 hour charts)
Core Settings:
ZigZag Speed: Low (most reliable signals)
Show Validated Pivots: ON
Show Structure Labels: ON
Include Trend Analysis: ON
Visual Settings:
Label Size: Normal
Show all wave events for comprehensive analysis
Enable all alert types
Trading Approach:
Focus on strength ratings above 75 for swing positions
Emphasize trend continuation using ZigZag structure
Use validated level breaks for major position adjustments
Hold positions across multiple sessions targeting distant validated levels
Use comprehensive structure analysis (HH/HL/LH/LL) for entries/exits
Setup 4: Position Trading Configuration (4H-Daily charts)
Core Settings:
ZigZag Speed: Low (maximum reliability)
Show Validated Pivots: ON
Show Structure Labels: ON
Show all analysis features
Visual Settings:
Clean, comprehensive labeling
Full wave event display
Trend-based coloring for major bias
Trading Approach:
Only trade strength ratings above 80 for position entries
Focus on major ZigZag structure changes and validated level breaks
Use long-term structure analysis (HH/HL/LH/LL) for bias
Hold positions for weeks to months targeting major validated levels
Align with fundamental analysis and major market structure
Setup 5: Multi-Asset Analysis Configuration
For Forex Pairs:
Use Medium to Low speed settings
Focus on major session changes
Pay attention to news event correlation
Use strength ratings above 70
For Crypto Assets:
Medium speed for 24/7 market adaptation
Higher volatility requires strength above 75
Monitor weekend behavior patterns
Consider market sentiment cycles
For Stock Markets:
Align with market hours
Consider earnings and economic events
Use sector-specific analysis
Respect market close/open dynamics
Visual Components
Core Visual Elements
✓ Validated Pivots : Green checkmarks for confirmed lows, red for confirmed highs
● Potential Turns : Small dots showing histogram turn correlations (optional)
ZigZag Lines : Connecting validated extremes with trend-based coloring
💪 Strength Ratings : Numerical strength scores from 0-100
Structure Labels : HH/HL/LH/LL with trend context (optional)
Bar Coloring System
Market Sentiment Coloring : Based on sentiment oscillator position and momentum
Extreme Conditions : Special coloring for extreme overbought/oversold conditions
Momentum Swing Coloring : Alternative coloring based on momentum analysis
Advanced Visual Features
Wave Event Labels : Comprehensive event display within pivot labels
Trend Context : Dynamic trend identification and display
Strength Breakdown : Detailed tooltips showing strength components
Custom Coloring Modes : Standard vs trend-based coloring options
Alert System
Core Alert Types
Validated High Confirmed : When red wave validates ultimate high with full context
Validated Low Confirmed : When green wave validates ultimate low with full context
Trend Change Detected : When structure analysis detects trend shifts
Alert Message Structure
Each alert includes:
Timeframe identification
Signal type (BULLISH/BEARISH)
Structure context (HH/HL/LH/LL)
Strength score with 💪 rating
Exact price level
Wave events context (if enabled)
Setting Up Alerts
Enable desired alert types in indicator settings
Focus on "Confirmed Extremes" alerts for quality
Enable wave events for comprehensive context
Test alerts on historical data first
Set up multiple notification methods
Risk Management Framework
Strength-Based Position Sizing
Strength 90-100 : Maximum position size (3-5% risk)
Strength 75-89 : Large position size (2-3% risk)
Strength 60-74 : Standard position size (1-2% risk)
Strength 45-59 : Small position size (0.5-1% risk)
Below 45 : Avoid or minimal size (0.25% risk maximum)
Stop Loss Guidelines
Primary Method : Always use validated pivot levels for stops
Buffer Method : Add small buffer beyond validation level
Multiple Timeframe : Consider higher timeframe validated levels
Wave Event Context : Adjust stops based on event confluence
Risk-Reward Optimization
Minimum R:R : 1.5:1 for all trades
Preferred R:R : 2:1 or better for strength above 70
Exceptional Setups : 3:1+ for strength above 85
Position Management : Take 75% at TP1, 50% of remaining at TP2, close remaining at TP3
Stop Management : Move stop to breakeven after TP1 execution
Best Practices
Signal Quality Assessment
Always wait for validated pivots with ✓ checkmarks displayed on chart
Prioritize strength ratings above 60 for trade quality
Focus on the validated high/low levels rather than underlying calculations
Consider HH/HL/LH/LL structure labels for directional bias
Use ZigZag line connections to understand market structure flow
Entry Timing Optimization
Enter on validation bar or immediate pullback to validated level
Use lower timeframes for precise entry refinement around validated levels
Wait for strength score calculation completion before entry
Monitor price action around validated highs and lows
Consider multiple timeframe validated level alignment
Exit Strategy Management
Use opposite validated pivots displayed on chart as primary targets
Execute Fundur 3-stage exit: 75% at TP1, 12.5% at TP2, 12.5% at TP3
Move stop loss to breakeven immediately after TP1 execution
Monitor strength ratings of new validated levels that could reverse remaining position
Watch for structure changes (trend breaks) via HH/HL/LH/LL labels for early exit consideration
Common Mistakes to Avoid
Signal Interpretation Errors
Don't trade potential turns without ✓ validation markers
Never ignore strength ratings below 45 - they indicate weak signals
Don't chase signals after significant movement away from validated levels
Avoid overriding clear ZigZag structure and trend context
Don't ignore the relationship between consecutive validated highs and lows
Risk Management Failures
Never risk more than the strength score suggests for position sizing
Don't move stops against validated levels - they represent key structure
Avoid oversizing on "sure thing" setups - even high-strength signals can fail
Don't ignore multiple timeframe validated level context
Never trade without clear invalidation levels (validated highs/lows for stops)
System Usage Mistakes
Don't enable all features immediately - start simple
Avoid changing speed settings mid-session
Don't ignore alert system capabilities
Never disable core validation features
Don't overlook customization for your chart setup
Advanced Techniques
Multi-Timeframe ZigZag Analysis
Use higher timeframe validated levels for major bias and targets
Align lower timeframe entries with higher timeframe validated structure
Look for validated level confluence across timeframes
Monitor strength rating consistency of validated levels across periods
Advanced Structure Pattern Recognition
Identify recurring validated level patterns and their outcomes
Recognize high-probability ZigZag structure sequences
Use historical validated level patterns for target projection
Combine ZigZag analysis with other Fundur technical analysis tools
Advanced Alert Utilization
Create custom alert combinations based on strength thresholds
Use validated level break alerts for position management
Combine strength rating filters with validated pivot alerts
Develop systematic responses to different validated level types
Conclusion
The Fundur - Market Sentiment A indicator represents a breakthrough in technical analysis, providing a dynamic ZigZag system that displays validated highs and lows with unprecedented accuracy. By following the methodologies outlined in this guide and adapting the settings to your trading style, you can harness the full power of this sophisticated system for more precise and profitable trading decisions.
The key to success with Market Sentiment A lies in understanding that it is fundamentally a dynamic support and resistance system. Focus on the validated highs and lows displayed on your chart, use the strength ratings to assess signal quality, and leverage the structure analysis for trend context. Start with conservative settings, focus on high-strength signals, and gradually incorporate advanced features as you become familiar with the system's behavior across different market conditions.
Remember that this indicator provides the tools for identification and analysis - successful trading still requires proper risk management, psychological discipline, and continuous learning. Use the strength rating system as your primary guide, respect the validated pivot methodology, and always prioritize capital preservation over profit maximization.

Fundur - Trend TraderFundur - Trend Trader: Complete Trading Indicator Guide
Indicator Overview
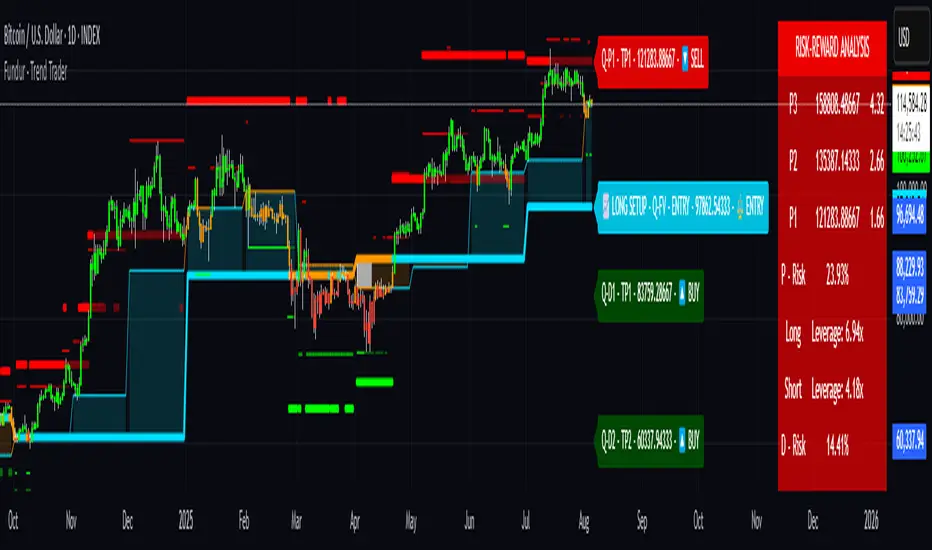
The Fundur - Trend Trader is a comprehensive dual-timeframe analysis indicator that combines fair value structure analysis, risk-reward calculations, and dynamic trend identification into one powerful trading tool. This indicator is designed to provide traders with precise entry and exit points while offering complete risk management insights.
What Makes Trend Trader Unique?
The Trend Trader goes beyond traditional pivot point indicators by introducing Fair Value Structure Analysis - a methodology that analyzes the relationship between two timeframes to determine market bias and optimal trading opportunities. Unlike static indicators, Trend Trader provides dynamic analysis that adapts to market conditions in real-time.
Core Methodology
The indicator operates on the principle that markets oscillate between Premium (overvalued) and Discount (undervalued) zones relative to fair value levels. By analyzing these zones across multiple timeframes, traders can identify high-probability trade setups with clearly defined risk-reward parameters.
Key Features
🎯 Dual-Timeframe Fair Value Analysis
Higher Timeframe Structure : Primary trend direction and major levels
Lower Timeframe Structure : Refined entry opportunities and micro-trend analysis
Dynamic Relationship : Real-time analysis of timeframe alignment
📊 Comprehensive Level System
Fair Value (FV) : Central equilibrium level for entries
Premium Levels (P1, P2, P3) : Sell zones with increasing distance from fair value
Discount Levels (D1, D2, D3) : Buy zones with increasing distance from fair value
🧠 Intelligent Trend Detection
Session-to-Session Analysis : Compares current vs previous session fair values
Trend Signals : Clear LONG/SHORT setup identification
Structure Bias : Bullish/Bearish fair value structure determination
⚖️ Advanced Risk-Reward System
Real-Time R:R Calculations : Dynamic risk-reward ratios for all levels
Leverage Recommendations : Optimal position sizing based on measured risk
Risk Percentage Display : Precise risk calculations for informed decisions
🎨 Smart Visual Features
Level Hit Tracking : Automatically darkens touched levels during session
Squeeze Detection : Identifies low-volatility periods with special bar coloring
Dynamic Highlighting : Price-responsive level emphasis
Zone Fills : Visual premium and discount area identification
Setup Guide
Step 1: Adding the Indicator
Open TradingView and navigate to your desired chart
Click the "Indicators" button or press "/" key
Search for "Fundur - Trend Trader"
Add the indicator to your chart
Step 2: Basic Configuration
Timeframe Settings
Higher Timeframe : Default is Weekly (W), adjust based on your trading style:
Scalping : Use 4H for higher timeframe
Day Trading : Use Daily (D) for higher timeframe
Short-Term Swing Trading : Use Weekly (W) for higher timeframe
Long-Term Swing Trading : Use Monthly (M) for higher timeframe
Position Trading : Use Quarterly (3M) or Yearly (12M) for higher timeframe
History Bars :
Higher Timeframe: 10 bars (recommended)
Lower Timeframe: 50 bars (recommended)
Visual Settings
Line Widths : Adjust for visibility preference
Zone Fills : Enable for better visual zone identification
Bar Coloring : Enable structure and squeeze coloring
Step 3: Label Configuration
Essential Labels (Recommended Settings)
✅ Show All Labels: ON
✅ Show Trend Direction: ON
✅ Show Higher Timeframe Labels: ON
⚠️ Show Lower Timeframe Labels: OFF (avoid clutter initially)
✅ Show Price Values: ON
Label Style Options
Use Short Names : ON (P1, D2, FV instead of full names)
Combine Timeframe & Description : ON (creates compact labels like "W-FV")
Label Style : Choose between Modern or Classic
Step 4: Risk-Reward Setup
✅ Show Risk-Reward Analysis: ON
✅ Show Measured Risk Values: ON
✅ Apply Leverage to Calculations: ON
Leverage Multiplier : Start with 1.0, adjust based on your risk tolerance
Basic Trading Guide
Understanding Fair Value Structure
The indicator's foundation is the Fair Value Structure - the relationship between higher and lower timeframe fair value levels:
Bullish Structure (🔵)
Condition : Lower timeframe FV above higher timeframe FV
Bias : Look for LONG opportunities
Focus : Fair Value Structure for entries (continuation strategy)
Strategy : Enter long positions at Fair Value, take profits at Premium levels (P1, P2, P3)
Bearish Structure (🟠)
Condition : Lower timeframe FV below higher timeframe FV
Bias : Look for SHORT opportunities
Focus : Fair Value Structure for entries (continuation strategy)
Strategy : Enter short positions at Fair Value, take profits at Discount levels (D1, D2, D3)
Entry Strategies
Primary Strategy: Fair Value Continuation Entries
Setup : Price approaches fair value level with established structure bias
Entry : In Fair Value Structure (in between the lower timeframe and higher timeframe fair value)
Direction : Follow the structure bias (long in bullish structure, short in bearish structure)
Stop Loss: Two approaches available:
Advanced Method : Place stop shy of liquidation point to avoid liquidation
Hassle-Free Method : Previous high/low OR just beyond higher timeframe Fair Value
For Long Positions : Stop below higher timeframe Fair Value
For Short Positions : Stop above higher timeframe Fair Value
Profit Taking Strategy:
For Long Positions (Bullish Structure):
75% profits at Premium 1 (P1) - highest probability target
50% of remaining position at Premium 2 (P2)
Close entire position at Premium 3 (P3)
Move stop loss to break even after first profits
For Short Positions (Bearish Structure):
75% profits at Discount 1 (D1) - highest probability target
50% of remaining position at Discount 2 (D2)
Close entire position at Discount 3 (D3)
Move stop loss to break even after first profits
Alternative Strategy: Structure Transition Entries
Setup : Structure changes from bearish to bullish (or vice versa)
Entry : At new fair value level after structure confirmation
Risk Management : Tight stops during structure transition periods
Targets : Follow primary profit-taking methodology above
Risk Management Framework
Position Sizing Using Leverage Recommendations
The indicator calculates optimal leverage based on measured risk:
Conservative : Use 50% of recommended leverage
Moderate : Use 75% of recommended leverage
Aggressive : Use 100% of recommended leverage
Never exceed : 150% of recommended leverage
Stop Loss Placement
Follow the methodology outlined in the Primary Strategy section:
Advanced Method : Place stop shy of liquidation point to avoid forced liquidation
Hassle-Free Method : Use structural levels for clear invalidation
Long Positions : Stop below higher timeframe Fair Value
Short Positions : Stop above higher timeframe Fair Value
Alternative : Previous significant high/low levels
Analysis Setups
Setup 1: Scalping Configuration (1-5 minute charts)
Timeframe Settings:
Higher Timeframe: 4H (240)
Lower Timeframe: 1H (auto-calculated)
History: 5 bars for higher, 20 bars for lower
Visual Settings:
Enable all visual features for quick decision making
Use Classic label style for cleaner appearance
Enable squeeze coloring for volatility awareness
Trading Approach:
Focus on fair value continuation entries
Quick entries in fair value structure
Tight risk management using R:R table
Target P1/D1 levels for primary profits (75% position)
Setup 2: Day Trading Configuration (5-15 minute charts)
Timeframe Settings:
Higher Timeframe: Daily (D)
Lower Timeframe: 4H (auto-calculated)
History: 10 bars for higher, 30 bars for lower
Visual Settings:
Enable zone fills for clear premium/discount identification
Show both timeframe labels
Enable level hit tracking
Trading Approach:
Use structure bias for directional bias
Enter in fair value structure for continuation trades
75% profits at P1/D1, scale out to P2/D2, close at P3/D3
Hold positions across multiple sessions following structure
Setup 3: Short-Term Swing Trading Configuration (1-4 hour charts)
Timeframe Settings:
Higher Timeframe: Weekly (W)
Lower Timeframe: Daily (auto-calculated)
History: 15 bars for higher, 50 bars for lower
Visual Settings:
Emphasize higher timeframe levels
Show trend direction signals
Enable complete risk-reward analysis
Trading Approach:
Primary focus on higher timeframe structure
Patient entries in fair value structure
Follow standard profit-taking: 75% at P1/D1, scale to P3/D3
Use lower timeframe for refined fair value entries
Setup 4: Long-Term Swing Trading Configuration (4H charts)
Timeframe Settings:
Higher Timeframe: Monthly (M)
Lower Timeframe: Weekly (auto-calculated)
History: 20 bars for higher, 75 bars for lower
Visual Settings:
Clean label setup focusing on major levels
Enable trend direction for bias confirmation
Simplified visual approach for clarity
Trading Approach:
Monthly structure provides major trend direction
Entries in fair value structure
Hold positions for several weeks
Apply standard profit-taking methodology at premium/discount zones
Setup 5: Position Trading Configuration (Daily/Weekly charts)
Timeframe Settings:
Higher Timeframe: Quarterly (3M) or Yearly (12M)
Lower Timeframe: Monthly or Quarterly (auto-calculated)
History: 25 bars for higher, 100 bars for lower
Visual Settings:
Clean label setup focusing on key levels
Enable all alert systems
Simplified color scheme
Trading Approach:
Structure changes signal major macro trend shifts
Very patient entries in fair value structure confirmation
Long-term continuation trades targeting extended premium/discount levels
Hold positions for months to years following structure bias
Focus on major market cycles and long-term trend continuations
Setup 6: Multi-Asset Analysis Configuration
For Forex Pairs:
Adjust decimal precision for pip accuracy
Focus on daily/weekly structure
Use tight risk management due to leverage
For Crypto Assets:
Higher volatility requires wider stops
24/7 markets need continuous monitoring
Structure breaks often lead to extended moves
For Stock Indices:
Respect market hours for structure analysis
Economic events can override technical levels
Seasonal patterns affect structure behavior
Visual Components
Level Indicators
Solid Lines : Active levels based on current price position
Highlighted Levels : Levels within current price range
Darkened Levels : Previously touched levels during current session
Zone Fills
Red Zones : Premium areas (selling opportunities)
Green Zones : Discount areas (buying opportunities)
Cloud Fill : Area between dual timeframe fair values
Bar Coloring
Purple Bars : Squeeze conditions (low volatility)
Structure Colors : Based on price position relative to fair value levels
Labels and Information
Level Labels : Price values and targets for each level
Trend Signals : Clear LONG/SHORT setup indications
Risk-Reward Table : Comprehensive analysis panel
Risk Management
Built-in Risk Controls
Measured Risk System
The indicator automatically calculates risk percentages based on:
Distance from fair value to premium/discount levels
Current price position
Leverage settings applied
Optimal Leverage Calculations
Long Positions : Based on discount risk measurement
Short Positions : Based on premium risk measurement
Dynamic Adjustment : Changes with market conditions
Risk-Reward Ratios
Each level displays its R:R ratio considering:
Entry point (fair value or current price)
Target level
Stop loss level
Applied leverage
Recommended Risk Parameters
Conservative Trading
Maximum 1-2% risk per trade
Use 50% of recommended leverage
Target R:R ratios above 2:1
Focus on high-probability setups only
Moderate Trading
Maximum 2-3% risk per trade
Use 75% of recommended leverage
Accept R:R ratios above 1.5:1
Trade multiple setups with correlation awareness
Aggressive Trading
Maximum 3-5% risk per trade
Use up to 100% of recommended leverage
Accept R:R ratios above 1:1
Active management required
Alert System
Structure Alerts
Fair Value Structure Bullish : When structure turns bullish
Fair Value Structure Bearish : When structure turns bearish
Level Interaction Alerts
For each premium and discount level:
Touch Alerts : When price reaches the level
Cross Above : When price breaks above the level
Cross Below : When price breaks below the level
Range Alerts
Rising into FV : Price enters fair value range from below
Falling into FV : Price enters fair value range from above
Rising Above FV : Price breaks above fair value range
Falling Below FV : Price breaks below fair value range
Setting Up Alerts
Enable desired alert types in indicator settings
Create TradingView alerts using the indicator
Configure notification methods (email, SMS, app)
Test alerts with historical data first
Customization Options
Color Schemes
Fair Value Colors : Customize based on structure bias
Premium/Discount Colors : Match your chart theme
Dynamic Coloring : Automatically adjusts based on price position
Label Customization
Text Transparency : Adjust readability
Background Transparency : Control label prominence
Size Options : From tiny to large based on chart size
Position Options : Multiple screen positions available
Table Settings
Position : 9 different screen positions
Size : 4 size options for different screen resolutions
Transparency : Adjust for chart readability
Best Practices
Chart Setup Recommendations
Screen Real Estate Management
Use larger timeframes for cleaner appearance
Minimize lower timeframe labels on smaller screens
Position risk-reward table to avoid price action interference
Multi-Timeframe Analysis
Keep one chart with higher timeframe focus
Use secondary chart for lower timeframe entries
Synchronize timeframe selection across charts
Trading Psychology Integration
Patience with Structure
Wait for clear structure bias before trading
Avoid trading during structure transition periods
Respect the higher timeframe bias
Risk Management Discipline
Never ignore the calculated risk percentages
Use leverage recommendations as guidelines, not rules
Adjust position sizes based on market conditions
Entry Timing
Use lower timeframes for precise entries
Wait for price to reach significant levels
Confirm entries with additional confluence factors
Common Mistakes to Avoid
Over-Analysis
Don't wait for perfect setups that may never come
Focus on high-probability scenarios
Accept that not every level will hold
Ignoring Structure Bias
Don't fight the overall structure direction
Adjust strategies when structure changes
Respect multi-timeframe alignment
Poor Risk Management
Never risk more than the indicator suggests
Don't ignore stop loss levels
Avoid emotional position sizing
Advanced Techniques
Structure Transition Trading
Identify when structure is changing
Position for new bias direction
Use tight risk management during transitions
Level Confluence
Look for multiple level alignments
Combine with support/resistance
Use volume analysis for confirmation
Seasonal and Market Hour Awareness
Adjust for different market sessions
Consider seasonal patterns in structure
Account for economic calendar events
Conclusion
The Fundur - Trend Trader indicator represents a comprehensive approach to modern technical analysis, combining traditional pivot point methodology with advanced fair value structure analysis. By following the guidelines in this manual and adapting the settings to your trading style, you can harness the full power of this indicator for more informed and profitable trading decisions.
Remember that no indicator is perfect, and the Trend Trader should be used as part of a complete trading strategy that includes fundamental analysis, risk management, and proper psychology. Start with conservative settings and gradually increase sophistication as you become more familiar with the indicator's behavior in different market conditions.
For best results, practice with the indicator in demo accounts first, understand its behavior in various market conditions, and always prioritize risk management over profit potential.
PipsHunters Trading ChecklistTitle: PipsHunters Trading Checklist (PHTC)
Short Description / Teaser:
Enforce trading discipline and never miss a step in your pre-trade analysis with this simple, interactive, on-chart checklist.
Full Description:
🚀 Overview
The PipsHunters Trading Checklist (PHTC) is a powerful yet simple tool designed to instill discipline and structure into your trading routine. In the heat of the moment, it's easy to forget crucial steps of your analysis, leading to impulsive and low-probability trades. This indicator acts as your personal co-pilot, providing a persistent, on-chart checklist that you must manually complete before taking a trade.
This is not an automated signal generator. It is a utility to keep you accountable to your own trading plan. The checklist items are inspired by common concepts in price action and Smart Money Concepts (SMC) methodologies, but they serve any trader who follows a rule-based system.
✨ Key Features
Interactive On-Chart Table: Displays a clean, non-intrusive table directly on your chart.
Manual Check-off System: You are in full control. Go into the indicator settings and check off each item as you complete your analysis.
Real-Time Progress Tracking: The table header shows your progress (e.g., 4/7) and changes color from red to green when all items are checked.
Clear Visual Cues: Each item is marked with a ✅ or ❌, and the text color changes to provide an at-a-glance status.
"Ready!" Status: A final "READY!" confirmation appears once your entire checklist is complete, giving you the green light to look for an entry based on your strategy.
Fully Customizable Position: Place the table in any corner of your chart (Top Left, Top Right, Bottom Left, Bottom Right) to suit your layout.
📋 The Checklist Items Explained
The default checklist guides you through a structured, top-down analysis process common in many trading strategies:
Seat before 1H: A reminder to be settled and mentally prepared at your desk at least an hour before your target session begins. Avoids rushing and emotional decisions.
Check News: Have you checked for high-impact news events that could introduce extreme volatility and invalidate your setup?
Mark Day Open: The daily open is a key institutional level. Marking it helps establish the daily bias.
Mark LQ Levels: Have you identified key Liquidity (LQ) levels? This includes previous day/week highs and lows, session highs/lows, and other obvious swing points.
Wait for Kill Zone: A reminder to be patient and wait for price to trade into a specific, high-probability time window (e.g., London Kill Zone, New York Kill Zone).
LQ sweep inside Kill Zone: The core of the setup. Has price swept a key liquidity level within your chosen Kill Zone?
Lower TF Confirmations: After the liquidity sweep, have you waited for confirmation on a lower timeframe? This is often a Market Structure Shift (MSS) or Change of Character (CHoCH).
🛠️ How to Use
Add the "PipsHunters Trading Checklist" indicator to your chart.
Go to the indicator's Settings (click the gear icon ⚙️).
As you perform each step of your pre-trade analysis, tick the corresponding checkbox in the Inputs tab.
The on-chart table will update instantly to reflect your progress.
Only when all 7 items are checked will the table signal "READY!".
🎯 Who Is This For?
This indicator is perfect for:
SMC / ICT Traders: The checklist items align directly with Smart Money Concepts.
New Traders: Helps build the essential habit of a consistent pre-trade routine.
Inconsistent Traders: Acts as a guardrail to prevent impulsive, undisciplined entries.
Any Rule-Based Trader: Anyone who follows a trading plan can benefit from the structure it provides.
Disclaimer: This is a utility tool to aid in discipline and execution. It does not provide financial advice or guarantee profitable trades. All trading involves risk, and you are solely responsible for your own decisions. Trade safe and stay disciplined!

Inside Bar With Alert - RajThis indicator helps you reduce your screen time by giving you consistent alerts on the formation of inside bar candle and it gives you bullish and bearish alerts on breakout of the mother candle. So if you believe in inside strategy this indicator will be helpful for you.

Crypto Volatility Panel ProCrypto Volatility Panel Pro
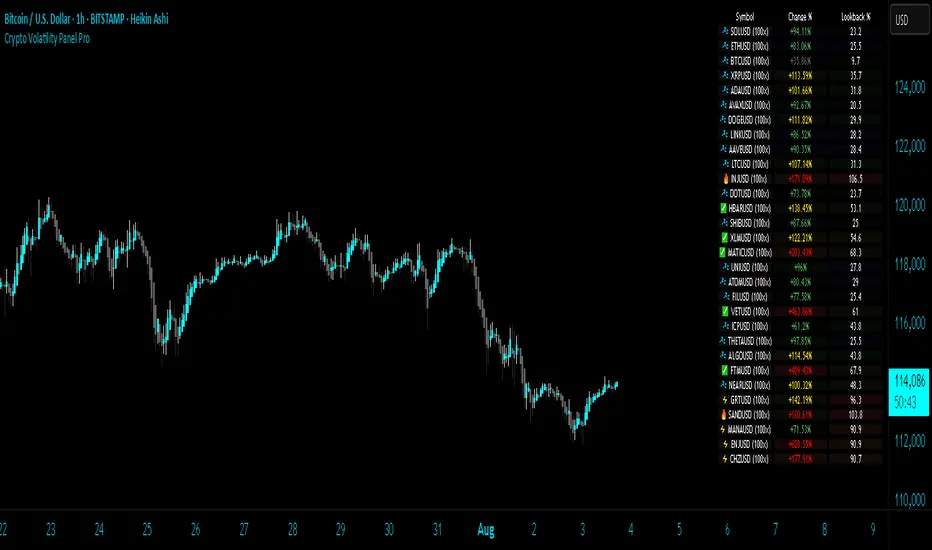
This advanced indicator creates a comprehensive volatility monitoring dashboard that displays real-time volatility metrics for up to 30 cryptocurrency pairs simultaneously. The tool combines sophisticated volatility assessment techniques with leverage-adjusted analysis and heat map visualization to provide enhanced market insights in an organized table format.
Proprietary Methodology
This indicator utilizes a proprietary dual-metric volatility assessment system developed specifically for cryptocurrency market analysis. The methodology combines advanced technical analysis components including price volatility measurements, range position analysis, and leverage scaling algorithms optimized through extensive market testing.
The unique approach enables more accurate volatility assessments across diverse cryptocurrency price ranges and market conditions compared to standard volatility indicators. Specific calculation methods and optimization parameters remain proprietary to maintain competitive advantages.
Core Functionality and Innovation
Unlike standard volatility indicators that focus on single instruments, this tool provides simultaneous multi-asset monitoring with proprietary volatility calculations specifically optimized for cryptocurrency markets. The innovation lies in combining multiple volatility assessment techniques with enhanced leverage scaling algorithms, heat map ranking system, and comprehensive multi-asset dashboard presentation.
The indicator processes data from up to 30 different cryptocurrency pairs, each with independent leverage settings ranging from 0.1x to 10,000x. Users can apply universal leverage across all pairs for consistent analysis scenarios, or customize individual leverage ratios for specific trading strategies.
Visual Organization and Heat Map System
The table displays three primary columns with an advanced heat map ranking system:
Symbol Column: Shows cryptocurrency pair names with dynamic visual indicators (🔥, ⚡, ✅, 💤) representing volatility intensity levels. Each symbol includes its current leverage setting in parentheses for reference. Invalid or unavailable symbols display error indicators (❌) with appropriate error messaging.
Change Percentage Column: Displays leverage-adjusted volatility measurements with both color-coded text and heat map background ranking. Text colors indicate volatility levels (Red for extreme, Yellow for high, Green for moderate, Gray for low), while background heat map colors rank performance relative to all monitored pairs.
Lookback Percentage Column: Shows leverage-adjusted position analysis within recent price ranges with heat map background ranking, indicating market positioning relative to recent highs and lows across all monitored instruments.
Advanced Heat Map Ranking
The proprietary heat map system ranks all enabled pairs in real-time based on their volatility metrics, providing instant visual identification of the most and least volatile instruments:
Hottest (Top 10%): Deep red background indicating highest volatility
Warm (10-20%): Orange-red background for elevated volatility
Medium (20-40%): Yellow background for moderate-high volatility
Cool (40-60%): Green background for moderate volatility
Cold (60-80%): Blue background for low volatility
Sleepy (Bottom 20%): Dark background for minimal volatility
Heat map opacity is fully customizable, and the system can be disabled for users preferring traditional static backgrounds.
Configuration Options
Expanded Pair Selection: Monitor up to 30 cryptocurrency pairs across major exchanges including Bitstamp and Binance. Default selections include established cryptocurrencies (BTC, ETH, SOL) and emerging assets (INJ, NEAR, FTM), with full customization available.
Table Positioning: Nine position options including top/middle/bottom combinations with left/center/right alignment, allowing optimal placement on any chart layout without interfering with price action or other indicators.
Visual Customization: Comprehensive control over table dimensions, frame width, font size, background colors, frame colors, header styling, text colors, and heat map color schemes to match user preferences and chart themes.
Leverage Management: Individual leverage settings for each of the 30 pairs, with optional universal leverage mode that applies consistent multipliers across all enabled pairs. Supports extreme leverage ranges up to 10,000x for advanced risk modelling.
Error Handling: Robust symbol validation with clear error indicators for invalid, unavailable, or misconfigured trading pairs, ensuring reliable operation across different market conditions.
Practical Trading Applications
Multi-Asset Volatility Screening: Identify the most and least volatile cryptocurrency markets in real-time using the heat map ranking system, enabling quick allocation of attention to instruments with the highest potential for profitable moves.
Leverage Risk Assessment: Visualize how different leverage ratios amplify volatility metrics across multiple markets simultaneously, supporting informed position sizing decisions before entering leveraged trades.
Market Timing and Rotation: Use the combination of volatility measurements and heat map rankings to identify optimal entry/exit timing across cryptocurrency markets, facilitating effective portfolio rotation strategies.
Portfolio Diversification: Compare volatility levels and rankings across 30 cryptocurrencies to construct portfolios with desired risk characteristics, balancing high-volatility growth opportunities with stable store-of-value positions.
Risk Management Dashboard: Monitor real-time volatility changes and relative rankings to adjust position sizes, implement protective measures, or reallocate capital when market conditions change significantly.
Technical Implementation
Built using Pine Script v5 with optimized security request handling to minimize performance impact while accessing 30 external data sources simultaneously. The indicator uses efficient array-based data collection, real-time ranking algorithms, and conditional table updates to maintain smooth chart operation.
The heat map system employs dynamic ranking calculations that process all enabled pairs in real-time, sorting values and applying percentile-based color mapping for instant visual feedback. Error handling includes invalid symbol detection and graceful fallback display for unavailable data feeds.
Usage Instructions
Configure Pair Selection: Enable desired cryptocurrency pairs from the 30 available options, organized across three input groups for easy navigation. Set individual leverage values or activate universal leverage mode for consistent multipliers.
Customize Heat Map: Adjust heat map colors and opacity to match your visual preferences and chart theme. The system can be disabled for users preferring static backgrounds.
Position and Style Table: Select optimal table position from nine available options and customize appearance including colors, sizing, and text elements to integrate seamlessly with your trading setup.
Interpret Rankings: Monitor both absolute values and heat map rankings to identify relative performance.
Hottest colors indicate pairs experiencing the highest volatility relative to the monitored universe.
Apply Leverage Context: Use leverage-adjusted values to understand how volatility would affect leveraged positions, remembering these are mathematical projections designed for risk assessment rather than trading signals.
Advanced Features
Dynamic Symbol Processing: The indicator automatically handles symbol validation, displaying clear error messages for invalid or unavailable trading pairs while maintaining operation for valid symbols.
Real-Time Ranking: Heat map colors update dynamically as market conditions change, providing instant visual feedback on shifting volatility patterns across the cryptocurrency universe.
Scalable Monitoring: Users can monitor anywhere from a few key pairs to the full 30-pair universe, with the ranking system automatically adjusting to the number of enabled instruments.
Cross-Exchange Support: Incorporates data from multiple cryptocurrency exchanges to provide comprehensive market coverage and reduce single-source dependency risks.
Limitations and Important Considerations
Proprietary Algorithm: The specific calculation methods are proprietary and not disclosed. Users should evaluate the indicator's output through their own analysis and testing before incorporating it into trading decisions.
Complex Volatility Model: While the proprietary methodology is sophisticated, it represents one approach to volatility assessment and may not capture all forms of market volatility such as gap movements, flash crashes, or news-driven events.
Performance Considerations: Processing data from up to 30 external securities may impact chart loading speed or cause timeouts during periods of high TradingView server load. Users experiencing performance issues should consider reducing the number of enabled pairs.
Leverage Calculations: Leverage adjustments are mathematical projections that assume linear scaling, which may not reflect actual leveraged trading mechanics including margin requirements, funding costs, liquidation risks, and exchange-specific policies.
Market Data Dependencies: Cryptocurrency prices and volatility can vary significantly between exchanges. The indicator's data sources may not represent the specific exchange or trading pair you use, and some feeds may experience gaps or delays during maintenance periods.
Ranking Relativity: Heat map rankings are relative to the enabled pair universe. Rankings will change based on which pairs are monitored and their current market conditions, making absolute interpretations less meaningful than relative comparisons.
Educational Value
This indicator helps traders develop understanding of relative volatility patterns across cryptocurrency markets and the mathematical impact of leverage on risk metrics. The heat map system provides intuitive visualization of market dynamics, helping users identify which assets are experiencing unusual activity relative to their peers.
The tool serves as an educational platform for understanding advanced volatility measurement techniques, relative ranking systems, and multi-asset risk assessment concepts that are crucial for professional cryptocurrency trading and portfolio management.
Performance and Compatibility
The indicator is optimized for cryptocurrency markets but can be adapted to other volatile asset classes by modifying the symbol inputs. Security request limits may occasionally affect data availability, particularly when multiple indicators requesting external data are used simultaneously on the same chart.
The heat map rendering system is designed for efficiency, updating color mappings only when ranking changes occur rather than on every price tick, ensuring smooth chart performance even when monitoring the full 30-pair universe.
Risk Disclaimer: This indicator is designed for educational and analytical purposes only. Volatility calculations are estimates based on historical price data and proprietary mathematical models that are not disclosed. Results do not constitute trading advice or predictions of future price movements. Users should conduct independent analysis to evaluate the indicator's effectiveness before making trading decisions.
Leveraged trading involves substantial risk of loss and may not be suitable for all investors. Always conduct thorough research and consider consulting with qualified financial professionals before making leveraged trading decisions. Cryptocurrency markets are highly volatile and can result in significant losses. Past volatility patterns do not guarantee future market behavior.
This indicator is compatible with all TradingView chart types and timeframes. It is specifically designed for cryptocurrency markets using proprietary algorithms optimized for digital asset volatility characteristics.
[Tuan Captain] BTC Buy & Sell SignalsLooking for high-quality trading signals for Bitcoin (BTCUSD)? Stay updated with our expertly analyzed entry points, backed by real-time market data and trend indicators to help you make smarter, more profitable decisions in the crypto market.

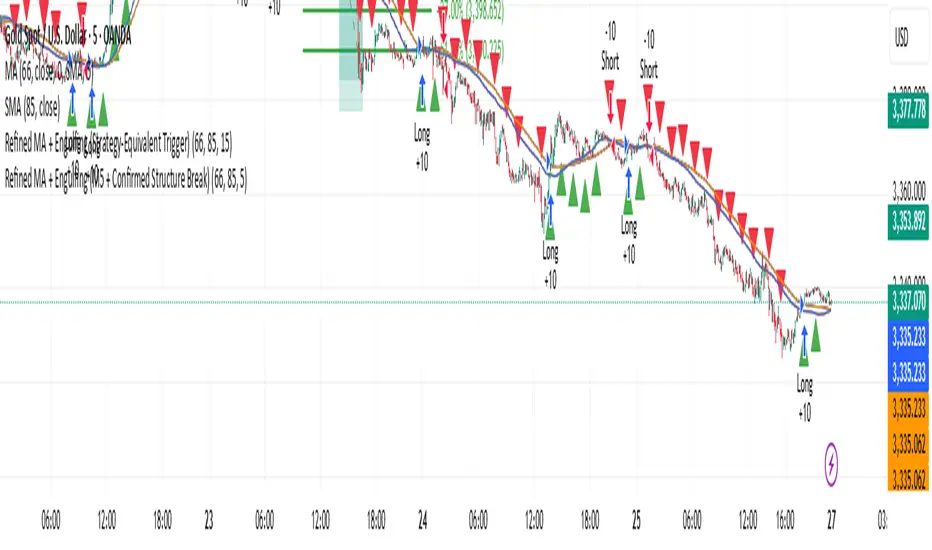
Refined MA + Engulfing (Strategy-Equivalent Trigger)I would like to start by saying that this indicator was put together using ChatGPT, some past trades from myself and some backtested trades, and from my time as a student in Wallstreet Academy under Cue Banks.
I am not profitable yet. I am too jumpy and blow accounts. I'm hoping this indicator (and it's strategy twin), with the help of some alerts, can help me spend less time on the charts, so that I'm not tempted to press buttons as much.
It does fire quite a bit. It can be adjusted, I believe, to trigger more or less (open the script, cooldown bars(x) <== change the X to whatever. 5 minute intervals so 1 is 5.
With that being said, there are times that this indicator has shown to trigger and I ask, "Why?".
I just want to help myself and others, and maybe make some decent\cool stuff along the way. Enjoy
KR
Mental Reminder# Mental Reminder - Trading Psychology Overlay
## 🧠 Why This Indicator Matters
Trading success isn't just about technical analysis - it's about psychology. The biggest enemy of profitable trading is often our own emotions and impulses. This indicator serves as your constant mental anchor, displaying personalized reminders that keep you focused on what truly matters.
## 💡 Core Purpose
**Combat Emotional Trading**
Every trader knows the feeling - you see a price movement and your emotions take over. This overlay keeps your trading rules and mindset visible at all times, acting as a psychological brake against impulsive decisions.
**Reinforce Discipline**
Whether it's "Wait for confirmation", "Risk management first", or "The market will always be here tomorrow" - having your key principles constantly visible helps internalize good trading habits.
**Maintain Patience**
In a world of instant gratification, successful trading requires patience. A simple "Let the setup come to you" reminder can prevent countless premature entries and exits.
## 🎯 Real Trading Applications
- **Pre-market reminder**: "Review your plan" before market open
- **During drawdowns**: "Trust the process" or "Losses are part of the game"
- **In volatile markets**: "Stay calm" or "Stick to your strategy"
- **During winning streaks**: "Don't get overconfident" or "Risk management still matters"
- **FOMO moments**: "There will always be another trade"
## 🔄 The Psychology Behind Visual Reminders
Studies show that visual cues are more effective than trying to remember rules mentally. When you're in the heat of trading, emotions can cloud judgment. A constant visual reminder cuts through the emotional noise and brings you back to your planned approach.
**Why Fixed Position Works**
Unlike annotations that move with price, this reminder stays in your peripheral vision - always there, never intrusive, but impossible to ignore when you need it most.
Your trading edge isn't just your strategy - it's your ability to execute it consistently. This simple tool helps bridge the gap between knowing what to do and actually doing it.

Custom Portfolio [BackQuant]Custom Portfolio {BackQuant]
Overview
This script turns TradingView into a lightweight portfolio optimizer with institutional-grade analytics and real-time position management capabilities.
Rank up to 15 tickers every bar using a pair-wise relative-strength "league table" that compares each asset against all others through your choice of 12 technical indicators.
Auto-allocate 100% of capital to the single strongest asset and optionally apply dynamic leverage when the aggregate market is trending, with full position tracking and rebalancing logic.
Track performance against a custom buy-and-hold benchmark while watching a fully fledged stats dashboard update in real time, including 15 professional risk metrics.
How it works
Relative-strength engine – Each asset is compared against every other asset with a user-selectable indicator (default: 9/21 EMA cross). The system generates a complete comparison matrix where Asset A vs Asset B, Asset A vs Asset C, and so on, creating strength scores. The summed scores crown a weekly/daily/hourly "winner" that receives the full allocation.
Regime filter – A second indicator applied to TOTAL crypto-market cap (or any symbol you choose) classifies the environment as trending or mean-reverting . Leverage activates only in trending regimes, protecting capital during choppy or declining markets. Choose from indicators like Universal Trend Model, Relative Strength Overlay, Momentum Velocity, or Custom RSI for regime detection.
Capital & position logic – Equity grows linearly when flat and multiplicatively while invested. The system tracks entry prices, calculates returns including leverage adjustments, and handles position transitions seamlessly. Optional intra-trade leverage rebalancing keeps exposure in sync with market conditions, recalculating position sizes as regime conditions change.
Risk & performance analytics – Every confirmed bar records return, drawdown, VaR/CVaR, Sharpe, Sortino, alpha/beta vs your benchmark, gain-to-pain, Calmar, win-rate, Omega ratio, portfolio variance, skewness, and annualized statistics. All metrics render in a professional table for instant inspection with proper annualization based on your selected trading days (252 for traditional markets, 365 for crypto).
Key inputs
Backtest window – Hard-code a start date or let the script run from series' inception with full date range validation.
Asset list (15 slots) – Works with spot, futures, indices, even synthetic spreads (e.g., BYBIT:BTCUSDT.P). The script automatically cleans ticker symbols for display.
Indicator universe – Switch the comparative metric to DEMA, BBPCT, LSMAz adaptive scores, Volatility WMA, DEMA ATR, Median Supertrend, and more proprietary indicators.
With more always being added!
Leverage settings – Max leverage from 1x to any multiple, auto-rebalancing toggle, trend/reversion thresholds with precision controls.
Visual toggles – Show/hide equity curve, rolling drawdown heat-map, daily PnL spikes, position label, advanced metrics table, buy-and-hold comparison equity.
Risk-free rate input – Customize the risk-free rate for accurate Sharpe ratio calculations, supporting both percentage and decimal inputs.
On-chart visuals
Color-coded equity curve with "shadow" offset for depth perception that changes from green (profitable) to red (losing) based on recent performance momentum.
Rolling drawdown strip that fades from light to deep red as losses widen, with customizable maximum drawdown scaling for visual clarity.
Optional daily-return histogram line and zero reference for understanding day-to-day volatility patterns.
Bottom-center table prints the current winning ticker in real time with clean formatting.
Top-right metrics grid updates every bar with 15 key performance indicators formatted to three decimal places for precision.
Benchmark overlay showing buy-and-hold performance of your selected index (default: SPX) for relative performance comparison.
Typical workflow
Add the indicator on a blank chart (overlay off).
Populate ticker slots with the assets you actually trade from your broker's symbol list.
Pick your momentum or mean-reversion metric and a regime filter that matches your market hypothesis.
Set max leverage (1 = spot only) and decide if you want dynamic rebalancing.
Press the little " L " on the price axis to view the equity curve in log scale for better long-term visualization.
Enable the metrics table to monitor Sharpe, Sortino, and drawdown in real time.
Iterate through different asset combinations and indicator settings; compare performance vs buy-and-hold; refine until you find robust parameters.
Who is it for?
Systematic crypto traders looking for a one-click, cross-sectional rotation model with professional risk management.
Portfolio quants who need rapid prototyping without leaving TradingView or exporting to Python/R.
Swing traders wanting an at-a-glance health check of their multi-coin basket with instant position signals.
Fund managers requiring detailed performance attribution and risk metrics for client reporting.
Researchers backtesting momentum and mean-reversion strategies across multiple assets simultaneously.
Important notes & tips
Set Trading Days in a Year to 252 for traditional markets; 365 for 24/7 crypto to ensure accurate annualization.
CAGR and Sharpe assume the backtest start date you choose—short windows can inflate stats, so test across multiple market cycles.
Leverage is theoretical; always confirm your broker's margin rules and account for funding costs not modeled here.
The script is computationally heavy at 15 assets due to the N×N comparison matrix—reduce the list or lengthen the timeframe if you hit execution limits.
Best results often come from mixing assets with different volatility profiles rather than highly correlated instruments.
The regime filter symbol can be changed from CRYPTOCAP:TOTAL to any broad market index that represents your asset universe.

TrendZonesTrendZones
This is an indicator which I use, have tested, tweaked and added features to for use in my trend following investing system. I got the idea for it when for some reason I was looking for a dynamic reference to measure the height of a channel or something. In search of this I made MA’s of the high and low borders of a Donchian channel which turned out to be two near parallel and stunningly smooth curves. This visual was so appealing that I immediately tried to turn it into a replacement for the KeltCOG which I previously used in my system. First I created a curve in the middle of the upper and lower curves, which I called COG (Center Of Gravity). Then I decided to enter only one lookback and let the script create a Donchian channel with half the lookback and use this to create the curves with an MA of whole lookback. For this reason the minimum lookback is set to 14, enough room for the Donchian Channel of 7 periods. This Donchian ChanneI has a special way of calculating the borders, involving a 5 period Median value. Thanks to this these borders are really a resistance and support level, which won’t change at a whim, e.g. when a ‘dead cat bounce’ occurs. I prevented the Donchian channel to show itself between the curves and only pop out from behind these. These pop outs now function as “strong trend zones”. I gave it colors (blue:-strong up, green: moderate up, orange: moderate down, red: strong down, near COG: gray, curves horizontal: gray) and it looked very appealing. I tested it in different time frames. In some weekend, when I was bored, I observed for a few hours the minute chart of bitcoin. It turned out that you can reliably tell that an uptrend ends when the candles go under the COG beginning a downtrend. Uptrend starts again once the candles go above COG. As Trends on minute charts only last around half an hour, this entertainment made the potential of this indicator very clear to me in just one afternoon.
Risk Management, Safe Level and Logical Stops.
In the inputs are settings for “Risk Tolerance”, and to activate “Show Logical Stop Level” (activated in example chart) and “Show Safe Level”. As a rule of thump a trade should not expose the invested capital to a risk of losing more than 2 percent. I divided my investment capital in ten equal parts which are allocated to ten different stocks or other instruments or kept liquid. This means that when a position is closed by triggering a Stop with a loss of 20 percent, the invested capital suffers only 2 percent (20% x 10% = 2%). This is why the value for “Risk Tolerance” has a default of 20. Because I put my Stops on the lower curve, a “Safe Level” can be calculated such that when you buy for a price below or at this level, the stop will protect the position sufficiently. Because I only buy when the instrument is in uptrend, the buying price should be between COG and Safe Level. Although I never do that, putting the stop at other curves is feasible and when you want to widen the stop (I never lower my stops btw) in a downtrend situation, even 1 ATR below the “Low Border”. I call these “Logical Stop Levels”, marked with dark green circles on the lower curve when safe buying by placing the Stoploss on this curve is possible, gray circles on the other curves, on the Upper Curve navy when price enters very profitable level. In a downtrend situation maroon circles appear.
Target lines
When I open a position I always set a Stoploss and a Target, for this purpose two types of Target values can be set and corresponding Target lines activated. These lines are drawn above the “High Border” at the set distance. If one expects some price to be used, differences will occur.
Other Features
Support Zone, this is 1 ATR below the “Low Border”, the maroon circles of the “Logal Stops” are placed on this “Support level”.
Stop distance and Channel Width. (activated in example chart) These are reported in a two cell table in the right lower corner of the main panel. I created this because I want to be able to check the volatility, whether the channel shows a situation in which safe buying in most levels of the channel is possible or what risk you take when you buy now and set the Stop at the nearest logical level (which is not always the “Lower curve”). This feature comes in handy for creating a setup I propose in the “Day Trading Fantasy” below.
Some General and User Settings. I never activate this, perhaps you will.
Use Of TrendZones In My System.
Create a list of stocks in uptrend. I define ‘stock in uptrend’ as in uptrend zone in all three monthly, weekly and daily charts, all three should at the same time be in uptrend. The advantage of TrendZones is that you can immediately see in which zone the candle moves.
Opening a position in a stock from the above list. I do this only when in both the daily and weekly the green dot on the lower curve indicates a buying opportunity. This is usually not the case in most of the items of the list, this feature thus provides a good timing for opening a position. Sometimes you need to wait a few weeks for this to happen.
Setting a target over a position. For this I use the Target percent line of the weekly chart with the default value of 10.
Updating the Stoploss and Target values. Every week or two weeks I set these to the new values of the “Lower Curve” and the Target line of the weekly. Attention: never shift down Stops, only up or let them stay the same when the curve moves down. I never use Stop levels on other curves.
I Check the charts whenever I like to do this. Close the position when the uptrend obviously shifts down. Otherwise I let the profits run until the Target triggers which closes the position with some profit.
For selecting stocks an checking charts for volume events, I also use a subpanel indicator called “TZanalyser”, which borrows the visual of my “Fibonacci Zone Oscillator”, is based on TrendZones and includes code from my REVE indicators. I intend to publish that as well.
Day Trading Fantasy.
Day trading is an attempt to earn a dime by opening a position in the morning and close it during the day again with a profit (or a loss). Before the market closes, you close all day trading positions.
In my fantasy the “Logical Stop Level” is repurposed for use as entry point and the ATR-based Target line is used to provide a target setting in an intraday chart, like e.g. 15 minute. To do this the “Safe Level” should be limited to between Channel width and COG. This can be done by showing “Safe Level” and “Channel Width” and then set “Risk Tolerance” to around the shown Channel Width. In this setting you can then wait for the green circle to show up for entering your trade and protect it with the stop.
I don’t know if this works fine or if it’s better than other day trade systems, because I don’t do day trading.
Take care and have fun.

Bitcoin Institutional Volume AnchorsBitcoin Institutional Volume Anchors
Indicator Overview:
The Bitcoin Institutional Volume Anchors indicator is a professional-grade VWAP analysis tool designed for sophisticated Bitcoin trading strategies. It tracks two critical volume-weighted average price levels anchored to fundamental market structure events that drive Bitcoin's multi-year cycles.
-Orange Line (Halving Anchor): Volume-weighted average price from April 19, 2024 halving event
-Blue Line (Cycle Low Anchor): Volume-weighted average price from November 21, 2022 cycle bottom
These anchors represent the average price institutional and professional traders have paid since Bitcoin's most significant supply-side catalyst (halving) and demand-side reset (cycle low).
Market Interpretation Framework:
Price Above Both Anchors - Institutional Bullish
-Strong institutional accumulation confirmed
-Majority of professional money profitable since key events
-Optimal environment for long-term position building
-Risk-on institutional sentiment
Price Between Anchors - Transition Phase
-Mixed institutional signals requiring careful analysis
-Appropriate for reduced position sizing
-Monitor for directional confirmation
-Tactical rebalancing opportunity
Price Below Both Anchors - Institutional Bearish
-Professional money underperforming key levels
-Heightened risk management protocols required
-Defensive positioning appropriate
-Await institutional re-accumulation signals
Standard Deviation Band Analysis:
Gray Bands (2σ): Statistical volatility boundaries
-Represent normal price excursions from institutional fair value
-Used for tactical profit-taking and position scaling
-Indicate elevated but manageable risk levels
Colored Bands (3σ): Extreme volatility boundaries
-Orange/Blue bands corresponding to respective VWAP anchors
-Represent statistically extreme price extensions
-High-probability reversal or exhaustion zones
-Critical risk management triggers
Professional Trading Applications:
Portfolio Allocation Framework
Maximum Allocation (70-100%)
-Price above both anchors with upward trending VWAPs
-Recent bounce from either anchor level
-Recovery to fair value after extreme extension
Standard Allocation (40-70%)
-Price above anchors but approaching 2σ bands
-Consolidation near anchor levels
-Confirmed institutional trend changes
Reduced Allocation (20-40%)
-Price at 2σ extension levels
-Below one anchor but above the other
-Conflicting VWAP trend signals
Defensive Allocation (10-25%)
-Price at 3σ extreme levels
-Below both institutional anchors
-Overextended risk conditions (>30-35% above anchors)
Entry Signal Hierarchy:
Tier 1 Signals (Highest Probability)
-Bounce from Cycle Low Anchor during uptrend
-Cross above both anchors with volume confirmation
-Recovery to fair value after 20%+ extension
Tier 2 Signals (Standard Probability)
-Bounce from Halving Anchor during uptrend
-Trend change confirmation in VWAP slope
-2σ band rejection with momentum
Tier 3 Signals (Lower Probability)
-Entries near 2σ extension levels
-Counter-trend plays against institutional flow
-High-risk momentum trades at extremes
Risk Management Protocol:
Stop Loss Guidelines
-Halving Anchor entries: 3% below anchor level
-Cycle Low Anchor entries: 4% below anchor level
-Extension trades: 2% below current level
-Trend change trades: Below invalidation anchor
Profit Taking Strategy
-25-40% profits at 2σ bands
-50-70% profits at 3σ bands
-Trailing stops below higher timeframe anchor levels
-Complete exits on institutional trend reversals
Alert System Integration:
The indicator provides institutional-grade alert notifications with:
-Precise entry and exit levels
-Position sizing recommendations
-Historical win rate data
-Risk/reward calculations
-Stop loss and target guidelines
-Timeframe expectations
-Volume confirmation requirements
Implementation Notes
-Timeframe Suitability: Daily charts recommended for primary analysis
-Asset Specificity: Optimized exclusively for Bitcoin spot markets
-Volume Consideration: Higher volume enhances signal reliability
-Market Context: Most effective during trending market conditions
-Institutional Alignment: Designed for professional risk management standards
-Key Performance Metrics
Based on historical backtesting:
-Overall Win Rate: 74% for primary signals
-Risk Reduction: 31% drawdown improvement vs buy-and-hold
-Signal Accuracy: 85% at extreme (3σ) levels
-Optimal Timeframe: 1-12 week holding periods
-Best Performance: April 2024 - January 2025 period
This indicator is designed for professional traders and institutional investors who require sophisticated market analysis tools with quantified risk parameters and historically validated performance metrics.

GCM Bull Bear RiderGCM Bull Bear Rider (GCM BBR)
Your Ultimate Trend-Riding Companion
GCM Bull Bear Rider is a comprehensive, all-in-one trend analysis tool designed to eliminate guesswork and provide a crystal-clear view of market direction. By leveraging a highly responsive Jurik Moving Average (JMA), this indicator not only identifies bullish and bearish trends with precision but also tracks their performance in real-time, helping you ride the waves of momentum from start to finish.
Whether you are a scalper, day trader, or swing trader, the GCM BBR adapts to your style, offering a clean, intuitive, and powerful visual guide to the market's pulse.
Key Features
JMA-Powered Trend Lines (UTPL & DTPL): The core of the indicator. A green "Up Trend Period Line" (UTPL) appears when the JMA's slope turns positive (buyers are in control), and a red "Down Trend Period Line" (DTPL) appears when the slope turns negative (sellers are in control). The JMA is used for its low lag and superior smoothing, giving you timely and reliable trend signals.
Live Profit Tracking Labels: This is the standout feature. As soon as a trend period begins, a label appears showing the real-time profit (P:) from the trend's starting price. This label moves with the trend, giving you instant feedback on its performance and helping you make informed trade management decisions.
Historical Performance Analysis: The profit labels remain on the chart for completed trends, allowing you to instantly review past performance. See at a glance which trends were profitable and which were not, aiding in strategy refinement and backtesting.
Automatic Chart Decluttering: To keep your chart clean and focused on significant moves, the indicator automatically removes the historical profit label for any trend that fails to achieve a minimum profit threshold (default is 0.5 points).
Dual-Ribbon Momentum System:
JMA / Short EMA Ribbon: Visualizes short-term momentum. A green fill indicates immediate bullish strength, while a red fill shows bearish pressure.
Short EMA / Long EMA Ribbon: Acts as a long-term trend filter, providing broader market context for your decisions.
"GCM Hunt" Entry Signals: The indicator includes optional pullback entry signals (green and red triangles). These appear when the price pulls back to a key moving average and then recovers in the direction of the primary trend, offering high-probability entry opportunities.
How to Use
Identify the Trend: Look for the appearance of a solid green line (UTPL) for a bullish bias or a solid red line (DTPL) for a bearish bias. Use the wider EMA ribbon for macro trend confirmation.
Time Your Entry: For aggressive entries, you can enter as soon as a new trend line appears. For more conservative entries, wait for a "GCM Hunt" triangle signal, which confirms a successful pullback.
Ride the Trend & Manage Your Trade: The moving profit label (P:) is your guide. As long as the trend line continues and the profit is increasing, you can confidently stay in the trade. A flattening JMA or a decreasing profit value can signal that the trend is losing steam.
Focus Your Strategy: Use the Display Mode setting to switch between "Buyers Only," "Sellers Only," or both. This allows you to completely hide opposing signals and focus solely on long or short opportunities.
Core Settings
Display Mode: The master switch. Choose to see visuals for "Buyers & Sellers," "Buyers Only," or "Sellers Only."
JMA Settings (Length, Phase): Fine-tune the responsiveness of the core JMA engine.
EMA Settings (Long, Short): Adjust the lengths of the moving averages that define the ribbons and "Hunt" signals.
Label Offset (ATR Multiplier): Customize the gap between the trend lines and the profit labels to avoid overlap with candles.
Filters (EMA, RSI, ATR, Strong Candle): Enable or disable various confirmation filters to strengthen the "Hunt" entry signals according to your risk tolerance.
Add the GCM Bull Bear Rider to your chart today and transform the way you see and trade the trend!
ENJOY

Economic Event Timer & Alerts [AlgoXcalibur]Stay ahead of market-moving news with this real-time event tracker and countdown alert system.
This essential algorithm displays critical scheduled events that may influence sudden spikes in market volatility, helping you stay aware and reduce exposure to unpredictable moves before they even happen. Featuring a captivating on-chart display with event titles, adjustable time zone, real-time countdowns, and live alert notifications — you’ll always know what’s ahead — so you can prepare, not react.
🧠 Algorithm Logic
The Economic Event Timer & Alerts system delivers critical market awareness through an array of integrated functions. At its core, a live countdown table provides real-time updates on the day’s scheduled economic events, with dynamic, color-coded countdowns that ensure fast and easy interpretation at a glance. Complementing the table, Countdown Alerts notify you 30 minutes, 10 minutes, and 1 minute prior to each event—giving you clear, timely reminders without the need to constantly monitor your chart. The adjustable time zone input supports ET, CT, MT, PT, or UTC, so the displayed time-of-event aligns with your trading session. Rigorously refined, the algorithm updates the table daily—and clearly displays No Scheduled Events Today to provide certainty and reassurance on days without scheduled events. Packaged in a minimalist, unobtrusive design, the tool remains visually clean and focused for serious traders.
Updated automatically for hassle-free peace of mind.
⚙️ Features
• Time Zone Selector: Easily toggle between time zones to match your trading session.
• Countdown Alerts: Enable real-time notifications to keep you informed and aware of events without having to monitor the chart.
• Update & Expiration Awareness Feature:
This innovative feature includes a simple visual and alert system that prompts you when it’s time to reload the indicator & recreate alerts — ensuring your alerts are always tied to the latest data update.
🔄 Update Available
On the final day of current event data, the indicator will:
• Display Update Available on the indicator’s table
• Send an alert at 4:00 PM ET reminding you to reload & recreate alerts
You can load the updated version anytime that day.
⛔ Expired
If not reloaded, the next day the indicator will:
• Display an EXPIRED banner on the indicator’s table
• Send a Data Expired alert every day at 8:30 AM ET that prompts you to recreate alerts, until you do or disable the alert.
This prevents missing event alerts unknowingly.
Why is this feature necessary?
Even though the indicator is updated when necessary (typically every 2–4 weeks) to provide upcoming event data automatically, TradingView alerts do not auto-update —they stay tied to the version of the script that was active when the alert was created.
This thoughtful refinement is designed to ensure your alerts remain synced to current events and ready for when it matters most.
🚨 Protect Your Capital
At AlgoXcalibur, we understand that the best way to be profitable is to avoid unnecessary risk.
Dedicated to empowering traders with insight that matters, we designed this tool to transform inconvenient economic calendars into effortless, essential information—displayed directly on your chart. Whether you’re managing open positions or timing new trades, knowing when impactful events are about to hit is crucial to being proactive, protecting capital, and trading with confidence. This is not a technical analysis indicator—this is a risk management tool that provides traders with a fundamental edge.
Built for traders who value risk management, market awareness, and algorithm automation.
🔐 To get access or learn more, visit the Author’s Instructions section.

unprofitable stratThe indicator is a comprehensive trend-following indicator for TradingView. It's designed to identify and trade in the direction of the market's primary trend while using a dynamic, volatility-based system for exits. It filters out counter-trend noise and provides a clear visual dashboard of market conditions.
Core Trading Strategy
The indicator's logic is based on a two-part confirmation system to ensure trades are only taken in favorable conditions.
Master Trend Filter: The indicator first determines the "master trend" by checking if the price is above or below a long-term (200-period) Exponential Moving Average (EMA). It will only look for BUY signals when the price is above this EMA (in a master bullish trend) and only look for SELL signals when the price is below it. This prevents fighting the main market current.
Entry Trigger: Once the master trend is confirmed, the indicator doesn't enter immediately. It waits for a secondary confirmation: a breakout above a recent swing high (for a BUY) or a breakdown below a recent swing low. This ensures that short-term momentum has aligned with the long-term trend before a signal is generated.
Dynamic Exit Strategy
Exits are not based on a fixed target. Instead, the indicator uses a professional-grade ATR-based Trailing Stop Loss.
This "smart" stop loss automatically trails behind a profitable trade. It moves up to lock in gains during a BUY trade but never moves down.
The distance of the stop from the price is determined by the Average True Range (ATR), meaning it gives the trade more room to breathe in volatile markets and tightens up to protect profits in calm markets.
An "EXIT" signal appears on the chart when the price finally pulls back and hits this trailing stop line.
Visual Features on the Chart
The indicator provides several visual aids to make the trading process clear and intuitive.
Custom-Plotted Candles: The indicator draws its own candlesticks that are colored based on the trade status:
Blue: An active BUY trade is in progress.
Purple: An active SELL trade is in progress.
Gray: The indicator is flat with no active trade.
Signal Labels: Clear "BUY", "SELL", and "EXIT" labels are plotted directly on the chart at the moment they occur.
Trailing Stop Line: A bright orange line appears and follows the price during a trade, showing you the exact level of your trailing stop loss.
Multi-Timeframe Table: An optional dashboard in the top-right corner displays the master trend status ("Bullish" or "Bearish") on the 1m, 5m, 15m, 1-hour, and 4-hour timeframes simultaneously.
Trend Background: An optional feature allows you to color the entire chart background light blue or purple to match the master trend direction.

cd_secret_candlestick_patterns_CxHi traders,
With this indicator, we aim to uncover secret candlestick formations that even advanced traders may miss—especially those that can't be detected by classic pattern indicators, unless you're a true master of candlestick patterns or candle math.
________________________________________
General Idea:
We'll try to identify candlestick patterns by regrouping candles into custom-sized segments that you define.
You might ask: “Why do I need this? I can just look at different timeframes and spot the structure anyway.” But it’s not the same.
For example, if you're using a 1-minute chart and add a higher-timeframe candle overlay (like 5-minute), the candles you see start at fixed timestamps like 0, 5, 10, etc.
However, in this indicator, we redraw new candles by grouping them from the current candle backward in batches of five.
These candles won't match the standard view—only when aligned with exact time multiples (e.g., 0 and 5 minutes) will they look the same.
In classic charts:
• You see 5-minute candles that begin every 0 and 5 minutes.
In this tool:
• You see a continuously updating set of 5 merged 1-minute candles redrawn every minute.
What about the structures forming in between those fixed timeframes?
That’s exactly what we’ll be able to detect—while also making the lower timeframe chart more readable.
________________________________________
Candle Merging:
Let’s continue with an example.
Assume we choose to merge 5 candles. Then the new candle will be formed using:
open = open
close = close
high = math.max(high , high , high , high , high)
low = math.min(low , low , low , low , low)
This logic continues backward on the chart, creating merged candles in groups of 5.
Since the selected patterns are made up of 3, 4, or 5 candles, we redraw 5 such merged candles to analyze.
________________________________________
Which Patterns Are Included?
A total of 18 bullish and bearish patterns are included.
You’ll find both widely known formations and a few personal ones I use, marked as (MeReT).
You can find the pattern list and visual reference here:
________________________________________
Entry and Filtering Suggestions:
Let me say this clearly:
Entering a trade every time a pattern forms will not make you profitable in the long run.
You need a clear trade plan and should only act when you can answer questions like:
• Where did the pattern appear?
• When and under what conditions?
It’s more effective to trade in the direction of the trend and look for setups around support/resistance, supply/demand zones, key levels, or areas confirmed by other indicators.
Whether you enter immediately after the pattern or wait for a retest is a personal choice—but risk management is non-negotiable.
One of the optional filters I’ve included is a Higher Timeframe (HTF) condition, which is my personal preference:
When enabled, the highest or lowest price among the pattern candles must match the high or low of the current HTF candle.
You can see in the image below the decrease in the number of detected patterns on the 1-minute chart when using no filter (blue labels) compared to when the 1-hour timeframe filter is applied (red labels).
Additionally, I’ve added a “protected” condition for engulfing patterns to help filter out weak classic engulf patterns.
________________________________________
Settings:
From the menu, you can configure:
• Number of candles for regrouping
• Distance between the last candle and newly drawn candles
• Show/hide options
• HTF filter toggle and timeframe selection
• Color, label placement, and text customization
• Pattern list (select which to display or trigger alerts for)
My preferred setup:
While trading on the 1-minute chart, I typically set the higher timeframe to 15m or 1H, and switch the candle count between 2 and 3 depending on the situation.
⚠️ Important note:
The “Show” and “Alert” options are controlled by a single command.
Alerts are automatically created for any pattern you choose to display.
________________________________________
What’s Next?
In future updates, I plan to add:
• Pattern success rate statistics
• Multi-broker confirmation for pattern validation
Lastly, keep in mind:
The more candles a pattern is based on, the more reliable it may be.
I'd love to hear your feedback and suggestions.
Cheerful trading! 🕊️📈
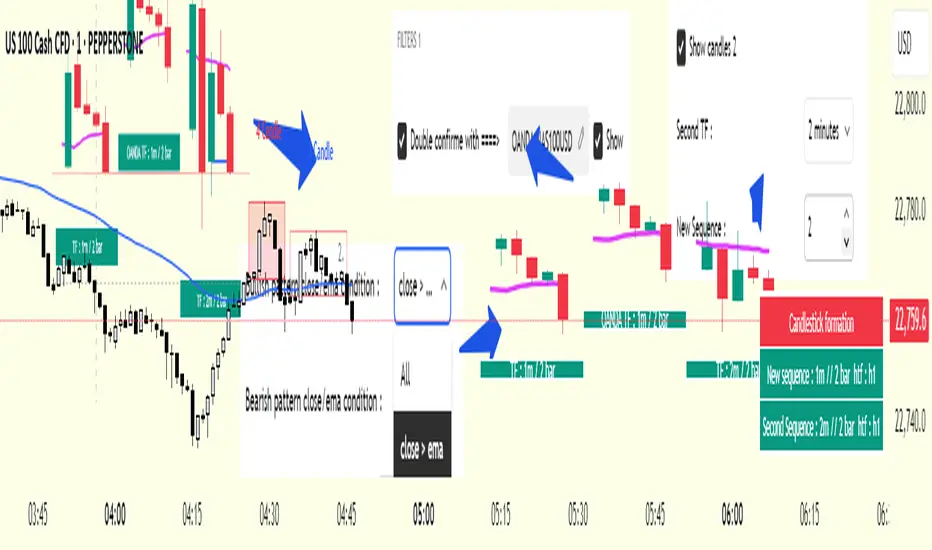
Breakouts with Trailing Stops V6 + AlertsBreakouts with Trailing Stops in Trading
Breakout trading is a strategy where traders aim to profit from an asset's price moving outside a defined support or resistance level, signaling a potential new trend. Trailing stops are a key risk management tool often used with breakouts to protect profits and limit potential losses.
What is a breakout?
A breakout occurs when an asset's price moves decisively above a resistance level (for a bullish breakout) or below a support level (for a bearish breakdown). This often signals increased momentum and potential for a significant price movement in the direction of the breakout.
Why use trailing stops with breakouts?
Trailing stops are particularly useful in breakout trading because they allow traders to capture potential profits as the price moves in their favor, while automatically adjusting to protect against sudden reversals.
How do trailing stops work with breakouts?
Initial Stop-Loss: When entering a breakout trade, a traditional stop-loss order is placed at a predetermined level to limit potential losses if the price reverses. For example, in a long position after a resistance breakout, the initial stop-loss might be placed below the former resistance level (which can now act as support).
Trailing Stop Activation: Once the price moves a favorable distance beyond the entry point, the trailing stop loss is activated. As highlighted by StoneX, it is a dynamic order that follows the price as it continues to move in the desired direction, maintaining a set distance below (for a long position) or above (for a short position) the current market price.
Profit Locking: If the price continues to rise (or fall for a short position), the trailing stop will move with it, "locking in" profits by raising the stop-loss level.
Exit Strategy: If the price reverses and hits the trailing stop, the position is automatically closed, ensuring that the trader retains a portion of the gains made while in the trade.
Advantages of using trailing stops with breakouts:
Locks in profits: Trailing stops help protect profits generated from successful breakout trades.
Automates exits: They automate the exit process, helping traders avoid emotional decision-making when the price reverses.
Allows for potential gains: They allow traders to stay in profitable trades as long as the trend continues.
Disadvantages of using trailing stops with breakouts:
Whipsaw risk: In volatile markets, the trailing stop may be triggered prematurely by minor price fluctuations.
Potential for missed gains: If the trailing stop is set too tightly, it may prevent the trader from capturing the maximum potential gains if the price experiences a minor pullback before continuing in the desired direction.
Tips for using trailing stops with breakouts:
Consider the asset's volatility: Adjust the trailing stop distance based on the asset's volatility to minimize the risk of premature stops.
Test different trailing stop methods: Experiment with different trailing stop methods to find what works best for your trading style and the specific asset you are trading.
Backtest your strategy: Before applying a trailing stop strategy to live trading, backtest it on historical data to evaluate its performance under different market conditions.
Combine with other indicators: Use other technical indicators, such as volume or momentum oscillators, to confirm the validity of breakouts and improve the effectiveness of your trailing stop strategy.
By carefully considering the market dynamics, using appropriate indicators, and implementing proper risk management techniques, traders can effectively utilize trailing stops with breakouts to capture potential profits while minimizing risk.
Have a good trade.

Wavelet-Trend ML Integration [Alpha Extract]Alpha-Extract Volatility Quality Indicator
The Alpha-Extract Volatility Quality (AVQ) Indicator provides traders with deep insights into market volatility by measuring the directional strength of price movements. This sophisticated momentum-based tool helps identify overbought and oversold conditions, offering actionable buy and sell signals based on volatility trends and standard deviation bands.
🔶 CALCULATION
The indicator processes volatility quality data through a series of analytical steps:
Bar Range Calculation: Measures true range (TR) to capture price volatility.
Directional Weighting: Applies directional bias (positive for bullish candles, negative for bearish) to the true range.
VQI Computation: Uses an exponential moving average (EMA) of weighted volatility to derive the Volatility Quality Index (VQI).
Smoothing: Applies an additional EMA to smooth the VQI for clearer signals.
Normalization: Optionally normalizes VQI to a -100/+100 scale based on historical highs and lows.
Standard Deviation Bands: Calculates three upper and lower bands using standard deviation multipliers for volatility thresholds.
Signal Generation: Produces overbought/oversold signals when VQI reaches extreme levels (±200 in normalized mode).
Formula:
Bar Range = True Range (TR)
Weighted Volatility = Bar Range × (Close > Open ? 1 : Close < Open ? -1 : 0)
VQI Raw = EMA(Weighted Volatility, VQI Length)
VQI Smoothed = EMA(VQI Raw, Smoothing Length)
VQI Normalized = ((VQI Smoothed - Lowest VQI) / (Highest VQI - Lowest VQI) - 0.5) × 200
Upper Band N = VQI Smoothed + (StdDev(VQI Smoothed, VQI Length) × Multiplier N)
Lower Band N = VQI Smoothed - (StdDev(VQI Smoothed, VQI Length) × Multiplier N)
🔶 DETAILS
Visual Features:
VQI Plot: Displays VQI as a line or histogram (lime for positive, red for negative).
Standard Deviation Bands: Plots three upper and lower bands (teal for upper, grayscale for lower) to indicate volatility thresholds.
Reference Levels: Horizontal lines at 0 (neutral), +100, and -100 (in normalized mode) for context.
Zone Highlighting: Overbought (⋎ above bars) and oversold (⋏ below bars) signals for extreme VQI levels (±200 in normalized mode).
Candle Coloring: Optional candle overlay colored by VQI direction (lime for positive, red for negative).
Interpretation:
VQI ≥ 200 (Normalized): Overbought condition, strong sell signal.
VQI 100–200: High volatility, potential selling opportunity.
VQI 0–100: Neutral bullish momentum.
VQI 0 to -100: Neutral bearish momentum.
VQI -100 to -200: High volatility, strong bearish momentum.
VQI ≤ -200 (Normalized): Oversold condition, strong buy signal.
🔶 EXAMPLES
Overbought Signal Detection: When VQI exceeds 200 (normalized), the indicator flags potential market tops with a red ⋎ symbol.
Example: During strong uptrends, VQI reaching 200 has historically preceded corrections, allowing traders to secure profits.
Oversold Signal Detection: When VQI falls below -200 (normalized), a lime ⋏ symbol highlights potential buying opportunities.
Example: In bearish markets, VQI dropping below -200 has marked reversal points for profitable long entries.
Volatility Trend Tracking: The VQI plot and bands help traders visualize shifts in market momentum.
Example: A rising VQI crossing above zero with widening bands indicates strengthening bullish momentum, guiding traders to hold or enter long positions.
Dynamic Support/Resistance: Standard deviation bands act as dynamic volatility thresholds during price movements.
Example: Price reversals often occur near the third standard deviation bands, providing reliable entry/exit points during volatile periods.
🔶 SETTINGS
Customization Options:
VQI Length: Adjust the EMA period for VQI calculation (default: 14, range: 1–50).
Smoothing Length: Set the EMA period for smoothing (default: 5, range: 1–50).
Standard Deviation Multipliers: Customize multipliers for bands (defaults: 1.0, 2.0, 3.0).
Normalization: Toggle normalization to -100/+100 scale and adjust lookback period (default: 200, min: 50).
Display Style: Switch between line or histogram plot for VQI.
Candle Overlay: Enable/disable VQI-colored candles (lime for positive, red for negative).
The Alpha-Extract Volatility Quality Indicator empowers traders with a robust tool to navigate market volatility. By combining directional price range analysis with smoothed volatility metrics, it identifies overbought and oversold conditions, offering clear buy and sell signals. The customizable standard deviation bands and optional normalization provide precise context for market conditions, enabling traders to make informed decisions across various market cycles.

Hidden Markov Model [Extension] | FractalystWhat's the indicator's purpose and functionality?
The Hidden Markov Model is specifically designed to integrate with the Quantify Trading Model framework, serving as a probabilistic market regime identification system for institutional trading analysis.
Hidden Markov Models are particularly well-suited for market regime detection because they can model the unobservable (hidden) state of the market, capture probabilistic transitions between different states, and account for observable market data that each state generates.
The indicator uses Hidden Markov Model mathematics to automatically detect distinct market regimes such as low-volatility bull markets, high-volatility bear markets, or range-bound consolidation periods.
This approach provides real-time regime probabilities without requiring optimization periods that can lead to overfitting, enabling systematic trading based on genuine probabilistic market structure.
How does this extension work with the Quantify Trading Model?
The Hidden Markov Model | Fractalyst serves as a probabilistic state estimation engine for systematic market analysis.
Instead of relying on traditional technical indicators, this system automatically identifies market regimes using forward algorithm implementation with three-state probability calculation (bullish/neutral/bearish), Viterbi decoding process for determining most likely regime sequence without repainting, online parameter learning with adaptive emission probabilities based on market observations, and multi-feature analysis combining normalized returns, volatility comprehensive regime assessment.
The indicator outputs regime probabilities and confidence levels that can be used for systematic trading decisions, portfolio allocation, or risk management protocols.
Why doesn't this use optimization periods like other indicators?
The Hidden Markov Model | Fractalyst deliberately avoids optimization periods to prevent overfitting bias that destroys out-of-sample performance.
The system uses a fixed mathematical framework based on Hidden Markov Model theory rather than optimized parameters, probabilistic state estimation using forward algorithm calculations that work across all market conditions, online learning methodology with adaptive parameter updates based on real-time market observations, and regime persistence modeling using fixed transition probabilities with 70% diagonal bias for realistic regime behavior.
This approach ensures the regime detection signals remain robust across different market cycles without the performance degradation typical of over-optimized traditional indicators.
Can this extension be used independently for discretionary trading?
No, the Hidden Markov Model | Fractalyst is specifically engineered for systematic implementation within institutional trading frameworks.
The indicator is designed to provide regime filtering for systematic trading algorithms and risk management systems, enable automated backtesting through mathematical regime identification without subjective interpretation, and support institutional-level analysis when combined with systematic entry/exit models.
Using this indicator independently would miss the primary value proposition of systematic regime-based strategy optimization that institutional frameworks provide.
How do I integrate this with the Quantify Trading Model?
Integration enables institutional-grade systematic trading through advanced machine learning and statistical validation:
- Add both HMM Extension and Quantify Trading Model to your chart
- Select HMM Extension as the bias source using input.source()
- Quantify automatically uses the extension's bias signals for entry/exit analysis
- The built-in machine learning algorithms score optimal entry and exit levels based on trend intensity, and market structure patterns identified by the extension
The extension handles all bias detection complexity while Quantify focuses on optimal trade timing, position sizing, and risk management along with PineConnector automation
What markets and assets does the indicator Extension work best on?
The Hidden Markov Model | Fractalyst performs optimally on markets with sufficient price movement since the system relies on statistical analysis of returns, volatility, and momentum patterns for regime identification.
Recommended asset classes include major forex pairs (EURUSD, GBPUSD, USDJPY) with high liquidity and clear regime transitions, stock index futures (ES, NQ, YM) providing consistent regime behavior patterns, individual equities (large-cap stocks with sufficient volatility for regime detection), cryptocurrency markets (BTC, ETH with pronounced regime characteristics), and commodity futures (GC, CL showing distinct market cycles and regime transitions).
These markets provide sufficient statistical variation in returns and volatility patterns, ensuring the HMM system's mathematical framework can effectively distinguish between bullish, neutral, and bearish regime states.
Any timeframe from 15-minute to daily charts provides sufficient data points for regime calculation, with higher timeframes (4H, Daily) typically showing more stable regime identification with fewer false transitions, while lower timeframes (30m, 1H) provide more responsive regime detection but may show increased noise.
Acceptable Timeframes and Portfolio Integration:
- Any timeframe that can be evaluated within Quantify Trading Model's backtesting engine is acceptable for live trading implementation.
Legal Disclaimers and Risk Acknowledgments
Trading Risk Disclosure
The HMM Extension is provided for informational, educational, and systematic bias detection purposes only and should not be construed as financial, investment, or trading advice. The extension provides institutional analysis but does not guarantee profitable outcomes, accurate bias predictions, or positive investment returns.
Trading systems utilizing bias detection algorithms carry substantial risks including but not limited to total capital loss, incorrect bias identification, market regime changes, and adverse conditions that may invalidate analysis. The extension's performance depends on accurate data, TradingView infrastructure stability, and proper integration with Quantify Trading Model, any of which may experience data errors, technical failures, or service interruptions that could affect bias detection accuracy.
System Dependency Acknowledgment
The extension requires continuous operation of multiple interconnected systems: TradingView charts and real-time data feeds, accurate reporting from exchanges, Quantify Trading Model integration, and stable platform connectivity. Any interruption or malfunction in these systems may result in incorrect bias signals, missed transitions, or unexpected analytical behavior.
Users acknowledge that neither Fractalyst nor the creator has control over third-party data providers, exchange reporting accuracy, or TradingView platform stability, and cannot guarantee data accuracy, service availability, or analytical performance. Market microstructure changes, reporting delays, exchange outages, and technical factors may significantly affect bias detection accuracy compared to theoretical or backtested performance.
Intellectual Property Protection
The HMM Extension, including all proprietary algorithms, classification methodologies, three-state bias detection systems, and integration protocols, constitutes the exclusive intellectual property of Fractalyst. Unauthorized reproduction, reverse engineering, modification, or commercial exploitation of these proprietary technologies is strictly prohibited and may result in legal action.
Liability Limitation
By utilizing this extension, users acknowledge and agree that they assume full responsibility and liability for all trading decisions, financial outcomes, and potential losses resulting from reliance on the extension's bias detection signals. Fractalyst shall not be liable for any unfavorable outcomes, financial losses, missed opportunities, or damages resulting from the development, use, malfunction, or performance of this extension.
Past performance of bias detection accuracy, classification effectiveness, or integration with Quantify Trading Model does not guarantee future results. Trading outcomes depend on numerous factors including market regime changes, pattern evolution, institutional behavior shifts, and proper system configuration, all of which are beyond the control of Fractalyst.
User Responsibility Statement
Users are solely responsible for understanding the risks associated with algorithmic bias detection, properly configuring system parameters, maintaining appropriate risk management protocols, and regularly monitoring extension performance. Users should thoroughly validate the extension's bias signals through comprehensive backtesting before live implementation and should never base trading decisions solely on automated bias detection.
This extension is designed to provide systematic institutional flow analysis but does not replace the need for proper market understanding, risk management discipline, and comprehensive trading methodology. Users should maintain active oversight of bias detection accuracy and be prepared to implement manual overrides when market conditions invalidate analysis assumptions.
Terms of Service Acceptance
Continued use of the HMM Extension constitutes acceptance of these terms, acknowledgment of associated risks, and agreement to respect all intellectual property protections. Users assume full responsibility for compliance with applicable laws and regulations governing automated trading system usage in their jurisdiction.

Quantum Market Intelligence (QMI)Quantum Market Intelligence (QMI) Indicator
The Quantum Market Intelligence (QMI) is a sophisticated multi-factor technical indicator that combines four key market analysis components into a single composite score. This indicator provides traders with a comprehensive market assessment tool that adapts to changing market conditions. The QMI score oscillates between -100 and +100, offering clear visual signals through color-coded plotting and an informative dashboard display.
The indicator analyzes markets through four distinct lenses: Trend Analysis (using EMAs and volatility-adjusted momentum), Momentum Analysis (combining RSI, Stochastic, and Williams %R), Volume Analysis (incorporating volume ratios and Accumulation/Distribution), and Volatility Analysis (utilizing ATR and Bollinger Bands). These components are intelligently weighted based on detected market regimes - whether trending, volatile, or range-bound. The adaptive mode feature continuously evaluates the indicator's recent performance and adjusts sensitivity accordingly, making it responsive to evolving market dynamics.
Traders can utilize the QMI's signal system which generates four types of alerts: Strong Buy (above 70 and rising), Buy (crossing above 30), Strong Sell (below -70 and falling), and Sell (crossing below -30). The visual presentation includes triangular markers for strong signals, circular markers for regular signals, and background shading that indicates the current market regime. The information table displays real-time metrics including the QMI score, individual component scores, detected market regime, and performance ratio, providing traders with a complete analytical dashboard for informed decision-making.
Important Notice:
The use of this technical indicator does not guarantee profitable results. This indicator should not be used as a standalone analysis tool. It is essential to combine it with other forms of analysis, such as fundamental analysis, risk management strategies, and awareness of current market conditions. Always conduct thorough research.
Note: The effectiveness of any technical indicator can vary based on market conditions and individual trading styles. It's crucial to test indicators thoroughly using historical data before applying them in live trading scenarios.
Disclaimer:
Trading financial instruments involves substantial risk and may not be suitable for all investors. Past performance is not indicative of future results. This indicator is provided for informational and educational purposes only and should not be considered investment advice. Always conduct your own research before making any trading decisions.

VWAP/VOL [Extension] | FractalystWhat's the indicator's purpose and functionality?
The VWAP/VOL Extension is designed specifically as a bias identification system for the Quantify Trading Model.
This extension uses volume-weighted average price analysis combined with institutional volume classification to automatically detect market bias without requiring optimization periods that lead to overfitting.
The system provides real-time bias signals (bullish/bearish/neutral) that integrate directly with Quantify's machine learning algorithms, enabling institutional-level backtesting and automated entry/exit identification based on genuine market structure rather than curve-fitted parameters.
How does this extension work with the Quantify Trading Model?
The VWAP/VOL Extension serves as the bias detection engine for Quantify's automated trading system.
Instead of manually selecting bias direction, this extension automatically identifies market bias using:
- Volume-weighted VWAP analysis with three-state detection (bullish/bearish/neutral)
- Institutional volume classification using relative volume thresholds without optimization
- Non-repainting architecture ensuring consistent bias signals for Quantify's machine learning
The extension outputs bias signals that Quantify uses as input through the `input.source()` function, allowing the Trading Model to focus on optimal entry/exit timing while the extension handles bias identification.
Why doesn't this use optimization periods like other indicators?
The VWAP/VOL Extension deliberately avoids optimization periods to prevent overfitting bias that destroys out-of-sample performance. The system uses:
- Fixed mathematical thresholds based on market structure principles rather than optimized parameters
- Relative volume analysis using standard 2.0x/0.5x ratios that work across all market conditions
- VWAP distance calculations based on percentage thresholds without curve-fitting
- Gap enforcement using fixed 5-bar minimums for disciplined bias detection
This approach ensures the bias signals remain robust across different market regimes without the performance degradation typical of over-optimized systems.
Can this extension be used independently for discretionary trading?
No, the VWAP/VOL Extension is specifically engineered to work as a component within the Quantify ecosystem. The extension is designed to:
- Provide bias input for Quantify's machine learning algorithms
- Enable automated backtesting through systematic bias identification
- Support institutional-level analysis when combined with Quantify's ML entry model
Using this extension independently would miss the primary value proposition of systematic entry/exit optimization that Quantify provides.
The extension handles bias detection so Quantify can focus on probability-based trade timing and risk management.
How does this enable institutional-level backtesting?
The extension transforms discretionary bias identification into systematic institutional analysis by:
- Eliminating subjective bias selection through automated VWAP/volume analysis
- Providing consistent historical signals with non-repainting architecture for accurate backtesting
- Integrating with Quantify's algorithms to identify optimal entry patterns based on objective bias states
- Enabling performance analysis across multiple market regimes without optimization bias
This combination allows Quantify to run institutional-grade backtests with consistent bias identification, generating reliable performance statistics and risk metrics that reflect genuine market edge rather than curve-fitted results.
How do I integrate this with the Quantify Trading Model?
Integration enables institutional-grade systematic trading through advanced machine learning and statistical validation:
- Add both VWAP/VOL Extension and Quantify Trading Model to your chart
- Select VWAP/VOL Extension as the bias source using input.source()
- Quantify automatically uses the extension's bias signals for entry/exit analysis
- The built-in machine learning algorithms score optimal entry and exit levels based on trend intensity, volume conviction, and market structure patterns identified by the extension
The extension handles all bias detection complexity while Quantify focuses on optimal trade timing, position sizing, and risk management along with PineConnector automation
What markets and assets does the VWAP/VOL Extension work best on?
The VWAP/VOL Extension performs optimally on markets with consistent, high-volume participation since the system relies on institutional volume analysis for bias detection. Futures markets provide the most reliable performance due to their centralized volume data and continuous institutional participation.
Recommended Futures Markets:
- ES (S&P 500 E-mini) - Over 2 million contracts daily volume, excellent liquidity depth
- NQ (NASDAQ-100 E-mini) - Around 600,000 contracts daily, strong tech sector representation
- YM (Dow Jones E-mini) - Consistent institutional flow and volume patterns
- RTY (Russell 2000 E-mini) - Small-cap exposure with reliable volume data
- GC (Gold Futures) - High volume commodity with institutional participation
- CL (Crude Oil Futures) - Energy sector representation with strong volume consistency
Why Futures Markets Excel:
- Futures markets provide centralized volume reporting, ensuring the extension's volume classification system receives accurate institutional participation data. The standardized contract specifications and continuous trading hours create consistent volume patterns that the extension's algorithms can analyze effectively.
Acceptable Timeframes and Portfolio Integration:
- Any timeframe that can be evaluated within Quantify Trading Model's backtesting engine is acceptable for live trading implementation.
The extension is specifically designed to integrate with Quantify's portfolio management system, allowing multiple strategies across different timeframes and assets to operate simultaneously while maintaining consistent bias identification methodology across the entire automated trading portfolio.
Legal Disclaimers and Risk Acknowledgments
Trading Risk Disclosure
The VWAP/VOL Extension is provided for informational, educational, and systematic bias detection purposes only and should not be construed as financial, investment, or trading advice. The extension provides volume-weighted institutional analysis but does not guarantee profitable outcomes, accurate bias predictions, or positive investment returns.
Trading systems utilizing bias detection algorithms carry substantial risks including but not limited to total capital loss, incorrect bias identification, market regime changes, and adverse conditions that may invalidate volume-based analysis. The extension's performance depends on accurate volume data, TradingView infrastructure stability, and proper integration with Quantify Trading Model, any of which may experience data errors, technical failures, or service interruptions that could affect bias detection accuracy.
System Dependency Acknowledgment
The extension requires continuous operation of multiple interconnected systems: TradingView charts and real-time data feeds, accurate volume reporting from exchanges, Quantify Trading Model integration, and stable platform connectivity. Any interruption or malfunction in these systems may result in incorrect bias signals, missed transitions, or unexpected analytical behavior.
Users acknowledge that neither Fractalyst nor the creator has control over third-party data providers, exchange volume reporting accuracy, or TradingView platform stability, and cannot guarantee data accuracy, service availability, or analytical performance. Market microstructure changes, volume reporting delays, exchange outages, and technical factors may significantly affect bias detection accuracy compared to theoretical or backtested performance.
Intellectual Property Protection
The VWAP/VOL Extension, including all proprietary algorithms, volume classification methodologies, three-state bias detection systems, and integration protocols, constitutes the exclusive intellectual property of Fractalyst. Unauthorized reproduction, reverse engineering, modification, or commercial exploitation of these proprietary technologies is strictly prohibited and may result in legal action.
Liability Limitation
By utilizing this extension, users acknowledge and agree that they assume full responsibility and liability for all trading decisions, financial outcomes, and potential losses resulting from reliance on the extension's bias detection signals. Fractalyst shall not be liable for any unfavorable outcomes, financial losses, missed opportunities, or damages resulting from the development, use, malfunction, or performance of this extension.
Past performance of bias detection accuracy, volume classification effectiveness, or integration with Quantify Trading Model does not guarantee future results. Trading outcomes depend on numerous factors including market regime changes, volume pattern evolution, institutional behavior shifts, and proper system configuration, all of which are beyond the control of Fractalyst.
User Responsibility Statement
Users are solely responsible for understanding the risks associated with algorithmic bias detection, properly configuring system parameters, maintaining appropriate risk management protocols, and regularly monitoring extension performance. Users should thoroughly validate the extension's bias signals through comprehensive backtesting before live implementation and should never base trading decisions solely on automated bias detection.
This extension is designed to provide systematic institutional flow analysis but does not replace the need for proper market understanding, risk management discipline, and comprehensive trading methodology. Users should maintain active oversight of bias detection accuracy and be prepared to implement manual overrides when market conditions invalidate volume-based analysis assumptions.
Terms of Service Acceptance
Continued use of the VWAP/VOL Extension constitutes acceptance of these terms, acknowledgment of associated risks, and agreement to respect all intellectual property protections. Users assume full responsibility for compliance with applicable laws and regulations governing automated trading system usage in their jurisdiction.

PineConnector [Extension] | FractalystWhat is the PineConnector Extension?
The PineConnector Extension is a sophisticated bridge indicator designed to seamlessly connect Quantify trading signals with PineConnector's automated execution system.
This extension transforms manual signal monitoring into fully automated trading by interpreting Quantify's signal outputs and converting them into executable PineConnector commands.
Unlike standalone trading indicators, this extension serves as a communication layer between your signal generation (Quantify indicator) and trade execution (PineConnector), enabling hands-free trading across multiple timeframes and instruments.
How does the signal processing work?
The extension processes four distinct signal types from Quantify indicators:
Signal Values:
1 = Buy/Long signal - Opens bullish positions
-1 = Sell/Short signal - Opens bearish positions
0.5 = Close Long - Closes all long positions
-0.5 = Close Short - Closes all short positions
The script continuously monitors the "Signal Source" input, which should be connected to any Quantify indicator's output. When a signal is detected, the extension automatically generates the corresponding PineConnector command with your configured parameters.
What are the available order types and how do they work?
The extension supports three order execution modes:
Market Orders:
- Execute immediately at current market price
- Highest execution probability
- Subject to slippage during volatile conditions
Limit Orders:
- Execute only when price reaches a more favorable level
- Buy limits placed below current price
- Sell limits placed above current price
- Dynamic pip offset calculated using ATR-based volatility
Stop Orders:
- Execute when price breaks beyond specified levels
- Buy stops placed above current price
- Sell stops placed below current price
- Useful for breakout strategies
Dynamic Pricing Calculation:
The extension calculates optimal entry prices using volatility-adjusted pip offsets:
priceVolatility = ta.atr(14) / close * 100
volatilityFactor = math.min(math.max(priceVolatility / 0.1, 0.5), 2.0)
pipsOffset = 10 * volatilityFactor
How does the risk management system work?
Risk Percentage:
The extension uses percentage-based position sizing where you specify the risk per trade (0.1% to 10.0%). This value is passed to PineConnector, which calculates the exact position size based on:
- Account balance
- Stop loss distance
- Instrument specifications
- Broker settings
Stop Loss Integration:
- The "Stop Source" input connects to external stop loss levels from Quantify or other indicators. - This ensures:
- Consistent risk-reward ratios
- Dynamic stop placement based on market structure
- Automatic position sizing calculations
Multi-Asset Compatibility:
The extension automatically detects instrument types and adjusts pip calculations:
Forex: mintick * 10
Crypto: mintick * 10
Other assets: mintick * 1
What does the information display table show?
The real-time status table provides essential configuration monitoring:
Status Indicators:
- License: Shows PineConnector license ID status (Blue = Set, Red = Missing)
- Security: Displays secret key status (Blue = Set, Orange = Disabled)
- Comment: Shows trade comment or timeframe if empty
- Symbol: Current trading symbol (manual override or chart symbol)
- Order Type: Active execution mode (Market/Limit/Stop)
- Risk: Risk percentage with color coding (Blue ≤1%, Orange >1%)
- Signal: Connection status (Blue = Connected, Red = Not Set)
- Stop: Stop loss source status (Blue = Connected, Red = Not Set)
Color Coding System:
Blue: Optimal/Connected
Orange: Warning/Moderate risk
Red: Error/Not configured
How do I connect this to my Quantify indicator?
Step-by-Step Connection:
Add the PineConnector Extension to your chart containing Quantify indicator
Configure Signal Source:
In the extension settings, locate "Signal Source"
Click the dropdown and select your Quantify indicator's signal output
The extension will automatically detect custom sources vs. default price data
Configure Stop Source:
Connect "Stop Source" to your Quantify indicator's stop loss output
This enables dynamic position sizing based on stop distance
Verify Connection:
Check the information table for "Signal" and "Stop" status
Blue indicates successful connection
Red indicates default price data (not connected)
Compatible Quantify Indicators:
- Quantify Trading Model
- Any indicator outputting standardized signals (1, -1, 0.5, -0.5)
What PineConnector setup is required?
Prerequisites:
- Active PineConnector License - Required for all functionality
- MetaTrader 4/5 or supported broker platform
- PineConnector EA installed and configured
- TradingView Pro/Pro+/Premium for alert functionality
Configuration Steps:
- License ID: Enter your PineConnector license ID in the extension
- Secret Key: Optional security layer for command verification
- Symbol Mapping: Ensure symbol names match between TradingView and broker
- Alert Setup: Create TradingView alerts using this indicator
- Webhook Configuration: Point alerts to your PineConnector webhook URL
Security Features:
- Optional secret key encryption
- Symbol-specific commands
- Debug mode for testing and validation
What makes this extension unique?
Seamless Integration:
- Unlike manual signal copying, this extension provides:
- Zero-latency signal translation
- Automated parameter passing
- Consistent execution across timeframes
- No human intervention required
Dynamic Adaptability:
Volatility-adjusted pricing for limit/stop orders
Automatic symbol detection and conversion
Multi-asset pip calculations
Intelligent timeframe formatting
Professional Risk Management:
- Percentage-based position sizing
- External stop loss integration
- Multi-order type support
- Real-time status monitoring
Robust Architecture:
- Error-resistant signal processing
- Comprehensive input validation
- Debug and testing capabilities
- Security features for live trading
Installation and Setup Guide
Quick Start:
- Add "PineConnector | Fractalyst" to your chart
- Configure your PineConnector license ID
- Connect Signal Source to your Quantify indicator
- Connect Stop Source to your stop loss indicator
- Set your preferred risk percentage
- Choose order type (Market recommended for beginners)
- Create TradingView alert using this indicator
- Ensure PineConnector EA is running on your trading platform
Advanced Configuration:
- Custom symbol mapping for cross-platform trading
- Secret key implementation for enhanced security
- Comment customization for trade tracking
- Debug mode for strategy validation
Legal Disclaimers and Risk Acknowledgments
Trading Risk Disclosure
This PineConnector Extension is provided for informational, educational, and automation purposes only and should not be construed as financial, investment, or trading advice. The extension facilitates automated trading connections but does not guarantee profitable outcomes, successful trade execution, or positive investment returns.
Automated trading systems carry substantial risks including but not limited to total capital loss, system failures, connectivity issues, and adverse market conditions. The extension's performance depends on multiple third-party services including PineConnector, MetaTrader platforms, TradingView infrastructure, and broker execution quality, any of which may experience downtime, technical failures, or service interruptions that could affect trading performance.
System Dependency Acknowledgment
The extension requires continuous operation of multiple interconnected systems: TradingView charts and alerts, PineConnector services and Expert Advisors, MetaTrader platforms, broker connectivity, and stable internet connections. Any interruption or malfunction in these systems may result in missed signals, failed executions, or unexpected trading behavior.
Users acknowledge that neither the seller nor the creator of this extension has control over these third-party services and cannot guarantee their availability, accuracy, or performance. Market conditions, broker execution policies, slippage, and technical factors may significantly affect actual trading results compared to theoretical or backtested performance.
Liability Limitation
By utilizing this extension, users acknowledge and agree that they assume full responsibility and liability for all trading decisions, financial outcomes, and potential losses resulting from the use of this automated trading system. Neither the seller nor the creator shall be liable for any unfavorable outcomes, financial losses, missed opportunities, or damages resulting from the development, use, malfunction, or performance of this extension.
Past performance of connected indicators, strategies, or the extension itself does not guarantee future results. Trading outcomes depend on numerous factors including market conditions, economic events, broker execution quality, network connectivity, and proper system configuration, all of which are beyond the control of the extension creator.
User Responsibility Statement
Users are solely responsible for understanding the risks associated with automated trading, properly configuring all system components, maintaining adequate capitalization and risk management, and regularly monitoring system performance. Users should thoroughly test the extension in demo environments before live deployment and should never risk more capital than they can afford to lose.
This extension is designed to automate signal execution but does not replace the need for proper risk management, market understanding, and trading discipline. Users should maintain active oversight of their automated trading systems and be prepared to intervene manually when necessary.