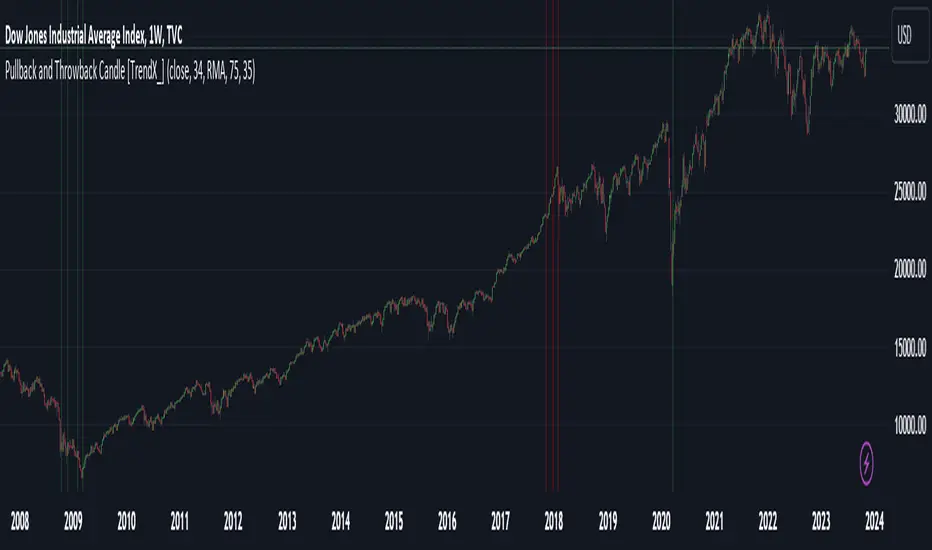
Pullback and Throwback Candle [TrendX_]Pullback and Throwback candles can help traders determine the the potential reversal points
USAGE
The indicator identifies pullback and throwback in overbought and oversold zones by measuring the distance between the price and its relative strength index.
A Pullback is an expected rebound in a downtrend (painted in green area), while a Throwback is a bounceback from an uptrend (painted in red area).
The strategy is useful for valuing reversal points. Accordingly, it can also be helpful for traders to use alongside other Technical Analysis indicators.
DISCLAIMER
This indicator is not financial advice, it can only help traders make better decisions.
There are many factors and uncertainties that can affect the outcome of any endeavor, and no one can guarantee or predict with certainty what will occur.
Therefore, one should always exercise caution and judgment when making decisions based on past performance.
Search in scripts for "pullback"
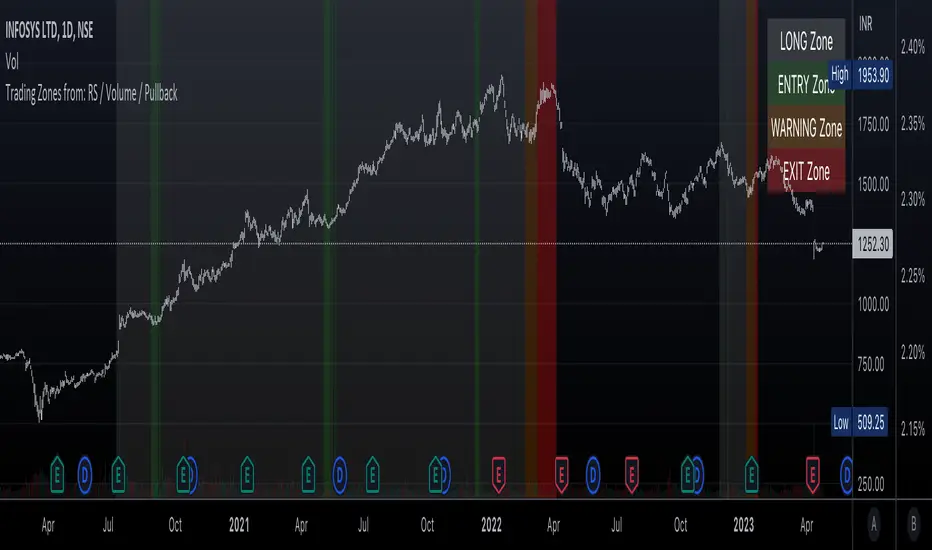
Trading Zones based on RS / Volume / PullbackThis is an Indicator which identifies different Trading Zones on the chart.
This should be Primarily used for Long Trades.
Trading Zones: and the Reasoning behind them
Long Zone -> One can do a Potential Entry (Buy) when this Zone is identified, but one could also wait for 'Entry Zone' (explained next) for a better Risk/Reward Trade.
Long Zones are identified with the help of Relative Strength and by an Intermediate Top in price.
Entry Zone -> This can be a better Risk/Reward zone to enter positions within the Long Zone.
Entry Zone is identified by a Pullback in Price & Volume contraction after the Long Zone is activated
Warning Zone -> One needs to be careful in this zone, no need to panic, Script will now try to find an Exit when Price Retraces towards Highs.
Warning Zone identifies weakness in the Price using Relative Strength of the current Stock (w.r.t. the Reference Symbol configured) and the severity of Pullback in Price.
Exit Zone -> are found only after transitioning to Warning Zone, this is a Zone which helps in minimising losses after a trade has gone into losses. Exit Zone is identified by making sure a local peak forms in Warning Zone. However, there are instances when Exit Zone detection can get prolonged when a local price peak is not formed soon enough. So one needs to be careful and use other strategies for exit.
------------------------------------------------------------------------------------
What is different in this Script:
The Script uses Relative Strength in combination with Pullback in Price from Highs in a Novel way.
Over-trading is avoided by ignoring Sideways price movements, using Relative Strength.
Only Trending Upward movement is detected and traded.
How to use this Indicator:
Use these 'Trading Zones' only as a reference so it can minimise your time in screening stocks.
Preferred Settings for using the Indicator:
Stick to 1-Day candles
Keep Relative Symbol as "Nifty" for Indian Stocks.
For US stocks, we can use "SPX" as the Relative Symbol.
//----------------
FEW EXAMPLES:
//----------------
ASIANPAINT
TATAMOTORS
TITAN
ITC
DIVISLAB
MARUTI
---------------------------------------------
Feedback is welcome.
M0PB (Momentum Pullback)Long/short strategy that identifies extreme readings on the rsi as a *momentum signal*, unlike most RSI strategies the script will look to buy or sell the first pullback in the direction of the extreme RSI reading.
Enters positions on the first pullback to the 5ema(low)/ 5ema(high) and exits at rolling 12 bar high/ low. The rolling high/ low feature means that if the price enters into a prolonged consolidation the profit target will begin to reduce with each new bar. The best trades tend to work within 2-6 bars.
Built for use on 5 min intervals on FX, Indexes, and Crypto. Lower than 5 minute time frames tend to be noisier and mean more commissions and a higher risk of slippage so the suggested timeframe is 5 mins.
Hard stop is X ATR (users can experiment with this) from the position entry price. This can be adjusted in user inputs.
There is a lot of slack left in entries and exits but the overall strategy is fairly robust across timeframes and markets and has between 60%-70% win rate with larger winners.
Signals that occur from economic news volatility are best avoided.

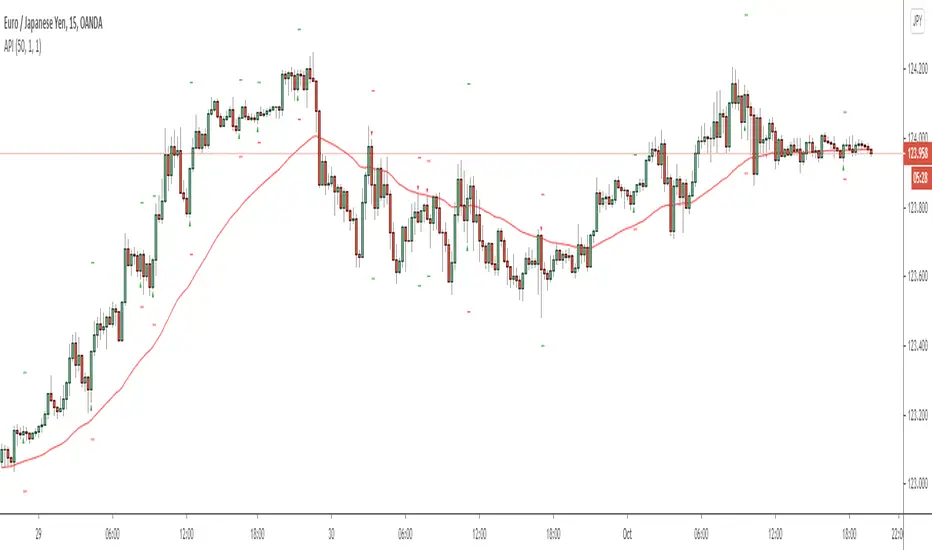
Aggressive Pullback IndicatorThis indicator is designed to be used with the rules of Steven Hart's Aggressive Pullback Strategy. It is intended for use on the 4-hour timeframe of certain currency pairs, but will work on all timeframes and instruments. The rules are customizable, but the default settings are designed to reflect the rules of Steven's pullback strategy as closely as possible.
To enable alerts: Add the indicator to the chart and create a new alert with the settings Condition: API , Frequency: Once Per Bar (on Close).
Feel free to message me if you have any questions :)
- Matt.
HTF MACD Dual Zero Cross + First EMA PullbackThis script aims to get the trader on the right side of the momentum and get better entries by only alerting when price pulls back to the trader's specified EMA.
This script isnt meant to catch tops or bottoms but to trade with the momentum once it starts.
This script will alert whe nthe MACD and signal line both cross the zero line, after that the script waits for price to make a pullback and then alet either a sell or buy. Ive found this works best when you trade with the trend on a higher timeframe.
You can use whatever MACD settings you prefer and really customize this to the asset youre trading.
You can also change whether you get an alert based on a wick touch of the EMA or a candle close.

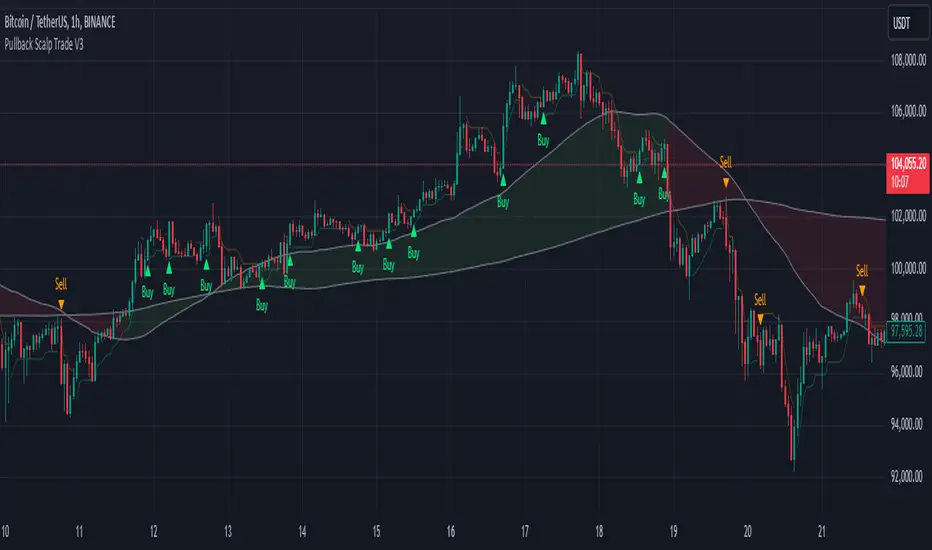
Pullback Scalp Trade V2Pullback Scalp Trading Indicator
This indicator combines multiple technical analysis tools to identify potential pullback trading opportunities in trending markets. It uses a dual moving average system along with RSI for confirmation, providing a comprehensive approach to trend-following and momentum trading.
Key Features:
1. Trend Identification:
- Uses 50 and 200 period moving averages to define the overall trend
- Visual trend zone highlighting for clear market direction
- Customizable MA periods for different timeframes
2. Signal Generation System:
- Combines RSI crossovers with trend direction
- Buy signals occur when:
* Price is above 200 MA (uptrend)
* RSI crosses above its SMA
* RSI is below the lower threshold (default 50)
- Sell signals occur when:
* Price is below 200 MA (downtrend)
* RSI crosses below its SMA
* RSI is above the upper threshold (default 50)
3. Customizable Parameters:
- Short and Long MA periods
- MA types (SMA, EMA, VWMA)
- RSI length and RSI-SMA length
- RSI signal thresholds
- Trend MA periods
Usage Guidelines:
- Best used on higher timeframes (1H and above) for trend trading
- Wait for price to respect the trend zone before taking trades
- Use additional confirmation from price action or other indicators
- Adjust RSI levels based on market volatility
Limitations:
- Like all indicators, this tool may generate false signals in choppy markets
- Should not be used as a sole decision-making tool
- Past performance does not guarantee future results
----------
Türkçe Açıklama:
Bu indikatör, trendli piyasalarda potansiyel geri çekilme fırsatlarını belirlemek için birden fazla teknik analiz aracını birleştirir. Trend takibi ve momentum ticareti için kapsamlı bir yaklaşım sunan ikili hareketli ortalama sistemi ile RSI'yı bir arada kullanır.
Temel Özellikler:
1. Trend Belirleme:
- Genel trendi tanımlamak için 50 ve 200 periyotlu hareketli ortalamalar
- Görsel trend bölgesi vurgulaması
- Farklı zaman dilimleri için özelleştirilebilir MA periyotları
2. Sinyal Üretim Sistemi:
- RSI kesişimlerini trend yönü ile birleştirir
- Alış sinyalleri şu durumlarda oluşur:
* Fiyat 200 MA'nın üzerinde (yükseliş trendi)
* RSI, SMA'sını yukarı keser
* RSI alt eşiğin altında (varsayılan 50)
- Satış sinyalleri şu durumlarda oluşur:
* Fiyat 200 MA'nın altında (düşüş trendi)
* RSI, SMA'sını aşağı keser
* RSI üst eşiğin üzerinde (varsayılan 50)
3. Özelleştirilebilir Parametreler:
- Kısa ve Uzun MA periyotları
- MA tipleri (SMA, EMA, VWMA)
- RSI uzunluğu ve RSI-SMA uzunluğu
- RSI sinyal seviyeleri
- Trend MA periyotları
Kullanım Önerileri:
- Trend ticareti için yüksek zaman dilimlerinde (1S ve üzeri) kullanılması önerilir
- İşlem almadan önce fiyatın trend bölgesine saygı göstermesini bekleyin
- Fiyat hareketi veya diğer indikatörlerden ek teyit alın
- RSI seviyelerini piyasa volatilitesine göre ayarlayın
Sınırlamalar:
- Tüm indikatörler gibi, dalgalı piyasalarda yanlış sinyaller üretebilir
- Tek başına karar verme aracı olarak kullanılmamalıdır
- Geçmiş performans, gelecekteki sonuçların garantisi değildir
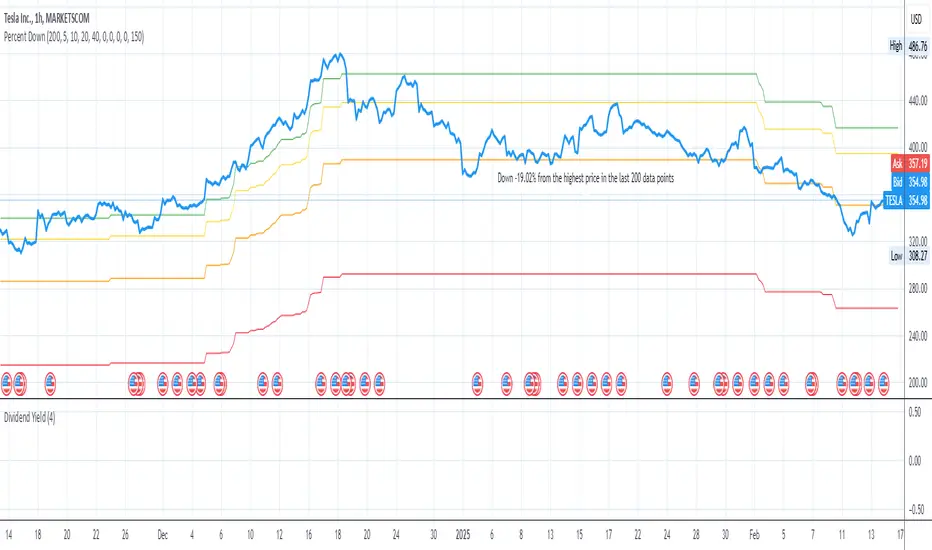
Price Target Pullback Correction or BearPrice Target percent drop is an indicator that allows you to set default percentage down from the 52 week high.
A pullback, correction, bear and a bear market is marked as a 5%, 10%, 20% or 40% drop from the 52 week highest price, so this will show the target price to buy at if these thresholds are hit.
You can change the default values of 5%, 10%, 20% and 40% to any percentage and the price will reflect the change of the default value. Furthermore, the default to use 52 weeks can be changed to find the highest price from the last 26 weeks or 104 weeks.
PullBack_Level_HunterThis script creates an "Auto Fibonacci" indicator that automatically plots selected Fibonacci retracement levels on a chart, based on a defined lookback period. Users can choose from various Fibonacci levels (0.236, 0.382, 0.5, 0.618, or 0.786) via a dropdown input, allowing for quick adjustments to analysis.
**Key Features:**
1. **Fibonacci Level Selection:** Users can select from multiple Fibonacci levels (0.236, 0.382, 0.5, 0.618, and 0.786) for analysis.
2. **Lookback Period:** The script allows users to define a lookback period to determine the highest high and the lowest low for plotting Fibonacci levels.
3. **Fibonacci Level Calculation:** The Fibonacci levels are calculated using two functions:
- `fib_level`: Calculates the Fibonacci level based on the highest high and lowest low of the lookback period.
- `fib_level_from_current`: Calculates the Fibonacci level from the current candle’s high.
4. **Plotting:** The script plots the selected Fibonacci level on the chart, using a red line for the general Fibonacci level and a blue line for the level calculated from the current high.
5. **Dynamic Visualization:** The Fibonacci levels are drawn as step lines to clearly visualize price levels based on historical data and current price action.
This tool is ideal for traders who wish to quickly assess key Fibonacci levels for potential support or resistance within a customizable lookback period.

Pullback IndicatorThe Pullback Indicator is a technical analysis tool designed to identify pullbacks in the price action of a financial instrument. It is based on the concept that price tends to retrace to a previous level of support or resistance before continuing in the direction of the trend.
The indicator is plotted as a series of triangles above or below the price bars, depending on the type of pullback detected. A green triangle is displayed when a bullish pullback is detected, while a red triangle is displayed for a bearish pullback.
The Pullback Indicator uses Inside Bar Range, this number is a user-defined input that specifies the number of bars to look back for the highest high and lowest low.
The indicator classifies four types of pullbacks:
Swing Low - When the price forms a lower low and a higher low than the previous bar.
Swing High - When the price forms a higher high and a lower high than the previous bar.
High Low Sweep and close below - When the price forms a lower low and a higher low than the previous bar, but the close is below the previous high.
High Low Sweep and close above - When the price forms a higher high and a lower high than the previous bar, but the close is above the previous low.
The Pullback Indicator is best used in conjunction with other technical analysis tools to confirm the direction of the trend and to identify potential entry and exit points.

Pullback Confirma**📈 Pullback Strategy with Candle Confirmation**
**🎯 Objective:**
Identify ideal entry points during pullbacks in trends, using the simultaneous crossover of two moving averages with candle confirmation.
**📊 Indicators Used:**
- **Hull Moving Average (HMA):** Period 27 - fast and smoothed average that reduces lag
- **Simple Moving Average (SMA):** Period 11 - short-term average for additional confirmation
**⚡ Strategy Logic:**
**🔹 Conditions for BUY SIGNAL:**
1. **Double Crossover:** Price crosses above both HMA 27 and SMA 11 simultaneously
2. **Pullback:** Price must be near or touching HMA 27 (return-to-average condition)
3. **Confirmation:** On the next candle, it must be a BULLISH candle closing above both averages
**🔸 Conditions for SELL SIGNAL:**
1. **Double Crossover:** Price crosses below both HMA 27 and SMA 11 simultaneously
2. **Pullback:** Price must be near or touching HMA 27
3. **Confirmation:** On the next candle, it must be a BEARISH candle closing below both averages
**🎨 Chart Visualization:**
- **● Blue Circle:** Upward crossover detected (awaiting confirmation)
- **● Orange Circle:** Downward crossover detected (awaiting confirmation)
- **▲ Green Arrow:** Confirmed buy (after confirmation candle)
- **▼ Red Arrow:** Confirmed sell (after confirmation candle)
- **Colored Lines:** HMA (blue) and SMA (orange) plotted on the chart
**⚙️ Customization:**
- Adjustable average periods
- Customizable arrow colors
- Configurable alerts for each confirmed signal
**✅ Advantages:**
- **Double Filter:** Two different averages for confirmation
- **Candle Confirmation:** Eliminates premature signals
- **Intuitive Visual:** Only shows arrows after valid confirmation
- **Controlled Pullback:** Operates only on return-to-average movements
**⏰ Recommended Timeframe:**
Works on multiple timeframes, but particularly effective on M15, H1, and H4 to capture more significant movements.
This strategy is ideal for traders looking for precise entries in consolidated trends, minimizing false signals through candle confirmation! 🚀

Pullback by Candle BodyThe Pullback Indicator version 0.2
Identifies pullbacks by checking if the current candle's body is lower than the previous candle's low for a bearish pullback or higher than the previous candle's high for a bullish pullback. Once a pullback has been identified, the Indicator marks the lowest low or highest high of the trend with a circle.
NOTE it's not fully working as expected as it lacks trend analysis in its code, resulting in it indicating pullbacks in the opposite direction of the trend, such as bullish pullbacks in a bullish trend or bearish pullbacks in a bearish trend. This is a work in progress, maybe it will be "improved" in the future.

Pullback Entry Zone FinderPullback Entry Zone Finder
Overview:
This indicator is designed to help traders identify potential buying opportunities during short-term pullbacks, particularly when faster-moving averages show signs of converging back towards slower ones. It visually flags potential zones where price might find support and resume its upward movement, based on moving average dynamics and price proximity.
How It Works:
The indicator utilizes four customizable moving averages (Trigger, Short-term, Intermediate, and Long-term) and Average True Range (ATR) to pinpoint specific conditions:
Pullback Detection: It identifies when the fast 'Trigger MA' is below the 'Short-term MA', indicating a potential short-term pullback or consolidation phase.
MA Convergence: Crucially, it looks for signs that the pullback might be weakening by detecting when the gap between the Short-term MA and the Trigger MA is narrowing (maConverging). This suggests the faster average is starting to catch up, potentially preceding a move back up.
Base Buy Zone (Orange Diamond): This signal appears when both the Pullback and Convergence conditions are met simultaneously. It indicates the general area where conditions are becoming favourable for a potential entry.
Refined Entry Zones:
Prime Entry Zone (Green Diamond): This appears within a Base Buy Zone if the bar's low comes within a specified percentage (Max Distance %) of the Short-term MA. It suggests price has pulled back close to the dynamic support of the Short MA.
ATR Entry Zone (Purple Diamond): This appears within a Base Buy Zone if the bar's low comes within the specified percentage (Max Distance %) of an ATR-based target level. This target level (Buy ATR Target Level, plotted as a purple line when active) is calculated by adding a multiple (ATR Multiplier %) of the ATR to the Short-term MA, providing a volatility-adjusted potential entry area.
Visual Elements:
Moving Averages: Four lines representing the Trigger, Short-term, Intermediate, and Long-term MAs (colors and opacity are customizable). Use the Intermediate and Long-term MAs to gauge the broader market trend.
Orange Diamond (Below Bar): Indicates a 'Base Buy Zone' where a pullback and MA convergence are detected.
Green Diamond (Below Bar): Indicates a 'Prime Entry Zone' where price is close to the Short-term MA during a Base Buy Zone.
Purple Diamond (Below Bar): Indicates an 'ATR Entry Zone' where price is close to the ATR-based target level during a Base Buy Zone.
Purple Line: Plots the calculated 'Buy ATR Target Level' only when the Base Buy Zone condition is active.
Input Parameters:
Moving Averages: Customize the Length and Type (EMA, SMA, WMA, VWMA) for all four moving averages.
ATR Settings: Adjust the ATR Length, the ATR Multiplier % (for calculating the target level), and the Max Distance % (for triggering the Prime and ATR Entry Zones).
Visualization: Set the colors for the four Moving Average lines.
How to Use:
Look for the Orange Diamond as the initial signal that pullback/convergence conditions are met.
The Green and Purple Diamonds suggest price has reached potentially more optimal entry levels within that zone, based on proximity to the Short MA or the ATR target, respectively.
Always consider the signals within the context of the broader trend, indicated by the Intermediate and Long-term MAs. This indicator is generally more effective when used to find entries during pullbacks within an established uptrend (e.g., Intermediate MA > Long MA).
Combine these signals with other forms of analysis, such as chart patterns, support/resistance levels, volume analysis, or other indicators for confirmation.
Disclaimer:
You should always use proper risk management techniques and conduct your own analysis before making any trading decisions. This indicator, or any other, will be of no use if you don't have good risk management.

Pullback AnalyzerPullback Analyzer - a trailing stop helper.
This indicator measures the biggest pullback encountered during an up or down move.
You can use the reported percentages to fine-tune your trailing stop.
The reporting is very precise: On higher timeframes, the pullback size can sometimes not be determined exactly from the candles.
In this case, the script displays a lower and upper bound for this number.
I suggest that you use the upper bound as your trailing stop callback rate (plus some safety margin if you like).
The size of the move itself is always reported as a lower bound.
The biggest pullback within each move is marked with a gray dotted line.
There is only one parameter, "lookback"' (or lookback limit), which determines how many bars a single move can comprise. A value of 50 was found to be a nice default. If you lower the lookback, long moves will be split up into multiple moves, each being at or below the lookback limit. Conversely, you can capture longer moves in one piece by raising the lookback limit.
The algorithm automatically ignores small moves and trading ranges near a bigger move. (We may add a parameter to control this behavior more precisely in the future.)
How the algorithm works
There is a central class called MoveFinder which scans the candle feed for the biggest possible move in a certain direction (up or down).
Two instances of this class are used, one for each direction, to find the biggest next up and down move simultaneously (upFinder and downFinder).
Additionally, each of these main MoveFinders contains two more MoveFinders. These are used to find pullbacks within the move. (This comes from the observation that finding a pullback is fundamentally the exact same operation as finding a move, just with opposing direction and limited to the time between the move's beginning and end.)
Why two nested MoveFinders per parent (for a total of 6 in the program)? Well, one of them runs in "lower bound" and one runs in "upper bound" mode, so we can print the detected pullback size as an exact interval (lower bound <= real pullback <= upper bound). I am a mathematician. I like precision.
Moves as well as pullbacks that have been found are stored as instances of class Move which simply stores start and end bar index as well as start and end price.

Pullback Candle (Bullish & Bearish, No EMA)🔍 Purpose
This indicator detects simple pullback reversal patterns based on price action and swing highs/lows — without any moving average or trend filters.
It highlights:
Bullish pullbacks (potential bounce/long setups)
Bearish pullbacks (potential rejection/short setups)
📈 Bullish Pullback Criteria
Three-bar pattern:
Bar 3: Highest close
Bar 2: Lower close
Bar 1: Even lower close
Current bar closes above previous bar (bullish reversal)
One of the last two candles is the lowest low of the past 6 bars (swing low)
📍 Result: A small green cross is plotted below the bar, and the bar is colored green.
📉 Bearish Pullback Criteria
Three-bar pattern:
Bar 3: Lowest close
Bar 2: Higher close
Bar 1: Even higher close
Current bar closes below previous bar (bearish reversal)
One of the last two candles is the highest high of the past 10 bars (swing high)
📍 Result: A small red cross is plotted above the bar, and the bar is colored red.
🔔 Alerts
One alert condition each for bullish and bearish pullback detection.
Can be used to trigger TradingView alerts.
🛠️ Customization
No inputs — fully automated logic
Clean, minimal, and fast
Can be extended with labels, alert sounds, or signals

Zigzag Trend/Divergence DetectorPullbacks are always hardest part of the trade and when it happen, we struggle to make decision on whether to continue the trade and wait for recovery or cut losses. Similarly, when an instrument is trending well, it is often difficult decision to make if we want to take some profit off the table. This indicator is aimed to make these decisions easier by providing a combined opinion of sentiment based on trend and possible divergence.
⬜ Process
▶ Use any indicator to find trend bias. Here we are using simple supertrend
▶ Use any oscillator. I have added few inbuilt oscillators as option. Default used is RSI.
▶ Find divergence by using zigzag to detect pivot high/low of price and observing indicator movement difference between subsequent pivots in the same direction.
▶ Combine divregence type, divergence bias and trend bias to derive overall sentiment.
Complete details of all the possible combinations are present here along with table legend
⬜Chart Legend
C - Continuation
D - Divergence
H - Hidden Divergence
I - Indeterminate
⬜ Settings
▶ Zigzag parameters : These let you chose zigzag properties. If you check "Use confirmed pivots", then unconfirmed pivot will be ignored in the table and in the chart
▶ Oscillator parameters : Lets you select different oscillators and settings. Available oscillators involve
CCI - Commodity Channel Index
CMO - Chande Momentum Oscillator
COG - Center Of Gravity
DMI - Directional Movement Index (Only ADX is used here)
MACD - Moving average convergence divergence (Can chose either histogram or MACD line)
MFI - Money Flow Index
MOM - Momentum oscillator
ROC - Rate Of Change
RSI - Relative Strength Index
TSI - Total Strength Index
WPR - William Percent R
BB - Bollinger Percent B
KC - Keltner Channel Percent K
DC - Donchian Channel Percent D
ADC - Adoptive Donchian Channel Percent D ( Adoptive-Donchian-Channel )
▶ Trend bias : Supertrend is used for trend bias. Coloring option color candles in the direction of supertrend. More option for trend bias can be added in future.
▶ Stats : Enables you to display history in tabular format.
Overview of settings present here:
⬜ Notes
Trend detection is done only with respect to previous pivot in the same direction. Hence, if chart has too many zigzags in short period, try increasing the zigzag length or chart timeframe. Similarly, if there is a steep trend, use lower timeframe charts to dig further.
Oscillators does not always make pivots at same bar as price. Due to this some the divergence calculation may not be correct. Hence visual inspection is always recommended.
⬜ Possible future enhancements
More options for trend bias
Enhance divergence calculation. Possible options include using oscillator based zigzag as primary or using close prices based zigzag instead of high/low.
Multi level zigzag option - Can be messy to include more than one zigzag. Option can be added to chose either Level1 or Level2 zigzags.
Alerts - Alerts can only be added for confirmed pivots - otherwise it will generate too many unwanted alerts. Will think about it :)
If I get time, I will try to make a video.

Pullback & ATR Trailing Strategy※日本語は英文の次に記載あります。
Overview
This indicator combines short-term RSI pullback/rebound signals with long-term RSI divergence to visualize potential buy and sell opportunities.
It also plots ATR-based trailing stops and partial take-profit lines, making it suitable for day trading and short-term trading.
Alerts are triggered when signal conditions are met.
Key Features
Detect short-term RSI pullbacks/rebounds (default 6 periods)
Detect divergences on long-term RSI
Visualize buy/sell signals with labels
Display ATR-based trailing stop and partial take-profit lines
Trigger alerts when conditions are met
Settings Explanation
Short-term RSI Length (rsiShortLen) Period for short-term RSI used to detect pullbacks or rebounds
Pullback Threshold (levelLow) RSI level below which a buy signal is considered
Rebound Threshold (levelHigh) RSI level above which a sell signal is considered
Long-term Timeframe (longTF) Timeframe used for divergence detection
Long-term RSI Length (longRSILen) Period for RSI on the long-term timeframe, used for divergence detection
Pivot Width Left / Right (pivotLeft / pivotRight)
Determines how we detect swing highs/lows (peaks and valleys).
For example, with pivotLeft=3 and pivotRight=3, a bar is considered a swing high if it is higher than the 3 bars to its left and 3 bars to its right.
Larger numbers detect only bigger swings, smaller numbers also detect smaller swings.
ATR Length (atrLen) Period for ATR calculation for trailing stops
ATR Multiplier (atrMult) Multiplier for ATR to calculate trailing stop distance
Partial Take-Profit Multiplier (tpMult) Multiplier to calculate half-profit level based on swing amplitude
Green line (Long Trail / translucent green)
ATR-based trailing stop line for long positions.
Used as a stop-loss or trailing stop for open buy trades.
Dark green line shows partial take-profit (TP), translucent green shows trailing stop level.
Red line (Short Trail / translucent red)
ATR-based trailing stop line for short positions.
Used as a stop-loss or trailing stop for open sell trades.
Dark red line shows partial take-profit (TP), translucent red shows trailing stop level.
Note: TP lines indicate partial take-profit targets, while ATR trailing lines indicate stop-loss/trailing stop levels if the price moves against the position.
日本語説明ーーーーーーーーーーーーーーーーーーーーーーーーーーーー
概要
このインジケーターは、短期RSIの押し目/戻りシグナルと、長期足RSIによるダイバージェンスを組み合わせて、買い・売りのチャンスを可視化します。
さらに、ATRベースのトレールストップラインや半分利確ラインも表示し、デイトレードや短期トレードに最適化しています。
シグナル条件に一致した場合にアラートも作動します。
主な機能
短期RSI(デフォルト6期間)で押し目・戻りを検出
長期足RSIでのダイバージェンスを検出
BUY/SELLラベルでシグナルを視覚化
ATRベースのトレールライン・半分利確ラインを表示
条件一致時にアラート発動
各設定の説明
短期RSI期間 (rsiShortLen) デイトレ用の短期RSIの期間。押し目や戻りのシグナルに使用
押し目閾値 (levelLow) RSIが下回ったら買いシグナル判定に使用
戻り閾値 (levelHigh) RSIが上回ったら売りシグナル判定に使用
長期足 (longTF) ダイバージェンス判定用の長期足の時間軸
長期RSI期間 (longRSILen) 長期足で計算するRSIの期間。ダイバージェンス判定に使用
左右ピボット幅 (pivotLeft / pivotRight) 高値や安値を「スイングの山・谷」として判定する時に使う幅です。
例えば pivotLeft=3, pivotRight=3 の場合、「左に3本、右に3本のローソク足より高い/低い点」をスイングの頂点や底と見なします。
数値を大きくすると大きな波だけを拾い、小さくすると小さな波も拾いやすくなります。
ATR期間 (atrLen) トレールライン計算用ATRの期間
ATR倍率 (atrMult) トレールラインの距離をATRに掛ける倍率
半分利確倍率 (tpMult) 押し目/戻り幅に対して半分利確ラインを設定する倍率
緑の線(Long Trail / 半透明緑)
ATRベースのトレールストップラインです。
買いポジション中の損切り目安やトレーリングストップとして使います。
緑の濃い線は半分利確ライン(TP)、薄い緑の線はトレールストップの位置を示します。
赤い線(Short Trail / 半透明赤)
ATRベースのトレールストップラインです。
売りポジション中の損切り目安やトレーリングストップとして使います。
赤の濃い線は半分利確ライン(TP)、薄い赤の線はトレールストップの位置を示します。
補足:TP(Take Profit)線は半分利確の目安で、ATRトレールラインはポジションが逆行した時の損切り目安です。

Pullback Pro Dow Strategy v7 (ADX Filter)
### **Strategy Description (For TradingView)**
#### **Title:** Pullback Pro: Dow Theory & ADX Strategy
---
#### **1. Summary**
This strategy is designed to identify and trade pullbacks within an established trend, based on the core principles of Dow Theory. It uses market structure (pivot highs and lows) to determine the trend direction and an Exponential Moving Average (EMA) to pinpoint pullback entry opportunities.
To enhance trade quality and avoid ranging markets, an ADX (Average Directional Index) filter is integrated to ensure that entries are only taken when the trend has sufficient momentum.
---
#### **2. Core Logic: How It Works**
The strategy's logic is broken down into three main steps:
**Step 1: Trend Determination (Dow Theory)**
* The primary trend is identified by analyzing recent pivot points.
* An **Uptrend** is confirmed when the script detects a pattern of higher highs and higher lows (HH/HL).
* A **Downtrend** is confirmed by a pattern of lower highs and lower lows (LH/LL).
* If neither pattern is present, the strategy considers the market to be in a range and will not seek trades.
**Step 2: Entry Signal (Pullback to EMA)**
* Once a clear trend is established, the strategy waits for a price correction.
* **Long Entry:** In a confirmed uptrend, a long position is initiated when the price pulls back and crosses *under* the specified EMA.
* **Short Entry:** In a confirmed downtrend, a short position is initiated when the price rallies and crosses *over* the EMA.
**Step 3: Confirmation & Risk Management**
* **ADX Filter:** To ensure the trend is strong enough to trade, an entry signal is only validated if the ADX value is above a user-defined threshold (e.g., 25). This helps filter out weak signals during choppy or consolidating markets.
* **Stop Loss:** The initial Stop Loss is automatically and logically placed at the last market structure point:
* For long trades, it's placed at the `lastPivotLow`.
* For short trades, it's placed at the `lastPivotHigh`.
* **Take Profit:** Two Take Profit levels are calculated based on user-defined Risk-to-Reward (R:R) ratios. The strategy allows for partial profit-taking at the first target (TP1), moving the remainder of the position to the second target (TP2).
---
#### **3. Input Settings Explained**
**① Dow Theory Settings**
* **Pivot Lookback Period:** Determines the sensitivity for detecting pivot highs and lows. A smaller number makes it more sensitive to recent price swings; a larger number focuses on more significant, longer-term pivots.
**② Entry Logic (Pullback)**
* **Pullback EMA Length:** Sets the period for the Exponential Moving Average used to identify pullback entries.
**③ Risk & Exit Management**
* **Take Profit 1 R:R:** Sets the Risk-to-Reward ratio for the first take-profit target.
* **Take Profit 1 (%):** The percentage of the position to be closed when TP1 is hit.
* **Take Profit 2 R:R:** Sets the Risk-to-Reward ratio for the final take-profit target.
**④ Filters**
* **Use ADX Trend Filter:** A master switch to enable or disable the ADX filter.
* **ADX Length:** The lookback period for the ADX calculation.
* **ADX Threshold:** The minimum ADX value required to confirm a trade signal. Trades will only be placed if the ADX is above this level.
---
#### **4. Best Practices & Recommendations**
* This is a trend-following system. It is designed to perform best in markets that exhibit clear, sustained trending behavior.
* It may underperform in choppy, sideways, or strongly ranging markets. The ADX filter is designed to help mitigate this, but no filter is perfect.
* **Crucially, you must backtest this strategy thoroughly** on your preferred financial instrument and timeframe before considering any live application.
* Experiment with the `Pivot Lookback Period`, `Pullback EMA Length`, and `ADX Threshold` to optimize performance for a specific market's characteristics.
---
#### **DISCLAIMER**
This script is provided for educational and informational purposes only. It does not constitute financial advice. All trading involves a high level of risk, and past performance is not indicative of future results. You are solely responsible for your own trading decisions. The author assumes no liability for any financial losses you may incur from using this strategy. Always conduct your own research and due diligence.

Pullback Levels from ATH# ATH Pullback Levels
**Assess correction depth with precision – 5%, 10%, 15%, 20% below All-Time High**
---
### Overview
This indicator draws **horizontal support lines** at **5%, 10%, 15%, and 20%** below the **All-Time High (ATH)** of any asset. Perfect for **swing traders**, **long-term investors**, and **bull market participants** who want to:
- Measure **pullback depth** in real-time
- Identify **potential support zones**
- Set **alerts** when price enters key retracement levels
---
### Features
| Feature | Description |
|--------|-------------|
| **Dynamic ATH Tracking** | Automatically updates with every new high |
| **4 Pullback Levels** | 5%, 10%, 15%, 20% below ATH |
| **Live Pullback % Label** | Shows current % drop from ATH (top-right) |
| **Customizable Lines** | Toggle visibility, change colors & styles |
| **Built-in Alerts** | Trigger on entry into each zone |
| **No Errors** | Works on 50k+ bar charts (BTC, SPX, etc.) |
| **Time-Based Lines** | Uses `xloc.bar_time` – no 500-bar future limit |
---
### How to Use
1. Apply to any chart (stocks, crypto, forex, indices)
2. Watch the **info box** for current pullback %
3. Use lines as **potential buy zones** during corrections
4. Set **alerts** to be notified when price enters a level
> Example: If ATH = $100 →
> - 5% = $95
> - 10% = $90
> - 15% = $85
> - 20% = $80
---
### Inputs
- **Show 5% / 10% / 15% / 20% Level** → Toggle on/off
- **Line Colors** → Fully customizable
- **Line Style** → Solid, Dashed, or Dotted
---
### Alerts
Create alerts directly from the indicator:
- `"Entered 5% Pullback"`
- `"Entered 10% Pullback"`
- etc.
---
### Best For
- Bull market corrections
- Long-term position sizing
- Risk management in uptrends
- Swing entries on dips
---
### Notes
- Works on **all timeframes**
- **Log scale compatible** (lines adjust correctly)
- No repainting – ATH only updates on confirmed highs
---
**Built with Pine Script v6 – Clean, fast, reliable.**
*Happy trading!*

Pullback Master Pro CareCThe "Pullback Master Pro" indicator identifies strategic pullback trading opportunities by analyzing price retracements within established trends, using a multi-timeframe approach with customizable higher-timeframe filtering to ensure alignment with the dominant market direction. It detects pullback depth, momentum through RSI oversold/overbought conditions, and volume analysis (spikes and dry-ups) to confirm entries, while providing real-time visual signals and a highly configurable information table that users can position in six different screen locations (corners and mid-sides), choose from three size layouts (small, medium, large), adjust font sizes, and personalize with five color themes (dark, light, blue, green, red) for optimal chart integration and readability.

Pullback Setup HelperThe Pullback Setup Helper is a visual tool designed to assist traders in identifying high-probability pullback entry zones in both bullish and bearish trends. It dynamically calculates support and resistance pullback areas using a combination of recent price extremes and ATR-based volatility measures.
The indicator plots two main zones: one for potential long setups beneath recent highs, and another for short setups above recent lows. These zones are derived from configurable multipliers of the ATR to define depth and width, with an additional buffer to allow for slight overshoots or market noise.
Signals are generated when price enters a pullback zone and closes in the direction of the trend, using a relaxed condition (close > previous close for longs, close < previous close for shorts) to increase signal frequency. Entry signals appear as triangles on the chart, with optional alerts available for both long and short scenarios.
This tool is best used as a contextual guide to support trend-continuation trades, particularly when combined with additional confirmation from momentum or volume indicators.

Pullback Master Pro v2Yes, excellent for scalping too when used on lower timeframes (1-15 min):
Why it works for scalping:
Quick pullback identification for fast entries
EMA slope changes catch momentum shifts early
RSI extremes pinpoint overextended moves
Volume spikes confirm momentum entries
Fast signals for quick in-and-out trades
Scalping Setup:
Use on 1-5 minute charts
Set higher timeframe to 15-30 minutes for trend filter
Shorter EMA periods (5-9) for faster signals
Small pullback depth (5-15%) for tighter entries
The indicator's real-time signals and clean visualization make it ideal for rapid scalping decisions.

Pullback Master Pro CareCA multi-timeframe pullback trading indicator that identifies optimal entry points during trend corrections. It combines higher timeframe trend direction with intraday momentum analysis, volume confirmation, and RSI extremes to signal high-probability reversal points when price pulls back against the primary trend.
Perfect for swing traders and scalpers looking to enter with institutional flow at key support/resistance levels with multiple confirmation filters.

Pullback Master CareCA clean, reliable pullback trading indicator that identifies optimal entry points during trend corrections. It combines daily trend direction with intraday momentum, volume patterns, and RSI oversold conditions to signal high-probability buy opportunities when price pulls back in an uptrend.
Perfect for swing traders looking to enter with the trend after temporary sell-offs, with built-in confirmation filters to avoid false signals.
