Stochastic RSI Strategy with Inverted Trend LogicOverview:
The Stochastic RSI Strategy with Inverted Trend Logic is a custom-built Pine Script indicator that leverages the Stochastic RSI and a 200-period moving average to generate precise buy and sell signals. It is specifically designed for traders looking to capture opportunities during short-term market movements while factoring in broader trend conditions.
Key Components:
Stochastic RSI:
Stochastic RSI is a momentum indicator that applies stochastic calculations to the standard Relative Strength Index (RSI), rather than price data. This makes it particularly sensitive to market momentum changes, which is essential for timing entries and exits.
K Line and D Line: The indicator calculates and smooths both the K and D lines to capture momentum shifts more accurately.
200-Period Moving Average:
The 200-period Simple Moving Average (SMA) is used as a trend filter.
If the price is above the 200-period SMA, the trend is considered bullish.
If the price is below the 200-period SMA, the trend is considered bearish.
Inverted Trading Logic:
The trading logic is inverted from traditional strategies:
Long trades are executed only when the market is in a bearish trend (price below the 200-period moving average).
Short trades are executed only when the market is in a bullish trend (price above the 200-period moving average).
This inversion allows traders to take advantage of potential trend reversals by entering positions in the opposite direction of the prevailing trend.
Trading Rules:
Long Trade Conditions (Buy Signal):
The Stochastic RSI K line must be below 5 for 4 consecutive candles (oversold condition).
The price must be below the 200-period SMA (indicating a bearish trend).
Once these conditions are met, the indicator will generate a buy signal on the close of the 4th candle.
Exit Condition: The long position is exited when the Stochastic RSI K line crosses above 50 (neutral level).
Short Trade Conditions (Sell Signal):
The Stochastic RSI K line must be above 95 for 4 consecutive candles (overbought condition).
The price must be above the 200-period SMA (indicating a bullish trend).
Once these conditions are met, the indicator will generate a sell signal on the close of the 4th candle.
Exit Condition: The short position is exited when the Stochastic RSI K line crosses below 50.
Visual Signals on the Chart:
Buy Signal:
A green triangle below the bar is displayed on the chart when a buy condition is met, indicating a potential long trade opportunity.
The text "BUY" is displayed for further clarity.
Sell Signal:
A red triangle above the bar is displayed on the chart when a sell condition is met, indicating a potential short trade opportunity.
The text "SELL" is displayed for further clarity.
How to Use the Indicator:
Attach the Indicator: Apply the indicator to your desired chart (works on any time frame, but is optimized for short- to medium-term trading).
Monitor Signals: Watch for buy and sell signals on the chart:
Buy Signal: Enter long positions when a green triangle appears below the candle.
Sell Signal: Enter short positions when a red triangle appears above the candle.
Exit Positions: Exit long positions when the Stochastic RSI crosses above the 50 level, and exit short positions when the Stochastic RSI crosses below the 50 level.
Indicator Display:
Stochastic RSI: A visual representation of the Stochastic RSI (K and D lines) is plotted below the price chart, with overbought (100), midpoint (50), and oversold (0) levels clearly marked.
200-period SMA: The 200-period moving average is plotted on the price chart, giving a clear indication of the broader trend direction (orange line).
Key Benefits:
Reversal Opportunities: This strategy allows traders to capture reversal trades by using an inverted logic where longs are taken in bearish conditions and shorts are taken in bullish conditions. This can help capitalize on potential trend exhaustion and reversals.
Clear and Simple Rules: The use of Stochastic RSI and the 200-period moving average ensures the strategy remains simple yet effective, making it easy for traders to follow.
Visual Alerts: The indicator provides clear buy and sell signals, making it easy for traders to spot trading opportunities in real-time without needing to monitor multiple conditions manually.
Limitations and Considerations:
Trend Changes: Since the strategy is designed to work during trend reversals, it might not perform as well during strong, prolonged trends where price continues moving in one direction without significant pullbacks.
Time Frame Suitability: While the indicator works on any time frame, shorter time frames may result in more frequent signals and higher trade frequency, whereas higher time frames will provide fewer but potentially stronger signals.
Conclusion:
The Stochastic RSI Strategy with Inverted Trend Logic is a powerful tool for traders looking to capture market reversals by entering trades against the prevailing trend direction based on momentum exhaustion. Its simple and clear logic, combined with easy-to-understand visual signals, makes it a versatile indicator for both novice and experienced traders.
Search in scripts for "pullback"

ABCD Projection [Trendoscope®]Over the years, we have extensively explored and published numerous scripts centered around various chart patterns, including Harmonic Patterns, Reversal Patterns, Elliott Waves, and more. Our expertise in these areas has led to frequent requests for an indicator based on the ABCD pattern. Although we didn't include it as part of our Harmonic Patterns collection, the development of a dedicated ABCD Projection Indicator has always been a priority for us.
🎲 Overview of the ABCD Projection Indicator
The ABCD Projection Indicator is designed to identify and project ABCD patterns using a Zigzag-based approach. This pattern, characterized by alternating pivot highs and lows labeled as A, B, C, and D, is particularly significant in trending markets where it signifies trend continuation following deep pullbacks.
The indicator works by confirming the ABC pivots and projecting the D pivot based on the established price swings. Since ABCD patterns are most effective in trending environments, the indicator focuses on filtering patterns where the retracement from the C pivot has not compromised the trade's potential. Specifically, it ensures that the starting point (S)—where the pattern is detected—has not retraced beyond a defined threshold, preserving the opportunity to execute a trade with the goal of reaching the projected D pivot.
Additionally, the ABCD Projection Indicator considers the retracement ratio from the C pivot, which plays a crucial role in risk management. A higher retracement ratio reduces the stop distance (from pivot A to the entry point S) while increasing the distance to the target (pivot D), thereby enhancing the reward/risk ratio for trades.
🎲 Components of the ABCD Projection Indicator
The ABCD Projection Indicator comprises several key components:
A, B, C Pivots and Zigzag Wave : These elements form the foundational structure of the ABCD pattern.
S Point : This is the location where the pattern is identified, positioned a few bars away from the confirmed C pivot.
Estimated D Pivot : The D pivot is projected based on the A, B, and C price levels. The time or distance to the D pivot is influenced by the starting point S.
Mini Stats Table : Located in the top right corner, this table displays win/loss ratios and risk/reward data for both bullish and bearish scenarios.
Fibonacci Levels : Calculated from the C to D pivots, these levels are provided as a reference for additional analysis.
🎲 Indicator Settings
The settings for the ABCD Projection Indicator are minimal and intuitive, with tooltips provided to guide users through the configuration process.

Money Flow DivergenceThe Money Flow Divergence indicator is designed to help traders identify periods when there is a significant divergence between the growth of the U.S. M2 money supply and the S&P 500 index (SPX).
This divergence can provide insights into potential market turning points, making it a valuable tool for long-term investors and traders looking to capitalize on macroeconomic trends.
How It Works:
Data Sources:
S&P 500 Index (SPX) and U.S. M2 Money Supply.
Calculating Growth Rates:
SPX Growth: The script calculates the percentage growth of the S&P 500 index by comparing the current closing price with the previous period's closing price.
M2 Growth: Similarly, it calculates the percentage growth of the U.S. M2 money supply by comparing the current value with the previous period's value.
Growth Gap/Delta:
Growth Gap: The core of the indicator is the "growth gap" or "delta," which is the difference between the M2 money supply growth and the SPX growth. This gap indicates whether liquidity in the economy (represented by M2) is outpacing or lagging behind the performance of the stock market.
Interpretation:
Positive Gap (Green Bars): When the M2 growth outpaces SPX growth, the gap is positive, indicating that there is more liquidity in the system than what is being reflected in the stock market. This scenario often signals potential upward momentum in the market, making it a good time to consider buying.
Negative Gap (Red Bars): When the SPX growth outpaces M2 growth, the gap is negative, suggesting that the market may be overextended relative to the available liquidity. This can be a warning sign of potential market corrections or downturns.
Visualization:
The indicator plots the growth gap as a histogram with bars colored based on the gap value:
Green Bars: Indicate a positive gap where M2 growth is higher than SPX growth.
Red Bars: Indicate a negative gap where SPX growth is higher than M2 growth.
The bars are thickened for better visibility, and a horizontal line at zero is plotted to help users easily distinguish between positive and negative gaps.
How To Use It:
Time Frame Selection: Users can select the desired time frame (e.g., monthly, weekly) for the data. This flexibility allows traders to analyze the indicator over different periods, depending on their investment horizon.
Monthly time frames seem to work best.
Interpreting the Indicator:
Bullish Signals: Look for sustained periods of positive growth gaps (green bars), which may indicate a favorable environment for buying or holding long positions.
Bearish Signals: Be cautious during periods of negative growth gaps (red bars), which could signal overvaluation in the market or potential pullbacks.
Enjoy and let me know if you have any questions.

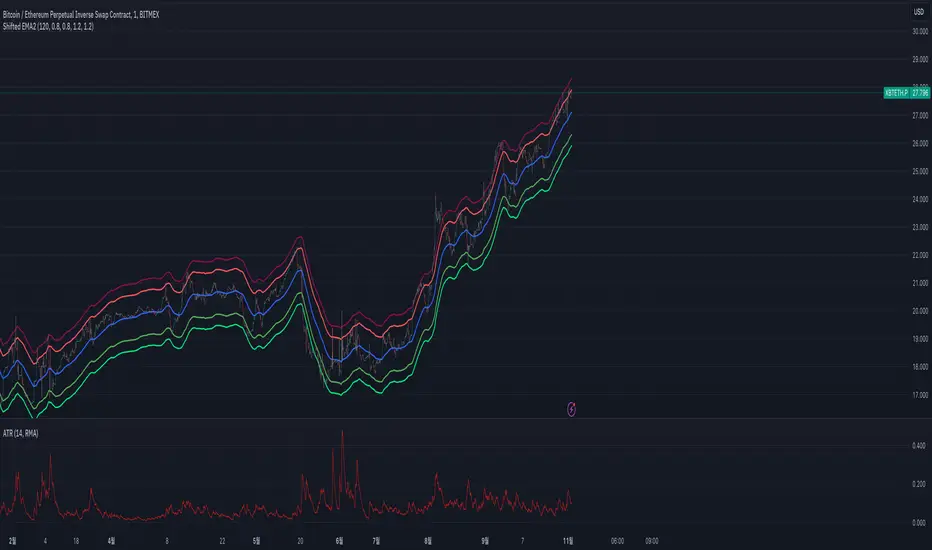
Shifted EMAShifted EMA Indicator for TradingView
The Shifted EMA indicator is a customized technical analysis tool designed for TradingView's Pine Script version 5. This indicator plots the Exponential Moving Average (EMA) of a specified length along with its upper and lower shifted counterparts. The shifts allow traders to visualize price movements relative to dynamically adjusted EMA levels, potentially aiding in identifying overbought or oversold conditions, support and resistance zones, or trend confirmations.
Key Features:
Exponential Moving Average (EMA):
Calculates and plots the EMA based on the user-defined period (EMA Length). The EMA gives more weight to recent price data, making it more responsive to recent price changes compared to the Simple Moving Average (SMA).
Upper and Lower Shifts:
Allows users to define vertical shifts (Upper Shift and Lower Shift) to the EMA, plotting two additional lines above and below the standard EMA. These shifted lines can serve as dynamic support and resistance levels or zones of interest.
Customizable Parameters:
EMA Length: Defines the period over which the EMA is calculated. A longer period smoothens the EMA, while a shorter period makes it more sensitive to recent price changes.
Upper Shift: Determines the number of points to shift the EMA upwards.
Lower Shift: Determines the number of points to shift the EMA downwards.
Visual Aids:
Distinct colors and line widths are used for each plotted line to enhance clarity:
EMA: Blue line
Upper Shifted EMA: Red line
Lower Shifted EMA: Green line
How to Use:
Adding the Indicator:
Apply the Shifted EMA indicator to your desired chart in TradingView.
Configuring Parameters:
Adjust the EMA Length to set the period for the EMA calculation based on your trading strategy or preference.
Set the Upper Shift and Lower Shift values to determine how far above and below the EMA the shifted lines should be plotted. It's advisable to start with smaller shift values to ensure the shifted lines remain within a relevant range of the price action.
Interpreting the Indicator:
Trend Analysis: The standard EMA can help identify the prevailing market trend. Prices consistently above the EMA may indicate an uptrend, while prices below suggest a downtrend.
Dynamic Support and Resistance: The upper and lower shifted EMAs can act as dynamic resistance and support levels, respectively. Price reactions at these levels might provide trading signals or areas of interest.
Overbought/Oversold Conditions: Significant deviations of the price from the shifted EMAs might hint at overbought or oversold conditions, potentially signaling reversals or pullbacks.
Note: Like all technical indicators, the Shifted EMA should not be used in isolation. It's recommended to combine it with other analysis tools, indicators, or fundamental analysis to make well-informed trading decisions. Always ensure to test and validate the indicator's effectiveness within your specific trading strategy and risk management framework.
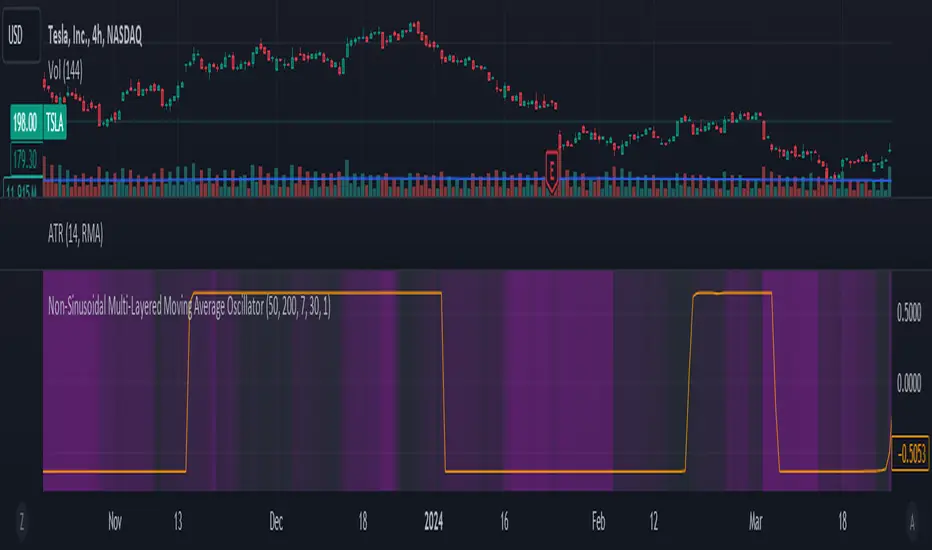
Non-Sinusoidal Multi-Layered Moving Average OscillatorThis indicator utilizes multiple moving averages (MAs) of different lengths their difference and its rate of change to provide a comprehensive view of both short-term and long-term market trends. The output signal is characterized by its non-sinusoidal nature, offering distinct advantages in trend analysis and market forecasting.
Combining the difference between two moving averages with the ROC allows to assess not only the direction and strength of the trend but also the momentum behind it. Transforming these signal in to non-sinusoidal output enhances its utility.
The indicator allows traders to select any one or more of seven moving average options. Larger timeframes (e.g., MA89/MA144) provide a broader identification of the overall trend, helping to understand the general market direction. Smaller timeframes (e.g., MA5/MA8) are more sensitive to price changes and can indicate better entry and exit points, aiding in the identification of retracements and pullbacks. By combining multiple timeframes, traders can get a comprehensive view of the market, enabling more precise and informed trading decisions.
Key Features:
Multiple Moving Averages:
The indicator calculates several exponential moving averages (EMAs) based on different lengths: MA5, MA8, MA13, MA21, MA34, MA55, MA89, and MA144.
These MAs are further smoothed using a secondary exponential moving average, with the smoothing length customizable by the user.
Percentage Differences:
The indicator computes the percentage differences between successive MAs (e.g., (MA5 - MA8) / MA8 * 100). These differences highlight the relative movement of prices over different periods, providing insights into market momentum and trend strength.
Short-term MA differences (e.g., MA5/MA8) are more sensitive to recent price changes, making them useful for detecting quick market movements.
Long-term MA differences (e.g., MA89/MA144) smooth out short-term fluctuations, helping to identify major trends.
Rate of Change (ROC):
The indicator applies the Rate of Change (ROC) to the percentage differences of the MAs. ROC measures the speed at which the percentage differences are changing over time, providing an additional layer of trend analysis.
ROC helps in understanding the acceleration or deceleration of market trends, indicating the strength and potential reversals.
Transformations:
The percentage differences undergo a series of mathematical transformations (either inverse hyperbolic sine transformation or inverse fisher transformation) to refine the signal and enhance its interpretability. These transformations include adjustments to stabilize the values and highlight significant movements.
checkbox allows users to select which mathematical transformations to use.
Non-Sinusoidal Nature:
The output signal of this indicator is non-sinusoidal, characterized by abrupt changes and distinct patterns rather than smooth, wave-like oscillations.
The non-sinusoidal signal provides clearer demarcations of trend changes and is more responsive to sudden market shifts.
This nature reduces the lag typically associated with sinusoidal indicators, allowing for more timely and accurate trading decisions.
Customizable Options:
Users can select which MA pairs to include in the analysis using checkboxes. This flexibility allows the indicator to adapt to different trading strategies, whether focused on short-term movements or long-term trends.
Visual Representation:
The indicator plots the transformed values on a separate panel, making it easy for traders to visualize the trends and potential entry or exit points.
Usage Scenarios:
Short-Term Trading: By focusing on shorter MAs (e.g., MA5/MA8), traders can capture quick market movements and identify short-term trends.
Long-Term Analysis: Utilizing longer MAs (e.g., MA89/MA144) helps in identifying major market trends.
Combination of MAs: The ability to mix different MA lengths provides a balanced view, helping traders make decisions based on both immediate price actions and overall market direction.
Practical Benefits:
Early Signal Detection: The sensitivity of short-term MAs provides early signals for potential trend changes, assisting traders in timely decision-making.
Trend Confirmation: Long-term MAs offer stable trend confirmation, reducing the likelihood of false signals in volatile markets.
Noise Reduction: The mathematical transformations and ROC applied to the percentage differences help in filtering out market noise, focusing on meaningful price movements.
Improved Responsiveness: The non-sinusoidal nature of the signal allows the indicator to react more quickly to market changes, providing more accurate and timely trading signals.
Clearer Trend Demarcations: Non-sinusoidal signals make it easier to identify distinct phases of market trends, aiding in better interpretation and decision-making.
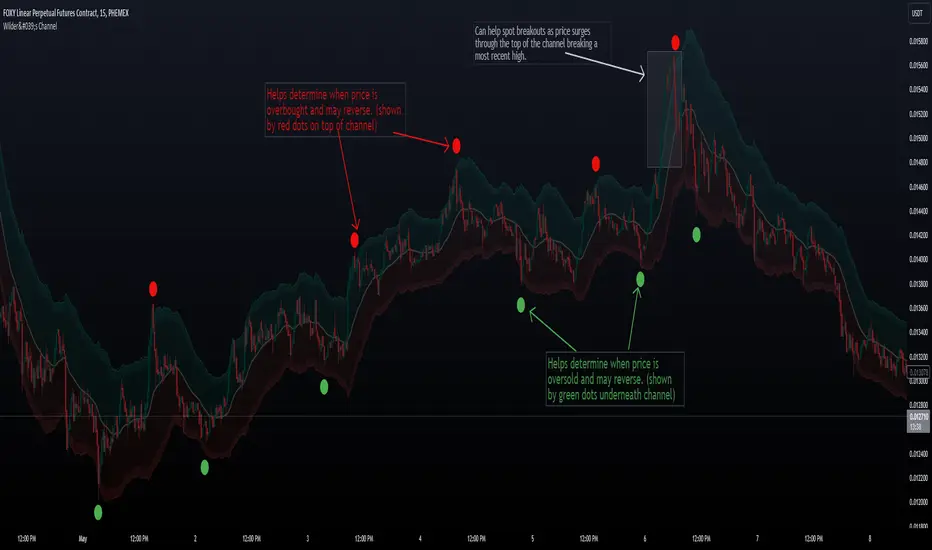
Wilder's ChannelThe Wilder’s channel is a typical channel indicator made of 2 Wilder’s average from the high and low price over a “p” period, factorized by the Average True Range value over “atx” period.
Indicator from Kevin Britain library.
"Wilder's Channel," which is plotted on the chart overlay to assist traders in visualizing potential support and resistance levels. This script uses a combination of Wilder's Moving Average and the Average True Range (ATR) to create a channel around price movements. Here's a breakdown of how it works and its benefits:
Trend Confirmation: The channel helps confirm the current trend direction. If prices are consistently near the upper boundary, it suggests an uptrend, and vice versa for a downtrend.
Support and Resistance Levels: The Upper and Lower lines serve as dynamic support and resistance levels, which can help traders identify potential entry and exit points.
Volatility Insight: The width of the channel gives insight into market volatility. A wider channel indicates higher volatility, while a narrower channel suggests less volatility.
Trade Management: The buffer zones can be used for additional decision-making points, such as tightening stop-loss orders or preparing for potential breakouts or pullbacks.
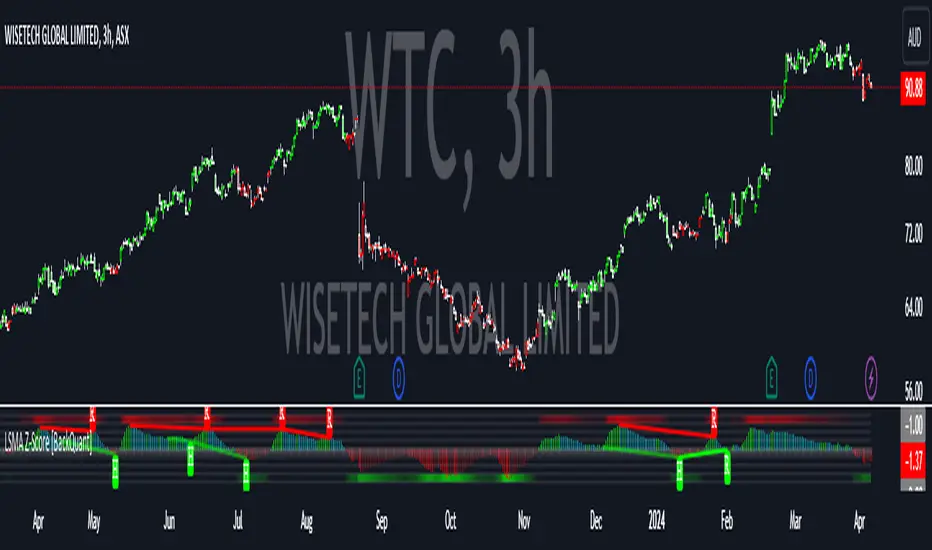
LSMA Z-Score [BackQuant]LSMA Z-Score
Main Features and Use in the Trading Strategy
- The indicator normalizes the LSMA into a detrended Z-Score, creating an oscillator with standard deviation levels to indicate trend strength.
- Adaptive coloring highlights the rate of change and potential reversals, with different colors for positive and negative changes above and below the midline.
- Extreme levels with adaptive coloring indicate the probability of a reversion, providing strategic entry or exit points.
- Alert conditions for crossing the midline or significant shifts in trend direction enhance its utility within a trading strategy.
1. What is an LSMA?
The Least Squares Moving Average (LSMA) is a technical indicator that smoothens price data to help identify trends. It uses the least squares regression method to fit a straight line through the selected price points over a specified period. This approach minimizes the sum of the squares of the distances between the line and the price points, providing a more statistically grounded moving average that can adapt more smoothly to price changes.
2. What is a Z-Score?
A Z-Score is a statistical measurement that describes a value's relationship to the mean of a group of values, measured in terms of standard deviations from the mean. If a Z-Score is 0, it indicates that the data point's score is identical to the mean score. A Z-Score helps in understanding if a data point is typical for a given data set or if it is atypical. In finance, a Z-Score is often used to measure how far a piece of data is from the average of a set, which can be helpful in identifying outliers or unusual data points.
3. Why Turning LSMA into a Z-Score is Innovative and Its Benefits
Converting LSMA into a Z-Score is innovative because it combines the trend identification capabilities of the LSMA with the statistical significance testing of Z-Scores. This transformation normalizes the LSMA, creating a detrended oscillator that oscillates around a mean (zero line), with standard deviation levels to show trend strength. This method offers several benefits:
Enhanced Trend Detection:
- By normalizing the LSMA, traders can more easily identify when the price is deviating significantly from its trend, which can signal potential trading opportunities.
Standardization:
- The Z-Score transformation allows for comparisons across different assets or time frames, as the score is standardized.
Objective Measurement of Trend Strength:
- The use of standard deviation levels provides an objective measure of trend strength and volatility.
4. How It Can Be Used in the Context of a Trading System
This indicator can serve as a versatile tool within a trading system for a range of things:
Trend Confirmation:
- A positive Z-Score can confirm an uptrend, while a negative Z-Score can confirm a downtrend, providing traders with signals to enter or exit trades.
Oversold/Overbought Conditions:
- Extreme Z-Score levels can indicate overbought or oversold conditions, suggesting potential reversals or pullbacks.
Volatility Assessment:
- The standard deviation levels can help traders assess market volatility, with wider bands indicating higher volatility.
5. How It Can Be Used for Trend Following
For trend following strategies, this indicator can be particularly useful:
Trend Strength Indicator:
- By monitoring the Z-Score's distance from zero, traders can gauge the strength of the current trend, with larger absolute values indicating stronger trends.
Directional Bias:
- Positive Z-Scores can be used to establish a bullish bias, while negative Z-Scores can establish a bearish bias, guiding trend following entries and exits.
Color-Coding for Trend Changes :
- The adaptive coloring of the indicator based on the rate of change and extreme levels provides visual cues for potential trend reversals or continuations.
Thus following all of the key points here are some sample backtests on the 1D Chart
Disclaimer: Backtests are based off past results, and are not indicative of the future.
This is using the Midline Crossover:
INDEX:BTCUSD
INDEX:ETHUSD
BINANCE:SOLUSD
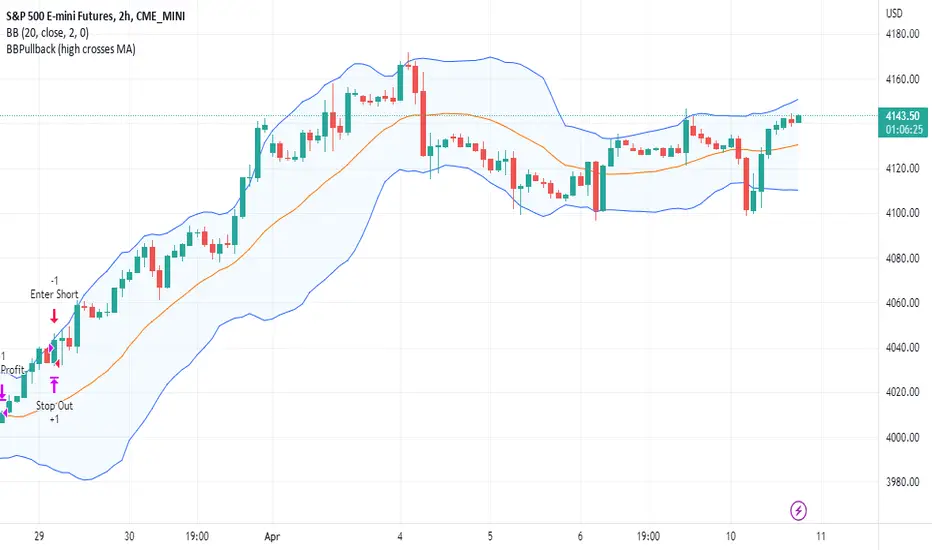
BBPullback1.0.2This is a simple strategy script based on Bollinger Bands pullbacks.
The strategy is simple, as follows:
For LONGS: At the close of any candle, it check to see if this candle is an UP candle where the low broke below the lower Bollinger Band. If so, we call this the trigger candle. For the next bar, we issue a BUY signal if the price breaks above the high of the trigger candle. The stoploss is the low of the trigger candle. We take profit when the price goes above the middle Bollinger Band (the mean/average line).
For SHORTS: At the close of any candle, it check to see if this candle is an DOWN candle where the high broke above the upper Bollinger Band. If so, we call this the trigger candle. For the next bar, we issue a SELL signal if the price breaks below the low of the trigger candle. The stoploss is the high of the trigger candle. We take profit when the price goes below the middle Bollinger Band (the mean/average line).
Nadaraya-Watson OscillatorThis indicator is based on the work of @jdehorty and his amazing Nadaraya-Watson Kernel Envelope, which you can see here:
General Description
The Nadaraya-Watson Oscillator (NWO) will give the same information as the Nadaraya-Watson Envelope, but as an oscillator off the main chart, by plotting the relationship between price and the Kernel and its bands. This also means that we can now detect divergences between price and the NWO.
You can see the relationship between the two here:
You can think of this indicator as the kernel envelope version of a Bollinger Band %B. In ranging markets the bands are perfect for mean reversion trades, but in certain situations the break of one of the bands can signal the beggining of a strong trend and price will remain close to the bands for a long period and will only give small pullbacks. As with any indicator, confluence with price and other tools must be taken into account.
Main Features
As with @jdehorty 's Envelope, you can change the following settings:
Lookback Window.
Relative Weighting.
The initial bar for the regression.
ATR period for the bands.
Inner and Outer Multiples for the bands.
I also added the following:
A middle band around the Kernel to filter out false crossovers.
A Hull Moving Average to smoothen out the movements of the oscillator and give extra confirmation of turnover points.
Colors
Some special things to note regarding the coloring:
The zero line features a gradient that changes color every time the Kernel slope changes direction.
The Oscillator plot has a gradient coloring that gets stronger the closer it gets to each of the bands.
Every time the oscillator crosses over/under the outer bands the background will be highlighted.
Happy trading!

Momentum Regime Filter BTC by [VanHelsing]Momentum Regime Filter BTC by
This is a usefull indicator what shows you a macro state of BTC trend.
Most of the trend indicators get lost in the ranging market or switch to bearish during simple pullbacks.
And I decided to creat it to ignore all this noise from a market and see what exactly major trend is!
-How it Works:
For find out what curent trend on BTC is, it using RSI and Normalized Momentum square.
When squre of both momentum and rsi is above zero it is an uptrend when below it is down trend.
I can say it is an momentum indicator. It works only on BTC and on all exchanges of it.
-How to read it
-BackTest (2D BTC Index, momentum length = 15, linear reg = 5) it works on any BTC exchange

My exponential moving averages - Suri's EMAs
It's not an indication of anything here, it's just part of my operating in a simple and summarized way, I hope it helps someone.
Suri's EMA's indicator is nothing more than a set of exponential moving averages (EMA). They are 12, 26, 50 and 200.
Attention to the use of the indicator, it is just an INDICATOR, it should not be taken as the main point of your entry, but to guide you in your entries in favor of the trend, whether intra-day or swing.
Created for clear, monochrome screens. Make your adjustments.
Color condition, candles turn green when their close is above EMA 12 and 26.
Color condition, candles turn red when their close is below EMA 12 and 26.
Condition for colors, MME12,26,50 and 200 will turn green with price working above it.
Condition for colors, MME12, 26, 50 and 200 will turn red with price working below it.
Indication for use in time-frames = 5m, 15m, 60m, 240m. (higher hit rates)
How to use the indicator, MME 12 and 26, are the most important and led you to more entries, but we should not only consider them, we have to analyze the whole context to then make a decision.
Indicator was nicknamed by me by "Pullback Pick", it works in a simple way:
In an uptrend or downtrend, the price usually tends to return in the averages or the averages go up to the price, that being said, it is easy to observe that where the price returns would be a pullback from the last movement, so when returning to the averages, the candle that shows strength in favor of this trend, in the EMA's region, becomes a possible entry, with its stop below or above this "pullback" formed, because the stop goes there, because usually when the price returns on the EMAs they tend to to hold and replay the price in favor of the trend.
My observations:
I like to enter when the price returns to the averages smoothly, without much movement, when it touches the average 12 or 26 it is an entry, but an entry without confirmation, the gain is greater, but the chance of being stopped is higher, I like it when the price is close to the 12 and 26 averages and leaves a small candle or doji on this pullback, my entry goes to the breakout of this candle and the stop behind the candle.
THERE IS NO MIRACLE, THERE IS NO 100% HIT RATE, SO USE STOP.
Aaaaaaaaaa I was forgetting.... and the target???
As it is a trend following setup, it is cool to leave a trailing stop or update the stop as new bottoms or tops are formed.
Targeting in 1v1 is good, setup pays a lot!
Targeting in 2x1 is too good, setup pays well!
Making a target in 3x1 is more than good, setup pays sometimes, then from now on, it depends on where you are entering this "PULLBACK", if it is in the first wave, in the second, if you are going to lateralize, the market is SOVEREIGN, put in the pocket that is no longer on the market, oh it's yours!
That's it, doubts, send it there, suggestion, opinion, whatever you want.
Added a symbol at the crossing of the 12 and 26 moving averages.
I am so sorry, but i dont speak english, use google translate.
Português.
Não se trata de indicação de nada aqui, é apenas parte do meu operacional de maneira simples e resumida, espero que ajude alguém.
Indicador Suri's EMA's, nada mais é do que um conjunto de médias móveis exponenciais(MME). São elas 12, 26, 50 e 200.
Atenção para o uso do indicador, ele é apenas um INDICADOR, não deve ser tomado como o ponto principal de sua entrada, mas sim de te balizar nas suas entradas a favor da tendência, seja ela intra-day ou swing.
Criado para telas claras e monocromáticas. Façam seus ajustes.
Condição para as cores, candles ficam verdes quando o fechamento dele é acima das MME 12 e 26.
Condição para as cores, candles ficam vermelhos quando o fechamento dele é abaixo das MME 12 e 26.
Condição para as cores, MME12,26,50 e 200 ficará verde com preço trabalhando acima dela.
Condição para as cores, MME12, 26, 50 e 200 ficará vermelho com preço trabalhando abaixo dela.
Indicação para uso nos time-frame = 5m, 15m, 60m, 240m.(taxas de acerto maior)
Como utilizar o indicador, MME 12 e 26, são as mais importantes e te levaram a mais entradas, porém não devemos levar apenas elas em consideração, temos que analisar todo o contexto para então tomar decisão.
Indicador foi apelidado por mim por " Pega Pullback", ele funciona de uma maneira simples:
Em tendência de alta ou de baixa, o preço geralmente tende a retornar nas médias ou as médias irem até o preço, dito isso é fácil de se observar que onde o preço retorna seria um pullback do último movimento, portanto ao retornar nas médias, o candle que mostra força a favor dessa tendência, na região das EMA's, se torna uma possível entrada, com o seu stop abaixo ou acima desse "pullback" formado, porque o stop vai nesse local, porque geralmente quando o preço retorna nas EMAs elas tendem a segurar e voltar a jogar o preço a favor da tendência.
Minhas observações:
Eu gosto de entrar quando o preço retorna nas médias de maneira suave, sem muito movimento, quando toca na média 12 ou 26 é uma entrada, porém uma entrada sem confirmação, o ganho é maior, porém a chance de ser stopado é mais alta, eu gosto quando o preço fica perto das médias 12 e 26 e deixa um candle pequeno ou doji nesse pullback, minha entrada vai no rompimento desse candle e o stop atrás do candle.
Não existe MILAGRE, NÃO EXISTE TAXA DE ACERTO DE 100%, POR ISSO USE STOP.
Aaaaaaaaaa ia me esquecendo.... e o alvo???
Por ser um setup seguidor de tendência, o legal é deixar um trailing stop ou ir atualizando o stop conforme novos fundos ou topos são formados.
Realizar alvo no 1x1 é bom, setup paga muito!
Realizar alvo no 2x1 é bom de mais, setup paga bem!
Realizar alvo no 3x1 é mais do que bom, setup paga as vezes, ai daqui pra frente, depende de onde você está entrando nesse "PULLBACK", se é na primeira onda, na segunda, se vai lateralizar, o mercado é SOBERANO, põe no bolso que não é mais do mercado, ai é teu!
É isso, dúvidas, manda ai, sugestão, opinião, o que quiser.
Adicionado um símbolo no cruzamento das médias móveis 12 e 26.

Moving Average Filters Add-on w/ Expanded Source Types [Loxx]Moving Average Filters Add-on w/ Expanded Source Types is a conglomeration of specialized and traditional moving averages that will be used in most of indicators that I publish moving forward. There are 39 moving averages included in this indicator as well as expanded source types including traditional Heiken Ashi and Better Heiken Ashi candles. You can read about the expanded source types clicking here . About half of these moving averages are closed source on other trading platforms. This indicator serves as a reference point for future public/private, open/closed source indicators that I publish to TradingView. Information about these moving averages was gleaned from various forex and trading forums and platforms as well as TASC publications and other assorted research publications.
________________________________________________________________
Included moving averages
ADXvma - Average Directional Volatility Moving Average
Linnsoft's ADXvma formula is a volatility-based moving average, with the volatility being determined by the value of the ADX indicator.
The ADXvma has the SMA in Chande's CMO replaced with an EMA, it then uses a few more layers of EMA smoothing before the "Volatility Index" is calculated.
A side effect is, those additional layers slow down the ADXvma when you compare it to Chande's Variable Index Dynamic Average VIDYA.
The ADXVMA provides support during uptrends and resistance during downtrends and will stay flat for longer, but will create some of the most accurate market signals when it decides to move.
Ahrens Moving Average
Richard D. Ahrens's Moving Average promises "Smoother Data" that isn't influenced by the occasional price spike. It works by using the Open and the Close in his formula so that the only time the Ahrens Moving Average will change is when the candlestick is either making new highs or new lows.
Alexander Moving Average - ALXMA
This Moving Average uses an elaborate smoothing formula and utilizes a 7 period Moving Average. It corresponds to fitting a second-order polynomial to seven consecutive observations. This moving average is rarely used in trading but is interesting as this Moving Average has been applied to diffusion indexes that tend to be very volatile.
Double Exponential Moving Average - DEMA
The Double Exponential Moving Average (DEMA) combines a smoothed EMA and a single EMA to provide a low-lag indicator. It's primary purpose is to reduce the amount of "lagging entry" opportunities, and like all Moving Averages, the DEMA confirms uptrends whenever price crosses on top of it and closes above it, and confirms downtrends when the price crosses under it and closes below it - but with significantly less lag.
Double Smoothed Exponential Moving Average - DSEMA
The Double Smoothed Exponential Moving Average is a lot less laggy compared to a traditional EMA. It's also considered a leading indicator compared to the EMA, and is best utilized whenever smoothness and speed of reaction to market changes are required.
Exponential Moving Average - EMA
The EMA places more significance on recent data points and moves closer to price than the SMA (Simple Moving Average). It reacts faster to volatility due to its emphasis on recent data and is known for its ability to give greater weight to recent and more relevant data. The EMA is therefore seen as an enhancement over the SMA.
Fast Exponential Moving Average - FEMA
An Exponential Moving Average with a short look-back period.
Fractal Adaptive Moving Average - FRAMA
The Fractal Adaptive Moving Average by John Ehlers is an intelligent adaptive Moving Average which takes the importance of price changes into account and follows price closely enough to display significant moves whilst remaining flat if price ranges. The FRAMA does this by dynamically adjusting the look-back period based on the market's fractal geometry.
Hull Moving Average - HMA
Alan Hull's HMA makes use of weighted moving averages to prioritize recent values and greatly reduce lag whilst maintaining the smoothness of a traditional Moving Average. For this reason, it's seen as a well-suited Moving Average for identifying entry points.
IE/2 - Early T3 by Tim Tilson
The IE/2 is a Moving Average that uses Linear Regression slope in its calculation to help with smoothing. It's a worthy Moving Average on it's own, even though it is the precursor and very early version of the famous "T3 Indicator".
Integral of Linear Regression Slope - ILRS
A Moving Average where the slope of a linear regression line is simply integrated as it is fitted in a moving window of length N (natural numbers in maths) across the data. The derivative of ILRS is the linear regression slope. ILRS is not the same as a SMA (Simple Moving Average) of length N, which is actually the midpoint of the linear regression line as it moves across the data.
Instantaneous Trendline
The Instantaneous Trendline is created by removing the dominant cycle component from the price information which makes this Moving Average suitable for medium to long-term trading.
Laguerre Filter
The Laguerre Filter is a smoothing filter which is based on Laguerre polynomials. The filter requires the current price, three prior prices, a user defined factor called Alpha to fill its calculation.
Adjusting the Alpha coefficient is used to increase or decrease its lag and it's smoothness.
Leader Exponential Moving Average
The Leader EMA was created by Giorgos E. Siligardos who created a Moving Average which was able to eliminate lag altogether whilst maintaining some smoothness. It was first described during his research paper "MACD Leader" where he applied this to the MACD to improve its signals and remove its lagging issue. This filter uses his leading MACD's "modified EMA" and can be used as a zero lag filter.
Linear Regression Value - LSMA (Least Squares Moving Average)
LSMA as a Moving Average is based on plotting the end point of the linear regression line. It compares the current value to the prior value and a determination is made of a possible trend, eg. the linear regression line is pointing up or down.
Linear Weighted Moving Average - LWMA
LWMA reacts to price quicker than the SMA and EMA. Although it's similar to the Simple Moving Average, the difference is that a weight coefficient is multiplied to the price which means the most recent price has the highest weighting, and each prior price has progressively less weight. The weights drop in a linear fashion.
McGinley Dynamic
John McGinley created this Moving Average to track price better than traditional Moving Averages. It does this by incorporating an automatic adjustment factor into its formula, which speeds (or slows) the indicator in trending, or ranging, markets.
McNicholl EMA
Dennis McNicholl developed this Moving Average to use as his center line for his "Better Bollinger Bands" indicator and was successful because it responded better to volatility changes over the standard SMA and managed to avoid common whipsaws.
Non lag moving average
The Non Lag Moving average follows price closely and gives very quick signals as well as early signals of price change. As a standalone Moving Average, it should not be used on its own, but as an additional confluence tool for early signals.
Parabolic Weighted Moving Average
The Parabolic Weighted Moving Average is a variation of the Linear Weighted Moving Average. The Linear Weighted Moving Average calculates the average by assigning different weight to each element in its calculation. The Parabolic Weighted Moving Average is a variation that allows weights to be changed to form a parabolic curve. It is done simply by using the Power parameter of this indicator.
Recursive Moving Trendline
Dennis Meyers's Recursive Moving Trendline uses a recursive (repeated application of a rule) polynomial fit, a technique that uses a small number of past values estimations of price and today's price to predict tomorrows price.
Simple Moving Average - SMA
The SMA calculates the average of a range of prices by adding recent prices and then dividing that figure by the number of time periods in the calculation average. It is the most basic Moving Average which is seen as a reliable tool for starting off with Moving Average studies. As reliable as it may be, the basic moving average will work better when it's enhanced into an EMA.
Sine Weighted Moving Average
The Sine Weighted Moving Average assigns the most weight at the middle of the data set. It does this by weighting from the first half of a Sine Wave Cycle and the most weighting is given to the data in the middle of that data set. The Sine WMA closely resembles the TMA (Triangular Moving Average).
Smoothed Moving Average - SMMA
The Smoothed Moving Average is similar to the Simple Moving Average (SMA), but aims to reduce noise rather than reduce lag. SMMA takes all prices into account and uses a long lookback period. Due to this, it's seen a an accurate yet laggy Moving Average.
Smoother
The Smoother filter is a faster-reacting smoothing technique which generates considerably less lag than the SMMA (Smoothed Moving Average). It gives earlier signals but can also create false signals due to its earlier reactions. This filter is sometimes wrongly mistaken for the superior Jurik Smoothing algorithm.
Super Smoother
The Super Smoother filter uses John Ehlers’s “Super Smoother” which consists of a a Two pole Butterworth filter combined with a 2-bar SMA (Simple Moving Average) that suppresses the 22050 Hz Nyquist frequency: A characteristic of a sampler, which converts a continuous function or signal into a discrete sequence.
Three pole Ehlers Butterworth
The 3 pole Ehlers Butterworth (as well as the Two pole Butterworth) are both superior alternatives to the EMA and SMA. They aim at producing less lag whilst maintaining accuracy. The 2 pole filter will give you a better approximation for price, whereas the 3 pole filter has superior smoothing.
Three pole Ehlers smoother
The 3 pole Ehlers smoother works almost as close to price as the above mentioned 3 Pole Ehlers Butterworth. It acts as a strong baseline for signals but removes some noise. Side by side, it hardly differs from the Three Pole Ehlers Butterworth but when examined closely, it has better overshoot reduction compared to the 3 pole Ehlers Butterworth.
Triangular Moving Average - TMA
The TMA is similar to the EMA but uses a different weighting scheme. Exponential and weighted Moving Averages will assign weight to the most recent price data. Simple moving averages will assign the weight equally across all the price data. With a TMA (Triangular Moving Average), it is double smoother (averaged twice) so the majority of the weight is assigned to the middle portion of the data.
The TMA and Sine Weighted Moving Average Filter are almost identical at times.
Triple Exponential Moving Average - TEMA
The TEMA uses multiple EMA calculations as well as subtracting lag to create a tool which can be used for scalping pullbacks. As it follows price closely, it's signals are considered very noisy and should only be used in extremely fast-paced trading conditions.
Two pole Ehlers Butterworth
The 2 pole Ehlers Butterworth (as well as the three pole Butterworth mentioned above) is another filter that cuts out the noise and follows the price closely. The 2 pole is seen as a faster, leading filter over the 3 pole and follows price a bit more closely. Analysts will utilize both a 2 pole and a 3 pole Butterworth on the same chart using the same period, but having both on chart allows its crosses to be traded.
Two pole Ehlers smoother
A smoother version of the Two pole Ehlers Butterworth. This filter is the faster version out of the 3 pole Ehlers Butterworth. It does a decent job at cutting out market noise whilst emphasizing a closer following to price over the 3 pole Ehlers.
Volume Weighted EMA - VEMA
Utilizing tick volume in MT4 (or real volume in MT5), this EMA will use the Volume reading in its decision to plot its moves. The more Volume it detects on a move, the more authority (confirmation) it has. And this EMA uses those Volume readings to plot its movements.
Studies show that tick volume and real volume have a very strong correlation, so using this filter in MT4 or MT5 produces very similar results and readings.
Zero Lag DEMA - Zero Lag Double Exponential Moving Average
John Ehlers's Zero Lag DEMA's aim is to eliminate the inherent lag associated with all trend following indicators which average a price over time. Because this is a Double Exponential Moving Average with Zero Lag, it has a tendency to overshoot and create a lot of false signals for swing trading. It can however be used for quick scalping or as a secondary indicator for confluence.
Zero Lag Moving Average
The Zero Lag Moving Average is described by its creator, John Ehlers, as a Moving Average with absolutely no delay. And it's for this reason that this filter will cause a lot of abrupt signals which will not be ideal for medium to long-term traders. This filter is designed to follow price as close as possible whilst de-lagging data instead of basing it on regular data. The way this is done is by attempting to remove the cumulative effect of the Moving Average.
Zero Lag TEMA - Zero Lag Triple Exponential Moving Average
Just like the Zero Lag DEMA, this filter will give you the fastest signals out of all the Zero Lag Moving Averages. This is useful for scalping but dangerous for medium to long-term traders, especially during market Volatility and news events. Having no lag, this filter also has no smoothing in its signals and can cause some very bizarre behavior when applied to certain indicators.
________________________________________________________________
What are Heiken Ashi "better" candles?
The "better formula" was proposed in an article/memo by BNP-Paribas (In Warrants & Zertifikate, No. 8, August 2004 (a monthly German magazine published by BNP Paribas, Frankfurt), there is an article by Sebastian Schmidt about further development (smoothing) of Heikin-Ashi chart.)
They proposed to use the following:
(Open+Close)/2+(((Close-Open)/( High-Low ))*ABS((Close-Open)/2))
instead of using :
haClose = (O+H+L+C)/4
According to that document the HA representation using their proposed formula is better than the traditional formula.
What are traditional Heiken-Ashi candles?
The Heikin-Ashi technique averages price data to create a Japanese candlestick chart that filters out market noise.
Heikin-Ashi charts, developed by Munehisa Homma in the 1700s, share some characteristics with standard candlestick charts but differ based on the values used to create each candle. Instead of using the open, high, low, and close like standard candlestick charts, the Heikin-Ashi technique uses a modified formula based on two-period averages. This gives the chart a smoother appearance, making it easier to spots trends and reversals, but also obscures gaps and some price data.
Expanded generic source types:
Close = close
Open = open
High = high
Low = low
Median = hl2
Typical = hlc3
Weighted = hlcc4
Average = ohlc4
Average Median Body = (open+close)/2
Trend Biased = (see code, too complex to explain here)
Trend Biased (extreme) = (see code, too complex to explain here)
Included:
-Toggle bar color on/off
-Toggle signal line on/off

Divergence Macd+RSI Fast[RSU] -- No RepaintThis indicator combines the divergence of rsi and macd and displays it on the candlestick chart.
RSI:
1. When rsi is at a high point, once it falls by 1 k line, it will detect the divergence from the previous high point. This can quickly find the divergence that has taken effect and help you quickly capture the trend before a sharp decline or rise.
The difference between other RSI divergence indicators: the official divergence indicator is to detect the 5 and the k line, which may lead to a large amount of decline.
2. This indicator detects the previous high and the previous low of 5, 10, 20 lengths at the same time, instead of only detecting a fixed length, so that more deviations can be found.
MACD:
1. When MACD-diff line(orange color) is at a high point, once it falls by 1 k line, it will detect the divergence from the previous high point. This can quickly find the divergence that has taken effect and help you quickly capture the trend before a sharp decline or rise.
2. This indicator detects the previous high and the previous low of 5, 10, 20, 40 , 60 lengths at the same time, instead of only detecting a fixed length, so that more divergences can be found.
Notice:
Because it is a quick divergence detection, it is recommended to confirm that the divergence takes effect after the current k is completely closed first. I have identified this state in the indicator as "k not end".
Disadvantages and Risks:
Since it is a quick discovery, there will be error identification. Error divergences will recolor to grey.
Suggestion:
Use Alert catching divergence occurrences.
Please do not:
Don't go short in the uptrend, don't go long in the downtrend.
Top divergences that occur because of a strong uptrend are usually only temporary pullbacks. Bottom divergences in persistent declines are also temporary rallies. Do not attempt to trade such low-return trades.
It is recommended to use the divergence indicator when the stock price has made a new high and retraced, and once again made a new high, because this often leads to the end of the trend.
Divergence how to use:
1. After the previous candlestick was completely closed, a bottom divergence was found.
2. Open an long order at the beginning of the second bar, or as close to the bottom as possible (because the stop loss will be smaller).
3. Break the stop loss price below the previous low where the divergence occurred, which already means that the divergence is wrong.

MME MTF CCIHi All,
This is a Dual/Multi TF CCI script to be used for Intraday as well as positional system.
Intraday:
Chart TF : 5 mins
Underlying Trend CCI : CCI 34 of 30 mins TF
Immediate Trend CCI : CCI 34 of 5 mins TF
Execution CCI : CCI 8 of 5 mins TF
The CCIs are used for entry, exit during momentum breakouts or pullbacks.
General Long Setup:
Buy at CCI-8 5m below -135, when CCI-34 30 mins is > +100. Long exit when CCI 34 5 min < -60
General Short Setup:
Sell at CCI-8 5m above -135, when CCI-34 30 mins is < -100. Short exit when CCI 34 5 min > +60
The same CCI settings can be used for positional or investment per appropriate timeframes one is interested to trade, along with HTF above in ratio 1:5.
Hope its helpful!

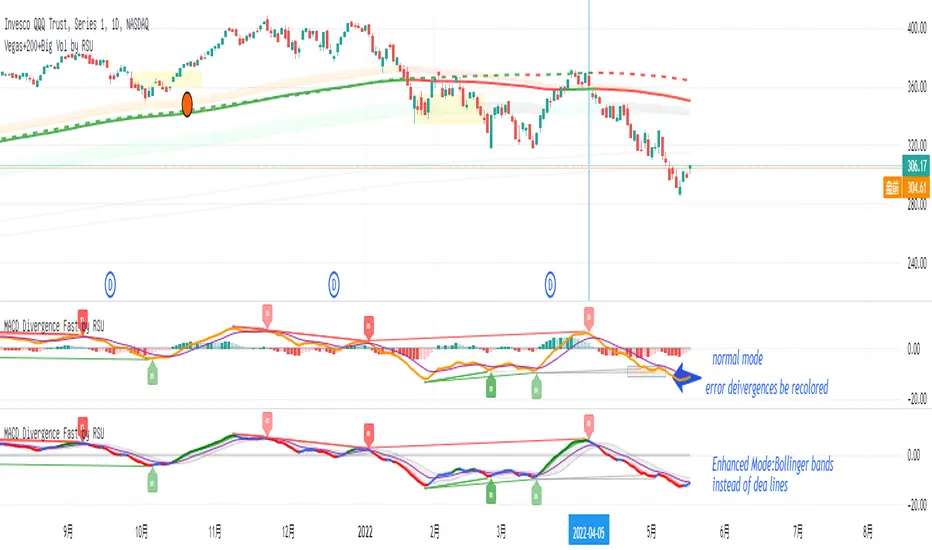
MACD Divergence Fast by RSUAdvantages:
1. When MACD-diff line(orange color) is at a high point, once it falls by 1 k line, it will detect the divergence from the previous high point. This can quickly find the divergence that has taken effect and help you quickly capture the trend before a sharp decline or rise.
2. This indicator detects the previous high and the previous low of 5, 10, 20, 40, 60 lengths at the same time, instead of only detecting a fixed length, so that more divergences can be found.
Notice:
Because it is a quick divergence detection, it is recommended to confirm that the divergence takes effect after the current k is completely closed first. I have identified this state in the indicator as "k not end".
Disadvantages and Risks:
Since it is a quick discovery, there will be error identification. Error divergences will recolor to grey.
Suggestion:
Use “RSI Divergence Fast by RSU” at the same time, because RSI divergence usually occurs before macd, if the position diverges at the same time, the probability of success will increase.
Please do not:
Don't go short in the uptrend, don't go long in the downtrend.
Top divergences that occur because of a strong uptrend are usually only temporary pullbacks. Bottom divergences in persistent declines are also temporary rallies. Do not attempt to trade such low-return trades.
It is recommended to use the divergence indicator when the stock price has made a new high and retraced, and once again made a new high, because this often leads to the end of the trend.
Divergence how to use:
1. After the previous K line was completely closed, a bottom divergence was found.
2. Open an long order at the beginning of the second bar, or as close to the bottom as possible (because the stop loss will be smaller).
3. Break the stop loss price below the previous low where the divergence occurred, which already means that the divergence is wrong.
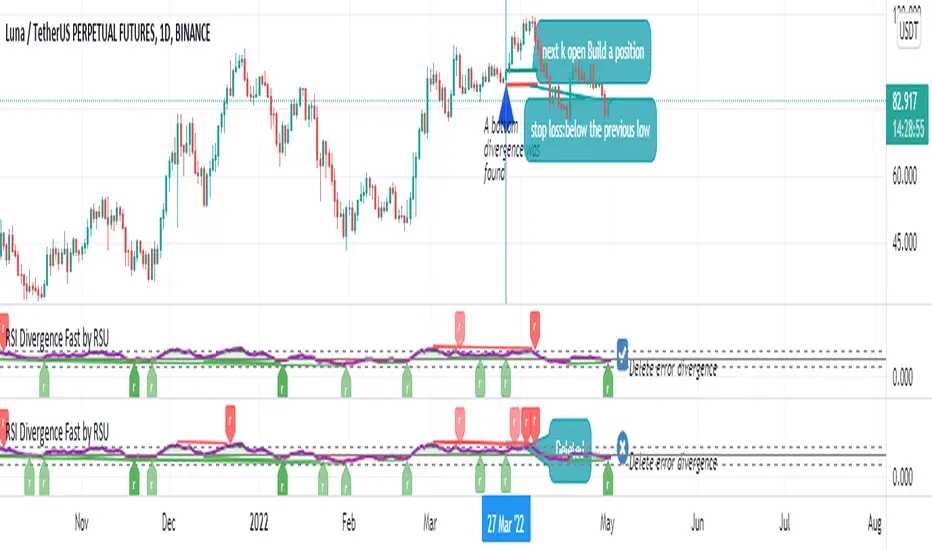
RSI Divergence Fast by RSUAdvantages:
1. When rsi is at a high point, once it falls by 1 k line, it will detect the divergence from the previous high point. This can quickly find the divergence that has taken effect and help you quickly capture the trend before a sharp decline or rise.
The difference between other RSI divergence indicators: the official divergence indicator is to detect the 5 and the k line, which may lead to a large amount of decline.
2. This indicator detects the previous high and the previous low of 5, 10, 20 lengths at the same time, instead of only detecting a fixed length, so that more deviations can be found.
Notice:
Because it is a quick divergence detection, it is recommended to confirm that the divergence takes effect after the current k is completely closed first. I have identified this state in the indicator as "k not end"
Disadvantages and Risks
Since it is a quick discovery, there will be error identification. I listed the difference between the two indicators when deleting errors. The indicator turns off the "delete error" option by default.
Please do not:
Don't go short in the uptrend, don't go long in the downtrend.
Top divergences that occur because of a strong uptrend are usually only temporary pullbacks. Bottom divergences in persistent declines are also temporary rallies. Do not attempt to trade such low-return trades.
It is recommended to use the divergence indicator when the stock price has made a new high and retraced, and once again made a new high, because this often leads to the end of the trend.
Divergence how to use:
1. After the previous K line was completely closed, a bottom divergence was found.
2. Open an long order at the beginning of the second bar, or as close to the bottom as possible (because the stop loss will be smaller).
3. Break the stop loss price below the previous low where the divergence occurred, which already means that the divergence is wrong.
RSI usage:
1. RSI is above the 50 line, in an uptrend, below 50 in a downtrend.
2. Above 70 is overbought, falling below the oversold zone may mean the end of the uptrend.
Below 30 is oversold, above the oversold zone may mean the end of the downtrend.
ZigZag SupertrendBack to my favourite supertrend. But, this time on the basis of zigzag pivots.
This is similar to forming supertrend based on pivot high lows - but instead of using pivot poitns, we are using zigzag pivots here.
Zigzag is derived using the same method as this script:
But, have removed labels and display options of zigzag. Older lines are also immediately deleted so that it can work well in lower timeframes without any error. Number of zigzaglines to be kept in memory depends on the parameter History
WaitForConfirmation option when selected only considers the confirmed zigzaglines and will ignore present zigzag line which is forming. This is not going to make much difference as the present zigzag line will be always opposite to low or high it formed and hence will not affect the stop loss levels or reversals.
WaitForClose is for supertrend determination. When checked uses close prices. If unchecked uses highs and lows for supertrend direction update.
ATR parameters allow you to set an adjustment below pivot high lows. This is required because support and resistence are often zones rather than single point. Hence, adds bit more wiggle room for trend continuation and delays frequent reversals on pullbacks.

Multi MA CloudsEMA Clouds are used for identifying trends. It helps to see moving averages as in a range especially when you look at them in Micro time frames like 1/5/10/15/30 mins. So these Clouds could be used for Intraday trading for identifying trends and pullbacks.
For example, on a 10min chart, once you see a parabolic move, don't take trade until the bar touches 5/13 or 8/9 EMA clouds.
There are other EMA cloud scripts available but this one gives you option to choose MA Type and Source in addition to providing all well known MA range in one script. You can modify the MA length as you wish. So you can disable one you don't want to see on the chart.
Please look at my other scripts at www.tradingview.com

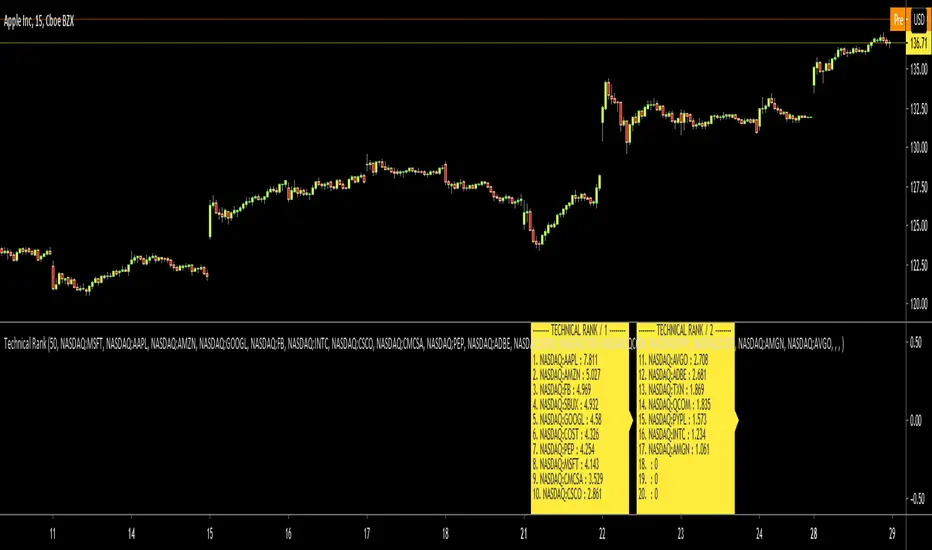
Technical RankHello Traders,
Technical Rank (TR) was authored by John Murphy . Technical Rank shows how a security is performing relative to its peers. Multiple moving averages, rate of change and the Relative Strength Index (RSI) indicators are used to calculate the Technical Rank. These values are mathematically manipulated with percentage factors and then summed together. there are 3 parts, long term, middle term and short term. for Long term part Moving Average with length 200 (30%) and Rate of Change with the length 125 (30%) are used, for middle term part, Moving Average with length 50 (15%) and Rate of Change with the length 20 (15%) are used and for short term part, PPO (5%) and RSI (5%) used.
Technical Rank is created using the following formula and weightings:
Long-Term Indicators (weighting): Percent above/below the 200-day exponential moving average (EMA) (30% weight) and the 125-day rate-of-change (ROC) (30% weight).
Medium-Term Indicators (weighting): Percent above/below 50-day EMA (15%) and the 20-day rate-of-change (15%).
Short-Term Indicators (weighting): Three-day slope of percentage price oscillator histogram divided by three (5%) and the relative strength index (5%).
The scripts calculates Technical Rank for 10 different securities and sorts them by Technical Rank value. A ranking of zero indicates the stock is the weakest in the group technically. A rank of 100 indicates the stock ranks highest in terms of technical performance. An increasing Technical Rank means the stock's price performance is showing strength relative to the group of stock being analyzed. A decreasing Technical Rank shows deteriorating relative price performance. Securities in the top 3-4 will have a technical rank of 70 or higher. You should focus on these relatively strong securities for potential long positions on pullbacks. You can also use the technical rank to avoid weak securities (in the bottom 3-4). I recommend you to check Technical Rank for the securities in multiple time frames.
You can choose the symbols as you want but you should choose the symbols with the same session info. for example only Cryptos, only Stocks, only FX pairs etc. (not mix of them).
Enjoy!
Ehlers Correlation Trend Indicator CTI by Cryptorhythms [CR]Ehlers Correlation Trend Indicator CTI by Cryptorhythms
📜Intro
In his article “Correlation As A Trend Indicator” in issue May 2020 of TASC, author John Ehlers introduces a new trend indicator that is based on the correlation between a security’s price history and the ideal trend: a straight line. He describes methods for using the indicator to not only identify the onset of new trends but to identify trend failures as well. He presents what looks like a simple and elegant idea for a trend-detection and mode-switching indicator.
📋Comments
Careful market selection may be the key to a correct application of the indicator. Even such barebone rules could shine with stocks like AAPL that tend to develop prolonged trends. But for others like CAT, which can keep oscillating in ranges for years, results will be much less impressive. They require a different approach. For example, you would want to buy when Correlation Trend falls significantly below zero and sell when it reaches positive values.
Therefore, it would be an interesting problem to research Correlation Trend’s ability to identify the switch to a cycle mode. That might help develop countertrend systems and
trade pullbacks. Another possible application might be to act as a system filter of change from trending mode to mean-reversion mode.
Extras
As usual when porting indicators to the library here on tradingview, I like to add some extra flare!
💠Customizable Overbought and Oversold Zones for Alert Creation
💠Bar coloration based on trade state for easy visual at a glance chart checking
💠Some basic example Entry and Exit conditions and a simple Trade State Engine to get you going creating your own strategy
Enjoy!
👍 We hope you enjoyed this indicator and find it useful! We post free crypto analysis, strategies and indicators regularly. This is our 81st script on Tradingview!
Forecasting - Locally Weighted RegressionThis is a continuation of the series on forecasting techniques.
Locally weighted linear regression is a non-parametric algorithm, that is, the model does not learn a fixed set of parameters as is done in ordinary linear regression. Rather parameters Θ (theta) are computed individually for each query point x. While computing Θ, a higher “preference” is given to the points in the training set lying in the vicinity of x than the points lying far away from x.
For a detailed discussion see www.geeksforgeeks.org
and for the formula see fawda123.github.io
Here you can see a shortcut application of this technique to time series with results unexpectedly favorable for price data labelling.
Good at detecting pullbacks. Can be incorporated into a trading system as a signal generator. Alerting is included.

EURUSD 15mThis strategy is a EURUSD 15-minute trend-following signal indicator built around an EMA “basis” and ATR volatility bands. It uses a 20-period EMA as the midline and ATR to form inner/outer channels, helping identify pullbacks and avoid chasing extremes. A 150-period EMA acts as the trend filter, and signals are only considered in the direction of the trend (optionally requiring the trend EMA to slope). Quality filters include ADX strength, a confirmation candle rule, a volatility filter (ATR vs ATR moving average), a “room to outer band” filter, plus anti-spam arming and a cooldown timer to reduce repeated signals. The main entry logic is DR (deep retracement back to the basis and reclaim) with an optional BO (breakout across the inner band) feature. Mode presets (More Trades / Balanced / Quality) adjust strictness to trade off frequency versus selectivity.

My Swiftlike Algo Backtest ATR SL/TP HH/HL/LH/LL BOS/CHOCHSwift-Like Algo is a trend-following strategy that trades pullbacks using EMA trend direction, market structure (HH/HL/LH/LL), and ATR-based risk management.
It enters only in the direction of the trend, with automatic Stop-Loss, TP1, and TP2, and supports full strategy backtesting.
Best used on 15m–4H timeframes for crypto, forex, and indices.
⚠️ For educational and testing purposes only.
