Bollinger Bands + Moving Average (BBMA Oma Ally)Found this strategy in babypips forums.babypips.com
This strategy using BB and MA
BBMA Oma Ally Trading Technique
I’m just sharing this Forex Technique that helping me making positive result.
In BBMA, BB (Bollinger Bands) act as Dynamic Support and Resistance.
SETTING OF BBMA - BOLLINGER BANDS
Period : 20
Deviations : 2
Shift : 0
Apply to : Close
Style : Dodge Blue
MA (Moving Average) are used to detect potential entry point.
SETTING OF BBMA - MOVING AVERAGE
Ma5 Hi
Period : 5
Ma Method : Linear Weighted
Apply to : High
Style : Red
Ma10 Hi
Period : 10
Ma Method : Linear Weighted
Apply to : High
Style : Yellow
Ma5 Low
Period : 5
Ma Method : Linear Weighted
Apply to : Low
Style : Magenta
Ma10 Low
Period : 10
Ma Method : Linear Weighted
Apply to : Low
Style : White
Ma50
Period : 50
Ma Method : Exponential
Apply to : Close
Style : Lime
.
EXTREM (SIGNAL)
Extrem is an early signal to say the Market journey is beginning to end - but not yet confirmed
Will only confirm when there is a reversal candle.
Extrem is not valid when there is a CS momentum, although Ma outside BB.
CHARACTERISTICS OF EXTREM
Ma out of Top / Low BB (will not valid if there is cs momentum, although Ma is outside BB)
Reverse candle must exist, as it indicates the journey of a Market is ending (not necessarily 1 or 2 cs)
Retest candle (entry point)
Entry at Highest or Lowest volume
Entry retest candle at Ma5 or body candle
MHV (LOSS VOLUME MARKET) (SETUP)
It is a setup for the beginning of long distance Market journey
This setup gives a validation for the Extrem signal earlier
It is to show the loss of strength for the market.
MHV is valid once CSA (direction candle) appear
***If the candle close NOT above or below Top / Low BB after the first Reentry, after MHV there is a directional candlestick, then there will be a reentry and after the reentry there is no momentum “COMPULSORY TP”
CHARACTERISTICS OF MHV :
Candle CANNOT close above or below Top / Low BB
Must have reverse candle, because reverse candle is confirming the end of the journey (Marking at candle body)
Retest candle (entry point) at Ma5 or highest volume / lowest at that current time
Must happen after Extrem
TYPES OF MHV
5 types but i can only post 1 photo. So sorry i cant give more on this.
RE-ENTRY
CHARACTERISTICS OF REENTRY
Candle close can not pass Ma5 / Ma10
It will be strong when the candle close does not pass Ma5 / Ma10 and also Mid BB
Candle close did not come in. He found Ma5 / Ma10 and mid BB at that Time would make the re-entry stronger
If there is a re-entry in Ma5 / Ma10 and mid BB, the minimum of 3 drops of candles or increments (follow TF) re-entry will be strong
Following market trend, then just search for re-entry and entry
Wait for the second candle, because the first candle validates the reentry and the second candle is for entry
Search in scripts for "retest"

|AG| VWAP ANALYSIS|AG| VWAP ANALYSIS
The volume-weighted average price (VWAP) is a trading benchmark used by traders that gives the average price security has traded throughout the day, based on both volume and price.
It is important because it provides traders with insight into both the trend and value of the security.
VWAP is calculated by adding up the $ traded for every transaction (price multiplied by the number of shares traded) and then dividing by the total shares traded.
A detailed formula and calculations could be found here:
-> fanf2.user.srcf.net
Actually, TradingView has an option for Anchored Vwap is a really good implementation for specific analysis.
The following script takes into account the #Time_Period_Change and plots the VWAP calculation.
The #Time_Period Available for this script are:
-> Day
-> Week
-> Monthly
-> Quarter
-> Year
1. The option that we have is the SOURCE:
-> HLC3 (High, Low, Close)/3 is the right way to calculate VWAP.
-> But I included other traditional options:
-> open, high, low, close, hl2, hlc3, ohlc4
2. The option of Turn ON/OFF VWAP
-> Timeframe selection:
-> All, 1. Day, 2. Week, 3. Month, 4. Quarter, 5. Year, 6. >=Weekly, 7. >=Montlhy
-> With this, we could select the time for plotting the VWAP. And some cool features such as >= that we are going to plot different Timeframes VWAP calculations.
-> Vwap Label:
-> We could select if show labels or not
3. The option of Turn ON/OFF Previous VWAP Level
-> VWAP of one selected Time Period is going to end with a final price this level most of the time is retested and gives us a good opportunity for entry into one trade.
Or could be used as Stop Loss.
-> Timeframe selection:
-> 1. Day, 2. Week, 3. Month, 4. Quarter, 5. Year, 6. >=Weekly, 7. >=Montlhy, 8. >=Daily
-> Factor
-> The factor options lead as increment the extension of the previous time period.
-> Example: D is the normal time period and with factor, we change from 1D to 2D in order to extend previous levels of VWAP.
->The Factor option is only available in 1. Day and 2. Week. With a Min Value of 1 and a Maximum Value of 50.
-> Labels:
-> We could select if show labels or not
4. The option of Turn ON/OFF Standard Deviation Bands
-> Label:
-> We could select if show labels or not
-> Timeframe selection:
-> 1. Day, 2. Week, 3. Month, 4. Quarter, 5. Year
5. The option of Turn ON/OFF Previous Standard Deviation
-> Timeframe selection:
-> None, 1. Day, 2. Week, 3. Month, 4. Quarter, 5. Year, 6. >=Weekly, 7. >=Montlhy, 8. Quarter & Year
-> STDEV LEVEL
-> Since there are different options for Standard Deviation I included 4 options
-> 1
-> 2
-> 3
-> User Selection
-> In this option we could select any NUMBER for STVDEV 0.25 of step.
-> Label:
-> We could select if show labels or not
6. The Lockback Setting
-> This Script also includes an option to only plot a certain amount of days back.
The main reason in order to have a more clear chart.
-> We could select between:
-> PLOT ALL
-> CUSTOM
-> If we select Custom Then we could select the Number of Days Back that is going to be plotted.
7. Color Theme
Here we select the color (Visual Desing)
-> Color Theme
-> Text Color
-> Here I use the recent input.color option added for TradingView making the color selection really simple
8. Time Period Highlighter
-> In this option, we could select one time period in order to plot one tiny background and identify the change in the time period.
-> Timeframe selection:
-> 1. Day, 2. Week, 3. Month, 4. Quarter, 5. Year
9. Label Offset
-> Finally, this option leads us to change the position of the labels into the X-axis by default 20.
This script has many options the combinations and the possibilities of making different analyses are bast.
Here some examples of what we could make:
DEFAULT SETTING:
PREVIOUS VWAP FOR TIME PERIOD >= WEEK
(work good as S&D levels)
PREVIOUS VWAP Week WITH A FACTOR OF 4
STANDARD DEVIATION BANDS - DAY
STANDARD DEVIATION BANDS - WEEK
STANDARD DEVIATION BANDS - MONTH
STANDARD DEVIATION BANDS - QUARTER
STANDARD DEVIATION BANDS - YEAR
PREVIOUS STANDARD DEVIATION - DAY SDTV 3
PREVIOUS STANDARD DEVIATION - WEEK SDTV 3
USING STANDARD DEVIATION BANDS - WEEK
WITH LOCKBACK -> PLOT ALL
WITH CUSTOM 30 DAYS
I think the options possibilities of analysis using #VWAP are truly awesome.
I like the relationship that one previous VWAP has with Standard Pivot Points.
Good Luck,
Anderson,

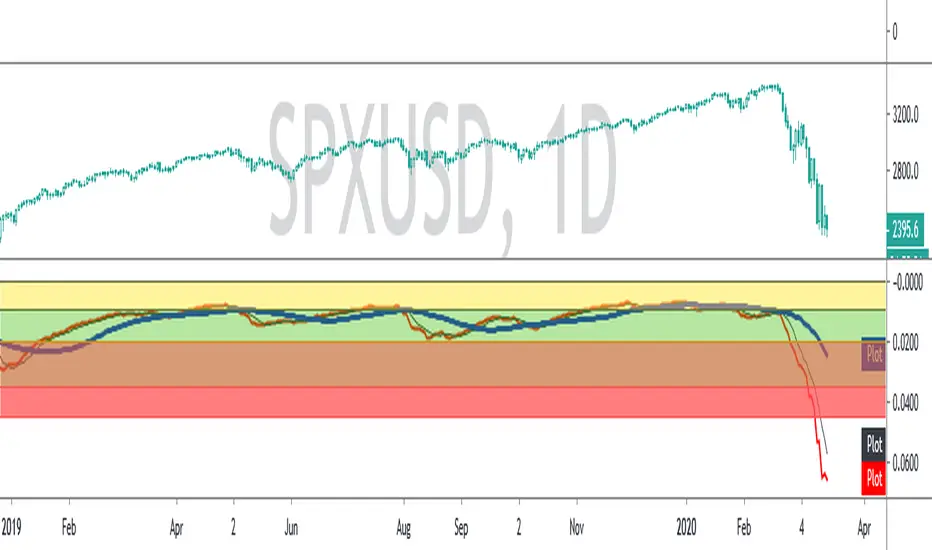
SPX ATR14 indicator This indicator works well on SPX 500
Needs to be inverted so Red is at the bottom
Levels of pullbacks are used to determine trend .
Pullback to the Green zone normal Bull Market
Pullback to the Brown Zone are warning of potential Bear Market , but if it holds , just a deeper correction within a Bull Market
Pullbacks into the Red , Bear Market .
In Bear , wait until indicator is forming a reversal trend up and price should make a divergence by either making a new low or retesting previous low.
The Blue MA is the 33 MA and can be used as a form of stop trend indicator on the cross below the MA
Market Effectivity area v1Cheap horizontal levels on chart
idea is: When spread is low and volume is high, then price is well accepted and will be retested in future. Areas without such "market efficiency" will be passed fast without stopping or rejected.
Smart S&D v1.0 [Breaker Blocks]Automatically marks off supply and demand zones based on previous and consequent candles.
Previous and consequent candles can be changed.
Recommend 5:3 for 15m, or 7:5 for 10m
ATR default 1
Volume confirmation off by default but there as an option
The number on bars is the number of times price has bounced off the zone. After 3 bounces (this can be changed/personalized in settings) the zone is exhausted and removed.
If price breaks through a zone, it becomes a breaker zone, flipping supply to demand, or demand to supply. Ideal for a break and retest setup.

Ultimate Futures Daytrade Suite v1 - The Strategy GuideHere is the complete **Strategy Guide** translated into English.
---
# 📘 Ultimate Futures Daytrade Suite – The Strategy Guide
### 1. The Visual Legend (What is what?)
Before you trade, you need to understand the hierarchy of your lines. Not every line has the same importance.
* **🟣 Daily EMA 50 (Neon Violet):** The **"Big Boss"**. It determines the **Macro Trend**.
* *Price above:* We are primarily looking for Longs.
* *Price below:* We are primarily looking for Shorts.
* **🟢 4h EMA 50 (Neon Green):** The **"Swing Trend"**. Your most important level for **Pullback Entries** (Re-entries).
* **🟡 POC (Gold) & TPO:** The **"Magnet"**. Price often returns here.
* *Rule:* Never open a trade directly *on* the POC (Risk of "Chop"). Use it as a **Target** (Take Profit).
* **🟠 IB High/Low (Orange Lines):** The **"Daily Structure"**.
* A breakout from the IB (Initial Balance) often indicates the trend direction for the day.
* **🟥/🟩 Boxes (Supply/Demand):** Resistance and Support zones from the 1h timeframe.
* **⬜ FVG Boxes:** "Gaps" in the market that are often filled.
---
### 2. The Trading Workflow (Top-Down Method)
Go through this mental checklist before every trade:
#### Step 1: Trend Check (The Traffic Light)
Look at the **Violet Line (Daily)** and the **Green Line (4h)**.
* **Bullish:** Price is above Violet AND above Green. -> *Focus: Buy dips.*
* **Bearish:** Price is below Violet AND below Green. -> *Focus: Sell rallies.*
* **Mixed:** Price is between Violet and Green. -> *Caution! Market is undecided (Range Trading).*
#### Step 2: Location (The Context)
Where is the price currently located?
* Are we at a **Green Demand Zone**?
* Are we testing the **4h EMA 50 (Green)** from above?
* Are we at the **VWAP**?
* *Never trade in "No Man's Land"!* Wait until the price touches one of your lines.
#### Step 3: Trigger (The Execution)
Now zoom into your lower timeframe (e.g., 5min or 15min).
* Wait for a reaction at the zone.
* Use the **EMA 9 (Yellow)** as a momentum trigger. If price breaks the EMA 9 and closes above/below it, that is your "Go".
---
### 3. The Setup Blueprints
Here are the two most profitable scenarios you can trade with this script:
#### A) The "Golden Trend" Setup (Long)
* **Context:** Price > **Daily EMA (Violet)**.
* **Preparation:** Price corrects (drops) back to the **4h EMA 50 (Green)** or to the **VWAP**.
* **Confluence:** Ideally, there is also a **Demand Zone (Green Box)** or an **FVG** at that level.
* **Entry:** As soon as a candle touches the zone and closes bullish again (or reclaims the EMA 9).
* **Stop-Loss:** Below the 4h EMA 50.
* **Take-Profit:** Next **Supply Zone (Red)** or the **IB High (Orange)**.
#### B) The "Daytrade Breakout" (Intraday)
* **Context:** Price opens inside yesterday's Value Area.
* **Signal:** Price breaks through the **IB High (Orange)** with momentum.
* **Filter:** Price must be above the **VWAP**.
* **Entry:** On the retest of the IB High or directly on the breakout.
* **Target:** Price often trends in that direction for the rest of the day.
---
### 4. Warning Signals (When NOT to trade)
1. **The "Concrete Ceiling":** If you want to go Long, but the **Violet Daily EMA 50** is running directly above you. This is massive resistance. Better wait until it is broken.
2. **The "POC Dance":** If price is dancing sideways around the **Gold Line (POC)**. This is a "No-Trade Zone". Day traders lose the most money here due to fees and whipsaws.
3. **Overextension:** If price is extremely far away from the **4h EMA 50 (Green)** (Rubber Band Effect). Do not enter in the trend direction here; wait for a pullback to the line.
### Summary
Your chart is now telling you a story:
* **Violet** tells you the Direction.
* **Green** gives you the Entry.
* **Red/Green Boxes** show you the Obstacles.
* **Yellow (EMA 9)** gives you the Timing.
Good luck with the Suite! This is a setup similar to what institutional traders use.

PHEN ATLAS - Market Map & Playbook [PhenLabs]📊 PHEN ATLAS 🎂 #50 🎂
Version: PineScript™ v6
📌 Description
The PHEN ATLAS marks a historic milestone as the 50th official release from PhenLabs . This is a critical release you do not want to miss, serving as a comprehensive Market Map and Playbook designed to provide traders with a complete structural overview of price action. By synthesizing Market Structure, Liquidity concepts, and Regime detection, this script solves the problem of "analysis paralysis" by grading price action in real-time. It moves beyond simple indicators by offering a quantified "Playbook" that scores trade setups from 0 to 100, helping traders focus exclusively on high-probability opportunities while automating the complex math of position sizing and risk management.
🚀 Points of Innovation
Proprietary Scoring Engine: Unlike standard indicators, this script assigns a quantitative score (0-100) to every potential trade based on confluence factors like HTF alignment and displacement.
Dynamic Regime Detection: Features an integrated dashboard that classifies the market into specific phases (Expansion, Trend, Range) using ADX and EMA alignment logic.
Smart Liquidity Pools: Automatically identifies and visualizes resting liquidity, tracking when these pools are "swept" to generate high-probability reversal signals.
Integrated Trade Manager: Automates the calculation of Stop Loss, Take Profit (1:2 and 1:3), and Position Size based on account balance and risk percentage directly on the chart.
Multi-Mode Interface: Offers three distinct visual modes—Clean, Pro, and Sniper—allowing users to toggle between deep analysis and clutter-free execution instantly.
🔧 Core Components
Structure Module: Identifies Pivots, Break of Structure (BOS), and Change of Character (CHoCH) to define the current market bias.
Liquidity Engine: Plots liquidity pools at key swing points and detects "Sweeps" where price grabs liquidity before reversing.
Regime Filter: Uses a combination of EMAs (21/50) and ADX to determine if the market is trending or ranging, filtering out low-quality signals.
Setup Validator: Monitors for three specific setup types (Sweep, Snapback, FVG Retest) and triggers alerts only when specific scoring thresholds are met.
🔥 Key Features
Automated detection of High Timeframe (HTF) structure without repainting issues.
Real-time grading of price displacement to validate institutional intent.
Visual Risk/Reward boxes that automatically adjust to the volatility (ATR) of the asset.
Fair Value Gap (FVG) detection with auto-mitigation tracking to clean up the chart.
Customizable alerts for A+ setups, regime changes, and trade invalidations.
Detailed dashboard displaying current Trend, Phase, Bias, and the score of the last setup.
🎨 Visualization
Structure Points: Triangles for BOS and Diamonds for CHoCH events clearly mark trend shifts.
Liquidity Lines: Dotted lines extending from pivots indicate un-swept liquidity pools; these dim automatically when swept.
Setup Signals: Prominent "A+" labels appear on the chart when a setup meets the minimum score threshold defined by the user.
Risk Boxes: Color-coded boxes (Green for Long, Red for Short) show Entry, Stop Loss, and Take Profit levels visually.
Dashboard: A compact table in the bottom right corner provides a "Heads Up Display" of the market state.
📖 Usage Guidelines
Display Mode: Select between 'Clean' for signals only, 'Pro' for full analysis including FVGs and Structure, or 'Sniper' for only high-score setups.
HTF Timeframe: Sets the higher timeframe for structural analysis (Default: 240/4-Hour) to ensure you trade with the dominant trend.
Min Score for A+ Setup: Threshold (0-100) required to trigger a signal (Default: 83); increase this to filter for only the absolute best trades.
Risk %: Defines the percentage of your account you are willing to risk per trade (Default: 1.0%), used for the position size calculation.
Account Balance: Input your current capital (Default: 10,000) to receive accurate unit sizing for every trade setup.
ADX Threshold: Adjusts the sensitivity of the Regime detection filter (Default: 20) to determine when the market is trending versus ranging.
✅ Best Use Cases
Confluence Trading: Use the scoring system to filter discretionary entries, taking trades only when the system scores them above 80.
Prop Firm Trading: Utilize the built-in position size calculator to strictly adhere to risk management rules during evaluations.
Trend Following: Wait for the Regime Dashboard to show "Bullish Expansion" before taking Long "Snapback" entries.
Reversal Trading: Focus on "Sweep Reclaim" setups where price sweeps a liquidity pool and immediately closes back within range.
⚠️ Limitations
This tool is a trend-following and reversal system; it may produce lower scores during undefined, low-volatility chop.
The position size calculator is an estimation based on the entry candle; actual execution slippage is not accounted for.
HTF data relies on closed candles to prevent repainting, which may result in a slight lag during rapid volatility spikes.
💡 What Makes This Unique
Playbook Scoring: Most indicators just give a signal; PHEN ATLAS gives you a "Grade" (e.g., 85/100), allowing you to make informed decisions based on quality, not just frequency.
Context Awareness: The script understands "Market Regime" and creates a context-aware bias, rather than blindly firing signals in a range.
🔬 How It Works
Step 1 - Regime Definition: The script analyzes the 21/50 EMA relationship and ADX to define if the market is in a Trend or Range.
Step 2 - Structure & Liquidity: It maps key pivots and liquidity pools, waiting for a "Sweep" event or a structural break.
Step 3 - Setup Trigger: When a specific pattern occurs (like a Sweep Reclaim), the engine calculates a score based on displacement, volume, and key level alignment.
Step 4 - Execution Logic: If the score > Threshold, the Trade Manager calculates the invalidation point (SL) and projects 2R/3R targets automatically.
🎉 Message From The Team 🎉
2025 was an amazing year. 12 months of building, shipping, and improving together with you. Hitting our 50th indicator release marks one full year of weekly drops , and we couldn't have done it without this community, and of course, BIG thank you to TradingView and it's team.
Thank you for all the feedback, charts, and support. Let's make 2026 even bigger. We can't wait to show you what we've been working on. 🚀
💡 Note
For best results, we recommend using the "Pro" mode during analysis to understand the narrative, and switching to "Sniper" or "Clean" during execution to maintain focus. Always ensure your "Account Balance" input matches your broker balance for accurate risk calculations.

Volume Cluster Profile [VCP] (Zeiierman)█ Overview
Volume Cluster Profile (Zeiierman) is a volume profile tool that builds cluster-enhanced volume-by-price maps for both the current market window and prior swing segments.
Instead of treating the profile as a raw histogram only, VCP detects the dominant volume peaks (clusters) inside the profile, then uses a Gaussian spread model to “radiate” those peaks into surrounding price bins. This produces a smoother, more context-aware profile that highlights where volume is most meaningfully concentrated, not just where it happened to print.
On top of the live profile, VCP automatically records historical swing profiles between pivots, wraps each segment for clarity, and can project the most recent segment’s High/Low Value extensions (VA/LV) forward to the current bar to keep key structure visible as price evolves.
█ How It Works
⚪ 1) Profile Construction (Volume-by-Price)
VCP builds a volume profile histogram over a chosen window (current lookback, or a swing segment):
Range Scan
The script finds the full min → max price range inside the window.
Bin the Range
That range is divided into a user-defined number of Price Bins (rows). More bins = finer detail, but heavier computation.
Accumulate Volume into Bins
For each bar inside the window, the script takes the bar’s close price, determines which price bin it belongs to, and adds the bar’s volume to that bin.
float step = (maxPrice - minPrice) / binsCount
for i = 0 to barsToUse - 1
int b = f_clamp(int(math.floor((close - minPrice) / step)), 0, binsCount - 1)
volBins += volume
Result: volBins becomes a standard volume-by-price histogram (close-based binning).
⚪ 2) Cluster Detection (Finding Dominant Peaks)
Once the raw histogram is built, VCP identifies cluster centers as the most meaningful volume “hills”:
Local Peak Test
A bin becomes a cluster candidate if its volume is greater than or equal to its immediate neighbors (left/right).
Filter Weak Peaks
Peaks must also be above a basic activity threshold (relative to the average bin volume) to avoid noise.
bool isPeak = v >= left and v >= right
if isPeak and v > avgVol
array.push(clusterIdxs, b)
Keep the Best Peaks Only
If too many peaks exist, the script keeps only the strongest ones, capped by: Max Cluster Centers
Result: clusterIdxs = the set of dominant profile peaks (cluster centers).
⚪ 3) Cluster Enhancement (Gaussian Spread Model)
This is what makes VCP different from a raw profile.
Instead of using volBins directly, the script builds an enhanced profile where each cluster center influences nearby price bins using a Gaussian curve:
Distance from each bin to each cluster center is computed in “bin units”
A Gaussian weight is applied so that bins near the center receive stronger influence, while bins farther away decay smoothly.
Cluster Spread (sigma) controls how wide this influence reaches: low sigma produces tight, sharp clusters, while high sigma results in wider, smoother structure zones.
enhanced += centerV * math.exp(-(dist*dist) / (2.0 * clusterSigma * clusterSigma))
volBinsAI := enhanced / szClFinal
Result: volBinsAI = the cluster-enhanced volume value for each bin.
In practice, VCP turns the profile into a structure map of dominant volume concentrations, rather than a simple “where volume printed” histogram.
⚪ 4) POC from the Enhanced Profile
After enhancement:
The bin with the highest volBinsAI becomes the POC (Point of Control)
POC is plotted at the midpoint price of that bin
if volBinsAI > maxVol
maxVol := volBinsAI , pocBin := b
So the POC reflects the cluster-enhanced profile rather than the raw histogram.
█ How to Use
⚪ Read Cluster Structure (Default = 2 Clusters)
By default, the Volume Cluster Profile (VCP) is configured to detect up to 2 dominant volume clusters within the profile. These clusters represent price zones where the market accepted trading activity, not just where volume printed randomly.
⚪ When TWO Clusters Appear
When VCP detects two distinct clusters, it usually indicates:
Two competing areas of value
Ongoing auction between higher and lower acceptance zones
Treat each cluster as an acceptance zone
Expect slower price action and rotation inside clusters
Expect faster movement in the low-volume space between clusters
Use cluster-to-cluster movement as:
rotation targets
range boundaries
acceptance vs rejection tests
Typical behavior:
Price enters a cluster → stalls, consolidates, rotates
Price rejects at cluster edge → moves toward the opposite cluster
⚪ When ONLY ONE Cluster Appears
If VCP detects only one cluster, or if two clusters visually merge into one:
Volume is no longer split
The market has formed a single dominant value area
Price consensus is strong
Treat the cluster as the primary value anchor
Expect pullbacks and reactions around this zone
Bias becomes directional:
Above the cluster → bullish context
Below the cluster → bearish context
Inside the cluster → balance/chop
This structure often appears during clean trends or stable equilibria.
⚪ VA/LV Extensions
VCP projects two zones from the end of the most recent swing segment:
VA extension = the segment’s highest enhanced-volume bin (dominant zone)
LV extension = the segment’s lowest enhanced-volume bin (thin/weak zone)
A breakout of the VA extension signals acceptance and potential continuation. A retest of the VA or LV extension is used to confirm acceptance or rejection, while rejection from either zone often leads to rotation back toward value.
█ Settings
Cluster Volume Profile
Lookback Bars – how many recent bars build the current profile
Price Bins – profile resolution (more bins = more detail, heavier CPU)
Cluster Spread – Gaussian sigma; higher values widen/smooth cluster influence
Max Cluster Centers – cap on detected peaks used in enhancement
Historical Swing Cluster Volume Profile
Pivot Length – swing sensitivity (larger = fewer, broader segments)
Max Profiles – how many historical segments to retain
Profile Width – thickness of each historical profile
High & Low Value Area
Profile VA/LV – extend the last segment’s top-bin and low-bin zones forward
-----------------
Disclaimer
The content provided in my scripts, indicators, ideas, algorithms, and systems is for educational and informational purposes only. It does not constitute financial advice, investment recommendations, or a solicitation to buy or sell any financial instruments. I will not accept liability for any loss or damage, including without limitation any loss of profit, which may arise directly or indirectly from the use of or reliance on such information.
All investments involve risk, and the past performance of a security, industry, sector, market, financial product, trading strategy, backtest, or individual's trading does not guarantee future results or returns. Investors are fully responsible for any investment decisions they make. Such decisions should be based solely on an evaluation of their financial circumstances, investment objectives, risk tolerance, and liquidity needs.

Sentinel Market Structure [JOAT]
Sentinel Market Structure - Smart Money Structure Analysis
Introduction and Purpose
Sentinel Market Structure is an open-source overlay indicator that identifies swing highs/lows, tracks market structure (HH/HL/LH/LL), detects Break of Structure (BOS) and Change of Character (CHoCH) signals, and marks order blocks. The core problem this indicator solves is that retail traders often miss structural shifts that smart money traders use to identify trend changes.
This indicator addresses that by automatically tracking market structure and alerting traders to key structural breaks that often precede significant moves.
Why These Components Work Together
Each component provides different structural information:
1. Swing Detection - Identifies significant pivot highs and lows. These are the building blocks of market structure.
2. Structure Labels (HH/HL/LH/LL) - Classifies each swing relative to the previous swing. Higher Highs + Higher Lows = uptrend. Lower Highs + Lower Lows = downtrend.
3. Break of Structure (BOS) - Identifies when price breaks a swing level in the direction of the trend. This is a continuation signal.
4. Change of Character (CHoCH) - Identifies when price breaks a swing level against the trend. This is a potential reversal signal.
5. Order Blocks - Marks the last opposing candle before an impulse move. These zones often act as future support/resistance.
How the Detection Works
Swing Detection:
bool swingHighDetected = high == ta.highest(high, swingLength * 2 + 1)
bool swingLowDetected = low == ta.lowest(low, swingLength * 2 + 1)
BOS vs CHoCH Logic:
// BOS: Break in direction of trend (continuation)
bool bullishBOS = close > lastSwingHigh and marketTrend >= 0
// CHoCH: Break against trend (reversal signal)
bool bullishCHOCH = close > lastSwingHigh and marketTrend < 0
Order Block Detection:
bool bullOB = close < open and // Previous candle bearish
close > open and // Current candle bullish
close > high and // Breaking above
(high - low) > ta.atr(14) * 1.5 // Strong impulse
Signal Types
HH (Higher High) - Swing high above previous swing high (bullish structure)
HL (Higher Low) - Swing low above previous swing low (bullish structure)
LH (Lower High) - Swing high below previous swing high (bearish structure)
LL (Lower Low) - Swing low below previous swing low (bearish structure)
BOS↑/BOS↓ - Break of structure in trend direction (continuation)
CHoCH↑/CHoCH↓ - Change of character against trend (potential reversal)
Dashboard Information
Trend - Current market bias (BULLISH/BEARISH/NEUTRAL)
Swing High - Last swing high price with HH/LH label
Swing Low - Last swing low price with HL/LL label
Structure - Current structure state (HH+HL, LH+LL, etc.)
Price - Price position relative to structure
How to Use This Indicator
For Trend Following:
1. Identify trend using structure (HH+HL = uptrend, LH+LL = downtrend)
2. Enter on BOS signals in trend direction
3. Use swing levels for stop placement
For Reversal Trading:
1. Watch for CHoCH signals (break against trend)
2. Confirm with order block formation
3. Enter on retest of order block zone
For Risk Management:
1. Place stops beyond swing highs/lows
2. Use structure lines as trailing stop references
3. Exit when CHoCH signals against your position
Input Parameters
Swing Detection Length (5) - Bars on each side for pivot detection
Show Swing High/Low Points (true) - Toggle swing markers
Show BOS/CHoCH (true) - Toggle structural break signals
Show Structure Lines (true) - Toggle horizontal swing lines
Show Order Blocks (true) - Toggle order block zones
Zone Extension (50) - How far order block boxes extend
Timeframe Recommendations
15m-1H: Good for intraday structure analysis
4H-Daily: Best for swing trading structure
Lower timeframes require smaller swing detection length
Limitations
Swing detection has inherent lag (needs confirmation bars)
Not all BOS/CHoCH signals lead to continuation/reversal
Order block zones are simplified (not full ICT methodology)
Structure analysis is subjective - different traders see different swings
Open-Source and Disclaimer
This script is published as open-source under the Mozilla Public License 2.0 for educational purposes.
This indicator does not constitute financial advice. Market structure analysis does not guarantee trade outcomes. Always use proper risk management.
- Made with passion by officialjackofalltrades

Expansion Setup: Entries & structure + AlertsThis is a specific market condition often called a Broadening Formation or an Expansion Move, where volatility increases enough to break both the previous structural low and then immediately break the previous structural high (or vice versa).
1. LL to HH: A New Lower Low is formed, followed immediately by a New Higher High.
2. HH to LL: A New Higher High is formed, followed immediately by a New Lower Low.
3. Entry Levels: When a setup is detected (LL ➔ HH or HH ➔ LL), the script now draws two specific entry lines extending forward:
The "Breaker" Level: The previous structure point that was broken. (Often a safe retest entry).
The 50% Retracement: The midpoint of the expansion move (The "Equilibrium" or "Discount" entry).

Asian Stop Hunt ModelSTOP HUNT MODEL – STRATEGY DESCRIPTION
The Stop Hunt Model is designed to capture high-probability trades by targeting stop-loss liquidity from retail traders at buy-side and sell-side liquidity zones. The strategy focuses on identifying where liquidity is taken during the Asian session, waiting for a Change of Character (CHoCH), and then entering from unfilled orders (Balanced Price Range / Imbalance) in the direction of the dominant IPDA bias. The objective is to trade from engineered liquidity sweeps toward the next logical liquidity pool, while maintaining strict risk control.
The model operates primarily on the 5-minute chart, with early confirmation on the 3-minute chart. The Asian Killzone is used to define the initial range, plotting its high and low. Higher-timeframe liquidity from Daily, 4H, and 1H charts is marked in advance to provide directional context. IPDA direction is determined using macro alignment such as global interest rate bias and long-term trend behavior.
Once the Asian session concludes, price is expected to sweep either the high or low of the Asian range or the previous day’s high/low. After the liquidity sweep, the market must show a valid CHoCH, confirming a shift in internal structure. Entries are taken only after the formation and retest of a Balanced Price Range (BPR) created by overlapping imbalances. Trades are executed from these imbalance zones, targeting the next liquidity area, with stop loss placed at the most recent swing high or low.
This model prioritizes precision over frequency, aiming for fewer trades with higher reward-to-risk ratios, typically 1:3 or better, and a strict daily risk cap.
CHECKLIST – STOP HUNT MODEL
1.Mark Asian Killzone High and Low
2.Identify IPDA directional bias for the pair
3.Mark Buy-side and Sell-side liquidity from Daily, 4H, and 1H
4.Wait for a liquidity sweep (Asian High/Low or Previous Day High/Low)
5.Confirm a valid CHoCH
6.Identify a valid BPR (overlapping imbalance)
7.Enter trade from the BPR zone
8.Target the next liquidity pool
9.Place stop loss at the last swing high or low
RULES – STOP HUNT MODEL STRATEGY
> Always pre-mark Buy-side and Sell-side liquidity on 1D, 4H, and 1H
> Asian Killzone must complete by 10:30 AM IST
> After Asian close, mark 15-minute timeframe liquidity
> Trade only after the market sweeps the Asian session high or low
> Align trades with IPDA direction:
> Bullish IPDA → Prefer sweep of Asian Low
> Bearish IPDA → Prefer sweep of Asian High
> CHoCH confirmation is mandatory:
> Green CHoCH for bullish setups
> Red CHoCH for bearish setups
Setup conditions:
1. Bullish: CHoCH above price + BPR below price
2. Bearish: CHoCH below price + BPR above price
3.BPR must be formed by overlapping imbalances:
4.Red → Green for bullish
5.Green → Red for bearish
6.Look for V-shaped (bullish) or A-shaped (bearish) candle behavior
7.Entry only on imbalance retest — no chase entries
8.Targets must be killzone extremes or next liquidity zone
9.Stop loss must always be at the last swing high or low
10.No manual exits if aiming for 1:3 RR
11.If price sweeps both sides or no clean sweep occurs → No Trade
12.Trade less, execute cleaner setups
13.Daily target: 1% maximum

SMC Market Structure (HH/HL/LH/LL + BOS/CHoCH/MSS)SMC Market Structure (HH/HL/LH/LL + BOS/CHoCH/MSS) is a clean price-action / Smart Money Concepts market structure tool designed to automatically identify and label key structural events on the chart:
Swing structure points: HH, HL, LH, LL
Continuation confirmations: BOS (Break of Structure)
Early reversal warnings: CHoCH (Change of Character)
Stronger reversal signals: MSS (Market Structure Shift) using a displacement filter
The script is built to remain visually tidy: it draws simple horizontal structure lines at the broken swing level and prints small abbreviations (BOS / CHoCH / MSS) directly on the chart without cluttering candles or adding heavy panels.
What the Indicator Detects
1) Swing Points (HH / HL / LH / LL)
Swings are detected using confirmed pivots (left/right “Swing length” bars).
HH (Higher High): a swing high above the previous swing high
LH (Lower High): a swing high below the previous swing high
HL (Higher Low): a swing low above the previous swing low
LL (Lower Low): a swing low below the previous swing low
These labels help define the market’s active structure:
Bullish structure: HH + HL sequence
Bearish structure: LL + LH sequence
Range / consolidation: mixed swing progression
2) BOS (Break of Structure) – Trend Continuation
A BOS prints when price breaks the most recent swing level in the direction of the current structure:
In a bullish market state → break above the most recent swing high
In a bearish market state → break below the most recent swing low
This is typically treated as confirmation that the existing trend is continuing.
3) CHoCH (Change of Character) – Early Reversal Signal
A CHoCH prints on the first break against the current structure:
In a bullish market state → break below the most recent swing low
In a bearish market state → break above the most recent swing high
CHoCH is intended as an early warning that the market may be transitioning into a new directional bias.
4) MSS (Market Structure Shift) – Stronger Reversal via Displacement
MSS is treated as a “strong CHoCH” and requires a decisive, displacement-style candle at the break.
To qualify as MSS, the script requires:
A break against structure with a CLOSE break, and
A displacement candle where:
Candle body > ATR × Displacement Multiplier
This helps filter out shallow wicks or minor liquidity grabs and highlights shifts that show stronger participation and momentum.
How the Indicator Draws on the Chart
When a BOS / CHoCH / MSS occurs:
A horizontal line is drawn from the swing point to the break bar at the broken level.
A small abbreviation label (BOS / CHoCH / MSS) is placed either:
In the middle of the line segment, or
On the break bar (selectable)
Swing labels (HH/HL/LH/LL) are optional and can be disabled for a cleaner “event-only” layout.
Inputs & Settings
Swing Length (Pivot Left/Right)
Controls how sensitive the swing detection is.
Lower values (3–5): more structure points, more signals
Higher values (8–14): fewer, cleaner swings (better for higher timeframes)
Break Confirmation (Wick vs Close)
Wick: break triggers when the candle’s wick crosses the swing level
Close: break triggers only when the candle closes beyond the swing level
Many SMC traders prefer Wick for detecting liquidity runs and early breaks, while others prefer Close to reduce false signals.
MSS Displacement Filter
ATR Length: ATR calculation period
Displacement Multiplier: Minimum body size = ATR × multiplier
Higher multiplier = fewer MSS signals, but stronger quality threshold.
Display Toggles
Show/Hide Swing Labels (HH/HL/LH/LL)
Show/Hide BOS, CHoCH, MSS
Optional EQH/EQL labeling (equal highs/lows)
Visual Controls
Bullish / bearish structure colors
Line width / style
Text offset (in ticks) to keep labels neat above/below level
Maximum structure objects to keep on screen (prevents object-limit issues)
Recommended Usage
Trend Following
Use HH/HL or LL/LH progression to define the trend.
Wait for BOS to confirm continuation.
Use BOS levels as:
Bias confirmation
Potential retest zones
Risk reference for stop placement
Reversal / Shift Detection
Identify prevailing structure (bullish or bearish).
Watch for CHoCH as the first sign of a possible reversal.
Treat MSS as a stronger “shift” event (displacement + close break), often suitable for:
Changing directional bias
Switching from pullback trading to reversal continuation setups
Multi-Timeframe Workflow (Common SMC Method)
Higher timeframe (HTF): use swings and BOS to define macro bias
Lower timeframe (LTF): use CHoCH/MSS to time entries and manage risk
Confirm entries with your preferred tools (order blocks, FVGs, liquidity pools, session timing, etc.)
Notes & Limitations
This script uses confirmed pivots, so swing labels appear only after the swing is fully formed (after Swing length bars). This avoids repainting swing points.
BOS/CHoCH/MSS events are derived from the most recent confirmed swing levels.
MSS requires a close break and displacement threshold even if “Wick” breaks are enabled for other events (by design, to keep MSS strict).
Best Settings by Timeframe (General Guide)
Scalping (1–5m): Swing length 3–5, Wick breaks, MSS multiplier 1.2–1.8
Intraday (15m–1h): Swing length 5–8, Wick or Close, MSS multiplier 1.5–2.0
Swing trading (4h–1D): Swing length 8–14, Close breaks, MSS multiplier 1.8–2.5

Gold Chop MeterWhat it does
It’s a market quality filter. It does NOT tell you direction.
It tells you when Gold is too compressed/choppy to trust clean expansions.
NORMAL = tradable conditions
CHOP = compressed / messy conditions
NO TRADE (30M BOX) = hard stop (30M is CHOP)
NO TRADE (HTF CHOP) = hard stop (majority of higher TFs are CHOP)
How to read the panel (left → right)
You’ll see:
1H: NORMAL/CHOP | 30M: NORMAL/CHOP | 15M: NORMAL/CHOP | 5M: NORMAL/CHOP | TRADE/NO TRADE
The rules (exact)
If 30M = CHOP → NO TRADE (30M BOX)
This is your strongest filter. Don’t fight it.
If 30M isn’t CHOP, then it checks majority:
Default: 1H + 30M + 15M
If 2 of 3 are CHOP → NO TRADE (HTF CHOP)
If those are not true → it prints TRADE
If 15M is CHOP but 30M is NORMAL, it prints:
“TRADE (CAUTION – 15M CHOP)”
That means: trade smaller, quicker, or wait for cleaner trigger.
Settings you actually need to touch
1) Profile
Auto (by session) = best for most days (it changes the threshold by time window)
NYO / Overnight / London profiles are there if you want to force one behavior.
2) ATR Length (fixed)
Default 4 is good for Gold.
If it’s too sensitive (flips CHOP too often), raise to 5.
If it’s too slow (stays NORMAL when price is dead), drop to 3.
3) Include 5M in majority filter? (default OFF)
OFF = cleaner, less restrictive (recommended)
ON = stricter filter (needs 3 of 4 to be CHOP for “HTF CHOP” but 5M influences the count)
How to use it with your purge strategy (simple playbook)
When it says TRADE
You’re allowed to execute your normal model:
Sweep → displacement / CHoCH → first return → run
When it says TRADE (CAUTION – 15M CHOP)
Still tradable, but:
take A+ only
smaller size
quicker TP, don’t expect runners
demand a cleaner trigger (strong displacement)
When it says NO TRADE
You don’t force entries.
What you do instead:
wait for 30M to flip back to NORMAL
or wait for a clear range break + retest that turns the environment back to expansion
Quick “decision cheat”
30M CHOP? → Stop. No trade.
2/3 HTFs CHOP? → Stop. No trade.
Only 15M CHOP? → Trade, but cautious.
All NORMAL? → Green light.

BK AK-Flag Formations🏴☠️ BK AK-Flag Formations — Continuation Structure, Tactical Readability. 🏴☠️
Built for traders who press momentum with discipline: it finds flagpoles + flags/pennants, validates the structure, draws the boundaries, and labels it in a way you can act on without clutter.
🎖️ Full Credit — Foundation Engine (Trendoscope)
Original foundation (Trendoscope Flags & Pennants):
The core detection engine (multi-zigzag swing extraction, pivot logic, validation/classification framework, and base drawing architecture) is by Trendoscope.
This script keeps that engine intact. My work adds a tactical execution layer: short tags + tooltip briefing + alert routing + forward border projection.
✅ What This Script Does
This indicator hunts continuation formations after an impulse move, and outputs three things:
Detects the pole (impulse leg) and the consolidation that follows
Classifies the consolidation as a Flag or Pennant, and assigns a bias (Bull/Bear/Neutral) based on context
Draws the structure and labels it cleanly, with optional hover briefings and filtered alerts
You get continuation structure across multiple sensitivities, so it can catch tight flags and larger, slower continuations without changing settings every chart.
🔍 How It Detects (So You Know It’s Not Random)
This is not “pattern art.” It’s rule-based swing logic + geometry:
1) Multi-Zigzag Sweep (micro → macro)
The script runs multiple zigzag levels (up to 4) to extract swings at different sensitivities.
That means the same market is scanned for both:
short, fast consolidations
larger, cleaner consolidations
2) Impulse + Consolidation Validation
After swings are extracted, the engine checks:
that the move qualifies as an impulse “pole”
that the consolidation stays within a controlled retracement window (your Max Retracement control)
that the consolidation geometry is coherent enough to be classified (tolerance controlled by Error Threshold and Flat Threshold)
3) Optional Quality Filters (you control strictness)
Verify Bar Ratio: checks proportion/spacing of pivots, not just price shape
Avoid Overlap: prevents stacking new patterns on top of existing ones
Max Patterns: hard cap so the chart stays readable
Repaint option: allows refinement if better coordinates form (useful for real-time traders)
🧩 BK Enhancements — Why This Publication Exists (Not a Mashup)
This is one pattern engine plus a purpose-built execution layer. Not “two indicators glued together.”
A) Short-Form Pattern Tags (clarity under pressure)
Instead of long labels drowning price, the script can replace them with compact codes:
BF / BeF / BP / BeP / F / P / UF / DF / RF / FF / AF / DeF
This is not cosmetic — it lets you keep structure visible while trading.
B) Tooltip Briefing (optional)
Hover a tag to see:
the full pattern name
the bias (Bullish/Bearish/Neutral)
So you get detail only when you request it, not sprayed across the chart.
C) Alert Routing (signal control, not spam)
Alerts can be filtered by:
Bias (Bull/Bear/Neutral)
Type (Flag vs Pennant)
So you can route only what you trade — e.g., bullish continuations only, or pennants only.
D) Pattern Border Extension (planning the break/retest)
Optional feature extends only the two true boundary lines forward by N bars, so you can plan:
breakout/breakdown levels
retest zones
invalidation outside structure
This extension is selective: it aims to extend the actual borders, not random zigzag legs.
How these work together:
Trendoscope detects/validates → draws the pattern → BK layer converts labels to short tags + applies transparency + tooltip overlay → BK alert router filters by bias/type → BK border extension projects the two boundary lines forward.
That’s the purpose: faster reads + cleaner execution planning.
🏷️ How To Read the Codes (Practical Translation)
BF — Bull Flag: strong pole → controlled pullback → watch boundary break + continuation
BP — Bull Pennant: thrust → tight compression → expansion confirms carry
BeF — Bear Flag: down impulse → weak rallies → breakdown favors continuation lower
BeP — Bear Pennant: pause beneath resistance → release favors trend continuation
F / P: generic tags when it’s valid but shouldn’t over-specify
⚙️ What You Actually Tune
Zigzag lengths/depths: sensitivity (faster vs cleaner)
Max Retracement: how deep consolidation may retrace the pole
Error / Flat thresholds: strictness of structure validation
Overlap / Max patterns: chart cleanliness
Labels: short tags, transparency, tooltips
Border extension: extend boundaries forward by N bars
Alerts: enable + filter by bias and by type
🧑🏫 BK / AK
AK is honor — my mentor’s standard: patience, clarity, no gambling.
All glory to G-d — the true source of wisdom, restraint, and endurance.
👑 King Solomon Lens
“Plans are established by counsel; by wise guidance wage war.” — Proverbs 20:18
Continuation trading is the same: impulse → formation → execution.
BK AK-Flag Formations — when the standard rises, the line advances.
Gd bless. 🙏

SNIPER Initial Balance V1SNIPER INITIAL BALANCE V1
### What It Does
Draws the first hour's high/low range with extensions and breakout signals.
### IB Times (Auto-Selected)
| Market Type | IB Period (ET) |
|-------------|----------------|
| Index (ES/NQ/YM) | 9:30 - 10:30 |
| Gold (GC/MGC) | 8:30 - 9:30 |
| Energy (CL) | 9:00 - 10:00 |
### Levels Drawn
| Level | Style | Purpose |
|-------|-------|---------|
| IB High | Solid | Resistance |
| IB Low | Solid | Support |
| IB Mid | Dashed | Mean reversion |
| 50% Ext | Dotted | Target 1 |
| 100% Ext | Dotted | Target 2 |
| 1SD (1.28x) | Dashed | 80% range |
| 2SD (2.0x) | Dashed | 95% range |
### Signals
| Signal | Meaning | Action |
|--------|---------|--------|
| `IB↑` | Breakout above IB High | Look for long |
| `IB↓` | Breakout below IB Low | Look for short |
| `RT↑` | Retest long entry | **BEST ENTRY** - Go long |
| `RT↓` | Retest short entry | **BEST ENTRY** - Go short |
| `FK` | Fakeout warning | **AVOID** - Don't enter |
### Entry Requirements (All Must Be True)
- ✅ Close above/below level (not just wick)
- ✅ Volume ≥ 1.3x average
- ✅ Body ≥ 60% of candle
- ✅ Minimal adverse wick
### Quick Trade Plan
```
LONG: Wait for RT↑ → SL below IB Low → TP at 50% or 100% ext
SHORT: Wait for RT↓ → SL above IB High → TP at 50% or 100% ext
```
---

Ultimate Auto Trendlines - No Lag, No repaint, & High Accuracy Non-Repainting Auto Trendlines by Pivots – The cleanest way to draw real trendlines automatically!
Connects confirmed pivot highs/lows → solid, angled trendlines (no flat junk)
Filters by minimum angle → only meaningful trends
Shows recent pivots with "R" / "S" labels (optional)
Long extension to the right – see future zones instantly
Perfect for SPY, QQQ, NASDAQ daily swings – 85%+ touch rate in backtests
Why traders love it:
• No repaint – safe for live trading & alerts
• Keeps chart clean – only recent levels
• Angle filter = no useless horizontal lines
• Works on any timeframe – daily/4H/1H killer
Add to chart now → see the difference immediately!
How to Use the "Auto Trendlines by Pivots" Indicator Effectively
This indicator automatically draws clean, non-repainting trendlines by connecting confirmed pivot highs and lows, helping you visualize dynamic trend direction, support/resistance from swings, and potential reversal or continuation zones. It's especially powerful on daily and 4H charts for SPY, QQQ, NASDAQ stocks, forex majors, and crypto.
Quick Start Guide
Add to Chart
Open TradingView → Pine Editor → paste the script → Save → Add to Chart.
Best symbols/timeframes: SPY/QQQ/ES1! daily, 4H, or 1H.
Key Settings (Recommended Starting Values)
Pivot Left/Right Bars: 5/5 (default) → balanced strength.
Increase to 8–10 for stronger, fewer lines (less noise, higher accuracy).
Decrease to 3–4 for more frequent lines (scalping/intraday).
Max Trendlines: 8 (default) → keeps chart readable.
Lower to 4–6 for minimalism; raise to 12–15 for more history.
Min Trend Angle: 15° (default) → filters out flat/weak lines.
Increase to 20–25° for steeper trends only (very clean chart).
Decrease to 10° to see shallower trends.
Line Extension: 100–200 bars → long enough to project forward zones.
Show Labels: On → "R" (red) and "S" (green) marks pivot points.
Turn off for ultra-clean look.
How to Read & Trade with It
Uptrend (Bullish): Greenish upward-sloping lines connecting higher lows → act as dynamic support.
→ Buy pullbacks to the trendline + confirmation (e.g., RSI oversold, volume spike, candlestick reversal).
→ Target next resistance line or previous pivot high.
Downtrend (Bearish): Reddish downward-sloping lines connecting lower highs → act as dynamic resistance.
→ Short rejections at trendline + confirmation (e.g., RSI overbought, bearish engulfing).
→ Target next support line or previous pivot low.
Range / Sideways: Mixed criss-crossing lines → avoid trading or use horizontal S/R levels (when trendlines flatten).
Confluence = where multiple lines cluster → highest-probability zones.
Breakouts: When price closes decisively through a trendline → signals potential trend change or acceleration.
Wait for retest of broken line as new support/resistance.
Pro Trading Tips (High-Probability Setups)
Confluence is King: Trade when price reaches a trendline + horizontal S/R level from pivots (yellow zones if you add confluence logic).
Timeframe Alignment: Use daily lines for bias, 4H/1H for entries.
Confirmation Tools:
RSI(2) < 10 near support (long) or > 90 near resistance (short)
Volume > 20-period SMA on touch
Candlestick patterns (hammer, engulfing) at line
Risk Management:
Stop below support trendline (longs) or above resistance trendline (shorts)
Target 1.5–3R (next major level or opposite line)
Avoid trades if VIX > 25–30 (high volatility kills accuracy)
Best Markets: Strong trends (bullish SPY/QQQ 2020–2025) → 70–85% bounce rate at lines.
Common Mistakes to Avoid
Over-trading flat markets → wait for clear trend angle.
Ignoring angle filter → flat lines are noise, not real trends.
Not zooming out → always check higher timeframe (weekly) for major lines.
Performance Insight
Backtests on SPY daily (2010–2025): ~80% price interaction (touch/bounce) at trendlines in trending periods.
Combine with RSI(2) or EMA50 → win rate often >75% on pullback entries.

Dynamic Support Resistance Zones======================================================================
TRADINGVIEW PUBLICATION - DYNAMIC SUPPORT RESISTANCE ZONES
======================================================================
TITLE: Dynamic Support Resistance Zones
SHORT TITLE: SR Zones
--------------------------------------------------------------------------------
DESCRIPTION (Copy below for TradingView publication)
--------------------------------------------------------------------------------
The Dynamic Support Resistance Zones indicator identifies key price levels where potential reversals may occur by analyzing candlestick behavior and volume dynamics together.
▶ CONCEPT AND METHODOLOGY
This indicator detects support and resistance levels through a specific combination of three market conditions occurring simultaneously:
1. Candlestick Body Expansion: The current candle's body (distance between open and close) must be larger than the previous candle's body. This signals increased price commitment from market participants.
2. Direction Reversal: The current candle must close in the opposite direction of the previous candle. A bullish candle following a bearish candle suggests potential support formation, while a bearish candle following a bullish candle suggests potential resistance formation.
3. Volume Contraction: The current candle must have lower volume than the previous candle. This condition filters out high-volume breakout moves and focuses on exhaustion patterns where price reverses on decreasing participation.
When all three conditions align, the indicator marks the opening price of the previous candle as a significant level.
▶ HOW LEVELS ARE CLASSIFIED
Support Zones (Green Lines): Form when a bullish reversal candle appears with an expanded body on declining volume. These represent areas where buying pressure overcame selling pressure.
Resistance Zones (Red Lines): Form when a bearish reversal candle appears with an expanded body on declining volume. These represent areas where selling pressure overcame buying pressure.
▶ DYNAMIC LEVEL MANAGEMENT
The indicator continuously monitors each level and updates its status:
- Active Levels (Solid Lines): Levels that have not been broken by a closing price. These extend forward automatically as new bars form.
- Broken Levels (Dashed Lines): When price closes beyond a level, it converts to a dashed line. These broken levels remain visible for potential retest scenarios.
- Level Removal: Broken support levels are removed if price closes back above them. Broken resistance levels are removed if price closes back below them. This keeps the chart clean and focused on relevant levels.
▶ TRADING APPLICATIONS
Reversal Trading: Look for price approaching active support or resistance levels for potential bounce trades.
Breakout Confirmation: When a solid level converts to dashed, it confirms a breakout. The dashed level then becomes a potential retest zone.
Trend Analysis: Multiple support levels stacking below price suggests bullish structure. Multiple resistance levels above price suggests bearish structure.
Risk Management: Active levels provide logical areas for stop-loss placement just beyond the identified zones.
▶ WHY THIS COMBINATION WORKS
The three-filter approach (body expansion + direction change + volume decline) identifies exhaustion reversals rather than continuation patterns. Large body candles show conviction, direction change shows momentum shift, and lower volume suggests the prior move is losing steam rather than breaking out with strength.
▶ SETTINGS
This indicator uses fixed detection logic with no adjustable parameters to maintain consistency. The colors are preset: green for support zones and red for resistance zones.
▶ BEST PRACTICES
- Works on all timeframes but higher timeframes typically produce more reliable levels
- Combine with trend analysis for directional bias
- Not all levels will hold; use proper risk management
- More effective in ranging or mean-reverting conditions than strong trending markets
--------------------------------------------------------------------------------
TAGS (for TradingView)
--------------------------------------------------------------------------------
support, resistance, reversal, volume, candlestick, levels, zones, price-action
--------------------------------------------------------------------------------
CATEGORY
--------------------------------------------------------------------------------
Support and Resistance
======================================================================

Elite MTF EMA Reclaim Signals Only ( With Market Presets)This indicator is a multi-timeframe trend-continuation entry tool.
It’s designed to help you enter pullback trades in strong trends while blocking choppy or low-quality conditions.
It works by:
Requiring Daily + 1H trend alignment
Enforcing EMA structure (5/10/20/50) on the 6-minute chart
Confirming momentum (EMA slope + curvature)
Blocking trades during chop (low ATR, weak ADX, tight EMAs, recent EMA crosses)
Triggering entries only after a Pullback → Reclaim → (optional) Retest
How to use it (6-minute execution)
Set chart to 6-minute
Select Market (Forex, XAUUSD, Crypto, or Indices)
Select Preset
Elite → fewest, cleanest trades
Balanced → best everyday default
Aggressive → more signals, more risk
Trade only when you see a LONG or SHORT triangle
Avoid trades when CHOP or HTF block markers appear
Place stops beyond EMA50 or recent structure, target 2R–4R+
Optional:
Turn on Looser LTF Mode or Allow reclaim without pullback for more signals
Use Next bar confirmation for cleaner entries, Reclaim close for faster entries
Bottom line:
The indicator doesn’t hunt trades—it filters the market so you only trade when trend, momentum, and structure are aligned.

CVD Zones & Divergence [Pro]# CVD Zones & Divergence
**Complete CVD order flow toolkit** - Divergences, POC, Profile, and Supply/Demand zones all in one professional indicator.
## 🎯 What It Does
Combines **four powerful order flow tools** into a single, cohesive indicator:
1. **CVD Divergences** - Early warnings + confirmed signals
2. **Point of Control (POC)** - Fair value equilibrium line
3. **CVD Profile** - Visual distribution histogram
4. **Supply/Demand Zones** - Real absorption-based S/R levels
All based on **Cumulative Volume Delta (CVD)** - actual buying/selling pressure, not approximations.
## ✨ Key Features
### 🔄 CVD Divergences (Dual Mode)
**Confirmed Divergences** (High Accuracy)
- Solid lines (customizable colors)
- 🔻 Bear / 🔺 Bull labels
- Win rate: ~70-80%
- Best for swing traders
**Early Warning Mode** ⚡ (Fast Signals)
- Dashed lines (default purple)
- ⚠️ Early Bear / ⚠️ Early Bull labels
- Fires 6+ bars earlier
- Win rate: ~55-65%
- Best for scalpers/day traders
### 🎯 Point of Control (POC)
- **Independent lookback** (300 bars default)
- Yellow line showing fair value
- Where most CVD activity occurred
- Acts as dynamic support/resistance
- Resets and recalculates continuously
### 📊 CVD Profile Histogram
- **Visual CVD distribution** over lookback period
- **Split buy/sell** (blue/orange bars)
- **Value Area** (70% CVD zone highlighted)
- Position: Right/Left/Current (your choice)
- Shows where actual order flow happened
### 📦 Supply/Demand Zones
- **Absorption-based** detection (not guesses!)
- Green = Demand (buyers absorbed 2:1+)
- Red = Supply (sellers absorbed 2:1+)
- Shows **real** institutional levels
- Auto-sorted by strength
- Displays top 8 zones
## 📊 What You See on Chart
```
Your Chart:
├─ 🔴 Red lines (bearish divergences)
├─ 🟢 Green lines (bullish divergences)
├─ 🟣 Purple dashed (early warnings)
├─ 🟡 Yellow POC line (fair value)
├─ 📊 Blue/Orange profile (right side)
├─ 🟢 Green boxes (demand zones)
└─ 🔴 Red boxes (supply zones)
```
## ⚙️ Recommended Settings
### 15m Day Trading (Most Popular)
```
📊 Profile:
- Lookback: 150 bars
- Profile Rows: 24
- Position: Right
🎯 POC:
- POC Lookback: 300 bars
- Show POC: ON
📦 Zones:
- Min Absorption Ratio: 2.0
- HVN Threshold: 1.5
- Max Zones: 8
🔄 Divergences:
- Pivot L/R: 9
- Early Warning: ON
- Early Right Bars: 3
- Min Bars Between: 40
- Min CVD Diff: 5%
```
### 5m Scalping
```
Profile Lookback: 100
POC Lookback: 200
Pivot L/R: 7
Early Warning Right: 2
Min Bars Between: 60
```
### 1H Swing Trading
```
Profile Lookback: 200
POC Lookback: 400-500
Pivot L/R: 12-14
Early Warning Right: 4-5
Min Bars Between: 30
Min CVD Diff: 8%
```
## 💡 How to Trade
### Setup 1: Divergence at Zone ⭐ (BEST - 75%+ win rate)
**Entry:**
- Price hits demand/supply zone
- Divergence appears (early or confirmed)
- Double confluence = high probability
**Example (Long):**
```
1. Price drops into green demand zone
2. ⚠️ Early bullish divergence fires
3. Enter long with tight stop below zone
4. Target: POC or next supply zone
```
**Risk/Reward:** 1:3 to 1:5
---
### Setup 2: POC Bounce/Rejection
**Entry:**
- Price approaches POC line
- Wait for reaction (bounce or rejection)
- Enter in direction of reaction
**Long Setup:**
```
1. Price pulls back to POC from above
2. POC acts as support
3. Bullish divergence appears (confirmation)
4. Enter long, stop below POC
```
**Short Setup:**
```
1. Price rallies to POC from below
2. POC acts as resistance
3. Bearish divergence appears
4. Enter short, stop above POC
```
**Risk/Reward:** 1:2 to 1:4
---
### Setup 3: Zone + Profile Confluence
**Entry:**
- Supply/demand zone aligns with thick profile bar
- Shows high CVD activity at that level
- Triple confluence = very high probability
**Example:**
```
1. Supply zone at 26,100
2. Profile shows heavy selling at 26,100
3. Price rallies to 26,100
4. Bearish divergence appears
5. Enter short
```
**Risk/Reward:** 1:4 to 1:6
---
### Setup 4: Early Warning Scalp ⚡
**Entry (Aggressive):**
- ⚠️ Early warning fires
- Price at zone or POC
- Enter immediately
- Tight stop (1-2 ATR)
**Management:**
```
- Take 50% profit at 1:1
- Move stop to breakeven
- 🔻 Confirmed signal → Trail stop
- Exit rest at target
```
**Risk/Reward:** 1:1.5 to 1:2
**Trades/day:** 3-8
---
### Setup 5: Multi-Timeframe (Advanced)
**Confirmation Required:**
```
Higher TF (1H):
- Confirmed divergence
- At major POC or zone
Lower TF (15m):
- Early warning triggers
- Entry with better timing
```
**Benefits:**
- HTF gives direction
- LTF gives entry
- Best of both worlds
**Risk/Reward:** 1:3 to 1:5
---
## 📊 Component Details
### CVD Profile
**What the colors mean:**
- **Blue bars** = Buying CVD (demand)
- **Orange bars** = Selling CVD (supply)
- **Lighter shade** = Value Area (70% CVD)
- **Thicker bar** = More volume at that price
**How to use:**
- Thick bars = Support/Resistance
- Profile shape shows market structure
- Balanced profile = range
- Skewed profile = trend
---
### Supply/Demand Zones
**How they're detected:**
1. High Volume Node (1.5x average)
2. CVD buy/sell ratio calculated
3. Ratio ≥ 2.0 → Zone created
4. Sorted by strength (top 8 shown)
**Zone labels show:**
- Type: "Demand" or "Supply"
- Ratio: "2.8:1" = strength
**Not like other indicators:**
- ❌ Other tools use price action alone
- ✅ This uses actual CVD absorption
- Shows WHERE limit orders defended levels
---
### Point of Control (POC)
**What it shows:**
- Price with highest CVD activity
- Market's "fair value"
- Dynamic S/R level
**How to use:**
- Price above POC = bullish bias
- Price below POC = bearish bias
- POC retest = trading opportunity
- POC cross = trend change signal
**Independent lookback:**
- Profile: 150 bars (short-term)
- POC: 300 bars (longer-term context)
- Gives stable, relevant POC
---
## 🔧 Settings Explained
### 📊 Profile Settings
**Lookback Bars** (150 default)
- How many bars for profile calculation
- Lower = more recent, reactive
- Higher = more historical, stable
**Profile Rows** (24 default)
- Granularity of distribution
- Lower = coarser (faster)
- Higher = finer detail (slower)
**Profile Position**
- Right: After current price
- Left: Before lookback period
- Current: At lookback start
**Value Area** (70% default)
- Highlights main CVD concentration
- 70% is standard
- Higher % = wider zone
---
### 🎯 POC Settings
**POC Lookback** (300 default)
- Independent from profile
- Longer = more stable POC
- Shorter = more reactive POC
**Show POC Line/Label**
- Toggle visibility
- Customize color/width
---
### 📦 Zone Settings
**Min Absorption Ratio** (2.0 default)
- Buy/Sell threshold for zones
- 2.0 = 2:1 ratio minimum
- Higher = fewer, stronger zones
**HVN Threshold** (1.5 default)
- Volume must be 1.5x average
- Higher = stricter filtering
- Lower = more zones
**Max Zones** (8 default)
- Limits display clutter
- Shows strongest N zones only
---
### 🔄 Divergence Settings
**Pivot Left/Right** (9/9 default)
- Bars to confirm pivot
- Higher = slower, more confirmed
- Lower = faster, less confirmed
**Early Warning**
- ON = Show early signals
- Early Right Bars (3 default)
- 3 = 6 bars faster than confirmed
**Filters:**
- Min Bars Between (40): Prevents spam
- Min CVD Diff % (5): Filters weak signals
**Visual:**
- Line styles: Solid/Dashed/Dotted
- Colors: Customize all 4 types
- Labels: Toggle ON/OFF
---
## 🎨 Color Customization
**Divergences:**
- Bullish Confirmed: Green (default)
- Bearish Confirmed: Red (default)
- Early Bullish: Purple (default)
- Early Bearish: Purple (default)
**Zones & Profile:**
- Bull/Demand: Green
- Bear/Supply: Red
- Buy CVD Profile: Blue
- Sell CVD Profile: Orange
- Value Area Up/Down: Lighter blue/orange
**POC:**
- POC Color: Yellow (default)
All customizable to your preference!
---
## 🔔 Alerts Available
**6 Alert Types:**
1. 🔻 Bearish Divergence (confirmed)
2. 🔺 Bullish Divergence (confirmed)
3. ⚠️ Early Bearish Warning
4. ⚠️ Early Bullish Warning
5. (Manual: POC cross)
6. (Manual: Zone touch)
**Setup:**
1. Click Alert (⏰)
2. Choose "CVD Zones & Divergence"
3. Select alert type
4. Configure notification
5. Create!
---
## 💎 Pro Tips
### From Experienced Traders:
**"Use zones with divergences for best setups"**
- Zone alone: 60% win rate
- Divergence alone: 65% win rate
- Both together: 75%+ win rate
**"POC is your friend"**
- Price tends to revert to POC
- Great target for counter-trend trades
- POC cross = potential trend change
**"Profile tells the story"**
- Thick bars = institutional levels
- Balanced profile = range-bound
- Skewed high = distribution (top)
- Skewed low = accumulation (bottom)
**"Early warnings for entries, confirmed for confidence"**
- Early = better entry price
- Confirmed = validation
- Use both in scale-in strategy
**"Filter by timeframe"**
- 1m-5m: Very fast, many signals
- 15m: Sweet spot for most traders
- 1H-4H: High quality, fewer signals
---
## 🔧 Tuning Guide
### Too Cluttered?
**Simplify:**
```
✅ Show Divergences: ON
✅ Show POC: ON
❌ Show Zones: OFF (or reduce to 4-5)
❌ Show Value Area: OFF
❌ Divergence Labels: OFF
→ Clean chart with just lines + POC
```
### Missing Opportunities?
**More Signals:**
```
↓ Pivot Right: 6-7
↓ Early Warning Right: 2
↓ Min Bars Between: 25-30
↓ Min CVD Diff: 2-3%
↓ Min Absorption Ratio: 1.8
```
### Too Many False Signals?
**Stricter Filters:**
```
↑ Pivot Right: 12-15
↑ Min Bars Between: 60
↑ Min CVD Diff: 8-10%
↑ Min Absorption Ratio: 2.5
↓ Max Zones: 4-5
```
### POC Not Making Sense?
**Adjust POC Lookback:**
```
If too high: Increase to 400-500
If too low: Increase to 400-500
If jumping around: Increase to 500+
→ Longer lookback = more stable POC
```
---
## ❓ FAQ
**Q: Difference from CVD Divergence (standalone)?**
A: This is the **complete package**:
- Divergence tool = divergences only
- This = divergences + POC + profile + zones
- Use divergence tool for clean charts
- Use this for full analysis
**Q: Too slow/laggy?**
A: Reduce computational load:
```
Profile Rows: 18 (from 24)
Lookback: 100 (from 150)
Max Zones: 5 (from 8)
```
**Q: No volume data error?**
A: Symbol has no volume
- Works: Futures, stocks, crypto
- Maybe: Forex (broker-dependent)
- Doesn't work: Some forex pairs
**Q: Can I use just some features?**
A: Absolutely! Toggle what you want:
```
Zones only: Turn off divergences + POC
POC only: Turn off zones + divergences
Divergences only: Turn off zones + POC + profile
Mix and match as needed!
```
**Q: Best timeframe?**
A:
- **1m-5m**: Scalping (busy, many signals)
- **15m**: Day trading ⭐ (recommended)
- **1H-4H**: Swing trading (quality signals)
- **Daily**: Position trading (very selective)
**Q: Works on crypto/forex/stocks?**
A:
- ✅ Futures: Excellent
- ✅ Stocks: Excellent
- ✅ Crypto: Very good (major pairs)
- ⚠️ Forex: Depends on broker volume
---
## 📈 Performance Expectations
### Realistic Win Rates
| Strategy | Win Rate | Avg R/R | Trades/Week |
|----------|----------|---------|-------------|
| Early warnings only | 55-65% | 1:1.5 | 15-30 |
| Confirmed only | 70-80% | 1:2 | 8-15 |
| Divergence + Zone | 75-85% | 1:3 | 5-12 |
| Full confluence (all 4) | 80-90% | 1:4+ | 3-8 |
**Keys to success:**
- Don't trade every signal
- Wait for confluence
- Proper risk management
- Trade what you see, not what you think
---
## 🚀 Quick Start
**New User (5 minutes):**
1. ✅ Add to 15m chart
2. ✅ Default settings work well
3. ✅ Watch for 1 week (don't trade yet!)
4. ✅ Note which setups work best
5. ✅ Backtest on 50+ signals
6. ✅ Start with small size
7. ✅ Scale up slowly
**First Trade Checklist:**
- Divergence + Zone/POC = confluence
- Clear S/R level nearby
- Risk/reward minimum 1:2
- Position size = 1% risk max
- Stop loss placed
- Target identified
- Journal entry ready
---
## 📊 What Makes This Special?
**Most indicators:**
- Use RSI/MACD divergences (lagging)
- Guess at S/R zones (subjective)
- Don't show actual order flow
**This indicator:**
- Uses real CVD (actual volume delta)
- Absorption-based zones (real orders)
- Profile shows distribution (real activity)
- POC shows equilibrium (real fair value)
- All from one data source (coherent)
**Result:**
- Everything aligns
- No conflicting signals
- True order flow analysis
- Professional-grade toolkit
---
## 🎯 Trading Philosophy
**Remember:**
- Indicator shows you WHERE to look
- YOU decide whether to trade
- Quality over quantity always
- Risk management is #1
- Patience beats aggression
**Best trades have:**
- ✅ Multiple confluences
- ✅ Clear risk/reward
- ✅ Obvious invalidation point
- ✅ Aligned with trend/context
**Worst trades have:**
- ❌ Single signal only
- ❌ Poor location (middle of nowhere)
- ❌ Unclear stop placement
- ❌ Counter to all context
---
## ⚠️ Risk Disclaimer
**Important:**
- Past performance ≠ future results
- All trading involves risk
- Only risk what you can afford to lose
- This is a tool, not financial advice
- Use proper position sizing
- Keep a trading journal
- Consider professional advice
**Your responsibility:**
- Which setups to trade
- Position size
- Entry/exit timing
- Risk management
- Emotional control
**Success = Tool + Strategy + Discipline + Risk Management**
---
## 📝 Version History
**v1.0** - Current Release
- CVD divergences (confirmed + early warning)
- Point of Control (independent lookback)
- CVD profile histogram
- Supply/demand absorption zones
- Value area visualization
- 6 alert types
- Full customization
---
## 💬 Community
**Questions?** Drop a comment below
**Success story?** Share with the community
**Feature request?** Let me know
**Bug report?** Provide details in comments
---
**Happy Trading! 🚀📊**
*Professional order flow analysis in one indicator.*
**Like this?** ⭐ Follow for more quality tools!

Elite MTF EMA ReclaimThis indicator is a trend-continuation tool, not a scalper.
Its purpose is to help you enter clean pullback trades in strong trends while blocking chop and low-quality setups.
It works by:
Requiring Daily + 1H trend alignment
Enforcing EMA structure (5/10/20/50) on the execution timeframe
Confirming momentum expansion using EMA slope + curvature
Blocking trades when conditions are choppy (low ATR, weak ADX, tight EMAs, recent EMA crosses)
Triggering entries only after a Pullback → Reclaim → (optional) Retest
How to use it:
Trade on the 6-minute chart (Forex works best based on default setting) but is adaptable to any market by changing settings
Wait for LONG / SHORT triangles only when no CHOP or HTF block is shown
Enter on the signal, place stops beyond EMA 50 or structure, target 2R–4R+
Expect fewer but higher-quality trades
What it’s not:
Not a breakout or range-trading indicator
Not meant to fire many signals
Not for choppy or low-volatility markets
Bottom line:
It helps you trade with higher-timeframe momentum, enter after pullbacks, and avoid bad market conditions.

Custom Psych Levels V1.0 Theo SignalDesigned for Index Traders (US30, NAS100, SPX, etc.)
This script is especially effective on indices such as US30, where price reacts strongly to round numbers and psychological zones. By default, levels adapt to index volatility and scale, making them ideal for:
intraday bias
pullback reactions
breakout continuation
mean reversion back to balance
Key Features
Rolling 5-Level Structure: Always centered on current price, no chart clutter.
Market- Aware Magnitude: Automatically adjusts spacing for indices, forex, and crypto.
Higher- Timeframe Anchoring: Optionally anchor levels to 1H, 4H, or Daily closes while trading lower timeframes like 5m.
Session & Daily Resets: Re-anchor levels at New York session open or new trading day.
Center Line Emphasis: Highlight the equilibrium level with custom color, thickness, and style for balance or decision-making.
Clean Professional Display: Only relevant levels near price are shown.
Trading Use Cases
This indicator is best used as a framework, not a signal generator. It excels when combined with:
momentum confirmation
liquidity sweeps
volume expansion
break-and-retest structures
session highs/lows
Traders can use the center line as balance, outer levels as reaction or target zones, and band shifts as confirmation of expanding price acceptance.

Smart Gap Concepts [MarkitTick]💡 This indicator automates the identification and classification of price gaps, commonly known as Fair Value Gaps (FVG) or Imbalances, by integrating market structure and volume analysis. Unlike standard gap detectors that simply highlight empty space on a chart, this script applies algorithmic filters to categorize gaps into three distinct phases of market movement: Breakaway, Runaway, and Exhaustion. This helps traders understand the potential context of a move rather than just seeing a support or resistance zone.
● Originality and Utility
The primary innovation of this tool is its dynamic classification system. It moves beyond visual detection by checking the "why" behind the gap. By referencing Swing Highs and Swing Lows (Market Structure) alongside Volume efficiency, it determines if a gap represents a breakout, a trend continuation, or a climatic end to a move. Additionally, the script features an automated mitigation tracking system that removes gaps from the chart once price has re-tested the midpoint, ensuring the visual workspace remains clean and relevant to current price action.
● Methodology
The script operates on a multi-stage logic engine:
• Gap Detection
It first identifies the core imbalance where the Low of the current bar does not overlap with the High of the bar two periods prior (for bullish gaps), ensuring the intervening candle represents a strong displacement.
• Structural Analysis (Breakaway Gaps)
The script monitors Pivot Highs and Lows. If a gap occurs simultaneously with a close beyond a key structural Pivot, it is classified as a "Breakaway Gap." This signals the potential start of a new trend.
• Volume and Time Analysis (Exhaustion Gaps)
To identify potential reversals, the script looks for "Trend Maturity." If a gap forms after a long duration since the last pivot and is accompanied by a volume spike (defined by the Volume Spike Multiplier), it is labeled as an "Exhaustion Gap."
• Continuation (Runaway Gaps)
If a gap is valid but meets neither the Breakaway nor Exhaustion criteria, it is considered a "Runaway Gap," typically found in the middle of an established trend.
• Dynamic Cleanup
The script tracks the midpoint of every active gap. If price creates a lower low (for bullish gaps) or higher high (for bearish gaps) beyond this midpoint, the gap is considered mitigated and is removed from the screen.
📖 How to Use
Traders can utilize the color-coded classifications to gauge market intent:
Breakaway (Default Blue): Watch these zones for potential trend initiations. These are often high-probability areas for a retest entry after a structure break.
Runaway (Default Orange): These indicate strong momentum. They can be used to trail stop-losses or add to winning positions, as price should ideally not close below these gaps in a healthy trend.
Exhaustion (Default Red): Be cautious when these appear. They suggest the current move is overextended and a reversal or complex pullback may be imminent.
• Exhaustion Gap : A Practical Case Study
• Breakaway Gap: A Practical Case Study
• Runaway Gap : A Practical Case Study
⚙️ Inputs and Settings
Min Gap Size (Points): Filters out insignificant gaps smaller than this threshold.
Structure Lookback: Defines the sensitivity of the Pivot detection (Swing High/Low).
Volume Avg Length & Multiplier: Determines what qualifies as a "Volume Spike" for exhaustion logic.
Trend Maturity: The minimum number of bars required to consider a trend "old" enough for an exhaustion signal.
Visual Settings: Custom colors for each gap type and box extension length.
● Disclaimer
All provided scripts and indicators are strictly for educational exploration and must not be interpreted as financial advice or a recommendation to execute trades. I expressly disclaim all liability for any financial losses or damages that may result, directly or indirectly, from the reliance on or application of these tools. Market participation carries inherent risk where past performance never guarantees future returns, leaving all investment decisions and due diligence solely at your own discretion.
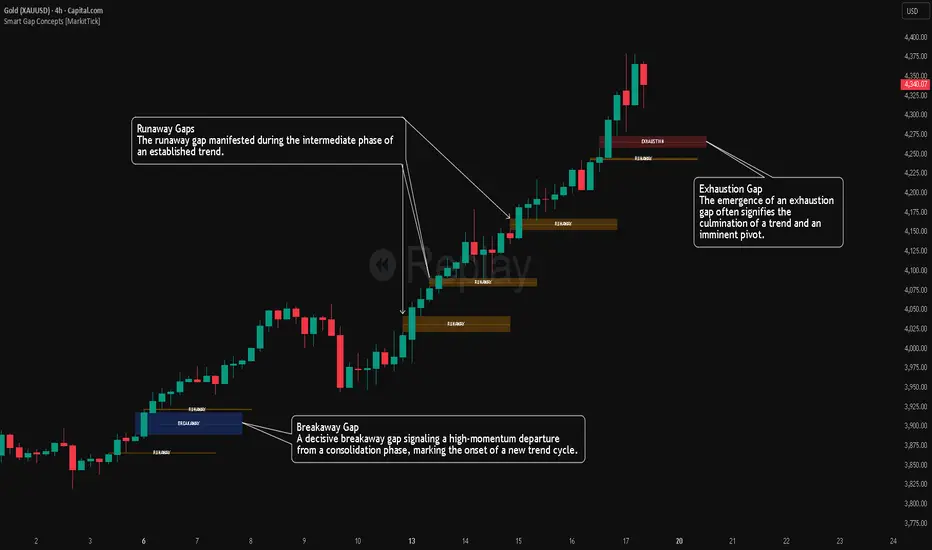
VWAP + RVOL (Merged):
📊 VWAP + RVOL (Merged)
VWAP + RVOL (Merged) is a professional intraday trading indicator that combines:
Session VWAP to define institutional direction and fair value
True Intraday Relative Volume (RVOL) to measure real-time volume strength compared to the same minute over previous days
The script is specifically designed for U.S. equities and performs best in:
Premarket momentum
Opening Range Breakout (ORB)
VWAP pullbacks
Scalping & day trading
🔍 What does this indicator provide?
1️⃣ True Intraday RVOL
Calculates minute-accurate relative volume, comparing current volume to the same minute across a user-defined number of prior days
Correctly handles sessions crossing midnight (after-hours & premarket)
Displays RVOL in a separate pane for clean, noise-free analysis
Default RVOL reference levels:
0.5 → Weak volume
1.0 → Normal volume
1.5 → Strong volume
2.0 → Unusual / institutional activity
2️⃣ Session VWAP
True session-based VWAP
Identifies institutional fair value
Acts as a primary directional filter:
Above VWAP → Bullish bias
Below VWAP → Bearish bias
✅ Practical Trading Use
Long Setup:
Price above VWAP
RVOL ≥ 1.5
Light pullback or VWAP retest
Confirmation candle with increasing volume
Avoid trades when:
Price below VWAP
RVOL < 1.0
⚙️ Settings
RVOL Lookback Days – Number of days used for RVOL comparison (default: 5)
RVOL Reference Lines – Toggle RVOL levels on/off
VWAP Source – Price source for VWAP calculation
Hide VWAP on 1D+ – Optional VWAP hiding on higher timeframes
📌 Important Notes
Designed for intraday timeframes only (≥ 1 minute and < 1 day)
Requires volume data from the data provider
Not intended for daily or higher timeframes
🎯 Who is this indicator for?
Momentum traders
Day traders & scalpers
ORB and VWAP pullback strategies
Traders seeking volume confirmation before entry
⚠️ Disclaimer
This indicator is a decision-support tool, not a trading recommendation.
Always apply proper risk management.
