[3Commas] HA & MAHA & MA
🔷What it does: This tool is designed to test a trend-following strategy using Heikin Ashi candles and moving averages. It enters trades after pullbacks, aiming to let profits run once the risk-to-reward ratio reaches 1:1 while securing the position.
🔷Who is it for: It is ideal for traders looking to compare final results using fixed versus dynamic take profits by adjusting parameters and trade direction—a concept applicable to most trading strategies.
🔷How does it work: We use moving averages to define the market trend, then wait for opposite Heikin Ashi candles to form against it. Once these candles reverse in favor of the trend, we enter the trade, using the last swing created by the pullback as the stop loss. By applying the breakeven ratio, we protect the trade and let it run, using the slower moving average as a trailing stop.
A buy signal is generated when:
The previous candle is bearish (ha_bear ), indicating a pullback.
The fast moving average (ma1) is above the slow moving average (ma2), confirming an uptrend.
The current candle is bullish (ha_bull), showing trend continuation.
The Heikin Ashi close is above the fast moving average (ma1), reinforcing the bullish bias.
The real price close is above the open (close > open), ensuring bullish momentum in actual price data.
The signal is confirmed on the closed candle (barstate.isconfirmed) to avoid premature signals.
dir is undefined (na(dir)), preventing repeated signals in the same direction.
A sell signal is generated when:
The previous candle is bullish (ha_bull ), indicating a temporary upward move before a potential reversal.
The fast moving average (ma1) is below the slow moving average (ma2), confirming a downtrend.
The current candle is bearish (ha_bear), showing trend continuation to the downside.
The Heikin Ashi close is below the fast moving average (ma1), reinforcing bearish pressure.
The real price close is below the open (close < open), confirming bearish momentum in actual price data.
The signal is confirmed after the candle closes (barstate.isconfirmed), avoiding premature entries.
dir is undefined (na(dir)), preventing consecutive signals in the same direction.
In simple terms, this setup looks for trend continuation after a pullback, confirming entries with both Heikin Ashi and real price action, supported by moving average alignment to avoid false signals.
If the price reaches a 1:1 risk-to-reward ratio, the stop will be moved to the entry point. However, if the slow moving average surpasses this level, it will become the new exit point, acting as a trailing stop
🔷Why It’s Unique
Easily visualizes the benefits of using risk-to-reward ratios when trading instead of fixed percentages.
Provides a simple and straightforward approach to trading, embracing the "keep it simple" concept.
Offers clear visualization of DCA Bot entry and exit points based on user preferences.
Includes an option to review the message format before sending signals to bots, with compatibility for multi-pair and futures contract pairs.
🔷 Considerations Before Using the Indicator
⚠️Very important: The indicator must be used on charts with real price data, such as Japanese candlesticks, line charts, etc. Do not use it on Heikin Ashi charts, as this may lead to unrealistic results.
🔸Since this is a trend-following strategy, use it on timeframes above 4 hours, where market noise is reduced and trends are clearer. Also, carefully review the statistics before using it, focusing on pairs that tend to have long periods of well-defined trends.
🔸Disadvantages:
False Signals in Ranges: Consolidating markets can generate unreliable signals.
Lagging Indicator: Being based on moving averages, it may react late to sudden price movements.
🔸Advantages:
Trend Focused: Simplifies the identification of trending markets.
Noise Reduction: Uses Heikin Ashi candles to identify trend continuation after pullbacks.
Broad Applicability: Suitable for forex, crypto, stocks, and commodities.
🔸The strategy provides a systematic way to analyze markets but does not guarantee successful outcomes. Use it as an additional tool rather than relying solely on an automated system.
Trading results depend on various factors, including market conditions, trader discipline, and risk management. Past performance does not ensure future success, so always approach the market cautiously.
🔸Risk Management: Define stop-loss levels, position sizes, and profit targets before entering any trade. Be prepared for potential losses and ensure your approach aligns with your overall trading plan.
🔷 STRATEGY PROPERTIES
Symbol: BINANCE:BTCUSDT (Spot).
Timeframe: 4h.
Test Period: All historical data available.
Initial Capital: 10000 USDT.
Order Size per Trade: 1% of Capital, you can use a higher value e.g. 5%, be cautious that the Max Drawdown does not exceed 10%, as it would indicate a very risky trading approach.
Commission: Binance commission 0.1%, adjust according to the exchange being used, lower numbers will generate unrealistic results. By using low values e.g. 5%, it allows us to adapt over time and check the functioning of the strategy.
Slippage: 5 ticks, for pairs with low liquidity or very large orders, this number should be increased as the order may not be filled at the desired level.
Margin for Long and Short Positions: 100%.
Indicator Settings: Default Configuration.
MA1 Length: 9.
MA2 Length: 18.
MA Calculations: EMA.
Take Profit Ratio: Disable. Ratio 1:4.
Breakeven Ratio: Enable, Ratio 1:1.
Strategy: Long & Short.
🔷 STRATEGY RESULTS
⚠️Remember, past results do not guarantee future performance.
Net Profit: +324.88 USDT (+3.25%).
Max Drawdown: -81.18 USDT (-0.78%).
Total Closed Trades: 672.
Percent Profitable: 35.57%.
Profit Factor: 1.347.
Average Trade: +0.48 USDT (+0.48%).
Average # Bars in Trades: 13.
🔷 HOW TO USE
🔸 Adjust Settings:
The default values—MA1 (9) and MA2 (18) with EMA calculation—generally work well. However, you can increase these values, such as 20 and 40, to better identify stronger trends.
🔸 Choose a Symbol that Typically Trends:
Select an asset that tends to form clear trends. Keep in mind that the Strategy Tester results may show poor performance for certain assets, making them less suitable for sending signals to bots.
🔸 Experiment with Ratios:
Test different take profit and breakeven ratios to compare various scenarios—especially to observe how the strategy performs when only the trade is protected.
🔸This is an example of how protecting the trade works: once the price moves in favor of the position with a 1:1 risk-to-reward ratio, the stop loss is moved to the entry price. If the Slow MA surpasses this level, it will act as a trailing stop, aiming to follow the trend and maximize potential gains.
🔸In contrast, in this example, for the same trade, if we set a take profit at a 1:3 risk-to-reward ratio—which is generally considered a good risk-reward relationship—we can see how a significant portion of the upward move is left on the table.
🔸Results Review:
It is important to check the Max Drawdown. This value should ideally not exceed 10% of your capital. Consider adjusting the trade size to ensure this threshold is not surpassed.
Remember to include the correct values for commission and slippage according to the symbol and exchange where you are conducting the tests. Otherwise, the results will not be realistic.
If you are satisfied with the results, you may consider automating your trades. However, it is strongly recommended to use a small amount of capital or a demo account to test proper execution before committing real funds.
🔸Create alerts to trigger the DCA Bot:
Verify Messages: Ensure the message matches the one specified by the DCA Bot.
Multi-Pair Configuration: For multi-pair setups, enable the option to add the symbol in the correct format.
Signal Settings: Enable whether you want to receive long or short signals (Entry | TP | SL), copy and paste the the messages for the DCA Bots configured.
Alert Setup:
When creating an alert, set the condition to the indicator and choose "alert() function call only.
Enter any desired Alert Name.
Open the Notifications tab, enable Webhook URL, and paste the Webhook URL.
For more details, refer to the section: "How to use TradingView Custom Signals".
Finalize Alerts: Click Create, you're done! Alerts will now be sent automatically in the correct format.
🔷 INDICATOR SETTINGS
MA 1: Fast MA Length
MA 2: Slow MA Length
MA Calc: MA's Calculations (SMA,EMA, RMA,WMA)
TP Ratio: This is the take profit ratio relative to the stop loss, where the trade will be closed in profit.
BE Ratio: This is the breakeven ratio relative to the stop loss, where the stop loss will be updated to breakeven or if the MA2 is greater than this level.
Strategy: Order Type direction in which trades are executed.
Use Custom Test Period: When enabled signals only works in the selected time window. If disabled it will use all historical data available on the chart.
Test Start and End: Once the Custom Test Period is enabled, here you select the start and end date that you want to analyze.
Check Messages: Enable the table to review the messages to be sent to the bot.
Entry | TP | SL: Enable this options to send Buy Entry, Take Profit (TP), and Stop Loss (SL) signals.
Deal Entry and Deal Exit : Copy and paste the message for the deal start signal and close order at Market Price of the DCA Bot. This is the message that will be sent with the alert to the Bot, you must verify that it is the same as the bot so that it can process properly so that it executes and starts the trade.
DCA Bot Multi-Pair: You must activate it if you want to use the signals in a DCA Bot Multi-pair in the text box you must enter (using the correct format) the symbol in which you are creating the alert, you can check the format of each symbol when you create the bot.
👨🏻💻💭 We hope this tool helps enhance your trading. Your feedback is invaluable, so feel free to share any suggestions for improvements or new features you'd like to see implemented.
__
The information and publications within the 3Commas TradingView account are not meant to be and do not constitute financial, investment, trading, or other types of advice or recommendations supplied or endorsed by 3Commas and any of the parties acting on behalf of 3Commas, including its employees, contractors, ambassadors, etc.
Search in scripts for "rma"

Responsive Moving Average with Trend Detection - MissouriTimThis indicator calculates a responsive moving average (RMA) that dynamically adjusts its sensitivity based on market volatility. This indicator is more responsive that SMAs, EMAs, WMAs, and HMAs. Here's how it functions:
Dynamic Length Adjustment: Utilizes the Average True Range (ATR) to adjust the length of the moving average. In times of increased volatility, the length decreases to make the average more responsive to price changes, and in quieter markets, it increases to reduce noise.
Responsive and Smoothed Moving Averages:
Responsive EMA: An initial Exponential Moving Average (EMA) is calculated with a dynamically adjusted length for responsiveness.
Smoothing: A secondary layer of smoothing is applied to this responsive EMA to further smooth out price fluctuations.
Trend Detection:
Detects trends by comparing the current smoothed EMA with its previous values:
Uptrend is identified when the current smoothed EMA is higher than the last two periods.
Downtrend is recognized when the current smoothed EMA is lower than the last two periods.
Consolidation occurs when neither an uptrend nor a downtrend is present.
Visual Representation:
The moving average line changes color:
Green for an uptrend.
Red for a downtrend.
Orange for consolidation.
Significant Trend Labels:
Labels are displayed when there's a significant change in the moving average:
Uptrend Labels appear when the EMA increases by more than the user-defined "Uptrend Label on % Change" threshold, placed at the high of the bar with green background.
Downtrend Labels are shown when the EMA decreases by more than the "Downtrend Label on % Change" threshold, positioned at the low of the bar with a red background.
Users can enable or disable these labels, and the thresholds for labeling uptrends and downtrends can be adjusted separately to match market conditions or user preferences.
This indicator is tailored for traders needing a moving average that adapts to market dynamics while providing clear visual feedback on significant trend changes via color-coded lines and labels.

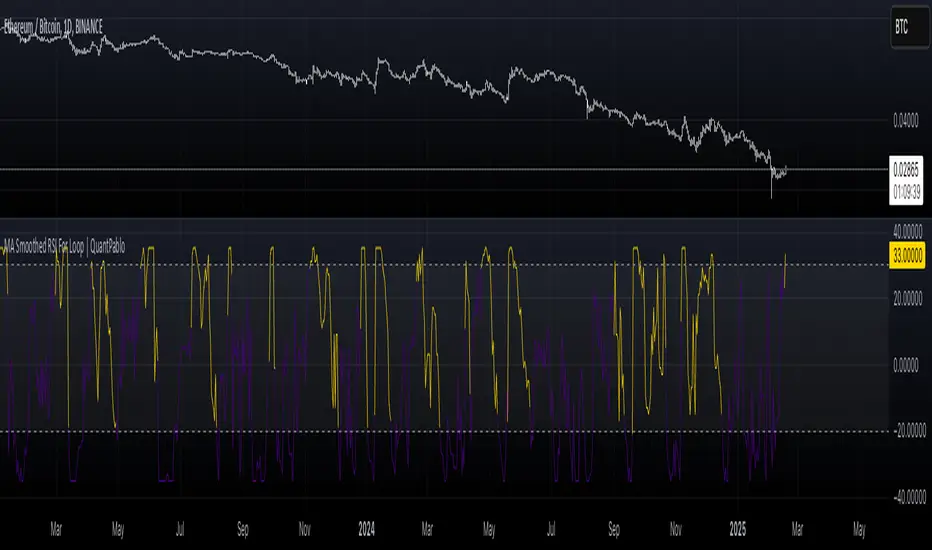
MA Smoothed RSI For Loop | QuantPabloMA Smoothed Source For RSI Loop | Crypto_Mercenary_
Conceptual Foundation and Innovation
The "MA Smoothed Source For RSI Loop" indicator developed by Crypto_Mercenary_ innovates by smoothing the source data used for RSI calculation with various moving averages before feeding it into a for-loop scoring system. Rather than smoothing the RSI itself, this approach focuses on pre-processing the price data to reduce noise, thereby providing a cleaner input for RSI computation. The for-loop then evaluates this smoothed RSI to generate momentum signals, offering traders a refined method for detecting market trends and potential reversals.
Technical Composition and Calculation
The indicator's functionality is divided into two main parts:
Source Smoothing: Before calculating RSI, the source data (typically close price) is smoothed using one of several moving averages (EMA, SMA, WMA, VWMA, HMA, RMA, DEMA, or none) as selected by the user. This smoothing aims to filter out short-term volatility, providing a more consistent base for RSI calculation.
RSI Calculation and For-Loop Scoring:
RSI: Calculated using the smoothed source data over a user-defined length.
For-Loop Mechanism: A loop runs from a to b, comparing the current RSI value with past values of this smoothed RSI. A score (counter) is generated, which increases or decreases based on whether the current RSI exceeds or falls below past values. If the weighted option is activated, this comparison gives more weight to recent data points, adjusting the score accordingly.
The final score is then potentially normalized for better interpretation, compared against thresholds to determine market momentum signals.
Features and User Inputs
This indicator is highly customizable, allowing traders to tailor its behavior:
Weighted Calculation: Option to adjust scoring to favor recent price action.
RSI Length: Sets the period for RSI calculation.
Source: The price data to be smoothed before RSI calculation, default is close.
MA Type: Choice from various moving averages to smooth the source data.
Smooth Length: Length of the moving average used for smoothing.
For Loop Range: Defines the historical range (a to b) for the scoring loop.
Thresholds: Custom thresholds to define when signals for uptrends or downtrends are generated.
Practical Applications
This indicator is particularly beneficial for:
Identifying Momentum Shifts: The scoring system helps in detecting potential changes in market momentum.
Noise Reduction: By smoothing the source data, it aims to provide more reliable RSI signals in volatile markets.
Trend Analysis: Assists in confirming or challenging the current market trend based on the smoothed RSI's performance.
Advantages and Strategic Value
The "MA Smoothed Source For RSI Loop" offers an advantage by focusing on cleaning the input data for RSI, which can lead to more accurate momentum readings. Its flexibility in configuration allows traders to adapt the indicator to different market conditions or asset volatilities, enhancing its strategic value in trading decisions.
Alerts and Visual Cues
Visual Signals: The indicator plots the loop score, with colors indicating uptrends (gold) or downtrends (blue). Horizontal lines at thresholds and shaded areas between them provide visual aids for trend analysis.
**No explicit alerts in the script, but users can set up custom alerts based on the signals.
Summary and Usage Tips
The "MA Smoothed Source For RSI Loop | Crypto_Mercenary_" provides a nuanced approach to RSI by smoothing the price data before its calculation, resulting in potentially more reliable signals. Traders can use this indicator to gain a clearer picture of market momentum, adjusting parameters to fit different market behaviors or trading strategies. Remember, the effectiveness of this tool largely depends on its customization to the specific market context.
Note: Backtests are based on past results and do not guarantee future performance.
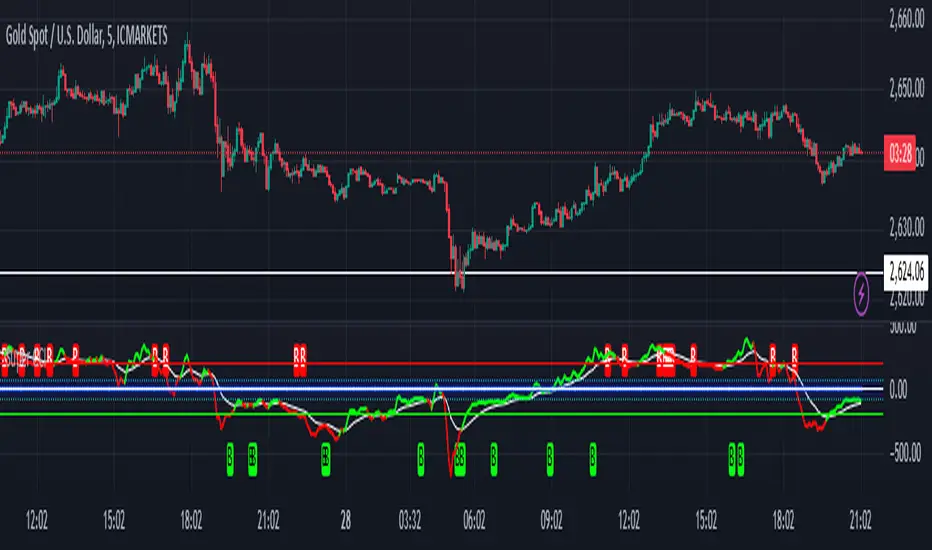
Position resetThe "Position Reset" indicator
The Position Reset indicator is a sophisticated technical analysis tool designed to identify possible entry points into short positions based on an analysis of market volatility and the behavior of various groups of bidders. The main purpose of this indicator is to provide traders with information about the current state of the market and help them decide whether to open short positions depending on the level of volatility and the mood of the main players.
The main components of the indicator:
1. Parameters for the RSI (Relative Strength Index):
The indicator uses two sets of parameters to calculate the RSI: one for bankers ("Banker"), the other for hot money ("Hot Money").
RSI for Bankers:
RSIBaseBanker: The baseline for calculating bankers' RSI. The default value is 50.
RSIPeriodBanker: The period for calculating the RSI for bankers. The default period is 14.
RSI for hot money:
RSIBaseHotMoney: The baseline for calculating the RSI of hot money. The default value is 30.
RSIPeriodHotMoney: The period for calculating the RSI for hot money. The default period is 21.
These parameters allow you to adjust the sensitivity of the indicator to the actions of different groups of market participants.
2. Sensitivity:
Sensitivity determines how strongly changes in the RSI will affect the final result of calculations. It is configured separately for bankers and hot money:
SensitivityBanker: Sensitivity for bankers' RSI. It is set to 2.0 by default.
SensitivityHotMoney: Sensitivity for hot money RSI. It is set to 1.0 by default.
Changing these parameters allows you to adapt the indicator to different market conditions and trader preferences.
3. Volatility Analysis:
Volatility is measured based on the length of the period, which is set by the volLength parameter. The default length is 30 candles. The indicator calculates the difference between the highest and lowest value for the specified period and divides this difference by the lowest value, thus obtaining the volatility coefficient.
Based on this coefficient, four levels of volatility are distinguished.:
Extreme volatility: The coefficient is greater than or equal to 0.25.
High volatility: The coefficient ranges from 0.125 to 0.2499.
Normal volatility: The coefficient ranges from 0.05 to 0.1249.
Low volatility: The coefficient is less than 0.0499.
Each level of volatility has its own significance for making decisions about entering a position.
4. Calculation functions:
The indicator uses several functions to process the RSI and volatility data.:
rsi_function: This function applies to every type of RSI (bankers and hot money). It adjusts the RSI value according to the set sensitivity and baseline, limiting the range of values from 0 to 20.
Moving Averages: Simple moving averages (SMA), exponential moving averages (EMA), and weighted moving averages (RMA) are used to smooth fluctuations. They are applied to different time intervals to obtain the average values of the RSI.
Thus, the indicator creates a comprehensive picture of market behavior, taking into account both short-term and long-term dynamics.
5. Bearish signals:
Bearish signals are considered situations when the RSI crosses certain levels simultaneously with a drop in indicators for both types of market participants (bankers and hot money).:
The bankers' RSI crossing is below the level of 8.5.
The current hot money RSI is less than 18.
The moving averages for banks and hot money are below their signal lines.
The RSI values for bankers are less than 5.
These conditions indicate a possible beginning of a downtrend.
6. Signal generation:
Depending on the current level of volatility and the presence of bearish signals, the indicator generates three types of signals:
Orange circle: Extremely high volatility and the presence of a bearish signal.
Yellow circle: High volatility and the presence of a bearish signal.
Green circle: Low volatility and the presence of a bearish signal.
These visual markers help the trader to quickly understand what level of risk accompanies each specific signal.
7. Notifications:
The indicator supports the function of sending notifications when one of the three types of signals occurs. The notification contains a brief description of the conditions under which the signal was generated, which allows the trader to respond promptly to a change in the market situation.
Advantages of using the "Position Reset" indicator:
Multi-level analysis: The indicator combines technical analysis (RSI) and volatility assessment, providing a comprehensive view of the current market situation.
Flexibility of settings: The ability to adjust the sensitivity parameters and the RSI baselines allows you to adapt the indicator to any market conditions and personal preferences of the trader.
Clear visualization: The use of colored labels on the chart simplifies the perception of information and helps to quickly identify key points for entering a trade.
Notification support: The notification sending feature makes it much easier to monitor the market, allowing you to respond to important events in time.

STDEV Multi TimeFrame [Snowdex]STDEV Multi TimeFrame
The STDEV Multi TimeFrame indicator plots standard deviation levels (+1SD, +2SD, +3SD, -1SD, -2SD, -3SD) based on a user-selected timeframe (1D, 1W, 1M, etc.). It helps identify volatility, trend strength, and potential reversal zones using Bollinger Bands-style deviation calculations.
Key Features:
✅ Multi-Timeframe Selection – Choose any timeframe for STDEV calculations.
✅ Customizable Bollinger Bands – Select SMA, EMA, RMA, or WMA as the baseline.
✅ Color-Coded STDEV Levels – Fast (Green), Medium (Orange), Slow (Red).
✅ Non-Repainting & Accurate – Uses request.security() for precise data retrieval.
✅ Extended Lines & Labels – Clear trend monitoring with formatted values.
Use Cases:
📌 Detect trend direction & volatility.
📌 Identify overbought/oversold zones.
📌 Use as dynamic support/resistance levels.
🚀 Ideal for stocks, forex, crypto, and options trading! 🚀

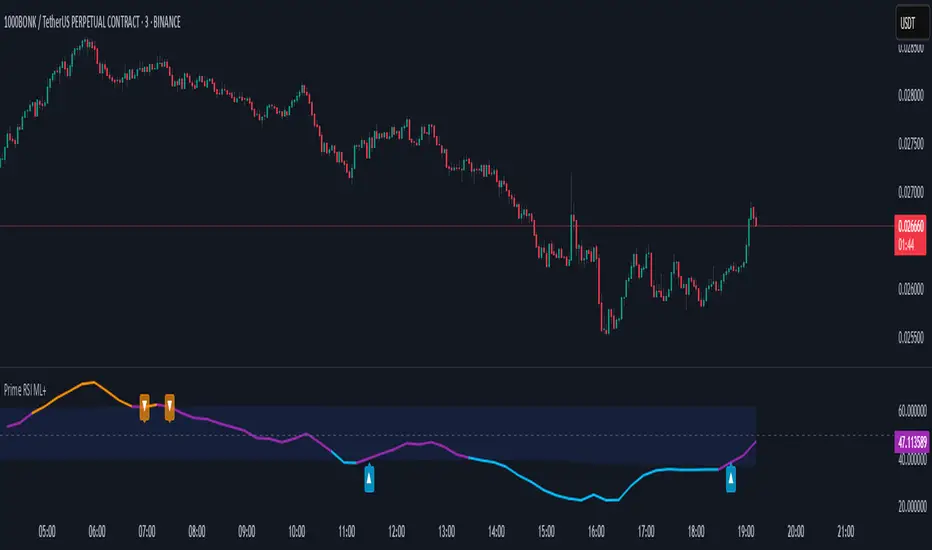
prime rsiThe "PRIME RSI" is a custom variation of the traditional RSI (Relative Strength Index) that offers enhanced flexibility and precision. This indicator provides an adaptable approach for tracking market conditions across different timeframes, making it an ideal tool for both short-term and long-term traders.
Key Features:
Custom Timeframe Selection: Users can select any timeframe to calculate the RSI, providing the ability to analyze data beyond the current chart's timeframe.
Smoothing Methods: Choose between Exponential Moving Average (EMA), Simple Moving Average (SMA), or the Relative Moving Average (RMA) for smoother, more accurate RSI values.
Signal Line: The signal line is smoothed using the selected method and visualized with dynamic coloring to indicate bullish (green) or bearish (red) market conditions.
Overbought/Oversold Levels: Clear levels at 70 (overbought) and 30 (oversold), with fill zones to highlight extreme market conditions, helping traders spot potential reversal points.
Midline at 50: The centerline at 50 serves as a neutral zone, allowing traders to identify shifts in market momentum quickly.
Practical Use:
Trend Confirmation: Use the PRIME RSI to confirm the prevailing market trend, with signals above 50 suggesting bullish momentum and signals below 50 indicating bearish trends.
Overbought/Oversold Conditions: The indicator’s overbought and oversold regions help pinpoint potential market reversals, giving traders valuable entry and exit signals.
Ideal For: All types of traders who want a more flexible and customizable RSI for better trend analysis, especially those working with smaller timeframes or seeking a more responsive momentum indicator.
On Balance Volume with Cross DetectionThis indicator enhances the On Balance Volume (OBV) indicator by detecting and visually highlighting crossovers and crossunders between the OBV and its smoothed moving average. The script colors the background of the chart to make these key events more noticeable: red highlights a bearish crossunder when the OBV crosses below the smoothed OBV, while green marks a bullish crossover when the OBV crosses above the smoothed OBV. By focusing on these significant interactions, the script provides traders with a clear visual cue to help identify potential buying and selling opportunities based on the relationship between OBV and its smoothed trend.
This script offers several customizable features to suit different trading preferences. The main editable parameter is the type of moving average used to smooth the OBV: you can choose from options such as Simple Moving Average (SMA), Exponential Moving Average (EMA), Smoothed Moving Average (RMA), Weighted Moving Average (WMA), or Volume Weighted Moving Average (VWMA). The length of the moving average can also be adjusted to better match the trader’s desired sensitivity, with the default set to 14 periods. These options allow traders to tailor the script to their preferred smoothing method and time frame, making it a flexible tool for a variety of strategies. The ability to switch between different moving averages and adjust their lengths ensures that the script can be adapted to various market conditions and trading styles.
This indicator enhances the analysis of the On Balance Volume (OBV) indicator by visually highlighting key crossovers and crossunders with its smoothed moving average. With customizable settings for different moving averages and lengths, traders can tailor the script to their specific strategies. By offering clear visual cues through background coloring, it helps quickly identify potential buy and sell signals. When combined with other technical analysis tools, this script can further improve trading decisions by providing additional context and confirmation, allowing traders to create a more robust and comprehensive trading strategy.

MA RSI MACD Signal SuiteThis Pine Script™ is designed for use in Trading View and generates trading signals based on moving average (MA) crossovers, RSI (Relative Strength Index) signals, and MACD (Moving Average Convergence Divergence) indicators. It provides visual markers on the chart and can be configured to suit various trading strategies.
1. Indicator Overview
The indicator includes signals for:
Moving Averages (MA): It tracks crossovers between different types of moving averages.
RSI: Signals based on RSI crossing certain levels or its signal line.
MACD: Buy and sell signals generated by MACD crossovers.
2. Inputs and Customization
Moving Averages (MAs):
You can customize up to 6 moving averages with different types, lengths, and colors.
MA Type: Choose from different types of moving averages:
SMA (Simple Moving Average)
EMA (Exponential Moving Average)
HMA (Hull Moving Average)
SMMA (RMA) (Smoothed Moving Average)
WMA (Weighted Moving Average)
VWMA (Volume Weighted Moving Average)
T3, DEMA, TEMA
Source: Select the price to base the MA on (e.g., close, open, high, low).
Length: Define the number of periods for each moving average.
Examples:
MA1: Exponential Moving Average (EMA) with a period of 9
MA2: Exponential Moving Average (EMA) with a period of 21
RSI Settings:
RSI is calculated based on a user-defined period and is used to identify potential overbought or oversold conditions.
RSI Length: Lookback period for RSI (default 14).
Overbought Level: Defines the overbought threshold for RSI (default 70).
Oversold Level: Defines the oversold threshold for RSI (default 30).
You can also adjust the smoothing for the RSI signal line and customize when to trigger buy and sell signals based on the RSI crossing these levels.
MACD Settings:
MACD is used for identifying changes in momentum and trends.
Fast Length: The period for the fast moving average (default 12).
Slow Length: The period for the slow moving average (default 26).
Signal Length: The period for the signal line (default 9).
Smoothing Method: Choose between SMA or EMA for both the MACD and the signal line.
3. Signal Logic
Moving Average (MA) Crossover Signals:
Crossover: A bullish signal is generated when a fast MA crosses above a slow MA.
Crossunder: A bearish signal is generated when a fast MA crosses below a slow MA.
The crossovers are plotted with distinct colors, and the chart will display markers for these crossover events.
RSI Signals:
Oversold Crossover: A bullish signal when RSI crosses over its signal line below the oversold level (30).
Overbought Crossunder: A bearish signal when RSI crosses under its signal line above the overbought level (70).
RSI signals are divided into:
Aggressive (Early) Entries: Signals when RSI is crossing the oversold/overbought levels.
Conservative Entries: Signals when RSI confirms a reversal after crossing these levels.
MACD Signals:
Buy Signal: Generated when the MACD line crosses above the signal line (bullish crossover).
Sell Signal: Generated when the MACD line crosses below the signal line (bearish crossunder).
Additionally, the MACD histogram is used to identify momentum shifts:
Rising to Falling Histogram: Alerts when the MACD histogram switches from rising to falling.
Falling to Rising Histogram: Alerts when the MACD histogram switches from falling to rising.
4. Visuals and Alerts
Plotting:
The script plots the following on the price chart:
Moving Averages (MA): The selected MAs are plotted as lines.
Buy/Sell Shapes: Triangular markers are displayed for buy and sell signals generated by RSI and MACD.
Crossover and Crossunder Markers: Crosses are shown when two MAs crossover or crossunder.
Alerts:
Alerts can be configured based on the following conditions:
RSI Signals: Alerts for oversold or overbought crossover and crossunder events.
MACD Signals: Alerts for MACD line crossovers or momentum shifts in the MACD histogram.
Alerts are triggered when specific conditions are met, such as:
RSI crosses over or under the oversold/overbought levels.
MACD crosses the signal line.
Changes in the MACD histogram.
5. Example Usage
1. Trend Reversal Setup:
Buy Signal: Use the RSI oversold crossover and MACD bullish crossover to identify potential entry points in a downtrend.
Sell Signal: Use the RSI overbought crossunder and MACD bearish crossunder to identify potential exit points or short entries in an uptrend.
2. Momentum Strategy:
Combine MACD and RSI signals to identify the strength of a trend. Use MACD histogram analysis and RSI levels for confirmation.
3. Moving Average Crossover Strategy:
Focus on specific MA crossovers, such as the 9-period EMA crossing above the 21-period EMA, for buy signals. When a longer-term MA (e.g., 50-period) crosses a shorter-term MA, it may indicate a strong trend change.
6. Alerts Conditions
The script includes several alert conditions, which can be triggered and customized based on the user’s preferences:
RSI Oversold Crossover: Alerts when RSI crosses over the signal line below the oversold level (30).
RSI Overbought Crossunder: Alerts when RSI crosses under the signal line above the overbought level (70).
MACD Buy/Sell Crossover: Alerts when the MACD line crosses the signal line for a buy or sell signal.
7. Conclusion
This script is highly customizable and can be adjusted to suit different trading strategies. By combining MAs, RSI, and MACD, traders can gain multiple perspectives on the market, enhancing their ability to identify potential buy and sell opportunities.

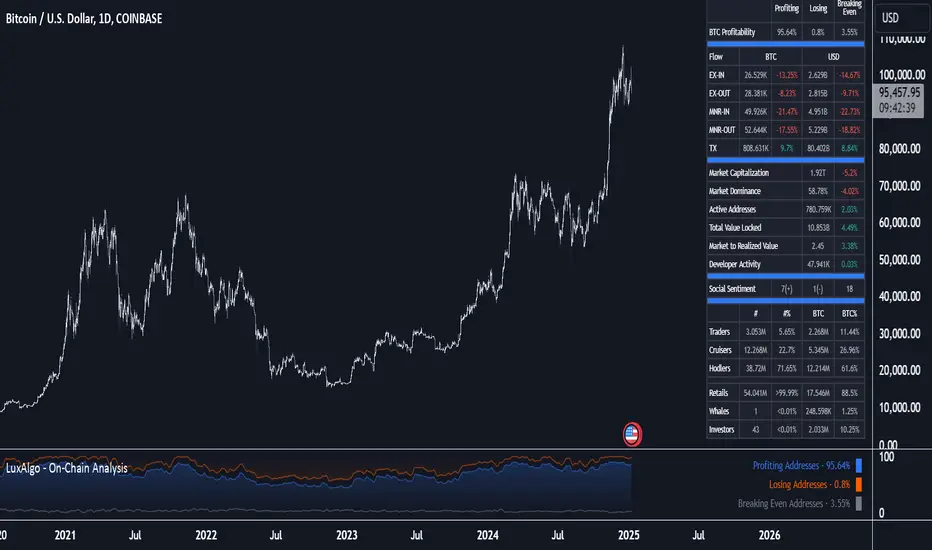
On-Chain Analysis [LuxAlgo]The On-Chain Analysis tool offers a comprehensive overview of essential on-chain metrics, enabling traders and investors to grasp the underlying activity and sentiment within the cryptocurrency market. By integrating metrics like wallet profitability, exchange flows, on-chain volume, social sentiment, and more into your charts, users can gain valuable insights into cryptocurrency network behavior, spot emerging trends, and better manage risk in the cryptocurrency market.
🔶 USAGE
🔹 On-Chain Analysis
When analyzing cryptocurrencies, several fundamental metrics are crucial for assessing the value and potential of a digital asset. This indicator is designed to help traders and analysts evaluate the markets by utilizing various data gathered directly from the blockchain. The gathered on-chain data includes wallet profitability, exchange flows, miner flows, on-chain volume, large buyers/sellers, market capitalization, market dominance, active addresses, total value locked (TVL), market value to realized value (MVRV), developer activity, social sentiment, holder behavior, and balance types.
Use wallet profitability and social sentiment metrics to gauge the overall mood of the market, helping to anticipate potential buying or selling pressure.
On-chain volume and active addresses provide insights into how actively a cryptocurrency is being used, indicating network health and adoption levels.
By tracking exchange flows and holder balance types, you can identify significant moves by whales or institutions, which may signal upcoming price shifts.
Market capitalization and miner flows give you an understanding of the supply side of the market, aiding in evaluating whether an asset is overvalued or undervalued.
The distribution of holdings among retail investors, whales, and institutional groups can greatly influence market dynamics. A large concentration of holdings by whales may indicate the potential for significant price swings, given their capacity to execute substantial trades. A higher proportion of institutional investors often suggests confidence in the asset's long-term potential, as these entities typically conduct thorough research before investing. While retail participation indicates broader adoption, it also introduces higher volatility, as these investors tend to be more reactive to market fluctuations.
Understanding the balance and behavior of short-term traders, mid-term cruisers, and long-term hodlers helps traders and analysts predict market trends and assess the underlying confidence in a particular cryptocurrency.
🔶 DETAILS
This script includes some of the most significant and insightful metrics in the crypto space, designed to evaluate and enhance trading decisions by assessing the value and growth potential of cryptocurrencies. The introduced metrics are:
🔹 Wallet Profitability
Definition: Represents the percentage distribution of addresses by profitability at the current price.
Importance: Indicates potential selling pressure or reduced selling pressure based on whether addresses are in profit or loss.
🔹 Exchange Flow
Definition: The total amount of a cryptocurrency moving in and out of exchanges.
Importance: Large inflows to exchanges can indicate potential selling pressure, while large outflows might suggest accumulation or long-term holding.
🔹 Miner Flow
Definition: Tracks the inflow and outflow of funds by miners.
Importance: High inflows could indicate selling pressure, whereas low inflows or outflows might reflect miner confidence.
🔹 On-Chain Volume
Definition: The total value of transactions conducted on a blockchain within a specific period.
Importance: On-chain volume reflects actual usage of the network, indicating how actively a cryptocurrency is being utilized for transactions.
🔹 Large Buyers/Sellers
Definition: Tracks the number of large buyers (bulls) and sellers (bears) based on transaction volume.
Importance: Comparing the number of large buyers (bulls) to large sellers (bears) helps gauge market trends and sentiment.
🔹 Market Capitalization
Definition: The total value of a cryptocurrency's circulating supply, calculated by multiplying the current price by the total supply.
Importance: Market cap is a key indicator of a cryptocurrency’s size and market dominance. It helps compare the relative size of different cryptocurrencies.
🔹 Market Dominance
Definition: Market dominance represents a cryptocurrency’s share of the total market capitalization of all cryptocurrencies. It is calculated by dividing the market cap of the cryptocurrency by the total market cap of the cryptocurrency market.
Importance: Market dominance is a crucial indicator of a cryptocurrency's influence and relative position in the market. It helps assess the strength of a cryptocurrency compared to others and provides insights into its market presence and potential influence.
Special Consideration: Since BTC and ETH dominance is relatively high compared to other cryptocurrencies, specific adjustments are made during the presentation of values and charts. When analyzing BTC, the total market capitalization is used. For ETH analysis, BTC is excluded from the total market cap. For any other cryptocurrency besides BTC and ETH, both BTC and ETH are excluded from the total market cap to provide a more accurate view.
🔹 Active Addresses
Definition: The number of unique addresses involved in transactions within a specific period.
Importance: A higher number of active addresses suggests greater network activity and user adoption, which can be a sign of a healthy ecosystem.
🔹 Total Value Locked (TVL)
Definition: The total value of assets locked in a decentralized finance (DeFi) protocol.
Importance: TVL is a key metric for DeFi platforms, indicating the level of trust and the amount of liquidity in a protocol.
🔹 Market Value to Realized Value (MVRV)
Definition: A ratio comparing the market cap to realized cap.
Importance: A high ratio may indicate overvaluation (potential selling), while a low ratio could signal undervaluation (potential buying).
🔹 Developer Activity
Definition: The level of activity on a cryptocurrency’s public repositories (e.g., GitHub).
Importance: Strong developer activity is a sign of ongoing innovation, updates, and a healthy project.
🔹 Social Sentiment
Definition: The general sentiment or mood of the community and investors as expressed on social media and forums.
Importance: Positive sentiment often correlates with price increases, while negative sentiment can signal potential downtrends.
🔹 Holder Balance (Behavior)
Definition: Distribution of addresses by holding behavior: Traders (short-term), Cruisers (mid-term), and Hodlers (long-term).
Importance: Helps predict market behavior based on different holder types.
🔹 Holder Balance (Type)
Definition: Distribution of cryptocurrency holdings among Retail (small holders), Whales (large holders), and Investors (institutional players).
Importance: Assesses the potential impact of different user groups on the market. A more decentralized distribution is generally viewed as positive, reducing the risk of price manipulation by large holders.
These metrics provide a comprehensive view of a cryptocurrency’s health, adoption, and potential for growth, making them essential for fundamental analysis in the crypto space.
🔶 SETTINGS
The script offers a range of customizable settings to tailor the analysis to your trading needs.
🔹 On-Chain Analysis
On-Chain Data: Choose the specific on-chain metric from the drop-down menu. Options include Wallet Profitability, Exchange Flow, Miner Flow, On-Chain Volume, Large Buyers/Sellers (Volume), Market Capitalization, Market Dominance, Active Addresses, Total Value Locked, Market Value to Realized Value, Developer Activity, Social Sentiment, Holder Balance (Behavior), and Holder Balance (Type).
Smoothing: Set the smoothing level to refine the displayed data. This can help in filtering out noise and getting a clearer view of trends.
Signal Line: Choose a signal line type (SMA, EMA, RMA, or None) and the length of the moving average for signal line calculation.
🔹 On-Chain Dashboard
On-Chain Stats: Toggle the display of the on-chain statistics.
Dashboard Size, Position, and Colors: Customize the size, position, and colors of the on-chain dashboard on the chart.
🔶 LIMITATIONS
Availability of on-chain data may vary and may not be accessible for all crypto assets.
🔶 RELATED SCRIPTS
Market-Sentiment-Technicals
MA Trend DashboardMA Trend Dashboard - Features
The MA Trend Dashboard is a versatile and user-friendly indicator designed to provide a comprehensive overview of market trends across multiple timeframes using moving averages (MAs). Here's what this script offers:
1. Dashboard Display
A compact and visually appealing dashboard is overlaid on the chart.
The dashboard displays the trend direction and deviation percentages for 30-minute, 1-hour, and 4-hour timeframes.
Users can position the dashboard in different locations (Top Right, Middle Right, or Bottom Right) and customize the text size (Tiny, Small, Normal).
2. Multi-Timeframe Trend Analysis
The script uses the concept of Multi-Timeframe (MTF) analysis to assess trends across:
30-minute (30m)
1-hour (1h)
4-hour (4h)
Each timeframe's trend is evaluated using the selected moving average method.
3. Customizable Moving Average Methods
Users can choose from various moving average calculation methods:
SMA (Simple Moving Average)
EMA (Exponential Moving Average)
SMMA (Smoothed Moving Average or RMA)
WMA (Weighted Moving Average)
VWMA (Volume-Weighted Moving Average)
This flexibility allows for tailored trend analysis based on the user's preferred methodology.
4. Visual Trend Indicators
Clear visual cues indicate the trend direction for each timeframe:
↑ (Up): Bullish trend.
↓ (Down): Bearish trend.
↘ (Weak Up): Mild bullishness.
↗ (Weak Down): Mild bearishness.
The background color of each cell dynamically changes based on the trend:
Green: Uptrend.
Red: Downtrend.
5. Deviation Percentage
The dashboard includes the percentage difference between the current price and the moving average for each timeframe.
Positive percentages are highlighted in green, and negative percentages in red.
6. Customization Options
Text Color: Allows users to adjust the color of the text displayed in the dashboard.
MA Length: Users can set the period for the moving averages (default is 50).
7. Dynamic Requests
Utilizes TradingView's dynamic_requests feature to ensure accurate real-time data across different timeframes without cluttering the chart.
Usage
This indicator is ideal for traders who want a quick and reliable snapshot of market trends across multiple timeframes. It is particularly suited for intraday and swing trading strategies, offering insights into price momentum and potential reversals.

RISK MANAGEMENT TABLEThis updated Risk Management Indicator is a powerful and customizable tool designed to help traders effectively manage risk on every trade. By dynamically calculating position size, stop-loss, and take-profit levels, it enables traders to stay disciplined and follow predefined risk parameters directly on their charts.
Features:
Dynamic Stop-Loss and Take-Profit Levels:
Stop-loss is based on the Average True Range (ATR), offering a flexible way to account for
market volatility.
Take-profit levels can be customized as a percentage of the entry price, providing a clear
target for trade exits.
Position Sizing Calculation:
The indicator computes the maximum position size by considering:
Trade amount (montant_ligne).
Risk percentage per trade.
Transaction fees.
Visual Representation:
Displays stop-loss and take-profit levels on the chart as customizable lines.
Optional visibility of these lines through checkboxes in the settings panel.
Comprehensive Risk Table:
A table on the chart summarizes essential risk metrics:
Stop-loss value.
Distance from entry in percentage.
Position size (maximum suggested).
Take-profit price.
Customizable:
Adjust parameters like ATR length, smoothing type, risk percentage, transaction fees,
and take-profit percentage.
Modify the visual length of lines representing stop-loss and take-profit levels.
How It Works:
Stop-Loss Calculation:
The stop-loss level is calculated using ATR and a volatility factor (default: 2).
This ensures your stop-loss adapts to market conditions.
Take-Profit Calculation:
Take-profit is derived as a percentage increase from the entry price.
Position Size:
The optimal position size is computed as:
Position Size = Risk per Trade /ATR-based Stop Distance
The risk per trade deducts transaction fees to provide a more accurate calculation.
Visual Lines:
Risk Table:
The table displays updated stop-loss, position size, and take-profit metrics at a glance.
Settings Panel:
Length: ATR length for calculating market volatility.
Smoothing: Choose RMA, SMA, EMA, or WMA for ATR smoothing.
Trade Amount: The capital allocated to a single trade.
Risk by Trade (%): Define how much of your trade capital is at risk per trade.
Transaction Fees: Input fees to ensure realistic calculations.
Take Profit (%): Specify your desired take-profit percentage.
Show Entry Stop Loss: Toggle visibility of the stop-loss line.
Show Entry Take Profit: Toggle visibility of the take-profit line.

DT Bollinger BandsIndicator Overview
Purpose: The script calculates and plots Bollinger Bands, a technical analysis tool that shows price volatility by plotting:
A central moving average (basis line).
Upper and lower bands representing price deviation from the moving average.
Additional bands for a higher deviation threshold (3 standard deviations).
Customization: Users can customize:
The length of the moving average.
The type of moving average (e.g., SMA, EMA).
The price source (e.g., close price).
Standard deviation multipliers for the bands.
Fixed Time Frame: The script can use a fixed time frame (e.g., daily) for calculations, regardless of the chart's time frame.
Key Features
Moving Average Selection:
The user can select the type of moving average for the basis line:
Simple Moving Average (SMA)
Exponential Moving Average (EMA)
Smoothed Moving Average (SMMA/RMA)
Weighted Moving Average (WMA)
Volume Weighted Moving Average (VWMA)
Standard Deviation Multipliers:
Two multipliers are used:
Standard (default = 2.0): For the original Bollinger Bands.
Larger (default = 3.0): For additional bands.
Bands Calculation:
Basis Line: The selected moving average.
Upper Band: Basis + Standard Deviation.
Lower Band: Basis - Standard Deviation.
Additional Bands: Representing ±3 Standard Deviations.
Plots:
Plots the basis, upper, and lower bands.
Fills the area between the bands for visual clarity.
Plots and fills additional bands for ±3 Standard Deviations with lighter colors.
Alerts:
Generates an alert when the price enters the range between the 2nd and 3rd standard deviation bands.
The alert can be used to notify when price volatility increases significantly.
Background Highlighting:
Colors the chart background based on alert conditions:
Green if the price is above the basis line.
Red if the price is below the basis line.
Offset:
Adds an optional horizontal offset to the plots for fine-tuning their alignment.
How It Works
Input Parameters:
The user specifies settings such as moving average type, length, multipliers, and fixed time frame.
Calculations:
The script computes the basis (moving average) and standard deviations on the fixed time frame.
Bands are calculated using the basis and multipliers.
Plotting:
The basis line and upper/lower bands are plotted with distinct colors.
Additional 3 StdDev bands are plotted with lighter colors.
Alerts:
An alert condition is created when the price moves between the 2nd and 3rd standard deviation bands.
Visual Enhancements:
Chart background changes color dynamically based on the price’s position relative to the basis line and alert conditions.
Usage
This script is useful for traders who:
Want a detailed visualization of price volatility.
Use Bollinger Bands to identify breakout or mean-reversion trading opportunities.
Need alerts when the price enters specific volatility thresholds.

EMA with VWAPThis indicator combines two popular technical analysis tools: the Exponential Moving Average (EMA) and the Volume Weighted Average Price (VWAP), into a single, powerful overlay on your chart. It allows you to analyze both trend direction using the EMA and institutional interest and fair value using the VWAP, all while saving valuable indicator slots on your TradingView layout.
Key Features:
- Exponential Moving Average (EMA):
- Calculates the EMA based on a user-defined Length and Source (e.g., close, open, hl2).
- Includes an optional Offset to shift the EMA line forward or backward on the chart.
- Offers a Smoothing Line feature, allowing you to further smooth the EMA using various moving average types (SMA, EMA, SMMA (RMA), WMA, VWMA) with a customizable Smoothing Length.
- EMA and Smoothing Line can be toggled on or off.
- EMA and Smoothing Line have independent offset capabilities.
Volume Weighted Average Price (VWAP):
-Calculates the VWAP, a crucial indicator that reflects the average price weighted by volume.
- Offers a wide range of Anchor Periods for resetting the VWAP calculation, including: Session, Week, Month, Quarter, Year, Decade, Century, Earnings, Dividends, and Splits.
- Includes an optional Offset to shift the VWAP line.
- Option to Hide VWAP on 1D or Above timeframes to focus on intraday analysis.
- Provides up to three customizable Standard Deviation Bands above and below the VWAP, visually representing volatility and potential support/resistance levels.
- Bands can be calculated using either "Standard Deviation" or "Percentage" methods.
- Bands can be turned on or off independently.
How to Use:
- EMA: Use the EMA to identify the overall trend direction. An upward-sloping EMA suggests an uptrend, while a downward-sloping EMA suggests a downtrend. The Smoothing Line can help confirm the EMA's trend.
- VWAP: The VWAP acts as a benchmark for the "fair" price of an asset during the selected anchor period. Prices above the VWAP may indicate bullish sentiment, while prices below may indicate bearish sentiment.
- Bands: The Standard Deviation Bands can help identify potential overbought and oversold conditions. Price reaching the upper bands might suggest overbought levels, while price reaching the lower bands might suggest oversold levels.
Customization:
- The indicator offers extensive customization through its settings:
- EMA Settings: Adjust the EMA length, source, offset, smoothing method, and smoothing length.
- VWAP Settings: Choose the VWAP anchor period, source, offset, and whether to hide it on daily or higher timeframes.
- VWAP Bands Settings: Control the visibility, multiplier, and calculation method for each of the three standard deviation bands.
Benefits:
- Consolidated Analysis: Combines two essential indicators into one, providing a comprehensive view of price action and volume.
- Saves Indicator Slots: Frees up valuable indicator slots on your TradingView chart.
- Highly Customizable: Offers a wide range of settings to tailor the indicator to your specific trading style and preferences.
- Visual Clarity: Clearly displays the EMA, VWAP, and optional bands on the chart, facilitating quick and easy analysis.
This combined EMA and VWAP indicator is a valuable tool for traders of all levels, offering a powerful and flexible way to analyze market trends and identify potential trading opportunities.
[blackcat] L1 Simple Dual Channel Breakout█ OVERVIEW
The script " L1 Simple Dual Channel Breakout" is an indicator designed to plot dual channel breakout bands and their long-term EMAs on a chart. It calculates short-term and long-term moving averages and deviations to establish upper, lower, and middle bands, which traders can use to identify potential breakout opportunities.
█ LOGICAL FRAMEWORK
Structure:
The script is structured into several main sections:
• Input Parameters: The script does not explicitly define input parameters for the user to adjust, but it uses default values for short_term_length (5) and long_term_length (181).
• Calculations: The calculate_dual_channel_breakout function performs the core calculations, including the blast condition, typical price, short-term and long-term moving averages, and dynamic moving averages.
• Plotting: The script plots the short-term bands (upper, lower, and middle) and their long-term EMAs. It also plots conditional line breaks when the short-term bands cross the long-term EMAs.
Flow of Data and Logic:
1 — The script starts by defining the calculate_dual_channel_breakout function.
2 — Inside the function, it calculates various moving averages and deviations based on the input prices and lengths.
3 — The function returns the calculated bands and EMAs.
4 — The script then calls this function with predefined lengths and plots the resulting bands and EMAs on the chart.
5 — Conditional plots are added to highlight breakouts when the short-term bands cross the long-term EMAs.
█ CUSTOM FUNCTIONS
The script defines one custom function:
• calculate_dual_channel_breakout(close_price, high_price, low_price, short_term_length, long_term_length): This function calculates the short-term and long-term bands and EMAs. It takes five parameters: close_price, high_price, low_price, short_term_length, and long_term_length. It returns an array containing the upper band, lower band, middle band, long-term upper EMA, long-term lower EMA, and long-term middle EMA.
█ KEY POINTS AND TECHNIQUES
• Typical Price Calculation: The script uses a modified typical price calculation (2 * close_price + high_price + low_price) / 4 instead of the standard (high_price + low_price + close_price) / 3.
• Short-term and Long-term Bands: The script calculates short-term bands using a simple moving average (SMA) of the typical price and long-term bands using a relative moving average (RMA) of the close price.
• Conditional Plotting: The script uses conditional plotting to highlight breakouts when the short-term bands cross the long-term EMAs, enhancing visual identification of trading signals.
• EMA for Long-term Trends: The use of Exponential Moving Averages (EMAs) for long-term bands helps in smoothing out short-term fluctuations and focusing on long-term trends.
█ EXTENDED KNOWLEDGE AND APPLICATIONS
• Modifications: Users can add input parameters to allow customization of short_term_length and long_term_length, making the indicator more flexible.
• Enhancements: The script could be extended to include alerts for breakout conditions, providing traders with real-time notifications.
• Alternative Bands: Users might experiment with different types of moving averages (e.g., WMA, HMA) for the short-term and long-term bands to see if they yield better results.
• Additional Indicators: Combining this indicator with other technical indicators (e.g., RSI, MACD) could provide a more comprehensive trading strategy.
• Backtesting: Users can backtest the strategy using Pine Script's strategy functions to evaluate its performance over historical data.

SnowdexUtilsLibrary "SnowdexUtils"
the various function that often use when create a strategy trading.
f_backtesting_date(train_start_date, train_end_date, test_date, deploy_date)
Backtesting within a specific window based on deployment and testing dates.
Parameters:
train_start_date (int) : the start date for training the strategy.
train_end_date (int) : the end date for training the strategy.
test_date (bool) : if true, backtests within the period from `train_end_date` to the current time.
deploy_date (bool) : if true, the strategy backtests up to the current time.
Returns: given time falls within the specified window for backtesting.
f_init_ma(ma_type, source, length)
Initializes a moving average based on the specified type.
Parameters:
ma_type (simple string) : the type of moving average (e.g., "RMA", "EMA", "SMA", "WMA").
source (float) : the input series for the moving average calculation.
length (simple int) : the length of the moving average window.
Returns: the calculated moving average value.
f_init_tp(side, entry_price, rr, sl_open_position)
Calculates the target profit based on entry price, risk-reward ratio, and stop loss. The formula is `tp = entry price + (rr * (entry price - stop loss))`.
Parameters:
side (bool) : the trading side (true for long, false for short).
entry_price (float) : the entry price of the position.
rr (float) : the risk-reward ratio.
sl_open_position (float) : the stop loss price for the open position.
Returns: the calculated target profit value.
f_round_up(number, decimals)
Rounds up a number to a specified number of decimals.
Parameters:
number (float)
decimals (int)
Returns: The rounded-up number.
f_get_pip_size()
Calculates the pip size for the current instrument.
Returns: Pip size adjusted for Forex instruments or 1 for others.
f_table_get_position(value)
Maps a string to a table position constant.
Parameters:
value (string) : String representing the desired position (e.g., "Top Right").
Returns: The corresponding position constant or `na` for invalid values.

Super CCI By Baljit AujlaThe indicator you've shared is a custom CCI (Commodity Channel Index) with multiple types of Moving Averages (MA) and Divergence Detection. It is designed to help traders identify trends and reversals by combining the CCI with various MAs and detecting different types of divergences between the price and the CCI.
Key Components of the Indicator:
CCI (Commodity Channel Index):
The CCI is an oscillator that measures the deviation of the price from its average price over a specific period. It helps identify overbought and oversold conditions and the strength of a trend.
The CCI is calculated by subtracting a moving average (SMA) from the price and dividing by the average deviation from the SMA. The CCI values fluctuate above and below a zero centerline.
Multiple Moving Averages (MA):
The indicator allows you to choose from a variety of moving averages to smooth the CCI line and identify trend direction or support/resistance levels. The available types of MAs include:
SMA (Simple Moving Average)
EMA (Exponential Moving Average)
WMA (Weighted Moving Average)
HMA (Hull Moving Average)
RMA (Running Moving Average)
SMMA (Smoothed Moving Average)
TEMA (Triple Exponential Moving Average)
DEMA (Double Exponential Moving Average)
VWMA (Volume-Weighted Moving Average)
ZLEMA (Zero-Lag Exponential Moving Average)
You can select the type of MA to use with a specified length to help identify the trend direction or smooth out the CCI.
Divergence Detection:
The indicator includes a divergence detection mechanism to identify potential trend reversals. Divergences occur when the price and an oscillator like the CCI move in opposite directions, signaling a potential change in price momentum.
Four types of divergences are detected:
Bullish Divergence: Occurs when the price makes a lower low, but the CCI makes a higher low. This indicates a potential reversal to the upside.
Bearish Divergence: Occurs when the price makes a higher high, but the CCI makes a lower high. This indicates a potential reversal to the downside.
Hidden Bullish Divergence: Occurs when the price makes a higher low, but the CCI makes a lower low. This suggests a continuation of the uptrend.
Hidden Bearish Divergence: Occurs when the price makes a lower high, but the CCI makes a higher high. This suggests a continuation of the downtrend.
Each type of divergence is marked on the chart with arrows and labels to alert traders to potential trading opportunities. The labels include the divergence type (e.g., "Bull Div" for Bullish Divergence) and have customizable text colors.
Visual Representation:
The CCI and its associated moving average are plotted on the indicator panel below the price chart. The CCI is plotted as a line, and its color changes depending on whether it is above or below the moving average:
Green when the CCI is above the MA (indicating bullish momentum).
Red when the CCI is below the MA (indicating bearish momentum).
Horizontal lines are drawn at specific levels to help identify key CCI thresholds:
200 and -200 levels indicate extreme overbought or oversold conditions.
75 and -75 levels represent less extreme levels of overbought or oversold conditions.
The 0 level acts as a neutral or baseline level.
A background color fill between the 75 and -75 levels helps highlight the neutral zone.
Customization Options:
CCI Length: You can customize the length of the CCI, which determines the period over which the CCI is calculated.
MA Length: The length of the moving average applied to the CCI can also be adjusted.
MA Type: Choose from a variety of moving averages (SMA, EMA, WMA, etc.) to smooth the CCI.
Divergence Detection: The indicator automatically detects the four types of divergences (bullish, bearish, hidden bullish, hidden bearish) and visually marks them on the chart.
How to Use the Indicator:
Trend Identification: When the CCI is above the selected moving average, it suggests bullish momentum. When the CCI is below the moving average, it suggests bearish momentum.
Overbought/Oversold Conditions: The CCI values above 100 or below -100 indicate overbought and oversold conditions, respectively.
Divergence Analysis: The detection of bullish or bearish divergences can signal potential trend reversals. Hidden divergences may suggest trend continuation.
Trading Signals: You can use the divergence markers (arrows and labels) as potential buy or sell signals, depending on whether the divergence is bullish or bearish.
Practical Application:
This indicator is useful for traders who want to:
Combine the CCI with different moving averages for trend-following strategies.
Identify overbought and oversold conditions using the CCI.
Use divergence detection to anticipate potential trend reversals or continuations.
Have a highly customizable tool for various trading strategies, including trend trading, reversal trading, and divergence-based trading.
Overall, this is a comprehensive tool that combines multiple technical analysis techniques (CCI, moving averages, and divergence) in a single indicator, providing traders with a robust way to analyze price action and spot potential trading opportunities.
Weighted Average Strength Index (WASI)Weighted Average Strength Index (WASI)
The Weighted Average Strength Index (WASI) is a variation of the standard RSI. It uses the Weighted Moving Average (WMA) instead of the Running Moving Average (RMA), making it more responsive to recent price changes. The hypothesis is that this weighted calculation might better capture momentum shifts, providing traders with more timely insights.
How to Use:
Backtest WASI on your preferred assets and timeframes to evaluate its effectiveness for your strategy.
Use for trend following or mean reversion :
- Overbought/Oversold (OB/OS) levels can signal potential mean-reversion opportunities.
- Midline (50 level) crossovers can be used for trend-following strategies.
- WASI and its moving average (MA) crossovers offer additional trend-following or reversal signals.
Parameters and Their Functions:
WASI Length: Determines the number of periods for WASI calculation. A longer length smooths the indicator but increases lag, while a shorter length makes it more sensitive. (When in doubt, go longer).
Source: The price source for the calculation (e.g., close, open, high, or low).
MA Type: Specifies the type of moving average applied to the WASI (options include SMA, EMA, WMA, HMA, and others).
MA Length: The number of periods for the moving average used on the WASI. Higher will lead to a smoother moving average.
Indicator Features:
Dynamic OB/OS Levels: Default overbought (70) and oversold (30) levels help identify potential reversal zones.
Midline Crossover: WASI crossing above or below the 50 level may indicate a trend shift.
WASI-MA Crossover: Crossovers between WASI and its moving average can signal trend-following or mean-reversion opportunities.
Disclaimer:
This indicator is a tool for analysis and should be used in conjunction with other forms of analysis or confirmation. Past performance does not guarantee future results.

Bull Bear Candles with Volume ProfileUser Guide for Bull Bear Candles Indicator with Keltner Channels
Author: NellyN
Introduction
This indicator helps identify potential bullish and bearish trends in the market by analyzing buying and selling volume over two configurable timeframes. It calculates the percentage of buying and selling volume and displays the current market condition based on two moving averages for 2 periods.
Key Features
• Volume Analysis : Calculates Buy and Sell Volume for two configurable timeframes (e.g., 5 min, 15 min, 15 min. and 1 hour, etc.) and displays them as percentages.
• Moving Averages : Uses one Moving Average (MA) for two different time periods to identify trends (uptrend when shorter-term MA is above longer-term MA). You can also choose other Moving Average types like SMA, EMA, WMA, RMA, VWMA, or HMA.
• Colored Candles : Candles are colored green for bullish conditions, red for bearish conditions, and gray for neutral conditions.
• Market Condition Labels : Displays labels in table-view indicating the current market condition based on Buy and Sell Volume (Very Bullish, Very Bearish, Bullish/Bearish Retracement, Chop).
• Alerts: Generates alerts for potential buy and sell signals based on indicator conditions (Note: Enable alerts in the indicator settings).
• Visual Signals: Provides visual signals through colored candles and market condition labels in addition to alerts.
Input Parameters
• Source: Close price (default) or Heikin Ashi
• Timeframe: Select the timeframe for price and volume data used in the indicator (e.g., Daily, Hourly).
• Colored Candles On: Enable (True) or disable (False) coloring candles based on market conditions.
• Enable Alerts: Enable (True) or disable (False) alerts for buy/sell signals.
• Length of MA: Sets the length for the MAs used in trend identification (minimum 1).
• Lookback Period Vol. 1 & 2: Define the timeframes used to calculate buying and selling volume and the MA calculation (e.g., 5 min, 15 min).
Understanding the Outputs
• Cloud Fill: The area between two MAs is filled with a color that reflects the trend (green for uptrend, red for downtrend).
• Table: Shows Buy Volume, Sell Volume, Buy Percentage, Sell Percentage, and the current Market Condition Labels. (If you decide to see them uncomment them from the code simply removing the // in front of the code)
• Colored Candles and Market Condition Labels: Look for green candles and bullish labels for potential buying opportunities, and vice versa for red candles and bearish labels.
Bullish green label appears when short-term MA is above long-term MA AND Buy Volume percentage is greater than 50%.
Red cross for exiting long entry appears when we have bearish volume OR bearish crossover of the MA for the 2 periods.
Bearish red label appears when short-term MA is below long-term MA AND Buy Volume percentage is less than 50%.
Green cross for exiting short entry appears when we have bullish volume OR bullish crossover of the MA for the 2 periods.
• Bullish/Bearish Retracement: The moving averages indicate a potential trend reversal, while the Buy Volume percentage suggests a continuation of the prior trend. The candle color may be green, red, or gray depending on the current price position relative to the moving averages.
• Chop (Gray Candle): The moving averages are flat and the Buy Volume percentage is not significantly above or below 50%.
• Buy/Sell Alerts: The indicator generates alerts based on specific conditions, but these should be used in conjunction with other trading strategies and careful risk management.
Important Notes
• This indicator is for informational purposes only and should not be considered financial advice. Back-test the indicator with historical data to understand its performance before using it for live trading.
• Combine this indicator with other technical analysis tools.

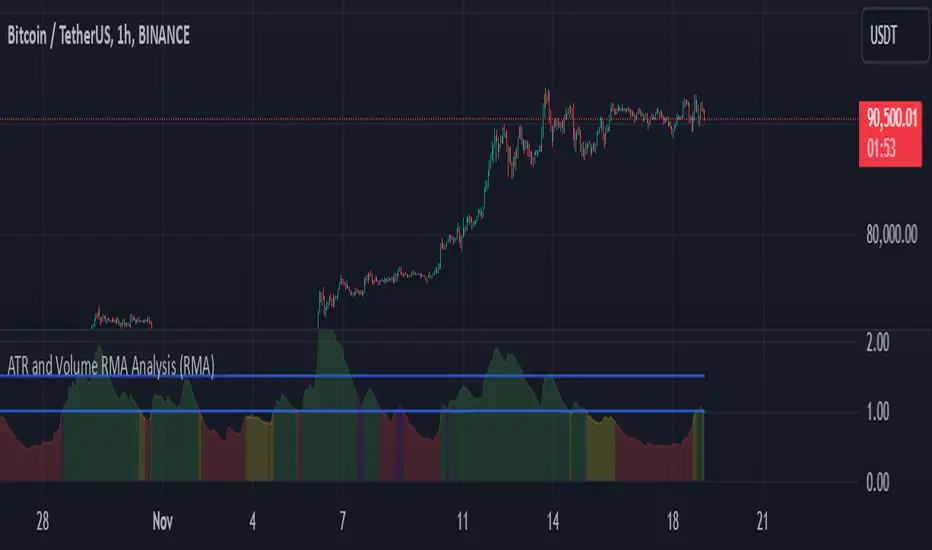
ATR and Volume AnalysisHi!
I would like to present an indicator that's meant to measure ratio of Volatility to Volume.
Basically it measures 2 moving averages (14 and 100 period) of ATR and Volume and then compares them. The output is ATR14 / Vol14
Color scheme
Red: Volume and ATR is both below 14 period
Green: Both are above
Yellow: Volume up, volatility down
Purple: Volume down, volatility up
Then there are two lines - 1 and 1.5
That is, in my opinion, the most optimal state to trade, because 1 means that there is some volatility and it's confirmed by volume. Above 1,5 you could see it as overbought (or oversold) zone. If it's above this line, we could expect a retracement since the volatility is not backed by volume. Above 2 it's quite critical and I would suggest closing trades.
(You can use it across all timeframes. In fact it's better if you do so. Longer timeframes are good for spotting tradeable markets while shorter timeframes show overbought / oversold zones)
I have also added option to choose between 4 different moving averages, but in my opinion RMA works the best.
Feel free to share some feedback, I would really appreciate it.
Sincerely,
Beefmaster
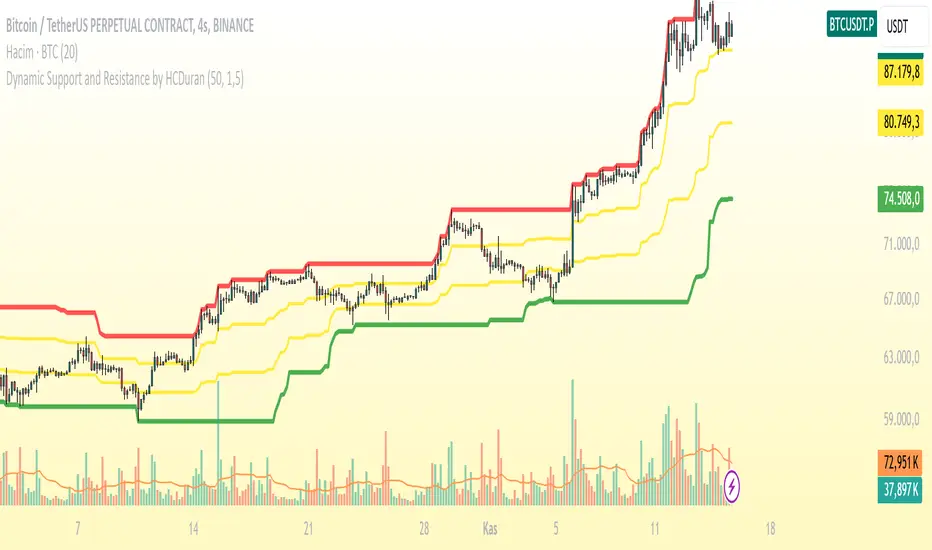
Dynamic Support and Resistance by HCDuranThis indicator dynamically plots support and resistance levels based on price action. It calculates the strongest support and resistance levels using the highest and lowest prices over a specified period, and visualizes these levels with different colors. Strong support and resistance are marked in **green** and **red** respectively, while **mid-range** support and resistance levels are displayed in **yellow**.
### Features:
- **Strong Support (Green):** The lowest price level over the last 50 bars.
- **Strong Resistance (Red):** The highest price level over the last 50 bars.
- **Mid Support (Yellow):** A support level above the strong support but below the resistance range.
- **Mid Resistance (Yellow):** A resistance level below the strong resistance but above the support range.
### Usage:
1. **Support and Resistance:** The indicator calculates dynamic support and resistance levels based on the most recent price action over a specified lookback period (e.g., 50 bars). These levels are then plotted on the chart for easy visualization.
2. **Alerts:** Alerts are triggered when the price crosses below the strong support or above the strong resistance. This can be useful for identifying potential breakouts or reversals.
### Help for Users:
This indicator helps to identify potential price reversal points by plotting dynamic support and resistance levels. Strong support or resistance levels can indicate areas where the price is likely to reverse, while mid-range levels can provide additional insights into price trends and ranges.
**Note:** The performance of this indicator may vary depending on the selected lookback period and time frame. It is recommended to experiment with different timeframes to see how the indicator performs under various market conditions.
-------------------------------------------------------------------------------------------------------------------
Bu indikatör, fiyat hareketlerine dayalı olarak dinamik destek ve direnç seviyelerini çizer. En yüksek ve en düşük seviyeler arasındaki farkı göz önünde bulundurarak, güçlü direnç ve destek seviyelerini kırmızı ve yeşil renklerle, orta seviyeleri ise sarı renk ile gösterir.
### Özellikler:
- **Güçlü Destek (Yeşil):** En düşük fiyat seviyesinin 50 barlık bir zaman dilimi boyunca belirlenen seviyesi.
- **Güçlü Direnç (Kırmızı):** En yüksek fiyat seviyesinin 50 barlık bir zaman dilimi boyunca belirlenen seviyesi.
- **Orta Destek (Sarı):** Destek seviyesinin üstünde, ancak güçlü destek seviyesinden daha yüksek bir seviyedir.
- **Orta Direnç (Sarı):** Direnç seviyesinin altında, ancak güçlü direnç seviyesinden daha düşük bir seviyedir.
### Kullanım:
1. **Destek ve Direnç:** Bu indikatör, belirli bir süre dilimindeki fiyat hareketlerine dayalı olarak destek ve direnç seviyelerini belirler ve çizer. Fiyat bu seviyelere yaklaşırken, seviyelerin ne kadar güçlü olduğunu görsel olarak değerlendirebilirsiniz.
2. **Uyarılar:** İndikatör, fiyatın güçlü destek seviyesinin altına düşmesi veya güçlü direnç seviyesinin üstüne çıkması durumunda uyarılar tetikler. Bu, trade kararları alırken önemli sinyaller sağlayabilir.
### Kullanıcıya Yardım:
Bu indikatör, dinamik destek ve direnç seviyeleri belirleyerek, potansiyel geri dönüş noktalarını ve fiyat hareketinin yönünü anlamaya yardımcı olur. Fiyatın güçlü seviyeleri kırması, önemli trade fırsatları gösterebilir.
**Not:** İndikatörün performansı, bakılan zaman dilimine ve seçilen lookback periyoduna göre değişebilir. Farklı zaman dilimlerinde kullanarak daha doğru sinyaller elde edebilirsiniz.
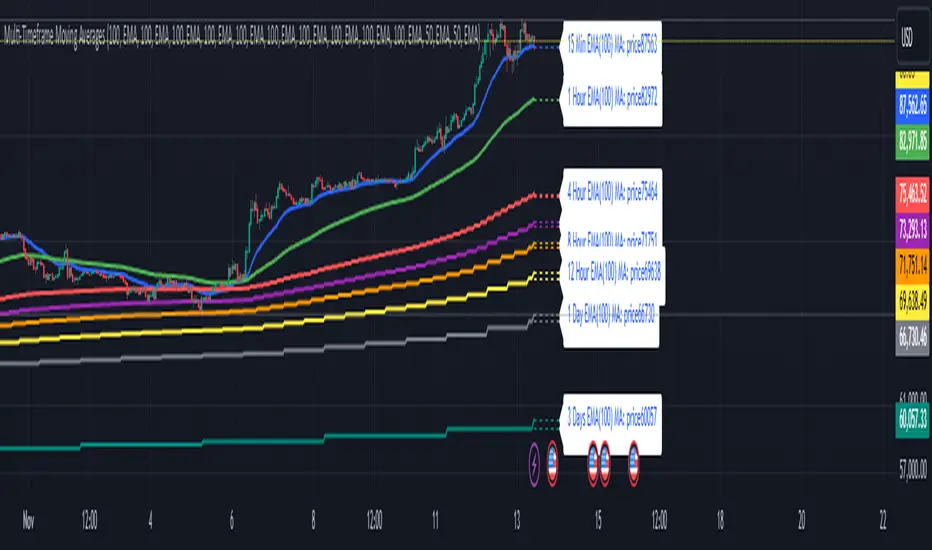
Multi-Timeframe Moving Averages by Skyito"Hope everyone likes this and finds it useful! This multi-timeframe moving average indicator provides a comprehensive view of moving averages from various timeframes directly on one chart. It’s designed to help traders analyze market trends and levels more effectively without constantly switching between charts.
Script Explanation: This indicator supports a range of moving average types, including SMA, EMA, HMA, WMA, VWMA, RMA, SSMA, and DEMA, allowing for flexibility in analysis. Each moving average is fully customizable by length and type for each timeframe, giving you control over how trends are represented.
The indicator includes timeframes such as 15 minutes, 1 hour, 4 hours, 6 hours, 8 hours, 12 hours, 1 day, 3 days, 5 days, 1 week, 3 weeks, and 1 month. Each moving average is displayed as a line with a small dashed extension, showing a label that contains the moving average’s timeframe, type, and current price level. The dark blue labels are slightly enlarged to enhance readability on the chart, making it easier to track important levels at a glance.
Use Case: This tool is ideal for traders looking to stay aware of trend levels across multiple timeframes on one chart. Adjusting the moving averages’ lengths and types enables customization for any strategy, while the label information provides an immediate understanding of the timeframe and trend context.
Enjoy the streamlined view and the added insights from multi-timeframe analysis!"
Auto Fibonacci ModePurpose of the Code:
This Pine Script™ code defines an indicator called "Auto Fibonacci Mode" that automatically plots Fibonacci retracement and extension levels based on recent price data, providing traders with reference levels for potential support and resistance. It also offers an "Auto" mode that determines levels based on the selected moving average type (e.g., EMA, SMA) for added flexibility in trend identification.
Key Components and Functionalities:
Inputs:
lookback (Lookback): Determines how many bars back to look when identifying the highest and lowest prices.
reverse: Reverses the direction of Fibonacci calculations, which is helpful for analyzing both uptrends and downtrends.
auto: When enabled, this option automatically adjusts Fibonacci levels based on a moving average.
mod: Allows the user to select a specific moving average type (EMA, SMA, RMA, HMA, or WMA) for use in "Auto" mode.
Label and Color Options: Customize the display of Fibonacci labels, colors, and whether to show the highest and lowest levels on the chart.
Fibonacci Levels:
Sixteen Fibonacci levels are configurable in the input options, allowing users to choose traditional retracement levels (e.g., 0.236, 0.5, 1.618) as well as custom levels.
These levels are calculated dynamically and adjusted based on the highest and lowest price range within the lookback period.
Calculation of Direction and Fibonacci Levels:
Moving Average Direction: Using the specified moving average, the code evaluates the price direction to determine the trend (upward or downward). This direction can be reversed if the user selects the reverse option.
Fibonacci Level Calculation: Each level is computed based on the highest and lowest prices over the lookback range and adjusted according to the selected trend direction and moving average type.
Plotting Fibonacci Levels:
The script generates lines on the chart to represent each Fibonacci level, with customizable gradient colors.
Labels displaying level values and prices can be enabled, providing easy identification of each level on the chart.
Additional Lines:
Lines representing the highest and lowest prices within the lookback range can also be displayed, highlighting recent support and resistance levels for added context.
Usage:
The Auto Fibonacci Mode indicator is designed for traders interested in Fibonacci retracement and extension levels, particularly those seeking automatic trend detection based on moving averages.
This indicator enables:
Automatic adjustment of Fibonacci levels based on selected moving average type.
Quick visualization of support and resistance areas without manual adjustments.
Analysis flexibility with customizable levels and color gradients for easier trend and reversal identification.
This tool is valuable for traders who rely on Fibonacci analysis and moving averages as part of their technical analysis strategy.
Important Note:
This script is provided for educational purposes and does not constitute financial advice. Traders and investors should conduct their research and analysis before making any trading decisions.

ToolsLibrary "Tools"
Common tools
movingAverage(maType, maSource, maLength)
dynamically returns MA
Parameters:
maType (string) : ma type
maSource (float) : ma source
maLength (simple int) : ma length
Returns: ta.{sma,rma,ema,wma,vwma,hma}
