Multi TF - RSIRSI with 5 timeframes, you can change the TF it in the configs.
This one has 1h, 2h, 4h, Daily and Weekly.
Search in scripts for "rsi"

RSI + StochasticsSuper basic concept.
Take profit when both rsi and stochastic are overbought and vice versa.
Overbought and oversold are not necessarily indications that a market will reverse contrary to what some people teach. Markets can stay overbought much longer than oversold and therefore I find more value from the oversold signals(red signals).
Occasionally these signals will catch the exact top/ bottom but it would be risky to take a trade based on these signals alone. You can see these signals as take profit signals or even signs of a possible reversal.
Given the nature of these two indicators it will not perform well in a strong trend, so always use with confluence. Personally I would only use the oversold signals but I left it in case anybody finds it useful.

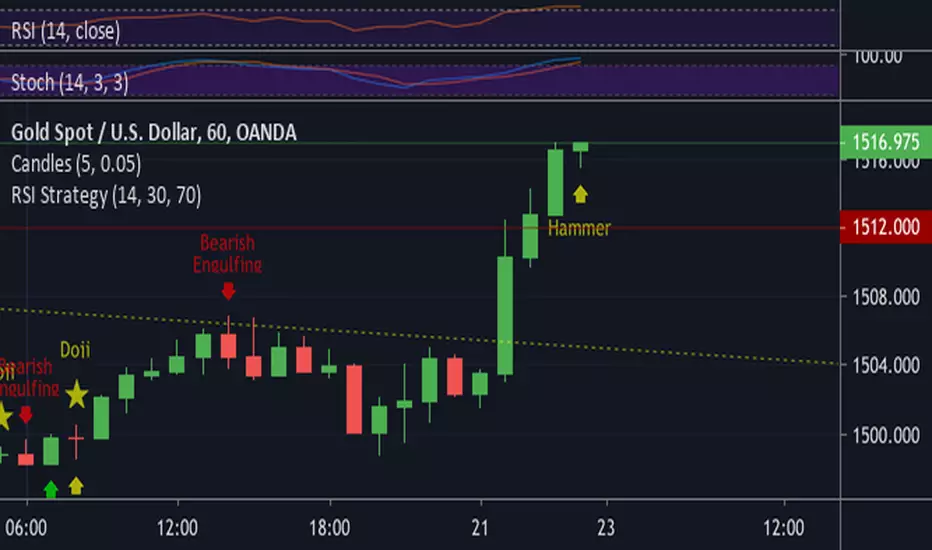
RSI StrategyNothing special in this strategy its just purely and application of RSI in 1hour chart of XAUUSD.
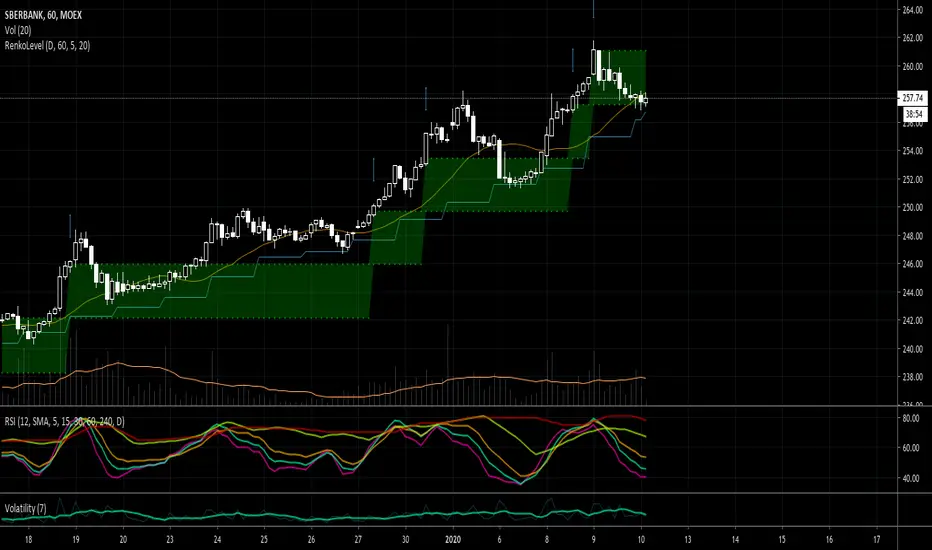
RSI STEP TRENDthis is script based on lazy bear special rsi and alex trend step
so it look like a nice hybrid together:)
signal and alerts inside

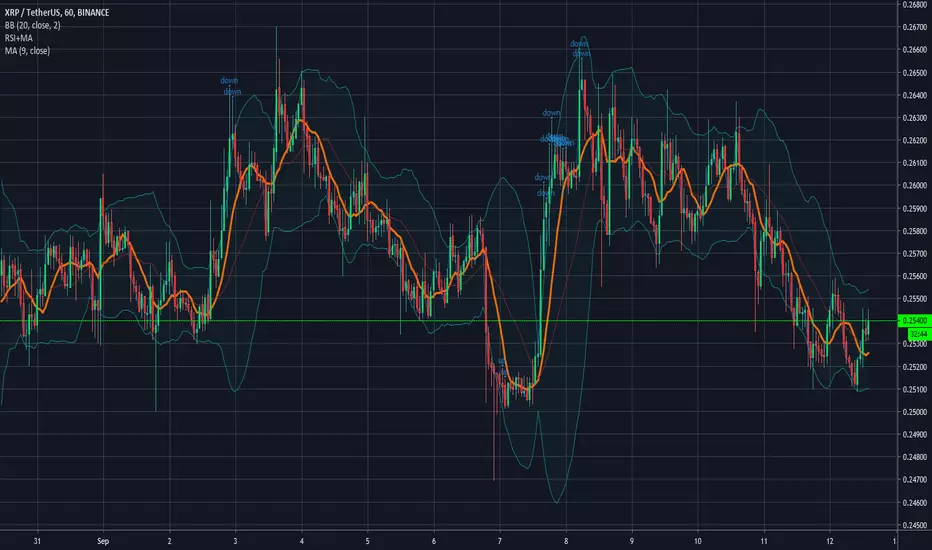

RSI ICHIMOKU CLOUDmain script written by ROBINHOODLAB
so the signal are done by cross up or down of the rsi and the CHIMOKU CLOUD
red circles are down
blue cross are up
alerts inside


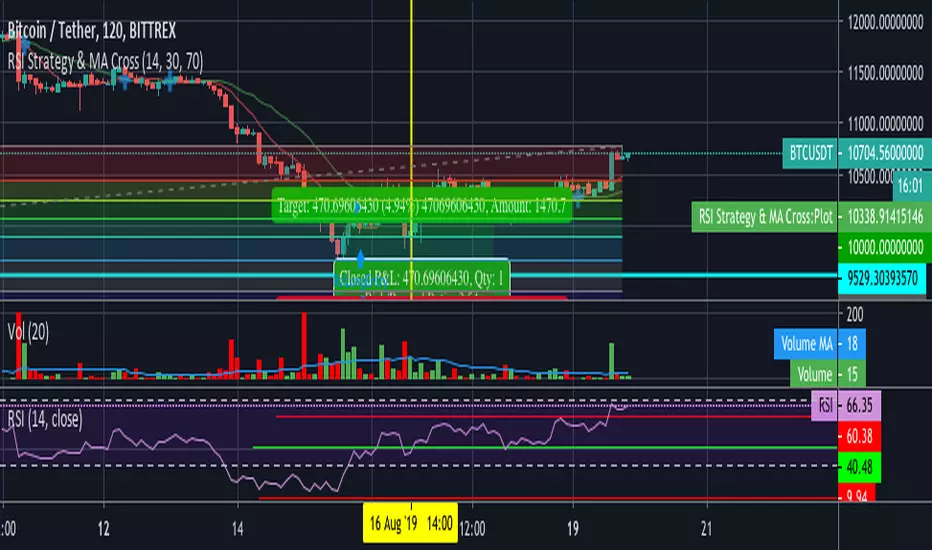
RSI Strategy & MA CrossCombination of two strategy.
MA Cross strategy is using 2 sma at 9 & 21. It can be configured through the source code.
RSI strategy to decide whether the stock/crypto is currently overbought/oversold.
Useful for quick entry and exit trade.
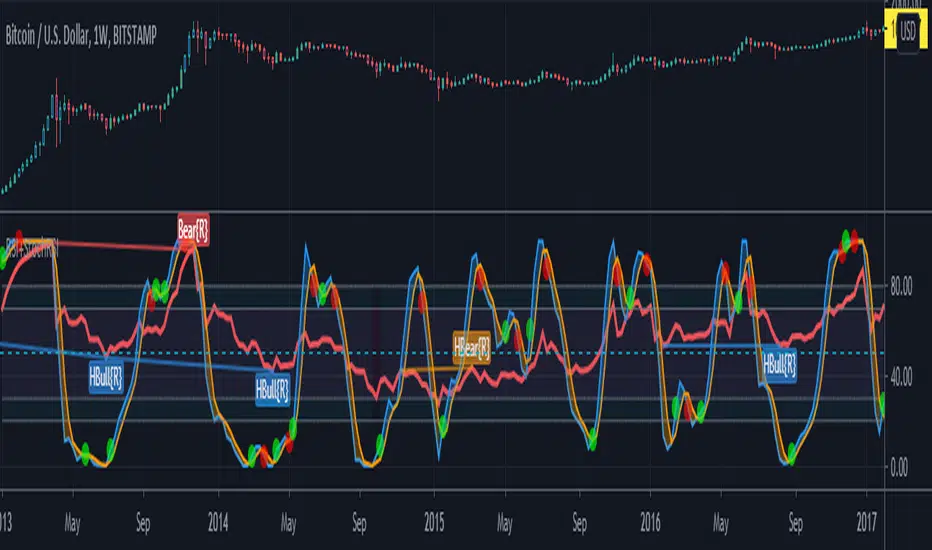
RSI Bottom [aamonkey]This is a modified RSI that prints a bottom signal directly on your price chart.
It pulls the data (in the default settings) from the weekly chart no matter on what timeframe you are on.
You can adjust the timeframe and threshold.
Default settings work best for big BTC cycles.

RSI on the chart [Experimental]This is an experimental work to show RSI on the chart. Feel free to use the code and indicator.
If you find my works useful, please consider a donation
BTC: 19qDW9AShZhBZsGuXcgRzam5Fbpc3EU8EV
ETH: 0x39c8552371b9b7f4e324197af460ba8bc8e18ef9


RSI with Overpriced and Underpriced highlightRelative Strength Index (RSI) with Overpriced and Underpriced highlights, respectively set at 70% and 30%
