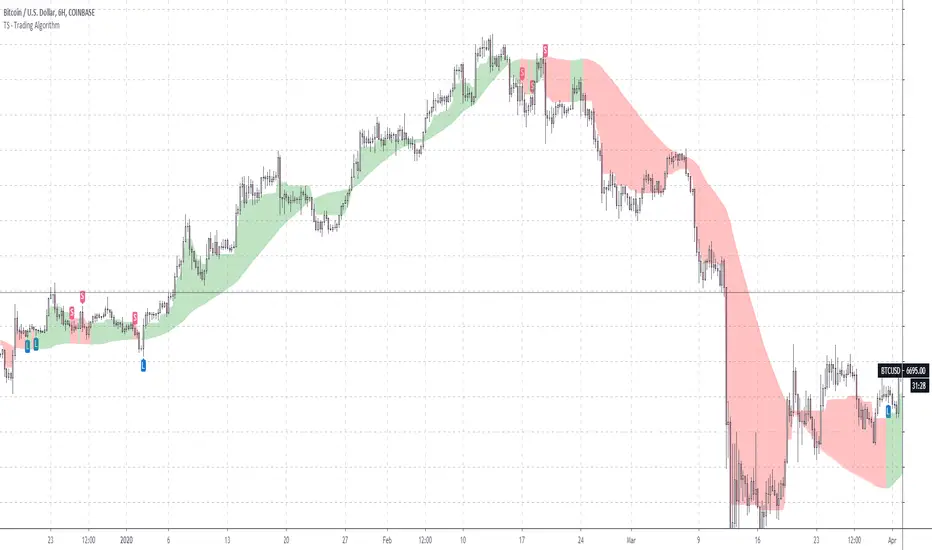
TS - Trading AlgorithmWhat is it?
The Tradespot MA Algo is an all in one, profitable moving average based trading strategy that presents long and short opportunities.
This indicator does not repaint. Once a bar has closed, the signal will remain permanently printed onto the chart.
What can I do with it?
Use on the following markets:
COINBASE:BTCUSD
COINBASE:ETHUSD
COINBASE:ETHBTC
Timeframe: 1D
What does each signal mean?
Long label is a strong buy signal
Short label is a strong sell signal
X's indicate a warning telling you that you should possibly exit your position. You should review these signals alongside other indicators such as volatility.
Review X signals?
Yes, there are concrete buys and sells but the X's indicate possible exits that might also be fakeouts, we can created the perfect indicator set up to review these with our TS - Trend Confirmation indicator and our TS - Volatility Screener indicator
How do I get access?
Please contact me on TradingView for details.
Search in scripts for "screener"
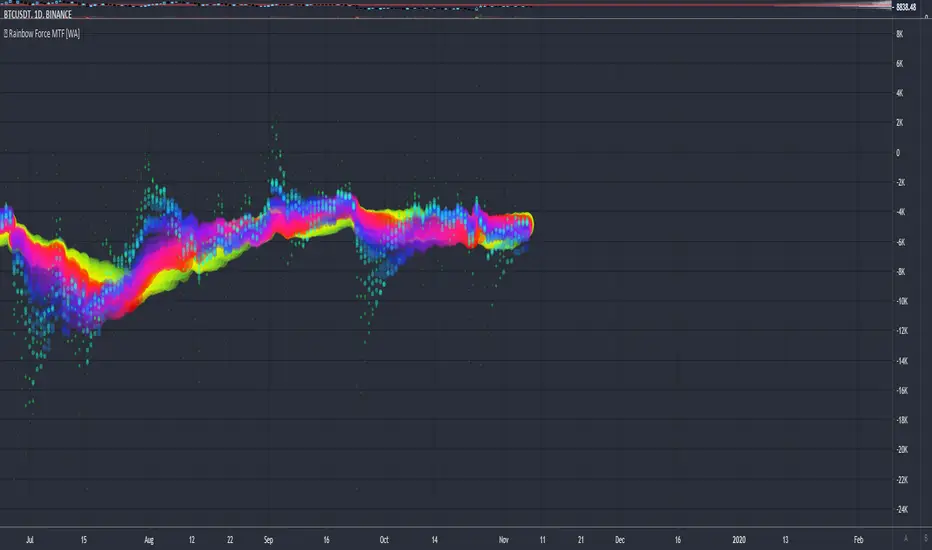
Rainbow Force - Multi Timeframe [WYCKOFF ARSENAL]🌈 Rainbow Force - Multi Timeframe WYCKOFF ARSENAL
The purpose of the Force is to provide an indication of the pressure being applied to push the market lower or the pull being applied to the market to pull it higher.
The Rainbow Force can be used on any available timeframes and assets with volume data .
It is a combination of Force instances of different lengths that are plotted on the same chart.
The confluence zones can hint at a price reversal and help estimate the trend strength.
The Rainbow Force can be combined with other technical analysis tools as a trend-following indicator.
When the trend is strong and the other indicators used to determine entry points send a bullish or a bearish signal, a position can be opened.
When the trend is weak, opening new positions should not be to consider.
The Rainbow Force can also be used on its own. The angles of the Rainbow will hint at the trend strength.
The steeper the curve, the stronger the trend. The flatter the curve, the weaker the trend.
A Buy position can be opened in the beginning of a strong positive trend .
A Sell position can be opened in the beginning of a strong negative trend .
During a strong trend, short-lived retracements can be found, and it is possible to enter a position in the direction of the general trend against the retracement.
The Rainbow mode can be experienced with the Multi RSI indicator as well.
Related tools :
▪ Optimism Pessimism
▪ Force
- 🌈 Rainbow Force ◄
▪ Technometer
- 🌈 Rainbow Technometer
▪ Momentum
- 🌈 Rainbow Momentum
▪ Market Screener
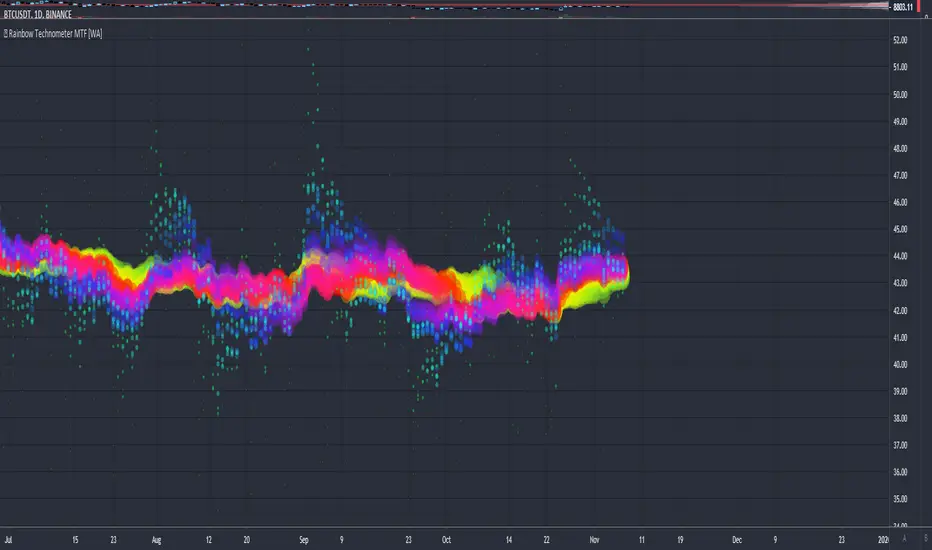
Rainbow Technometer - Multi Timeframe [WYCKOFF ARSENAL]🌈 Rainbow Technometer - Multi Timeframe WYCKOFF ARSENAL
The purpose of the Technometer is to provide a mathematical indication of the degree to which the market is overbought or oversold .
The value of the Technometer could be as high as 100 or as low as 0. The other possible values would represent degrees of overbought or oversold.
In Rainbow form, the Technometer could also be used as a trend-following indicator.
The Rainbow Technometer can be used on any available timeframes and assets with volume data .
It is a combination of Technometer instances of different lengths that are plotted on the same chart.
The confluence zones can hint at a price reversal and help estimate the trend strength.
The Rainbow Technometer can be combined with other technical analysis tools as a trend-following indicator.
When the trend is strong and the other indicators used to determine entry points send a bullish or a bearish signal, a position can be opened.
When the trend is weak, opening new positions should not be to consider.
The Rainbow Technometer can also be used on its own. The angles of the Rainbow will hint at the trend strength.
The steeper the curve, the stronger the trend. The flatter the curve, the weaker the trend.
A Buy position can be opened in the beginning of a strong positive trend .
A Sell position can be opened in the beginning of a strong negative trend .
During a strong trend, short-lived retracements can be found, and it is possible to enter a position in the direction of the general trend against the retracement.
The Rainbow mode can be experienced with the Multi RSI indicator as well.
Related tools :
▪ Optimism Pessimism
▪ Force
- 🌈 Rainbow Force
▪ Technometer
- 🌈 Rainbow Technometer ◄
▪ Momentum
- 🌈 Rainbow Momentum
▪ Market Screener
Rainbow Momentum - Multi Timeframe [WYCKOFF ARSENAL]🌈 Rainbow Momentum - Multi Timeframe WYCKOFF ARSENAL
The purpose of the Momentum is to provide a measure of the speculative interest in the market.
In Rainbow form, the Momentum could also be used as a trend-following indicator.
The Rainbow Momentum can be used on any available timeframes and assets with volume data .
It is a combination of Momentum instances of different lengths that are plotted on the same chart.
The confluence zones can hint at a price reversal and help estimate the trend strength.
The Rainbow Momentum can be combined with other technical analysis tools as a trend-following indicator.
When the trend is strong and the other indicators used to determine entry points send a bullish or a bearish signal, a position can be opened.
When the trend is weak, opening new positions should not be to consider.
The Rainbow Momentum can also be used on its own. The angles of the Rainbow will hint at the trend strength.
The steeper the curve, the stronger the trend. The flatter the curve, the weaker the trend.
A Buy position can be opened in the beginning of a strong positive trend .
A Sell position can be opened in the beginning of a strong negative trend .
During a strong trend, short-lived retracements can be found, and it is possible to enter a position in the direction of the general trend against the retracement.
The Rainbow mode can be experienced with the Multi RSI indicator as well.
Related tools :
▪ Optimism Pessimism
▪ Force
- 🌈 Rainbow Force
▪ Technometer
- 🌈 Rainbow Technometer
▪ Momentum
- 🌈 Rainbow Momentum ◄
▪ Market Screener

Top 20 Adaptive Momentum [Trend Aligned]his script is an automated End-of-Day Momentum Dashboard designed to predict the next trading day's directional bias for the top 20 most volatile stocks. It analyzes institutional price action during the final 10 minutes of the trading session and filters signals based on the long-term trend.
How It Works
Trend Identification: The script calculates a 50-Day Moving Average proxy (using 5-minute data) to determine if a stock is in a Long-Term Uptrend or Downtrend.
Adaptive Signal Logic: Instead of a simple reversal strategy, the script adapts its prediction based on the trend context:
Trend Following: If a stock closes strong (Green) in an Uptrend, it signals Bullish Momentum (continuation).
Mean Reversion: If a stock closes strong (Green) in a Downtrend, it signals Bearish Reversion (fade the bounce).
Dip Buying: If a stock closes weak (Red) in an Uptrend, it signals Bullish Reversion (buy the dip).
Live Backtesting: The dashboard features a "Win Rate (3M)" column. This metric backtests the strategy over the past 3 months for each specific ticker, calculating the percentage of time the predicted bias resulted in a winning trade the following day.
Dashboard Columns
Ticker: The stock symbol.
Prev Day: The overall close vs. open of the previous session.
Trend (50d): The long-term trend direction (UP or DOWN).
BIAS TODAY: The actionable signal for the current session (📈 BULLISH or 📉 BEARISH).
Win Rate: The historical probability of success for this strategy on this specific stock.
Usage: Use this tool pre-market to identify high-probability setups where the previous day's closing momentum aligns with the long-term trend.
To effectively use the Top 20 Adaptive Momentum script, you need to treat it as a Pre-Market Screener. It performs the heavy lifting of analyzing trend, momentum, and historical probability instantly, giving you a "Cheat Sheet" for the trading day.
Here is a step-by-step guide on how to integrate it into your routine:
1. The Setup
Timeframe: Set your chart to 5 Minutes. The logic specifically hunts for the 15:50 (3:50 PM) and 15:55 (3:55 PM) candles, so the calculation works best on this timeframe.
Timing: Check this dashboard before the market opens (e.g., 9:00 AM EST) or shortly after the close (4:05 PM EST) to plan for the next session.
2. Reading the Dashboard Columns
Column What to Look For Actionable Insight
Trend (50d) UP (Green) or DOWN (Red) This tells you the "Big Picture." Only trade in this direction. If Trend is UP, you only want to see Bullish signals. If Trend is DOWN, you only want Bearish signals.
BIAS TODAY 📈 BULLISH Plan: Look for Long/Buy setups at the open. The algorithm predicts price will close higher today.
📉 BEARISH Plan: Look for Short/Sell setups at the open. The algorithm predicts price will close lower.
Win Rate (3M) Percentage (e.g., 65%) Confidence Filter. Only take trades on stocks with a Win Rate above 55-60%. This proves the stock historically respects this specific strategy.
3. The Strategy Scenarios (How to Trade)
Scenario A: The "Trend Continuation" (High Probability)
Dashboard: Trend is UP + Bias is BULLISH.
Context: The stock is strong long-term, and it closed strong yesterday (Momentum).
Execution: Watch for an opening gap up or an early breakout above the pre-market high. Go Long.
Scenario B: The "Dip Buy" (High Probability)
Dashboard: Trend is UP + Bias is BULLISH.
Context: The stock is strong long-term, but it pulled back yesterday (Weak Close). The script identifies this as a discount, not a reversal.
Execution: Watch for the stock to find support early. Use the "Master Sniper" (from your other script) to find a Discount Entry FVG.
Scenario C: The "Trap" (Avoid)
Dashboard: Win Rate is < 50%.
Context: The stock is choppy or news-driven. It does not follow technical momentum rules reliably.
Execution: Skip this stock. Move to the next one on the list.
4. Execution Workflow
Scan: Glance at the dashboard. Identify the 2-3 stocks with Green Bias + Green Trend (for Buys) or Red Bias + Red Trend (for Shorts).
Filter: Ensure their "Win Rate" is decent (over 55%).
Trade: Open the charts for those specific stocks. Use your execution indicators (like the Master Sniper) to time the entry on the 1-minute or 5-minute chart.
By using this dashboard, you stop guessing which stock to trade and focus entirely on executing the best setups.

Top-line % MovesOverview
A clean, text-only overlay that shows price momentum at a glance. It prints one line at the top-center of your chart:
Movement | Day % | 3-Day % | Wk %
What it shows
Day - Percent change from today’s regular-session open to the latest price
3-Day - Percent change from the daily open 3 trading days ago
Wk - Percent change from the daily open 5 trading days ago
How it works
Pulls daily opens via request.security so it stays consistent across intraday and daily timeframes
Calculates percent moves versus those opens and renders a single centered text line
Transparent background, bright white text, no bars or lines, minimal chart footprint
Notes
“Wk” uses 5 trading days. If you prefer 7 calendar days, change the lookback to your preference
Daily opens follow the symbol’s TradingView session settings. Extended or 24h markets may differ from your broker’s definition of “open”
Best for
Quick momentum read without clutter
Screeners, streaming layouts, and compact dashboards
Inputs
None
Tags
percent change, overlay, momentum, daily open, intraday, text display, minimal, Pine v6

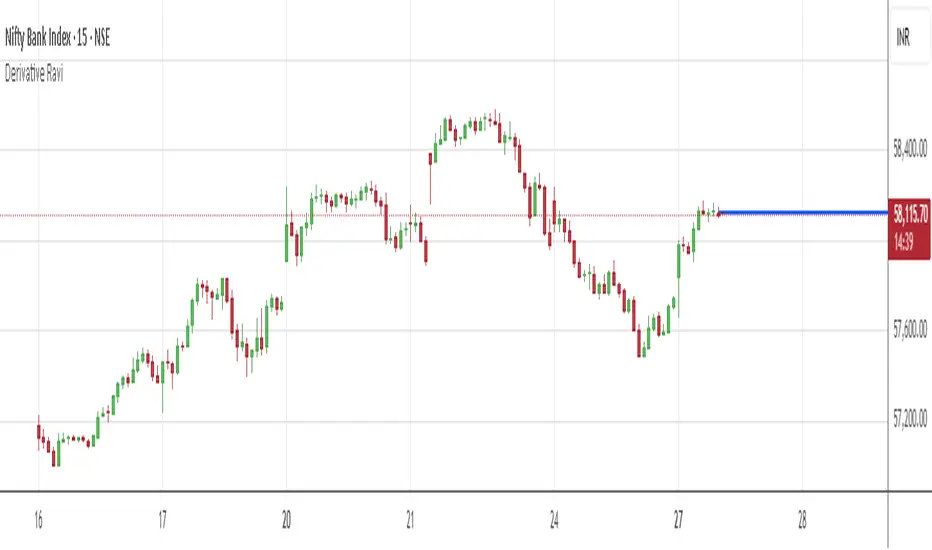
Derivative RaviJust and candle stick data screener. it is the candle data analyser for judging trend
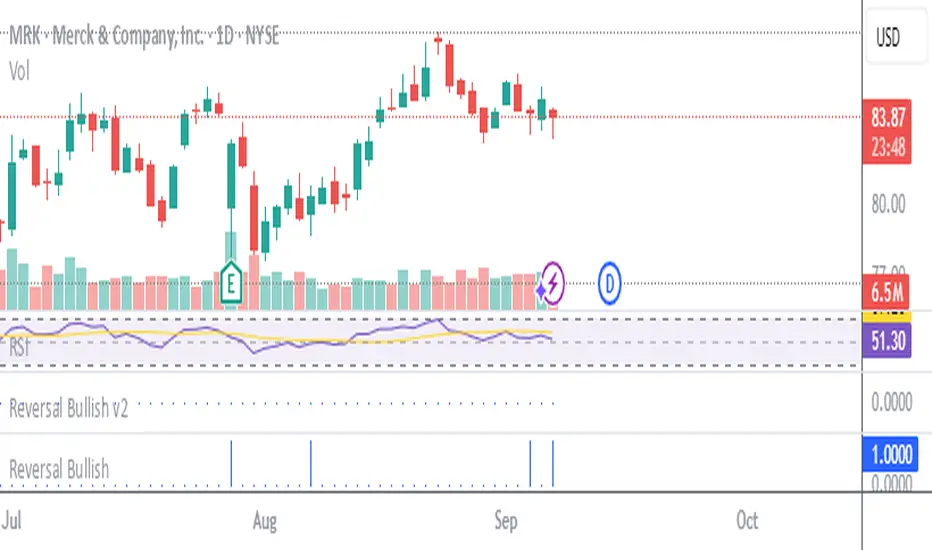
Stockbee Reversal Bullish v2Custom indicator for identifying stocks that meet the Stockbee's Reversal Bullish New criteria. This can be used as a standalone indicator or use it to screen for stocks in Pine Screener.

Stockbee Reversal BullishCustom indicator for identifying stocks that meet the Stockbee's Reversal Bullish criteria. This can be used as a standalone indicator or use it to screen for stocks in Pine Screener.
Stockbee ComboBearCustom indicator for identifying stocks that meet the Stockbee's ComboBear criteria. This can be used as a standalone indicator or use it to screen for stocks in Pine Screener.

ComboBearCustom indicator for identifying stocks that meet the Stockbee's ComboBear criteria. This can be used as a standalone indicator or use it to screen for stocks in Pine Screener.
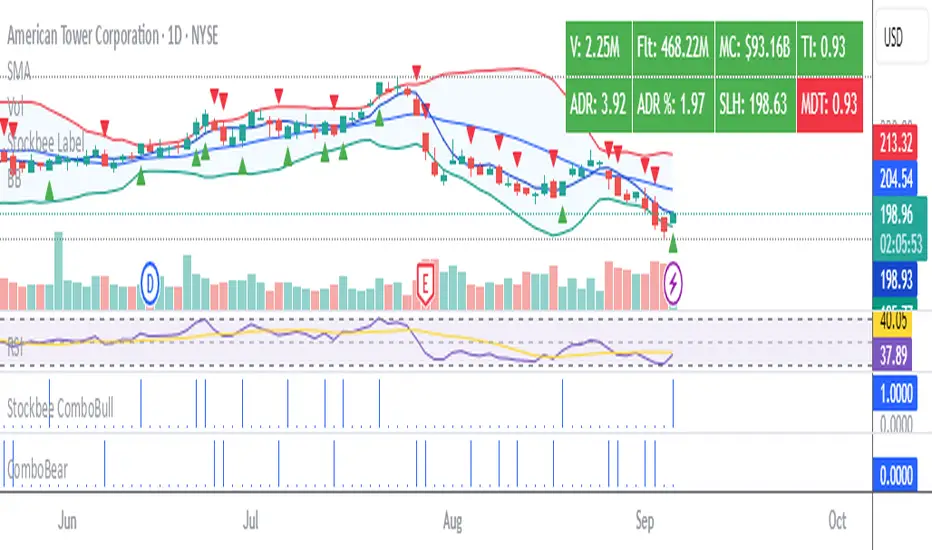
Stockbee ComboBullCustom indicator for identifying stocks that meet the ComboBull criteria. This can be used as a standalone indicator or use it to screen for stocks in Pine Screener.

All Time High & All Time Low + 52-Week (ATH & ATL) | by Octopu$🚀 All Time High & All Time Low (ATH & ATL) + 52-Week with % and $ Info| by Octopu$
What is a 52-week, ATH or ATL?
52-Week High
The highest price a stock has traded at in the past 52 weeks (Approx. 1 year).
Acts like a “short-term ATH.” Many traders and investors use it as a momentum signal — breaking above it shows strength. Often used by screeners (“Stocks near 52-week high”).
IF a Ticker highest price in the last year is $500, and it’s currently trading at $555, it just made a new 52-week high (but not necessarily an all-time high).
52-Week Low
The lowest price a stock has traded at in the past 52 weeks (Approx. 1 year).
Acts like a “short-term ATL.” Traders watch it for breakdowns, and long-term investors watch it for potential bargains/buy the dip. Also important for risk management and Stop Losses.
IF a Ticker lowest price in the last year was $100, and it falls to $88, it just made a new 52-week low (but not necessarily an all-time low).
ATH (All-Time High)
The highest price a stock (or index, crypto, etc...) has EVER reached in its entire trading history.
Shows maximum bullish strength. When price breaks to a new ATH, there is no overhead resistance → often leads to strong momentum rallies. Also used as a psychological level in case of resistance/breakout.
ATL (All-Time Low)
The lowest price a stock (or asset) has EVER traded at since it began trading.
Reflects maximum bearish weakness. Breaking below the ATL is dangerous (no historical support below). Often associated with companies in crisis or risk of delisting. Or simply crashers or faders, whatever slang you may call it. Generally heavily shorted.
EXAMPLE:
AMEX:SPY
www.tradingview.com
This indicator however should not be used as a standalone tool.
(The combination of factors relies on your own knowledge about Confluence Factors along with your Due Diligence)
This indicator is not an advice to buy or sell securities in any form.
ANY Ticker. ANY Timeframe.
Features:
• 52-Week High
• 52-Week Low
• ALL Time High
• ALL Time Low
• $ Value Difference (of Current Price)
• % Percentage Difference (of Current Price)
Options:
• Customization
• Toggles
Notes:
v1.0
Indicator release.
Changes and updates can come in the future for additional functionalities or per requests. Follow and Stay Tuned!
Did you like it? Please Support and Shoot me a message! I'd appreciate if you dropped by to say thanks! Thank you.
- Octopu$
🐙

Early Bullish Trend Breakout: Over $100This indicator is meant for use in trend trades. It follows the crossing of the 50 EMA, the crossing of the DMI+/- and the crossing of the MACD. Meant for use in pine screener.

Early Bullish Trend Breakout: Under $100This indicator is meant for use in trend trades. It follows the crossing of the 50 EMA, the crossing of the DMI+/- and the crossing of the MACD. Meant for use in pine screener.

Institutional Analyst LLM📊 Institutional Analyst Board LLM – Smart Money Confluence Scanner for XAUUSD, Forex, Crypto 🔍 Overview The Institutional Analyst Board is a complete multi-timeframe smart money toolkit designed for traders who demand clarity, confluence, and precision. It brings together institutional-grade metrics—Order Blocks (OB), Fair Value Gaps (FVG), Liquidity Sweeps, MACD/RSI...
PTS Ultimate Analysis Board (Flexible Position + Ticker)
GoldenTradeClub
GoldenTradeClub
Updated
Jul 15
PTS Ultimate Analysis Board (Flexible Position + Ticker) Version: Pine v5 Description: This indicator builds a fully customizable, multi-timeframe dashboard table that surfaces 19 key metrics for any ticker (current chart TF, 1 h, 4 h). You can position the table at the top-right or bottom-right of your chart and toggle each metric on or off. Key...
Trading Engine AI Light
GoldenTradeClub
GoldenTradeClub
Jul 14
The Trading Engine includes the best and most effective technical analysis tools. It has 27 different Buy Signal parameters and 26 different Sell Signal parameters. Furthermore, it also has 9 Stop Loss triggers for Long Positions and 8 Stop Loss triggers for Short Positions. Many of the Buy or Sell Signal parameters function as Take Profit and Stop Loss signals...
Elliott Wave Complete
GoldenTradeClub
GoldenTradeClub
Jul 4
1. Indicator Presentation Name: Elliott Wave Complete Type: Pine Script v5 overlay dashboard for TradingView Purpose: Automates Elliott Wave motive (1-5) and corrective (A-B-C) pattern detection on any timeframe, enriches it with classic ZigZag pivots, dynamic Fibonacci projection levels, optional wave-count info box, and real-time alerts—all in one...
💀⚡ PTS WIZARD 666™ ULTIMATE SUPREME V5.0 - COMPLETE FIXED ⚡💀
GoldenTradeClub
GoldenTradeClub
Jul 4
1. Indicator Presentation Name: 💀⚡ PTS WIZARD 666™ ULTIMATE SUPREME V5.0 – COMPLETE FIXED Short ID: PTS-666-SUPREME Type: Pine Script v5 overlay dashboard for TradingView Purpose: An all-in-one trading overlay that integrates advanced WaveTrend momentum, RSI/MFI analysis, POC volume profiling, multiple Fibonacci golden/ultimate zones, volume footprint & imbalance...
🔥 PTS TRADE 666™ ULTIMATE BOOKMAP + QUANTUM ENGINE
GoldenTradeClub
GoldenTradeClub
Jul 4
1. Indicator Presentation Name: 🔥 PTS TRADE 666™ ULTIMATE BOOKMAP + QUANTUM ENGINE Short ID: PTS666_QUANTUM_FINAL Type: Pine Script v5 overlay dashboard for TradingView Purpose: A cutting-edge, institutional-grade suite that unifies bookmap-style footprint volume profiling, dynamic heatmap liquidity analysis, AI-driven pattern recognition, smart-money protocols,...
🔥 PTS TRADE 666™ - ULTIMATE INSTITUTIONAL TOOL 🔥
GoldenTradeClub
GoldenTradeClub
Jul 4
1. Indicator Presentation Name: 🔥 PTS TRADE 666™ – ULTIMATE INSTITUTIONAL TOOL V2.0 Short ID: PTS666_UIT_V2 Type: Pine Script v5 overlay dashboard for TradingView Purpose: Combines institutional-grade footprint volume analysis, smart-money structure detection, statistical anomaly checks, multi-timeframe divergence, Ichimoku insights, pattern recognition, and an...
PTS Wizard
GoldenTradeClub
GoldenTradeClub
Jul 4
1. Indicator Presentation Name: PTS Wizard Short Title: PTS Wizard Type: Pine Script v5 overlay dashboard for TradingView Purpose: A unified multi-strategy toolkit that overlays key market insights—liquidity zones, smart-money structure, footprint-style volume profile, consolidation ranges, statistical deviation bands, price forecasts, and session analysis—into a...
🔥 PTS.TRADE 666™ ULTIMATE HYBRID + MTF V3
GoldenTradeClub
GoldenTradeClub
Jul 4
1. Indicator Presentation Name: 🔥 PTS.TRADE 666™ ULTIMATE HYBRID + MTF V3 Short ID: PTS666_ULTIMATE_MTF_V3 Type: Overlay dashboard for TradingView Purpose: A next-level hybrid trading suite that merges institutional-grade order-flow analysis, smart-money concepts, AI-driven insights, classic momentum oscillators (WaveTrend, divergence, “Gold” signals),...
🧙♂ PTS WIZARD V3.0 - FINAL EDITION
GoldenTradeClub
GoldenTradeClub
Jul 4
1. Indicator Presentation Name: 🧙♂ PTS WIZARD V3.0 – FINAL EDITION Short Title: PTS-WIZARD-V3-FINAL Type: Overlay trading dashboard for TradingView Purpose: A comprehensive multi-module indicator that blends classic cipher momentum signals, Elliott Wave pattern detection, advanced statistical analyses (Z-Score, Benford’s Law, Ehlers SNR), footprint-style volume...
🧙♂ PTS WIZARD V3.0 + FOOTPRINT ULTIMATE
GoldenTradeClub
GoldenTradeClub
Jul 4
Name: PTS WIZARD V3.0 + FOOTPRINT ULTIMATE Type: Overlay trading dashboard for TradingView Purpose: Combines classic cipher-style momentum signals with an advanced footprint volume profile, multi-timeframe bias, statistical filters, and a fusion-score system—displayed in a customizable on-chart dashboard. Core Modules Cipher Momentum Signals WaveTrend...
🧙♂ PTS WIZARD V3.0 - BASIC
GoldenTradeClub
GoldenTradeClub
Jul 1
PTS WIZARD V3.0 Basic – Ultimate Multi-Tool Trading Dashboard An all-in-one overlay combining classic cipher signals, Elliott Wave pattern detection, volume analytics, divergence spotting, and smart-entry timing—backed by advanced statistical filters and a live dashboard. Key Features Cipher Signals WaveTrend with overbought/oversold zones & cross signals RSI...
Trading Engine vCD AI
GoldenTradeClub
GoldenTradeClub
Jun 15
The Trading Engine includes the best and most effective technical analysis tools. It has 27 different Buy Signal parameters and 26 different Sell Signal parameters. Furthermore, it also has 9 Stop Loss triggers for Long Positions and 8 Stop Loss triggers for Short Positions. Many of the Buy or Sell Signal parameters function as Take Profit and Stop Loss signals...
Trading Engine vCD
GoldenTradeClub
GoldenTradeClub
Updated
Mar 21
The Trading Engine includes the best and most effective technical analysis tools. It has 27 different Buy Signal parameters and 26 different Sell Signal parameters. Furthermore, it also has 9 Stop Loss triggers for Long Positions and 8 Stop Loss triggers for Short Positions. Many of the Buy or Sell Signal parameters function as Take Profit and Stop Loss signals...
TE CLIENT v13
GoldenTradeClub
GoldenTradeClub
Updated
Mar 15
The Trading Engine includes the best and most effective technical analysis tools. It has 27 different Buy Signal parameters and 26 different Sell Signal parameters. Furthermore, it also has 9 Stop Loss triggers for Long Positions and 8 Stop Loss triggers for Short Positions. Many of the Buy or Sell Signal parameters function as Take Profit and Stop Loss signals...
Trading Engine v13
GoldenTradeClub
GoldenTradeClub
Updated
Mar 15
The Trading Engine includes the best and most effective technical analysis tools. It has 27 different Buy Signal parameters and 26 different Sell Signal parameters. Furthermore, it also has 9 Stop Loss triggers for Long Positions and 8 Stop Loss triggers for Short Positions. Many of the Buy or Sell Signal parameters function as Take Profit and Stop Loss signals...
Trading Engine B2B
GoldenTradeClub
GoldenTradeClub
Updated
Jan 14
The Trading Engine includes the best and most effective technical analysis tools. It has 25 different Buy Signal parameters and 24 different Sell Signal parameters. Furthermore, it also has 9 Stop Loss triggers for Long Positions and 8 Stop Loss triggers for Short Positions. Many of the Buy or Sell Signal parameters function as Take Profit and Stop Loss signals...
Trading Engine B2B FX V9
GoldenTradeClub
GoldenTradeClub
Updated
Jan 14
The VFLOW Trading Engine includes the best and most effective technical analysis tools. It has 20 different Buy Signal parameters and 18 different Sell Signal parameters. Furthermore, it also has 7 Stop Loss triggers for Long Positions and 5 Stop Loss triggers for Short Positions. Many of the Buy or Sell Signal parameters function as Take Profit and Stop Loss...
English
Select market data provided by ICE Data services.
Select reference data provided by FactSet. Copyright © 2025 FactSet Research Systems Inc.
© 2025 TradingView, Inc.
More than a product
Supercharts
Screeners
Stocks
ETFs
Bonds
Crypto coins
CEX pairs
DEX pairs
Pine
Heatmaps
Stocks
ETFs
Crypto
Calendars
Economic
Earnings
Dividends
More products
Yield Curves
Options
News Flow
Pine Script®
Apps
Mobile
Desktop
Tools & subscriptions
Features
Pricing
Market data
Trading
Overview
Brokers
Special offers
CME Group futures
Eurex futures
US stocks bundle
About company
Who we are
Athletes
Blog
Careers
Media kit
Merch
TradingView store
Tarot cards for traders
The C63 TradeTime
Policies & security
Terms of Use
Disclaimer
Privacy Policy
Cookies Policy
Accessibility Statement
Security tips
Bug Bounty program
Status page
Community
Social network
Wall of Love
Refer a friend
House Rules
Moderators
Ideas
Trading
Education
Editors' picks
Pine Script
Indicators & strategies
Wizards
Freelancers
Business solutions
Widgets
Charting libraries
Lightweight Charts™
Advanced Charts
Trading Platform
Growth opportunities
Advertising
Brokerage integration
Partner program
Education program
Look First
Close
Updated 3 hours ago
Institutional Analyst Board
Manage access
Remove from favorites
Use on chart
0
11
Jul 19
📊 Institutional Analyst Board – Smart Money Confluence Scanner for XAUUSD, Forex, Crypto
🔍 Overview
The Institutional Analyst Board is a complete multi-timeframe smart money toolkit designed for traders who demand clarity, confluence, and precision. It brings together institutional-grade metrics—Order Blocks (OB), Fair Value Gaps (FVG), Liquidity Sweeps, MACD/RSI bias, VWAP positioning, and Break of Structure (BoS)—into a single powerful visual dashboard.
This indicator is especially optimized for Gold (XAUUSD) but is also compatible with Crypto and Forex assets.
🧠 Key Features
✅ Multi-Timeframe Dashboard (5M / 15M / 1H)
✅ Order Block Detection with dynamic zones that extend until broken
✅ Fair Value Gap Detection with clear zone shading and border distinction
✅ MACD + RSI Confluence for momentum and bias alignment
✅ VWAP Positioning to identify premium/discount zones
✅ Liquidity Sweeps (internal/external range breaks)
✅ Killzone Highlighting (Asia / London / New York)
✅ Break of Structure (BoS) with advanced confluence filters
✅ Gold Bias Flags across timeframes (BUY / SELL / NEUTRAL)
✅ Dynamic Price Watermark with real-time data
✅ Fully customizable colors, transparencies, and text labels
🧠 How It Works
The Board uses institutional logic to analyze the chart in real time:
Metric Purpose
OB Zones Highlight potential smart money footprints where price is likely to react.
FVG Zones Identify imbalance areas between buyers and sellers—ideal for mean reversion entries.
MACD/RSI Confirm momentum direction and relative strength confluence.
VWAP Determine whether price is trading at a premium or discount.
Liquidity Sweeps Detect manipulative moves before major reversals.
BoS Mark potential trend reversals, filtered by institutional confluence.
Each signal is computed across 3 timeframes and visualized in a clean board that updates live. You’ll also see labels, alerts, and session overlays for maximum clarity.
📌 Ideal Use Case
This tool is perfect for:
Funded Challenge Traders (FTMO, MyForexFunds, etc.)
Gold scalpers and intraday traders
Crypto price action traders using BTC, ETH, SOL, etc.
Smart Money Concept (SMC) and ICT followers
⚙️ Customization Options
Toggle each module (OB, FVG, VWAP, MACD/RSI, etc.)
Set transparency and color for each zone type
Adjust Killzone timing (Asia, London, NY)
Control board position (Top/Bottom) and metric visibility
📈 Compatible Assets
✅ XAUUSD (optimized)
✅ Forex majors/minors
✅ Crypto pairs (BTC, ETH, SOL, etc.)
✅ Indices (GER40, NASDAQ, SPX with minor adaptation)
🛠️ Requirements
Use on TradingView v5
Set chart time to UTC+0 or UTC+3 for optimal Killzone accuracy
For crypto, redefine Killzone hours if needed (24/7 market)
🧠 Pro Tip
Pair this indicator with volume profile tools, CVD/Delta Flow, or Footprint overlays to build high-confidence trade setups with clear institutional confluence.

Greer Free Cash Flow Yield✅ Title
Greer Free Cash Flow Yield (FCF%) — Long-Term Value Signal
📝 Description
The Greer Free Cash Flow Yield indicator is part of the Greer Financial Toolkit, designed to help long-term investors identify fundamentally strong and potentially undervalued companies.
📊 What It Does
Calculates Free Cash Flow Per Share (FY) from official financial reports
Divides by the current stock price to produce Free Cash Flow Yield %
Tracks a static average across all available financial years
Color-codes the yield line:
🟩 Green when above average (stronger value signal)
🟥 Red when below average (weaker value signal)
💼 Why It Matters
FCF Yield is a powerful metric that reveals how efficiently a company turns revenue into usable cash. This can be a better long-term value indicator than earnings yield or P/E ratios, especially in capital-intensive industries.
✅ Best used in combination with:
📘 Greer Value (fundamental growth score)
🟢 Greer BuyZone (technical buy zone detection)
🔍 Designed for:
Fundamental investors
Value screeners
Dividend and FCF-focused strategies
📌 This tool is for informational and educational use only. Always do your own research before investing.

Sector Relative StrengthDescription
This script compares sector performance relative to the S&P 500. Sector price levels or charts alone can mislead, because they tend to move with the broader market. An increase in a sector’s price does not necessarily indicate strength, as it may simply be following the index.
For more a more reliable picture, the script calculates a ratio between each sector ETF and SPY. If the ratio has increased, the sector has outperformed the index. In case it has declined, the sector has underperformed. If the value is near zero, the sector has moved in line with the index. The sectors are presented in a table and sorted on relative performance.
Calculation Method
The performance is expressed as a percentage change in the ratio over a user-defined lookback period. The default lookback is set to 21 bars, which corresponds to one month on a daily chart. This value can be adopted in the settings to match preferred time period.
Z-Score
In addition to the percentage change, the script calculates a Z-score of the ratio, which measures how far the current value deviates from its recent mean. A high positive Z-score indicates that the ratio is significantly above its average, while a negative value indicates it is below. This normalization allows for comparison between sectors with different price levels or volatility profiles.
Table Columns
- Relative %: The sector's performance relative to SPY over the selected lookback period
- Z-Score: Standardized measure of current performance ratio is relative to its average
- Trend Arrow: Indicates the direction of relative performance up down or flat
Example Interpretation
For example, if XLK shows a 3.7% change, it has outperformed SPY over the selected period. Another sector might show a -2.1% change, which indicates underperformance. While both values shows relative strength or weakness, the Z-score is optional and can provide additional context based on how unusual that performance is compared to the sector's own recent behavior.
Use Case
This approach helps evaluate overall market conditions and supports a top-down method. By starting with sector performance, it becomes easier to identify where the market is showing leadership or weakness. This allows the stock selection process to be more deliberate and can help refine or customize screeners based on certain sectors.

All Harmonic Patterns [theEccentricTrader]█ OVERVIEW
This indicator automatically draws and sends alerts for all of the harmonic patterns in my public library as they occur. The patterns included are as follows:
• Bearish 5-0
• Bullish 5-0
• Bearish ABCD
• Bullish ABCD
• Bearish Alternate Bat
• Bullish Alternate Bat
• Bearish Bat
• Bullish Bat
• Bearish Butterfly
• Bullish Butterfly
• Bearish Cassiopeia A
• Bullish Cassiopeia A
• Bearish Cassiopeia B
• Bullish Cassiopeia B
• Bearish Cassiopeia C
• Bullish Cassiopeia C
• Bearish Crab
• Bullish Crab
• Bearish Deep Crab
• Bullish Deep Crab
• Bearish Cypher
• Bullish Cypher
• Bearish Gartley
• Bullish Gartley
• Bearish Shark
• Bullish Shark
• Bearish Three-Drive
• Bullish Three-Drive
█ CONCEPTS
Green and Red Candles
• A green candle is one that closes with a close price equal to or above the price it opened.
• A red candle is one that closes with a close price that is lower than the price it opened.
Swing Highs and Swing Lows
• A swing high is a green candle or series of consecutive green candles followed by a single red candle to complete the swing and form the peak.
• A swing low is a red candle or series of consecutive red candles followed by a single green candle to complete the swing and form the trough.
Peak and Trough Prices
• The peak price of a complete swing high is the high price of either the red candle that completes the swing high or the high price of the preceding green candle, depending on which is higher.
• The trough price of a complete swing low is the low price of either the green candle that completes the swing low or the low price of the preceding red candle, depending on which is lower.
Historic Peaks and Troughs
The current, or most recent, peak and trough occurrences are referred to as occurrence zero. Previous peak and trough occurrences are referred to as historic and ordered numerically from right to left, with the most recent historic peak and trough occurrences being occurrence one.
Upper Trends
• A return line uptrend is formed when the current peak price is higher than the preceding peak price.
• A downtrend is formed when the current peak price is lower than the preceding peak price.
• A double-top is formed when the current peak price is equal to the preceding peak price.
Lower Trends
• An uptrend is formed when the current trough price is higher than the preceding trough price.
• A return line downtrend is formed when the current trough price is lower than the preceding trough price.
• A double-bottom is formed when the current trough price is equal to the preceding trough price.
Range
The range is simply the difference between the current peak and current trough prices, generally expressed in terms of points or pips.
Wave Cycles
A wave cycle is here defined as a complete two-part move between a swing high and a swing low, or a swing low and a swing high. The first swing high or swing low will set the course for the sequence of wave cycles that follow; for example a chart that begins with a swing low will form its first complete wave cycle upon the formation of the first complete swing high and vice versa.
Figure 1.
Retracement and Extension Ratios
Retracement and extension ratios are calculated by dividing the current range by the preceding range and multiplying the answer by 100. Retracement ratios are those that are equal to or below 100% of the preceding range and extension ratios are those that are above 100% of the preceding range.
Fibonacci Retracement and Extension Ratios
The Fibonacci sequence is a series of numbers in which each number is the sum of the two preceding numbers, starting with 0 and 1. For example 0 + 1 = 1, 1 + 1 = 2, 1 + 2 = 3, and so on. Ultimately, we could go on forever but the first few numbers in the sequence are as follows: 0 , 1, 1, 2, 3, 5, 8, 13, 21, 34, 55, 89, 144.
The extension ratios are calculated by dividing each number in the sequence by the number preceding it. For example 0/1 = 0, 1/1 = 1, 2/1 = 2, 3/2 = 1.5, 5/3 = 1.6666..., 8/5 = 1.6, 13/8 = 1.625, 21/13 = 1.6153..., 34/21 = 1.6190..., 55/34 = 1.6176..., 89/55 = 1.6181..., 144/89 = 1.6179..., and so on. The retracement ratios are calculated by inverting this process and dividing each number in the sequence by the number proceeding it. For example 0/1 = 0, 1/1 = 1, 1/2 = 0.5, 2/3 = 0.666..., 3/5 = 0.6, 5/8 = 0.625, 8/13 = 0.6153..., 13/21 = 0.6190..., 21/34 = 0.6176..., 34/55 = 0.6181..., 55/89 = 0.6179..., 89/144 = 0.6180..., and so on.
Fibonacci ranges are typically drawn from left to right, with retracement levels representing ratios inside of the current range and extension levels representing ratios extended outside of the current range. If the current wave cycle ends on a swing low, the Fibonacci range is drawn from peak to trough. If the current wave cycle ends on a swing high the Fibonacci range is drawn from trough to peak.
Measurement Tolerances
Tolerance refers to the allowable variation or deviation from a specific value or dimension. It is the range within which a particular measurement is considered to be acceptable or accurate. I have applied this concept in my pattern detection logic and have set default tolerances where applicable, as perfect patterns are, needless to say, very rare.
Chart Patterns
Generally speaking price charts are nothing more than a series of swing highs and swing lows. When demand outweighs supply over a period of time prices swing higher and when supply outweighs demand over a period of time prices swing lower. These swing highs and swing lows can form patterns that offer insight into the prevailing supply and demand dynamics at play at the relevant moment in time.
‘Let us assume… that you the reader, are not a member of that mysterious inner circle known to the boardrooms as “the insiders”… But it is fairly certain that there are not nearly so many “insiders” as amateur trader supposes and… It is even more certain that insiders can be wrong… Any success they have, however, can be accomplished only by buying and selling… hey can do neither without altering the delicate poise of supply and demand that governs prices. Whatever they do is sooner or later reflected on the charts where you… can detect it. Or detect, at least, the way in which the supply-demand equation is being affected… So, you do not need to be an insider to ride with them frequently… prices move in trends. Some of those trends are straight, some are curved; some are brief and some are long and continued… produced in a series of action and reaction waves of great uniformity. Sooner or later, these trends change direction; they may reverse (as from up to down), or they may be interrupted by some sort of sideways movement and then, after a time, proceed again in their former direction… when a price trend is in the process of reversal… a characteristic area or pattern takes shape on the chart, which becomes recognisable as a reversal formation… Needless to say, the first and most important task of the technical chart analyst is to learn to know the important reversal formations and to judge what they may signify in terms of trading opportunities’ (Edwards & Magee, 1948).
This is as true today as it was when Edwards and Magee were writing in the first half of the last Century, study your patterns and make judgements for yourself about what their implications truly are on the markets and timeframes you are interested in trading.
Over the years, traders have come to discover a multitude of chart and candlestick patterns that are supposed to pertain information on future price movements. However, it is never so clear cut in practice and patterns that where once considered to be reversal patterns are now considered to be continuation patterns and vice versa. Bullish patterns can have bearish implications and bearish patterns can have bullish implications. As such, I would highly encourage you to do your own backtesting.
There is no denying that chart patterns exist, but their implications will vary from market to market and timeframe to timeframe. So it is down to you as an individual to study them and make decisions about how they may be used in a strategic sense.
Harmonic Patterns
The concept of harmonic patterns in trading was first introduced by H.M. Gartley in his book "Profits in the Stock Market", published in 1935. Gartley observed that markets have a tendency to move in repetitive patterns, and he identified several specific patterns that he believed could be used to predict future price movements. The bullish and bearish Gartley patterns are the oldest recognized harmonic patterns in trading and all the other harmonic patterns are modifications of the original Gartley patterns. Gartley patterns are fundamentally composed of 5 points, or 4 waves.
Since then, many other traders and analysts have built upon Gartley's work and developed their own variations of harmonic patterns. One such contributor is Larry Pesavento, who developed his own methods for measuring harmonic patterns using Fibonacci ratios. Pesavento has written several books on the subject of harmonic patterns and Fibonacci ratios in trading. Another notable contributor to harmonic patterns is Scott Carney, who developed his own approach to harmonic trading in the late 1990s and also popularised the use of Fibonacci ratios to measure harmonic patterns. Carney expanded on Gartley's work and also introduced several new harmonic patterns, such as the Shark pattern and the 5-0 pattern.
█ INPUTS
• Change pattern and label colours
• Show or hide patterns individually
• Adjust pattern tolerances
• Set or remove alerts for individual patterns
█ NOTES
You can test the patterns with your own strategies manually by applying the indicator to your chart while in bar replay mode and playing through the history. You could also automate this process with PineScript by using the conditions from my swing and pattern libraries as entry conditions in the strategy tester or your own custom made strategy screener.
█ LIMITATIONS
All green and red candle calculations are based on differences between open and close prices, as such I have made no attempt to account for green candles that gap lower and close below the close price of the preceding candle, or red candles that gap higher and close above the close price of the preceding candle. This may cause some unexpected behaviour on some markets and timeframes. I can only recommend using 24-hour markets, if and where possible, as there are far fewer gaps and, generally, more data to work with.
█ SOURCES
Edwards, R., & Magee, J. (1948) Technical Analysis of Stock Trends (10th edn). Reprint, Boca Raton, Florida: Taylor and Francis Group, CRC Press: 2013.

All Chart Patterns [theEccentricTrader]█ OVERVIEW
This indicator automatically draws and sends alerts for all of the chart patterns in my public library as they occur. The patterns included are as follows:
• Ascending Broadening
• Broadening
• Descending Broadening
• Double Bottom
• Double Top
• Triple Bottom
• Triple Top
• Bearish Elliot Wave
• Bullish Elliot Wave
• Bearish Alternate Flag
• Bullish Alternate Flag
• Bearish Flag
• Bullish Flag
• Bearish Ascending Head and Shoulders
• Bullish Ascending Head and Shoulders
• Bearish Descending Head and Shoulders
• Bullish Descending Head and Shoulders
• Bearish Head and Shoulders
• Bullish Head and Shoulders
• Bearish Pennant
• Bullish Pennant
• Ascending Wedge
• Descending Wedge
• Wedge
█ CONCEPTS
Green and Red Candles
• A green candle is one that closes with a close price equal to or above the price it opened.
• A red candle is one that closes with a close price that is lower than the price it opened.
Swing Highs and Swing Lows
• A swing high is a green candle or series of consecutive green candles followed by a single red candle to complete the swing and form the peak.
• A swing low is a red candle or series of consecutive red candles followed by a single green candle to complete the swing and form the trough.
Peak and Trough Prices
• The peak price of a complete swing high is the high price of either the red candle that completes the swing high or the high price of the preceding green candle, depending on which is higher.
• The trough price of a complete swing low is the low price of either the green candle that completes the swing low or the low price of the preceding red candle, depending on which is lower.
Historic Peaks and Troughs
The current, or most recent, peak and trough occurrences are referred to as occurrence zero. Previous peak and trough occurrences are referred to as historic and ordered numerically from right to left, with the most recent historic peak and trough occurrences being occurrence one.
Upper Trends
• A return line uptrend is formed when the current peak price is higher than the preceding peak price.
• A downtrend is formed when the current peak price is lower than the preceding peak price.
• A double-top is formed when the current peak price is equal to the preceding peak price.
Lower Trends
• An uptrend is formed when the current trough price is higher than the preceding trough price.
• A return line downtrend is formed when the current trough price is lower than the preceding trough price.
• A double-bottom is formed when the current trough price is equal to the preceding trough price.
Range
The range is simply the difference between the current peak and current trough prices, generally expressed in terms of points or pips.
Retracement and Extension Ratios
Retracement and extension ratios are calculated by dividing the current range by the preceding range and multiplying the answer by 100. Retracement ratios are those that are equal to or below 100% of the preceding range and extension ratios are those that are above 100% of the preceding range.
Measurement Tolerances
Tolerance refers to the allowable variation or deviation from a specific value or dimension. It is the range within which a particular measurement is considered to be acceptable or accurate. I have applied this concept in my pattern detection logic and have set default tolerances where applicable, as perfect patterns are, needless to say, very rare.
Chart Patterns
Generally speaking price charts are nothing more than a series of swing highs and swing lows. When demand outweighs supply over a period of time prices swing higher and when supply outweighs demand over a period of time prices swing lower. These swing highs and swing lows can form patterns that offer insight into the prevailing supply and demand dynamics at play at the relevant moment in time.
‘Let us assume… that you the reader, are not a member of that mysterious inner circle known to the boardrooms as “the insiders”… But it is fairly certain that there are not nearly so many “insiders” as amateur trader supposes and… It is even more certain that insiders can be wrong… Any success they have, however, can be accomplished only by buying and selling… hey can do neither without altering the delicate poise of supply and demand that governs prices. Whatever they do is sooner or later reflected on the charts where you… can detect it. Or detect, at least, the way in which the supply-demand equation is being affected… So, you do not need to be an insider to ride with them frequently… prices move in trends. Some of those trends are straight, some are curved; some are brief and some are long and continued… produced in a series of action and reaction waves of great uniformity. Sooner or later, these trends change direction; they may reverse (as from up to down), or they may be interrupted by some sort of sideways movement and then, after a time, proceed again in their former direction… when a price trend is in the process of reversal… a characteristic area or pattern takes shape on the chart, which becomes recognisable as a reversal formation… Needless to say, the first and most important task of the technical chart analyst is to learn to know the important reversal formations and to judge what they may signify in terms of trading opportunities’ (Edwards & Magee, 1948).
This is as true today as it was when Edwards and Magee were writing in the first half of the last Century, study your patterns and make judgements for yourself about what their implications truly are on the markets and timeframes you are interested in trading.
Over the years, traders have come to discover a multitude of chart and candlestick patterns that are supposed to pertain information on future price movements. However, it is never so clear cut in practice and patterns that where once considered to be reversal patterns are now considered to be continuation patterns and vice versa. Bullish patterns can have bearish implications and bearish patterns can have bullish implications. As such, I would highly encourage you to do your own backtesting.
There is no denying that chart patterns exist, but their implications will vary from market to market and timeframe to timeframe. So it is down to you as an individual to study them and make decisions about how they may be used in a strategic sense.
█ INPUTS
• Change pattern and label colours
• Show or hide patterns individually
• Adjust pattern ratios and tolerances
• Set or remove alerts for individual patterns
█ NOTES
I have decided to rename some of my previously published patterns based on the way in which the pattern completes. If the pattern completes on a swing high then the pattern is considered bearish, if the pattern completes on a swing low then it is considered bullish. This may seem confusing but it makes sense when you come to backtesting the patterns and want to use the most recent peak or trough prices as stop losses. Patterns that can complete on both a swing high and swing low are for such reasons treated as neutral, namely all broadening and wedge variations. I trust that it is quite self-evident that double and triple bottom patterns are considered bullish while double and triple top patterns are considered bearish, so I did not feel the need to rename those.
The patterns that have been renamed and what they have been renamed to, are as follows:
• Ascending Elliot Waves to Bearish Elliot Waves
• Descending Elliot Waves to Bullish Elliot Waves
• Ascending Head and Shoulders to Bearish Ascending Head and Shoulders
• Descending Head and Shoulders to Bearish Descending Head and Shoulders
• Head and Shoulders to Bearish Head and Shoulders
• Ascending Inverse Head and Shoulders to Bullish Ascending Head and Shoulders
• Descending Inverse Head and Shoulders to Bullish Descending Head and Shoulders
• Inverse Head and Shoulders to Bullish Head and Shoulders
You can test the patterns with your own strategies manually by applying the indicator to your chart while in bar replay mode and playing through the history. You could also automate this process with PineScript by using the conditions from my swing and pattern libraries as entry conditions in the strategy tester or your own custom made strategy screener.
█ LIMITATIONS
All green and red candle calculations are based on differences between open and close prices, as such I have made no attempt to account for green candles that gap lower and close below the close price of the preceding candle, or red candles that gap higher and close above the close price of the preceding candle. This may cause some unexpected behaviour on some markets and timeframes. I can only recommend using 24-hour markets, if and where possible, as there are far fewer gaps and, generally, more data to work with.
█ SOURCES
Edwards, R., & Magee, J. (1948) Technical Analysis of Stock Trends (10th edn). Reprint, Boca Raton, Florida: Taylor and Francis Group, CRC Press: 2013.

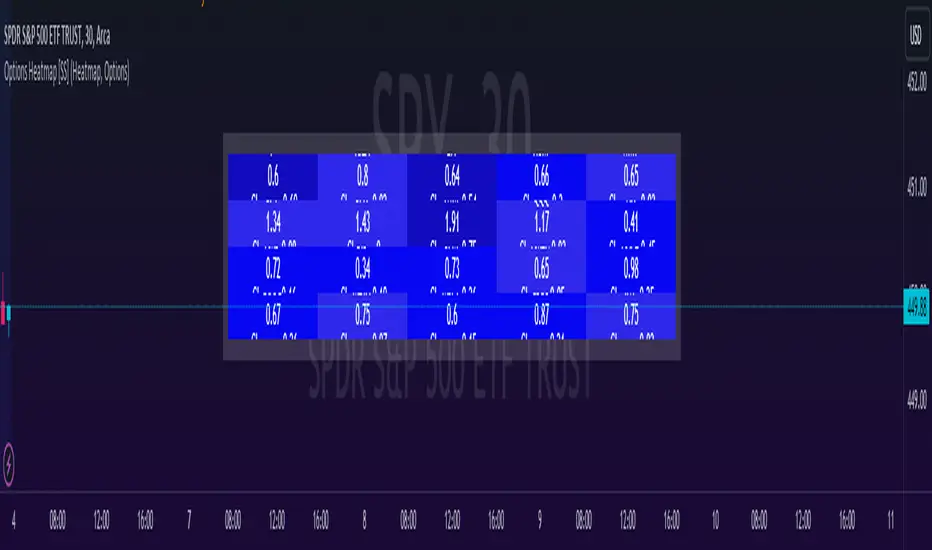
Options & Leveraged Shares Heatmap This is the leveraged share/option heatmap / screener.
Tradingview offers a few different tickers that have PTCR data on the daily timeframe. So I was able to pull those few tickers that display the PTCR data and format it into a heatmap.
I also had some room to add leveraged share data as well.
It is pretty self explanatory but I will go over it really briefly:
The timeframe is 1 D. This cannot be changed because this is the only timeframe available for the PTCR data.
It will pull the current day PTCR as well as the previous day PTCR and display the PTCR and change value.
The screening will be done according to the 1 day change.
You have the ability to select the option to sort by Max and Min or sort by heatmap:
Displaying max and min will show you the max positive and negative change among all the available tickers.
Max positive = bearish, as this indicates an uptick in Puts.
Max negative = bullish, as this indicates a decline in Puts.
If we flip over to the leveraged shares, it is the same:
To keep it consistent, the leveraged share ratio is displayed similar to PTCR. It is Sell to Buy ratio. The higher the ratio, the more selling and vice versa.
Thus, the same rules apply. Max positive = bearish and max negative = bullish.
If you want to display the heatmap, this is what it will look like:
The darker the blue, the higher the change in either a negative or positive direction. The same for the leveraged shares:
And that is the indicator.
Hopefully you find it helpful. I like to reference it at the end of each day to see how things are looking in terms of positioning for the following day.
Leave your comments/questions and suggestions below.
Safe trades!
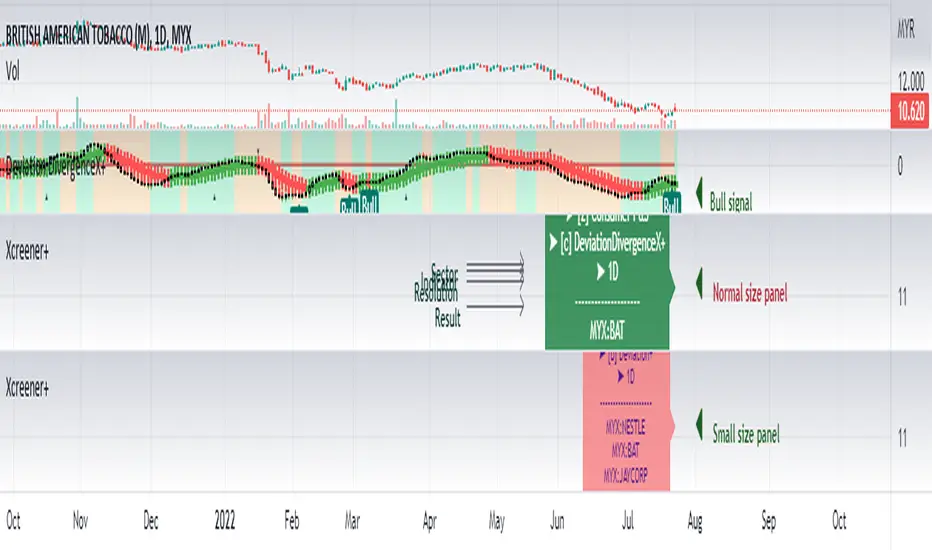
Xcreener+1. Xcreener+ is easy to use for stock screening to scan and filter instruments based on selective indicators from the setting list.
2. Please note that instruments in this indicator is ONLY included MALAYSIAN SHARES listed on Bursa Malaysia and not all Malaysian stocks is included.
3. Users can select one of eighteen (18) sectors from the list and subsequently select the indicator to add on to run the screener.
4. XLERT in setting allow you to create alert and notify user pre- and post-market.
5. Tooltip is added in indicator’s setting to illustrate the options available.
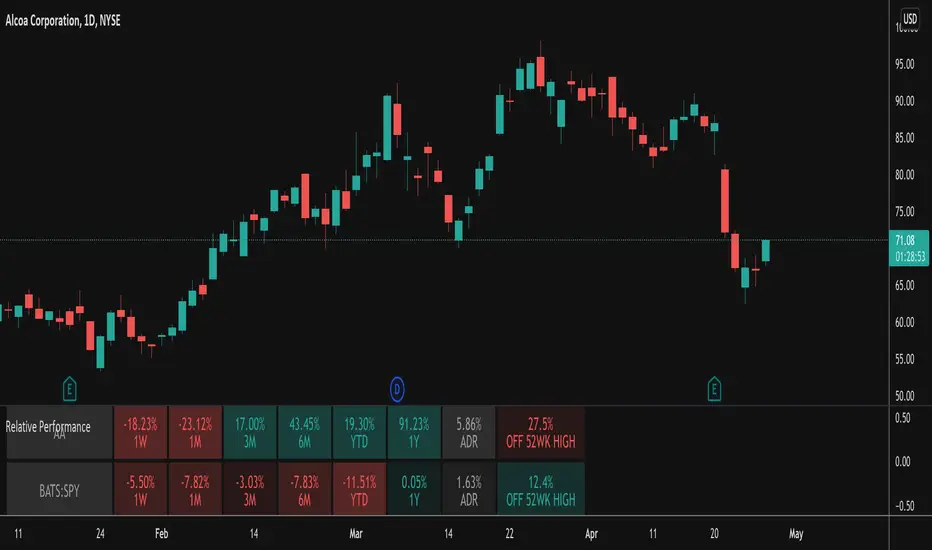
Relative PerformanceThis indicator takes the Performance Table from @BeeHolder and converts it to a Relative Performance table so you can compare the current chart vs. an Index (or whatever other ticker you want) to see the relative performance of one vs. the other. I also added a cell for ADR, which is also the same value as "Monthly Volatility" in the stock screener. This can be useful when screening stocks based on performance and volatility.