Multi-Strategy Trading Screener SummaryI only combined famous scripts, all thanks to wonderful scripts and community out there .
ThankYou !
------
Core Architecture
Multi-Symbol Analysis: Tracks up to 5 configurable tickers simultaneously
Multi-Timeframe Support: Each symbol can use different timeframes
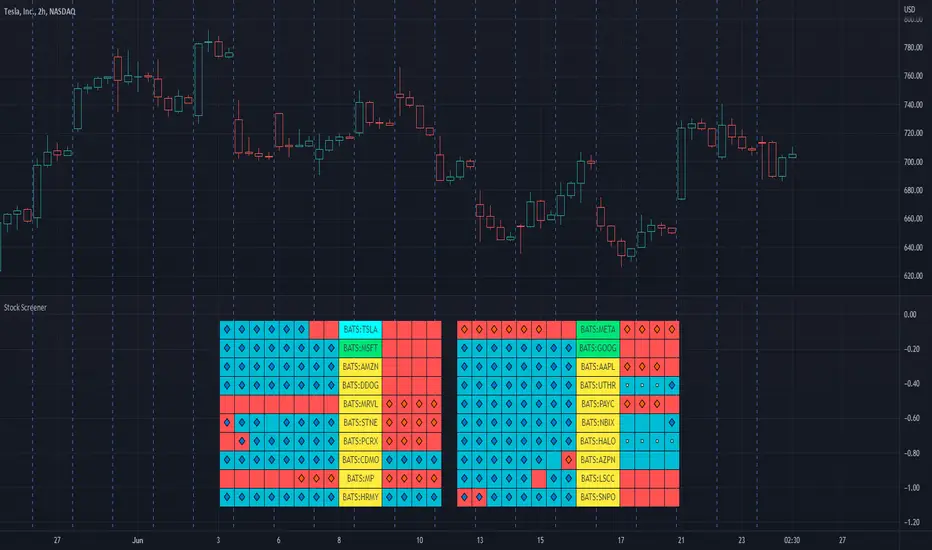
Real-Time Dashboard: Color-coded table displaying all signals and analysis
Trend Validation: All signals include trend alignment confirmation
Integrated Trading Strategies
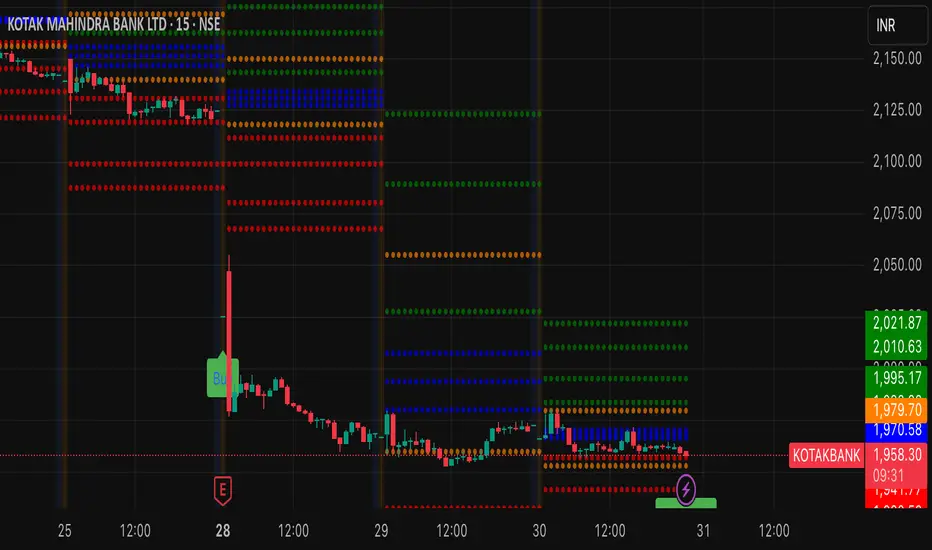
1. Breaker Blocks (Order Blocks)
Detects institutional order blocks using swing analysis
Tracks when blocks are broken and become "breaker blocks"
Monitors retests of broken levels
Shows trend alignment (✓ aligned, ⚠️ misaligned)
2. Chandelier Exit
ATR-based trend-following exit system
Provides BUY/SELL signals based on dynamic stop levels
Uses configurable ATR multiplier and lookback period
3. Smart Money Breakout
Channel breakout detection with volatility normalization
Identifies accumulation/distribution phases
Generates persistent BUY/SELL signals on breakouts
4. Trendline Breakout
Dynamic trendline detection using pivot highs/lows
Calculates trendline slopes and breakout points
Provides BUY signals on upward breaks, SELL on downward breaks
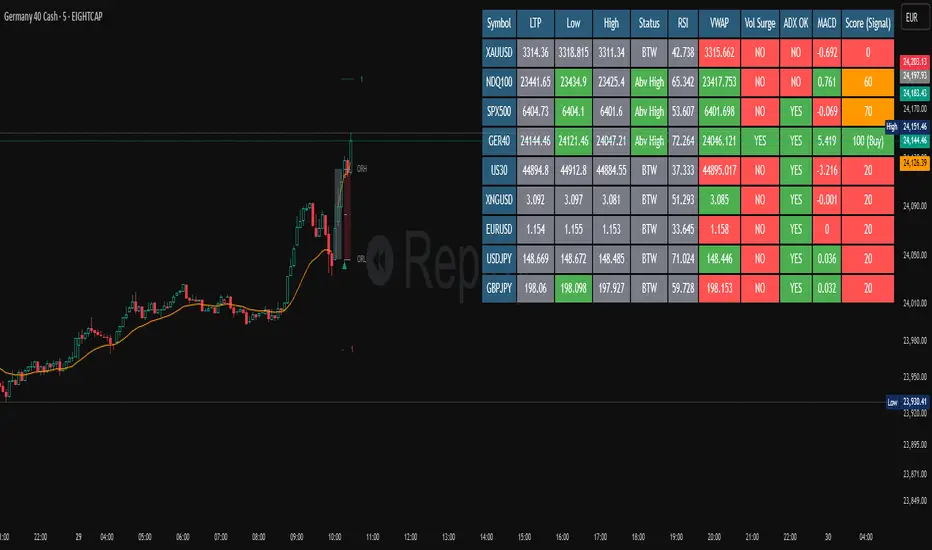
Dashboard Columns Explained
Symbol: Ticker being analyzed
Trend: Overall SuperTrend direction (🟢 UP / 🔴 DOWN / ⚪ FLAT)
Timeframe: Analysis timeframe with clock icon
Breaker Block: Type (Bullish/Bearish) with trend alignment indicator
Status: Price position relative to breaker block (Inside/Approaching/Far)
Retests: Number of times the broken level was retested (indicates level strength)
Volume: Volume associated with the order block formation
Chandelier: BUY/SELL signals from Chandelier Exit strategy
Smart Money: BUY/SELL signals from breakout detection
Trendline: BUY/SELL signals from trendline breakouts
Key Features
No HOLD States: All signals show definitive BUY (🟢) or SELL (🔴) only
Persistent Signals: Signals remain active until opposite conditions trigger
Color Coding: Visual distinction between bullish (green) and bearish (red) signals
Trend Alignment: Enhanced accuracy through trend confirmation logic
This screener provides a comprehensive view of market conditions across multiple strategies, helping identify high-probability trading opportunities when signals align.
Pine Script® indicator