Volume Profile (Simple)Simple Volume Profile (Simple)
Master the Market's Structure with a Clear View of Volume
by mercaderoaurum
The Simple Volume Profile (Simple) indicator removes the guesswork by showing you exactly where the most significant trading activity has occurred. By visualizing the Point of Control (POC) and Value Area (VA) for today and yesterday, you can instantly identify the price levels that matter most, giving you a critical edge in your intraday trading.
This tool is specifically optimized for day trading SPY on a 1-minute chart, but it's fully customizable for any symbol or timeframe.
Key Features
Multi-Day Analysis: Automatically plots the volume profiles for the current and previous trading sessions, allowing you to see how today's market is reacting to yesterday's key levels.
Automatic Key Level Plotting: Instantly see the most important levels from each session:
Point of Control (POC): The single price level with the highest traded volume, acting as a powerful magnet for price.
Value Area High (VAH): The upper boundary of the area where 50% of the volume was traded. It often acts as resistance.
Value Area Low (VAL): The lower boundary of the 50% value area, often acting as support.
Extended Levels: The POC, VAH, and VAL from previous sessions are automatically extended into the current day, providing a clear map of potential support and resistance zones.
Customizable Sessions: While optimized for the US stock market, you can define any session time and time zone, making it a versatile tool for forex, crypto, and futures traders.
Core Trading Strategies
The Simple Volume Profile helps you understand market context. Instead of trading blind, you can now make decisions based on where the market has shown the most interest.
1. Identifying Support and Resistance
This is the most direct way to use the indicator. The extended lines from the previous day are your roadmap for the current session.
Previous Day's POC (pPOC): This is the most significant level. Watch for price to react strongly here. It can act as powerful support if approached from above or strong resistance if approached from below.
Previous Day's VAH (pVAH): Expect this level to act as initial resistance. A clean break above pVAH can signal a strong bullish trend.
Previous Day's VAL (pVAL): Expect this level to act as initial support. A firm break below pVAL can indicate a strong bearish trend.
Example Strategy: If SPY opens and rallies up to the previous day's VAH and stalls, this is a high-probability area to look for a short entry, with a stop loss just above the level.
2. The "Open-Drive" Rejection
How the market opens in relation to the previous day's value area is a powerful tell.
Open Above Yesterday's Value Area: If the market opens above the pVAH, it signals strength. The first pullback to test the pVAH is often a key long entry point. The level is expected to flip from resistance to support.
Open Below Yesterday's Value Area: If the market opens below the pVAL, it signals weakness. The first rally to test the pVAL is a potential short entry, as the level is likely to act as new resistance.
3. Fading the Extremes
When price pushes far outside the previous day's value area, it can become overextended.
Reversal at Highs: If price rallies significantly above the pVAH and then starts to lose momentum (e.g., forming bearish divergence on RSI or a topping pattern), it could be an opportunity to short the market, targeting a move back toward the pVAH or pPOC.
Reversal at Lows: Conversely, if price drops far below the pVAL and shows signs of bottoming, it can be a good opportunity to look for a long entry, targeting a reversion back to the value area.
Recommended Settings (SPY Intraday)
These settings are the default and are optimized for scalping or day trading SPY on a 1-minute chart.
Value Area (%): 50%. This creates a tighter, more sensitive value area, perfect for identifying the most critical intraday zones.
Number of Rows: 1000. This high resolution is essential for a low-volatility instrument like SPY, ensuring that the profile is detailed and the levels are precise.
Session Time: 0400-1800 in America/New_York. This captures the full pre-market and core session, which is crucial for understanding the day's complete volume story.
Ready to trade with an edge? Add the Simple Volume Profile (Multi-Day) to your chart now and see the market in a new light!
Search in scripts for "session"

Time-Based VWAP (TVWAP)(TVWAP) Indicator
The Time-Based Volume Weighted Average Price (TVWAP) indicator is a customized version of VWAP designed for intraday trading sessions with defined start and end times. Unlike the traditional VWAP, which calculates the volume-weighted average price over an entire trading day, this indicator allows you to focus on specific time periods, such as ICT kill zones (e.g., London Open, New York Open, Power Hour). It helps crypto scalpers and advanced traders identify price deviations relative to volume during key trading windows.
Key Features:
Custom Time Interval:
You can set the exact start and end times for the VWAP calculation using input settings for hours and minutes (24-hour format).
Ideal for analyzing short, high-liquidity periods.
Dynamic Accumulation of Price and Volume:
The indicator resets at the beginning of the specified session and accumulates price-volume data until the end of the session.
Ensures that the TVWAP reflects the weighted average price specific to the chosen session.
Visual Representation:
The indicator plots the TVWAP line only during the specified time window, providing a clear visual reference for price action during that period.
Outside the session, the TVWAP line is hidden (na).
Use Cases:
ICT Scalp Trading:
Monitor price rebalances or potential liquidity sweeps near TVWAP during important trading sessions.
Mean Reversion Strategies:
Detect pullbacks toward the session’s average price for potential entry points.
Breakout Confirmation:
Confirm price direction relative to TVWAP during kill zones or high-volume times to determine if a breakout is supported by volume.
Inputs:
Start Hour/Minute: The time when the TVWAP calculation starts.
End Hour/Minute: The time when the TVWAP calculation ends.
Technical Explanation:
The indicator uses the timestamp function to create time markers for the session start and end.
During the session, the price-volume (close * volume) is accumulated along with the total volume.
TVWAP is calculated as:
TVWAP = (Sum of (Price × Volume)) ÷ (Sum of Volume)
Once the session ends, the TVWAP resets for the next trading period.
Customization Ideas:
Alerts: Add notifications when the price touches or deviates significantly from TVWAP.
Different Colors: Use different line colors based on upward or downward trends.
Multiple Sessions: Add support for multiple TVWAP lines for different time periods (e.g., London + New York).

Initial Balance Breakout Signals [LuxAlgo]The Initial Balance Breakout Signals help traders identify breakouts of the Initial Balance (IB) range.
The indicator includes automatic detection of IB or can use custom sessions, highlights top and bottom IB extensions, custom Fibonacci levels, and goes further with an IB forecast with two different modes.
🔶 USAGE
The initial balance is the price range made within the first hour of the trading session. It is an intraday concept based on the idea that high volume and volatility enter the market through institutional trading at the start of the session, setting the tone for the rest of the day.
The initial balance is useful for gauging market sentiment, or, in other words, the relationship between buyers and sellers.
Bullish sentiment: Price trades above the IB range.
Mixed sentiment: Price trades within the IB range.
Bearish sentiment: Price trades below the IB range.
The initial balance high and low are important levels that many traders use to gauge sentiment. There are two main ideas behind trading around the IB range.
IB Extreme Breakout: When the price breaks and holds the IB high or low, there is a high probability that the price will continue in that direction.
IB Extreme Rejection: When the price tries to break those levels but fails, there is a high probability that it will reach the opposite IB extreme.
This indicator is a complete Initial Balance toolset with custom sessions, breakout signals, IB extensions, Fibonacci retracements, and an IB forecast. All of these features will be explained in the following sections.
🔹 Custom Sessions and Signals
By default, sessions for Initial Balance and breakout signals are in Auto mode. This means that Initial Balance takes the first hour of the trading session and shows breakout signals for the rest of the session.
With this option, traders can use the tool for open range trading, making it highly versatile. The concept behind open range (OR) is the same as that of initial balance (IB), but in OR, the range is determined by the first minute, three or five minutes, or up to the first 30 minutes of the trading session.
As shown in the image above, the top chart uses the Auto feature for the IB and Breakouts sessions. The bottom chart has the Auto feature disabled to use custom sessions for both parameters. In this case, the first three minutes of the trading session are used, turning the tool into an Open Range trading indicator.
This chart shows another example of using custom sessions to display overnight NASDAQ futures sessions.
The left chart shows a custom session from the Tokyo open to the London open, and the right chart shows a custom session from the London open to the New York open.
The chart shows both the Asian and European sessions, their top and bottom extremes, and the breakout signals from those extremes.
🔹 Initial Balance Extensions
Traders can easily extend both extremes of the Initial Balance to display their preferred targets for breakouts. Enable or disable any of them and set the IB percentage to use for the extension.
As the chart shows, the percentage selected on the settings panel directly affects the displayed levels.
Setting 25 means the tool will use a quarter of the detected initial balance range for extensions beyond the IB extremes. Setting 100 means the full IB range will be used.
Traders can use these extensions as targets for breakout signals.
🔹 Fibonacci Levels
Traders can display default or custom Fibonacci levels on the IB range to trade retracements and assess the strength of market movements. Each level can be enabled or disabled and customized by level, color, and line style.
As we can see on the chart, after the IB was completed, prices were unable to fall below the 0.236 Fibonacci level. This indicates significant bullish pressure, so it is expected that prices will rise.
Traders can use these levels as guidelines to assess the strength of the side trying to penetrate the IB. In this case, the sellers were unable to move the market beyond the first level.
🔹 Initial Balance Forecast
The tool features two different forecasting methods for the current IB. By default, it takes the average of the last ten values and applies a multiplier of one.
IB Against Previous Open: averages the difference between IB extremes and the open of the previous session.
Filter by current day of the week: averages the difference between IB extremes and the open of the current session for the same day of the week.
This feature allows traders to see the difference between the current IB and the average of the last IBs. It makes it very easy to interpret: if the current IB is higher than the average, buyers are in control; if it is lower than the average, sellers are in control.
For example, on the left side of the chart, we can see that the last day was very bullish because the IB was completely above the forecasted value. This is the IB mean of the last ten trading days.
On the right, we can see that on Monday, September 15, the IB traded slightly higher but within the forecasted value of the IB mean of the last ten Mondays. In this case, it is within expectations.
🔶 SETTINGS
Display Last X IBs: Select how many IBs to display.
Initial Balance: Choose a custom session or enable the Auto feature.
Breakouts: Enable or disable breakouts. Choose custom session or enable the Auto feature.
🔹 Extensions
Top Extension: Enable or disable the top extension and choose the percentage of IB to use.
Bottom extension: Enable or disable the bottom extension and choose the percentage of IB to use.
🔹 Fibonacci Levels
Display Fibonacci: Enable or disable Fibonacci levels.
Reverse: Reverse Fibonacci levels.
Levels, Colors & Style
Display Labels: Enable or disable labels and choose text size.
🔹 Forecast
Display Forecast: Select the forecast method.
- IB Against Previous Open: Calculates the average difference between the IB high and low and the previous day's IB open price.
- Filter by Current Day of Week: Calculates the average difference between the IB high and low and the IB open price for the same day of the week.
Forecast Memory: The number of data points used to calculate the average.
Forecast Multiplier: This multiplier will be applied to the average. Bigger numbers will result in wider predicted ranges.
Forecast Colors: Choose from a variety of colors.
Forecast Style: Choose a line style.
🔹 Style
Initial Balance Colors
Extension Transparency: Choose the extension's transparency. 0 is solid, and 100 is fully transparent.

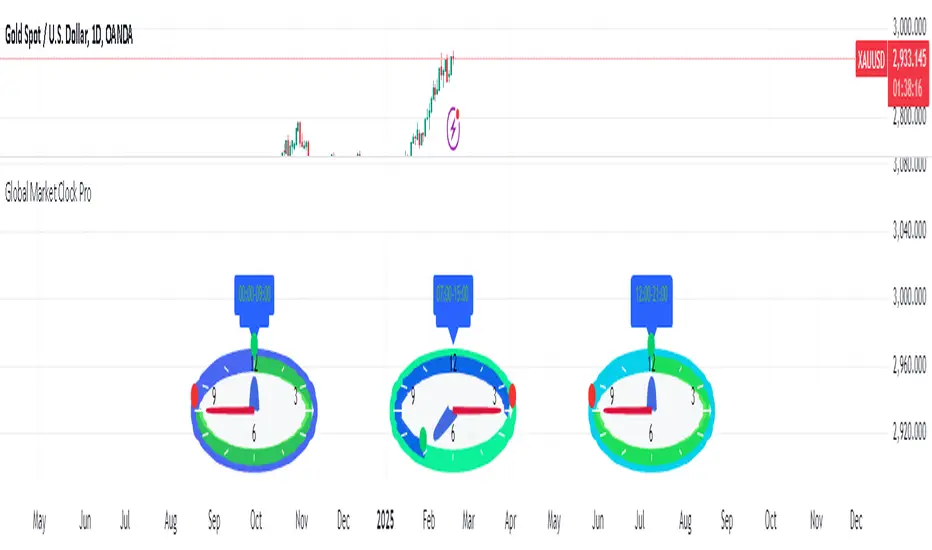
Global Market Clock Pro🌍✨ Global Market Clock Pro is a market session visualizer that combines utility and fun on your charts! 📊⏰ This indicator includes three analog clocks representing the Tokyo, London, and New York sessions, added in an entertaining way to make analysis more enjoyable and dynamic. 😊 Each clock clearly shows the session start and end times through arcs and distinctive markers, making it easier to identify active market periods. 💡
Also, a statistics table is added offering detailed information for each session:
📊 Percentage Change : Displays the price variation between sessions.
💰 Price Range : Highlights volatility within each session.
📈 Session Volume : Evaluates market activity based on traded volume.
📊 Average Volatility : Helps measure price fluctuations over time.
📌 Mean (Average Close) : Calculated by dividing the sum of closing prices of each bar by the total number of bars recorded during the session. This value gives you a reference for average price behavior, helping you detect general trends and key support/resistance levels. 📉
📌 Max Range (Maximum Range) : Represents the largest difference recorded between the highest and lowest prices during the session. This indicator is crucial for identifying volatility peaks, as it shows how far the market moved during its most active moments. 🔥
⚠️ VERY IMPORTANT : This tool works best only in timeframes under 4 hours ! ⏳
By integrating these data points directly into your chart, this indicator becomes a powerful tool to align your strategies with market activity in each session. Whether you're a day trader or a long-term investor, Global Market Clock Pro provides clear, data-driven insights to enhance decision-making. 💻📈
Español:
🌍✨ Global Market Clock Pro es un visualizador de sesiones de mercado que combina utilidad y diversión en tus gráficos. 📊⏰ Este indicador incluye tres relojes analógicos que representan las sesiones de Tokio, Londres y Nueva York, agregados de manera entretenida para hacer el análisis más ameno y dinámico. 😊 Cada reloj muestra con claridad los horarios de inicio y cierre de sesión mediante arcos y marcadores distintivos, facilitando la identificación de los periodos activos del mercado. 💡
Además, se añade una tabla de estadísticas que ofrece información detallada de cada sesión:
📊 Cambio porcentual : Muestra la variación de precio entre sesiones.
💰 Rango de precios : Destaca la volatilidad dentro de cada sesión.
📈 Volumen de sesión : Evalúa la actividad del mercado mediante el volumen negociado.
📊 Volatilidad promedio : Ayuda a medir las fluctuaciones del precio a lo largo del tiempo.
📌 Mean (Promedio de Cierre) : Se calcula dividiendo la suma de los precios de cierre de cada barra entre el número total de barras registradas durante la sesión. Este valor te brinda una referencia del comportamiento medio del precio, permitiéndote detectar tendencias generales y niveles clave de soporte o resistencia. 📉
📌 Max Range (Rango Máximo) : Representa la mayor diferencia registrada entre el precio más alto y el más bajo durante la sesión. Este indicador es fundamental para identificar los picos de volatilidad, ya que muestra hasta qué punto el mercado se movió en sus momentos de mayor actividad. 🔥
⚠️ ¡MUY IMPORTANTE! : Esta herramienta funciona mejor solo en temporalidades menores a 4 horas . ⏳
Al integrar estos datos directamente en el gráfico, este indicador se convierte en una herramienta poderosa para sincronizar tus estrategias con la actividad del mercado en cada sesión. Ya seas un trader intradía o un inversor a largo plazo, Global Market Clock Pro proporciona claridad basada en datos para mejorar la toma de decisiones. 💻📈
🚀 ¡No dejes pasar la oportunidad de optimizar tu experiencia de trading con esta innovadora herramienta! ✨
Advanced Time Dividers & Killzones IndicatorOverview
A comprehensive Pine Script v6 indicator that displays customizable time period dividers and trading session killzones on your chart. Perfect for intraday traders who need clear visual separation of time periods and want to identify key trading sessions.
✨ Features
Time Period Dividers
Weekly Lines: Vertical lines marking the start of each week
Monthly Lines: Vertical lines marking the start of each month
Quarterly Lines: Vertical lines marking the start of each quarter (Q1, Q2, Q3, Q4)
Yearly Lines: Vertical lines marking the start of each year
Trading Session Killzones
London Session: 2:00-5:00 GMT (Blue shaded box)
New York Session: 7:00-10:00 GMT (Green shaded box)
London Close: 10:00-12:00 GMT (Orange shaded box)
Asia Session: 20:00-00:00 GMT (Pink shaded box)
🎨 Customization Options
Display Controls
Toggle each time divider type individually
Toggle each killzone individually
Adjust historical and future display range
Show/hide labels on dividers and killzones
Style Customization
Line Styles: Choose between Solid, Dashed, or Dotted lines
Line Width: Adjustable from 1 to 5 pixels
Colors: Fully customizable colors for each element with transparency control
Label Size: Choose from Tiny, Small, Normal, or Large
Period Settings
Control how many bars to display in the past (0-5000)
Control how many bars to display in the future (0-1000)
📋 Usage Instructions
Add to Chart: Add the indicator to any chart
Select Timeframe: Works best on intraday timeframes (1H, 15min, 5min) for killzones
Customize: Open settings to enable/disable features and customize colors
Trading: Use the dividers to identify time periods and killzones to spot high-liquidity sessions
💡 Trading Applications
Time Dividers
Weekly/Monthly Analysis: Identify major time period transitions
Market Structure: Analyze how price behaves at period boundaries
Event Correlation: Align with economic calendar events
Killzones
High Liquidity Periods: Trade during peak market activity
ICT Strategy: Follows Inner Circle Trader killzone concepts
Session-Based Trading: Focus on specific trading sessions
Volatility Windows: Identify when major moves typically occur
⚙️ Technical Details
Version: Pine Script v6
Type: Overlay indicator
Max Lines: 500 (optimized performance)
Max Boxes: 500 (for killzone visualization)
Timezone: GMT/UTC for killzones
Memory Efficient: Automatic cleanup of old objects
🎯 Best Practices
Combine with Price Action: Use dividers to frame your analysis
Focus on Killzones: Most significant price moves occur during these sessions
Adjust Transparency: Find the right balance between visibility and chart clarity
Use Labels Wisely: Toggle labels on/off based on your needs
Timeframe Selection: Use lower timeframes (≤1H) to see killzones clearly
📝 Notes
Killzone times are in GMT/UTC timezone
Works on all instruments (Forex, Crypto, Stocks, Futures)
Optimized for performance with automatic memory management
Fully compatible with other indicators
🔄 Updates & Support
This indicator is actively maintained. Feel free to suggest improvements or report issues in the comments.

JK_Traders_Reality_LibLibrary "JK_Traders_Reality_Lib"
This library contains common elements used in Traders Reality scripts
calcPvsra(pvsraVolume, pvsraHigh, pvsraLow, pvsraClose, pvsraOpen, redVectorColor, greenVectorColor, violetVectorColor, blueVectorColor, darkGreyCandleColor, lightGrayCandleColor)
calculate the pvsra candle color and return the color as well as an alert if a vector candle has apperared.
Situation "Climax"
Bars with volume >= 200% of the average volume of the 10 previous chart TFs, or bars
where the product of candle spread x candle volume is >= the highest for the 10 previous
chart time TFs.
Default Colors: Bull bars are green and bear bars are red.
Situation "Volume Rising Above Average"
Bars with volume >= 150% of the average volume of the 10 previous chart TFs.
Default Colors: Bull bars are blue and bear are violet.
Parameters:
pvsraVolume (float) : the instrument volume series (obtained from request.sequrity)
pvsraHigh (float) : the instrument high series (obtained from request.sequrity)
pvsraLow (float) : the instrument low series (obtained from request.sequrity)
pvsraClose (float) : the instrument close series (obtained from request.sequrity)
pvsraOpen (float) : the instrument open series (obtained from request.sequrity)
redVectorColor (simple color) : red vector candle color
greenVectorColor (simple color) : green vector candle color
violetVectorColor (simple color) : violet/pink vector candle color
blueVectorColor (simple color) : blue vector candle color
darkGreyCandleColor (simple color) : regular volume candle down candle color - not a vector
lightGrayCandleColor (simple color) : regular volume candle up candle color - not a vector
@return
adr(length, barsBack)
Parameters:
length (simple int) : how many elements of the series to calculate on
barsBack (simple int) : starting possition for the length calculation - current bar or some other value eg last bar
@return adr the adr for the specified lenght
adrHigh(adr, fromDo)
Calculate the ADR high given an ADR
Parameters:
adr (float) : the adr
fromDo (simple bool) : boolean flag, if false calculate traditional adr from high low of today, if true calcualte from exchange midnight
@return adrHigh the position of the adr high in price
adrLow(adr, fromDo)
Parameters:
adr (float) : the adr
fromDo (simple bool) : boolean flag, if false calculate traditional adr from high low of today, if true calcualte from exchange midnight
@return adrLow the position of the adr low in price
splitSessionString(sessXTime)
given a session in the format 0000-0100:23456 split out the hours and minutes
Parameters:
sessXTime (simple string) : the session time string usually in the format 0000-0100:23456
@return
calcSessionStartEnd(sessXTime, gmt)
calculate the start and end timestamps of the session
Parameters:
sessXTime (simple string) : the session time string usually in the format 0000-0100:23456
gmt (simple string) : the gmt offset string usually in the format GMT+1 or GMT+2 etc
@return
drawOpenRange(sessXTime, sessXcol, showOrX, gmt)
draw open range for a session
Parameters:
sessXTime (simple string) : session string in the format 0000-0100:23456
sessXcol (simple color) : the color to be used for the opening range box shading
showOrX (simple bool) : boolean flag to toggle displaying the opening range
gmt (simple string) : the gmt offset string usually in the format GMT+1 or GMT+2 etc
@return void
drawSessionHiLo(sessXTime, showRectangleX, showLabelX, sessXcolLabel, sessXLabel, gmt, sessionLineStyle)
Parameters:
sessXTime (simple string) : session string in the format 0000-0100:23456
showRectangleX (simple bool)
showLabelX (simple bool)
sessXcolLabel (simple color) : the color to be used for the hi/low lines and label
sessXLabel (simple string) : the session label text
gmt (simple string) : the gmt offset string usually in the format GMT+1 or GMT+2 etc
sessionLineStyle (simple string) : the line stile for the session high low lines
@return void
calcDst()
calculate market session dst on/off flags
@return indicating if DST is on or off for a particular region
timestampPreviousDayOfWeek(previousDayOfWeek, hourOfDay, gmtOffset, oneWeekMillis)
Timestamp any of the 6 previous days in the week (such as last Wednesday at 21 hours GMT)
Parameters:
previousDayOfWeek (simple string) : Monday or Satruday
hourOfDay (simple int) : the hour of the day when psy calc is to start
gmtOffset (simple string) : the gmt offset string usually in the format GMT+1 or GMT+2 etc
oneWeekMillis (simple int) : the amount if time for a week in milliseconds
@return the timestamp of the psy level calculation start time
getdayOpen()
get the daily open - basically exchange midnight
@return the daily open value which is float price
newBar(res)
new_bar: check if we're on a new bar within the session in a given resolution
Parameters:
res (simple string) : the desired resolution
@return true/false is a new bar for the session has started
toPips(val)
to_pips Convert value to pips
Parameters:
val (float) : the value to convert to pips
@return the value in pips
rLabel(ry, rtext, rstyle, rcolor, valid, labelXOffset)
a function that draws a right aligned lable for a series during the current bar
Parameters:
ry (float) : series float the y coordinate of the lable
rtext (simple string) : the text of the label
rstyle (simple string) : the style for the lable
rcolor (simple color) : the color for the label
valid (simple bool) : a boolean flag that allows for turning on or off a lable
labelXOffset (int) : how much to offset the label from the current position
rLabelOffset(ry, rtext, rstyle, rcolor, valid, labelOffset)
a function that draws a right aligned lable for a series during the current bar
Parameters:
ry (float) : series float the y coordinate of the lable
rtext (string) : the text of the label
rstyle (simple string) : the style for the lable
rcolor (simple color) : the color for the label
valid (simple bool) : a boolean flag that allows for turning on or off a lable
labelOffset (int)
rLabelLastBar(ry, rtext, rstyle, rcolor, valid, labelXOffset)
a function that draws a right aligned lable for a series only on the last bar
Parameters:
ry (float) : series float the y coordinate of the lable
rtext (string) : the text of the label
rstyle (simple string) : the style for the lable
rcolor (simple color) : the color for the label
valid (simple bool) : a boolean flag that allows for turning on or off a lable
labelXOffset (int) : how much to offset the label from the current position
drawLine(xSeries, res, tag, xColor, xStyle, xWidth, xExtend, isLabelValid, xLabelOffset, validTimeFrame)
a function that draws a line and a label for a series
Parameters:
xSeries (float) : series float the y coordinate of the line/label
res (simple string) : the desired resolution controlling when a new line will start
tag (simple string) : the text for the lable
xColor (simple color) : the color for the label
xStyle (simple string) : the style for the line
xWidth (simple int) : the width of the line
xExtend (simple string) : extend the line
isLabelValid (simple bool) : a boolean flag that allows for turning on or off a label
xLabelOffset (int)
validTimeFrame (simple bool) : a boolean flag that allows for turning on or off a line drawn
drawLineDO(xSeries, res, tag, xColor, xStyle, xWidth, xExtend, isLabelValid, xLabelOffset, validTimeFrame)
a function that draws a line and a label for the daily open series
Parameters:
xSeries (float) : series float the y coordinate of the line/label
res (simple string) : the desired resolution controlling when a new line will start
tag (simple string) : the text for the lable
xColor (simple color) : the color for the label
xStyle (simple string) : the style for the line
xWidth (simple int) : the width of the line
xExtend (simple string) : extend the line
isLabelValid (simple bool) : a boolean flag that allows for turning on or off a label
xLabelOffset (int)
validTimeFrame (simple bool) : a boolean flag that allows for turning on or off a line drawn
drawPivot(pivotLevel, res, tag, pivotColor, pivotLabelColor, pivotStyle, pivotWidth, pivotExtend, isLabelValid, validTimeFrame, levelStart, pivotLabelXOffset)
draw a pivot line - the line starts one day into the past
Parameters:
pivotLevel (float) : series of the pivot point
res (simple string) : the desired resolution
tag (simple string) : the text to appear
pivotColor (simple color) : the color of the line
pivotLabelColor (simple color) : the color of the label
pivotStyle (simple string) : the line style
pivotWidth (simple int) : the line width
pivotExtend (simple string) : extend the line
isLabelValid (simple bool) : boolean param allows to turn label on and off
validTimeFrame (simple bool) : only draw the line and label at a valid timeframe
levelStart (int) : basically when to start drawing the levels
pivotLabelXOffset (int) : how much to offset the label from its current postion
@return the pivot line series
getPvsraFlagByColor(pvsraColor, redVectorColor, greenVectorColor, violetVectorColor, blueVectorColor, lightGrayCandleColor)
convert the pvsra color to an internal code
Parameters:
pvsraColor (color) : the calculated pvsra color
redVectorColor (simple color) : the user defined red vector color
greenVectorColor (simple color) : the user defined green vector color
violetVectorColor (simple color) : the user defined violet vector color
blueVectorColor (simple color) : the user defined blue vector color
lightGrayCandleColor (simple color) : the user defined regular up candle color
@return pvsra internal code
updateZones(pvsra, direction, boxArr, maxlevels, pvsraHigh, pvsraLow, pvsraOpen, pvsraClose, transperancy, zoneupdatetype, zonecolor, zonetype, borderwidth, coloroverride, redVectorColor, greenVectorColor, violetVectorColor, blueVectorColor)
a function that draws the unrecovered vector candle zones
Parameters:
pvsra (int) : internal code
direction (simple int) : above or below the current pa
boxArr (array) : the array containing the boxes that need to be updated
maxlevels (simple int) : the maximum number of boxes to draw
pvsraHigh (float) : the pvsra high value series
pvsraLow (float) : the pvsra low value series
pvsraOpen (float) : the pvsra open value series
pvsraClose (float) : the pvsra close value series
transperancy (simple int) : the transparencfy of the vecor candle zones
zoneupdatetype (simple string) : the zone update type
zonecolor (simple color) : the zone color if overriden
zonetype (simple string) : the zone type
borderwidth (simple int) : the width of the border
coloroverride (simple bool) : if the color overriden
redVectorColor (simple color) : the user defined red vector color
greenVectorColor (simple color) : the user defined green vector color
violetVectorColor (simple color) : the user defined violet vector color
blueVectorColor (simple color) : the user defined blue vector color
cleanarr(arr)
clean an array from na values
Parameters:
arr (array) : the array to clean
@return if the array was cleaned
calcPsyLevels(oneWeekMillis, showPsylevels, psyType, sydDST)
calculate the psy levels
4 hour res based on how mt4 does it
mt4 code
int Li_4 = iBarShift(NULL, PERIOD_H4, iTime(NULL, PERIOD_W1, Li_0)) - 2 - Offset;
ObjectCreate("PsychHi", OBJ_TREND, 0, Time , iHigh(NULL, PERIOD_H4, iHighest(NULL, PERIOD_H4, MODE_HIGH, 2, Li_4)), iTime(NULL, PERIOD_W1, 0), iHigh(NULL, PERIOD_H4,
iHighest(NULL, PERIOD_H4, MODE_HIGH, 2, Li_4)));
so basically because the session is 8 hours and we are looking at a 4 hour resolution we only need to take the highest high an lowest low of 2 bars
we use the gmt offset to adjust the 0000-0800 session to Sydney open which is at 2100 during dst and at 2200 otherwize. (dst - spring foward, fall back)
keep in mind sydney is in the souther hemisphere so dst is oposite of when london and new york go into dst
Parameters:
oneWeekMillis (simple int) : a constant value
showPsylevels (simple bool) : should psy levels be calculated
psyType (simple string) : the type of Psylevels - crypto or forex
sydDST (bool) : is Sydney in DST
@return
adrHiLo(length, barsBack, fromDO)
Parameters:
length (simple int) : how many elements of the series to calculate on
barsBack (simple int) : starting possition for the length calculation - current bar or some other value eg last bar
fromDO (simple bool) : boolean flag, if false calculate traditional adr from high low of today, if true calcualte from exchange midnight
@return adr, adrLow and adrHigh - the adr, the position of the adr High and adr Low with respect to price
drawSessionHiloLite(sessXTime, showRectangleX, showLabelX, sessXcolLabel, sessXLabel, gmt, sessionLineStyle, sessXcol)
Parameters:
sessXTime (simple string) : session string in the format 0000-0100:23456
showRectangleX (simple bool)
showLabelX (simple bool)
sessXcolLabel (simple color) : the color to be used for the hi/low lines and label
sessXLabel (simple string) : the session label text
gmt (simple string) : the gmt offset string usually in the format GMT+1 or GMT+2 etc
sessionLineStyle (simple string) : the line stile for the session high low lines
sessXcol (simple color) : - the color for the box color that will color the session
@return void
msToHmsString(ms)
converts milliseconds into an hh:mm string. For example, 61000 ms to '0:01:01'
Parameters:
ms (int) : - the milliseconds to convert to hh:mm
@return string - the converted hh:mm string
countdownString(openToday, closeToday, showMarketsWeekends, oneDay)
that calculates how much time is left until the next session taking the session start and end times into account. Note this function does not work on intraday sessions.
Parameters:
openToday (int) : - timestamps of when the session opens in general - note its a series because the timestamp was created using the dst flag which is a series itself thus producing a timestamp series
closeToday (int) : - timestamp of when the session closes in general - note its a series because the timestamp was created using the dst flag which is a series itself thus producing a timestamp series
@return a countdown of when next the session opens or 'Open' if the session is open now
showMarketsWeekends (simple bool)
oneDay (simple int)
countdownStringSyd(sydOpenToday, sydCloseToday, showMarketsWeekends, oneDay)
that calculates how much time is left until the next session taking the session start and end times into account. special case of intraday sessions like sydney
Parameters:
sydOpenToday (int)
sydCloseToday (int)
showMarketsWeekends (simple bool)
oneDay (simple int)

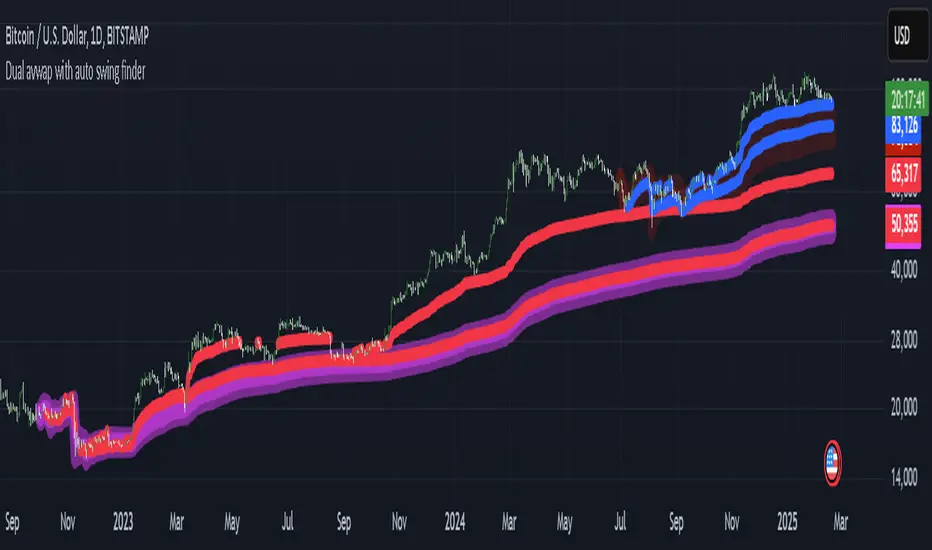
My auto dual avwap with Auto swing low/pivot low finderWelcome to My Auto Dual AVWAP with Auto Swing Low/Pivot Low Finder – an open-source TradingView indicator designed to enhance your technical analysis toolbox. This indicator is published under the Mozilla Public License 2.0 and is available for anyone to study, modify, and distribute.
Key Features
Auto Pivot/Swing Low Finder:
In addition to VWAP lines, the indicator incorporates an automatic detection mechanism for swing lows/pivot lows. This feature assists in identifying potential support areas and price reversals, further enhancing your trading strategy.
Dual VWAP Calculation with high/low range:
The indicator calculates two separate volume-weighted average price (VWAP) lines based on different price inputs (low and high prices) and defined time sessions. This allows traders to gain a more nuanced view of market activity during specific trading periods.
Customizable Time Sessions:
You can specify distinct start and end times for each VWAP calculation session. This flexibility helps you align the indicator with your preferred trading hours or market sessions, making it adaptable to various time zones and trading styles.
Easy to Customize:
With clear code structure and detailed comments, the script is designed to be accessible even for traders who want to customize or extend its functionality. Whether you're a seasoned coder or just starting out, the code is written with transparency in mind.
How It Works
Session Initialization:
The script sets up two distinct time sessions using user-defined start and end times. For each session, it detects the beginning of the trading period to reset cumulative values.
Cumulative Calculations:
During each session, the indicator accumulates the product of price and volume as well as the total volume. The VWAP is then computed as the ratio of these cumulative values.
Dual Data Sources:
Two separate data inputs (using low and high prices) are used to calculate two VWAP lines. This dual approach provides a broader perspective on market trends and can help in identifying dynamic support and resistance levels.
Visualization:
The calculated VWAP lines are plotted directly on your chart with distinct colors and thickness settings for easy visualization. This makes it simple to interpret the data at a glance.
Why Use This Indicator?
Whether you are a day trader, swing trader, or simply looking to refine your market analysis, My Auto Dual AVWAP with Auto Swing Low/Pivot Low Finder offers a robust set of features that can help you identify key price levels and improve your decision-making process. Its open-source nature invites collaboration and customization, ensuring that you can tailor it to fit your unique trading style.
Feel free to explore, modify, and share this indicator. Happy trading!
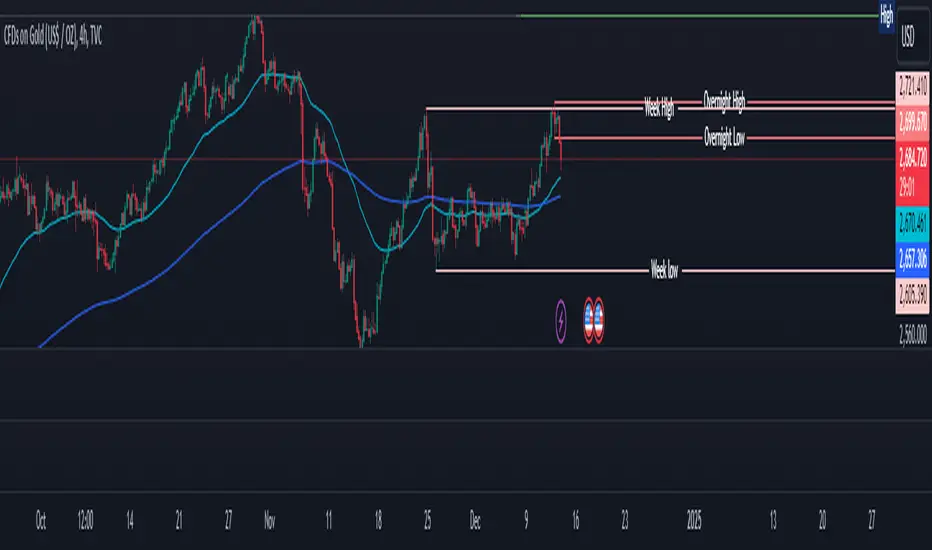
Overnight High/LowThe script identifies the Overnight High (the highest price) and Overnight Low (the lowest price) for a trading instrument during a specified overnight session. It then plots these levels on the chart for reference in subsequent trading sessions.
Key Features:
Time Settings:
The script defines the start (startHour) and end (endHour + endMinute) times for the overnight session.
The session spans across two calendar days, such as 5:00 PM (17:00) to 9:30 AM (09:30).
Tracking High and Low:
During the overnight session, the script dynamically tracks:
Overnight High: The highest price reached during the session.
Overnight Low: The lowest price reached during the session.
Reset Mechanism:
After the overnight session ends (at the specified end time), the script resets the overnightHigh and overnightLow variables, preparing for the next session.
Visual Representation:
The script uses horizontal dotted lines to plot:
A green line for the Overnight High.
A red line for the Overnight Low.
These lines extend to the right of the chart, providing visual reference points for traders.
How It Works:
Session Detection:
The script checks whether the current time falls within the overnight session:
If the hour is greater than or equal to the start hour (e.g., 17:00).
Or if the hour is less than or equal to the end hour (e.g., 09:30), considering the next day.
The end minute (e.g., 30 minutes past the hour) is also considered for precision.
High and Low Calculation:
During the overnight session:
If the overnightHigh is not yet defined, it initializes with the current candle's high.
If already defined, it updates by comparing the current candle's high to the existing overnightHigh using the math.max function.
Similarly, overnightLow is initialized or updated using the math.min function.
Post-Session Reset:
After the session ends, the script clears the overnightHigh and overnightLow variables by setting them to na (not available).
Line Drawing:
The script draws horizontal dotted lines for the Overnight High and Low during and after the session.
The lines extend indefinitely to the right of the chart.
Benefits:
Visual Aid: Helps traders quickly identify overnight support and resistance levels, which are critical for intraday trading.
Automation: Removes the need for manually plotting these levels each day.
Customizable: Time settings can be adjusted to match different markets or trading strategies.
This script is ideal for traders who use the overnight range as part of their analysis for breakouts, reversals, or trend continuation strategies.
chrono_utilsLibrary "chrono_utils"
Collection of objects and common functions that are related to datetime windows session days and time
ranges. The main purpose of this library is to handle time-related functionality and make it easy to reason about a
future bar checking if it will be part of a predefined session and/or inside a datetime window. All existing session
functionality I found in the documentation e.g. "not na(time(timeframe, session, timezone))" are not suitable for
strategy scripts, since the execution of the orders is delayed by one bar, due to the script execution happening at
the bar close. Moreover, a history operator with a negative value that looks forward is not allowed in any pinescript
expression. So, a prediction for the next bar using the bars_back argument of "time()"" and "time_close()" was
necessary. Thus, I created this library to overcome this small but very important limitation. In the meantime, I
added useful functionality to handle session-based behavior. An interesting utility that emerged from this
development is the data anomaly detection where a comparison between the prediction and the actual value is happening.
If those two values are different then a data inconsistency happened between the prediction bar and the actual bar
(probably due to a holiday, half session day, a timezone change etc..)
exTimezone(timezone)
exTimezone - Convert extended timezone to timezone string
Parameters:
timezone (simple string) : - The timezone or a special string
Returns: string representing the timezone
nameOfDay(day)
nameOfDay - Convert the day id into a short nameOfDay
Parameters:
day (int) : - The day id to convert
Returns: - The short name of the day
today()
today - Get the day id of this day
Returns: - The day id
nthDayAfter(day, n)
nthDayAfter - Get the day id of n days after the given day
Parameters:
day (int) : - The day id of the reference day
n (int) : - The number of days to go forward
Returns: - The day id of the day that is n days after the reference day
nextDayAfter(day)
nextDayAfter - Get the day id of next day after the given day
Parameters:
day (int) : - The day id of the reference day
Returns: - The day id of the next day after the reference day
nthDayBefore(day, n)
nthDayBefore - Get the day id of n days before the given day
Parameters:
day (int) : - The day id of the reference day
n (int) : - The number of days to go forward
Returns: - The day id of the day that is n days before the reference day
prevDayBefore(day)
prevDayBefore - Get the day id of previous day before the given day
Parameters:
day (int) : - The day id of the reference day
Returns: - The day id of the previous day before the reference day
tomorrow()
tomorrow - Get the day id of the next day
Returns: - The next day day id
normalize(num, min, max)
normalizeHour - Check if number is inthe range of
Parameters:
num (int)
min (int)
max (int)
Returns: - The normalized number
normalizeHour(hourInDay)
normalizeHour - Check if hour is valid and return a noralized hour range from
Parameters:
hourInDay (int)
Returns: - The normalized hour
normalizeMinute(minuteInHour)
normalizeMinute - Check if minute is valid and return a noralized minute from
Parameters:
minuteInHour (int)
Returns: - The normalized minute
monthInMilliseconds(mon)
monthInMilliseconds - Calculate the miliseconds in one bar of the timeframe
Parameters:
mon (int) : - The month of reference to get the miliseconds
Returns: - The number of milliseconds of the month
barInMilliseconds()
barInMilliseconds - Calculate the miliseconds in one bar of the timeframe
Returns: - The number of milliseconds in one bar
method to_string(this)
to_string - Formats the time window into a human-readable string
Namespace types: DateTimeWindow
Parameters:
this (DateTimeWindow) : - The time window object with the from and to datetimes
Returns: - The string of the time window
method to_string(this)
to_string - Formats the session days into a human-readable string with short day names
Namespace types: SessionDays
Parameters:
this (SessionDays) : - The session days object with the day selection
Returns: - The string of the session day short names
method to_string(this)
to_string - Formats the session time into a human-readable string
Namespace types: SessionTime
Parameters:
this (SessionTime) : - The session time object with the hour and minute of the time of the day
Returns: - The string of the session time
method to_string(this)
to_string - Formats the session time into a human-readable string
Namespace types: SessionTimeRange
Parameters:
this (SessionTimeRange) : - The session time range object with the start and end time of the daily session
Returns: - The string of the session time
method to_string(this)
to_string - Formats the session into a human-readable string
Namespace types: Session
Parameters:
this (Session) : - The session object with the day and the time range selection
Returns: - The string of the session
method init(this, fromDateTime, toDateTime)
init - Initialize the time window object from boolean values of each session day
Namespace types: DateTimeWindow
Parameters:
this (DateTimeWindow) : - The time window object that will hold the from and to datetimes
fromDateTime (int) : - The starting datetime of the time window
toDateTime (int) : - The ending datetime of the time window
Returns: - The time window object
method init(this, refTimezone, chTimezone, fromDateTime, toDateTime)
init - Initialize the time window object from boolean values of each session day
Namespace types: DateTimeWindow
Parameters:
this (DateTimeWindow) : - The time window object that will hold the from and to datetimes
refTimezone (simple string) : - The timezone of reference of the 'from' and 'to' dates
chTimezone (simple string) : - The target timezone to convert the 'from' and 'to' dates
fromDateTime (int) : - The starting datetime of the time window
toDateTime (int) : - The ending datetime of the time window
Returns: - The time window object
method init(this, sun, mon, tue, wed, thu, fri, sat)
init - Initialize the session days object from boolean values of each session day
Namespace types: SessionDays
Parameters:
this (SessionDays) : - The session days object that will hold the day selection
sun (bool) : - Is Sunday a trading day?
mon (bool) : - Is Monday a trading day?
tue (bool) : - Is Tuesday a trading day?
wed (bool) : - Is Wednesday a trading day?
thu (bool) : - Is Thursday a trading day?
fri (bool) : - Is Friday a trading day?
sat (bool) : - Is Saturday a trading day?
Returns: - The session days object
method init(this, unixTime)
init - Initialize the object from the hour and minute of the session time in exchange timezone (syminfo.timezone)
Namespace types: SessionTime
Parameters:
this (SessionTime) : - The session time object with the hour and minute of the time of the day
unixTime (int) : - The unix time
Returns: - The session time object
method init(this, hourInDay, minuteInHour)
init - Initialize the object from the hour and minute of the session time in exchange timezone (syminfo.timezone)
Namespace types: SessionTime
Parameters:
this (SessionTime) : - The session time object with the hour and minute of the time of the day
hourInDay (int) : - The hour of the time
minuteInHour (int) : - The minute of the time
Returns: - The session time object
method init(this, hourInDay, minuteInHour, refTimezone)
init - Initialize the object from the hour and minute of the session time
Namespace types: SessionTime
Parameters:
this (SessionTime) : - The session time object with the hour and minute of the time of the day
hourInDay (int) : - The hour of the time
minuteInHour (int) : - The minute of the time
refTimezone (string) : - The timezone of reference of the 'hour' and 'minute'
Returns: - The session time object
method init(this, startTime, endTime)
init - Initialize the object from the start and end session time in exchange timezone (syminfo.timezone)
Namespace types: SessionTimeRange
Parameters:
this (SessionTimeRange) : - The session time range object that will hold the start and end time of the daily session
startTime (SessionTime) : - The time the session begins
endTime (SessionTime) : - The time the session ends
Returns: - The session time range object
method init(this, startTimeHour, startTimeMinute, endTimeHour, endTimeMinute, refTimezone)
init - Initialize the object from the start and end session time
Namespace types: SessionTimeRange
Parameters:
this (SessionTimeRange) : - The session time range object that will hold the start and end time of the daily session
startTimeHour (int) : - The time hour the session begins
startTimeMinute (int) : - The time minute the session begins
endTimeHour (int) : - The time hour the session ends
endTimeMinute (int) : - The time minute the session ends
refTimezone (string)
Returns: - The session time range object
method init(this, days, timeRanges)
init - Initialize the session object from session days and time range
Namespace types: Session
Parameters:
this (Session) : - The session object that will hold the day and the time range selection
days (SessionDays) : - The session days object that defines the days the session is happening
timeRanges (array) : - The array of all the session time ranges during a session day
Returns: - The session object
method init(this, days, timeRanges, names, colors)
init - Initialize the session object from session days and time range
Namespace types: SessionView
Parameters:
this (SessionView) : - The session view object that will hold the session, the names and the color selections
days (SessionDays) : - The session days object that defines the days the session is happening
timeRanges (array) : - The array of all the session time ranges during a session day
names (array) : - The array of the names of the sessions
colors (array) : - The array of the colors of the sessions
Returns: - The session object
method get_size_in_secs(this)
get_size_in_secs - Count the seconds from start to end in the given timeframe
Namespace types: DateTimeWindow
Parameters:
this (DateTimeWindow) : - The time window object with the from and to datetimes
Returns: - The number of seconds inside the time widow for the given timeframe
method get_size_in_secs(this)
get_size_in_secs - Calculate the seconds inside the session
Namespace types: SessionTimeRange
Parameters:
this (SessionTimeRange) : - The session time range object with the start and end time of the daily session
Returns: - The number of seconds inside the session
method get_size_in_bars(this)
get_size_in_bars - Count the bars from start to end in the given timeframe
Namespace types: DateTimeWindow
Parameters:
this (DateTimeWindow) : - The time window object with the from and to datetimes
Returns: - The number of bars inside the time widow for the given timeframe
method get_size_in_bars(this)
get_size_in_bars - Calculate the bars inside the session
Namespace types: SessionTimeRange
Parameters:
this (SessionTimeRange) : - The session time range object with the start and end time of the daily session
Returns: - The number of bars inside the session for the given timeframe
method is_bar_included(this, offset_forward)
is_bar_included - Check if the given bar is between the start and end dates of the window
Namespace types: DateTimeWindow
Parameters:
this (DateTimeWindow) : - The time window object with the from and to datetimes
offset_forward (simple int) : - The number of bars forward. Default is 1
Returns: - Whether the current bar is inside the datetime window
method is_bar_included(this, offset_forward)
is_bar_included - Check if the given bar is inside the session as defined by the input params (what "not na(time(timeframe.period, this.to_sess_string()) )" should return if you could write it
Namespace types: Session
Parameters:
this (Session) : - The session with the day and the time range selection
offset_forward (simple int) : - The bar forward to check if it is between the from and to datetimes. Default is 1
Returns: - Whether the current time is inside the session
method to_sess_string(this)
to_sess_string - Formats the session days into a session string with day ids
Namespace types: SessionDays
Parameters:
this (SessionDays) : - The session days object
Returns: - The string of the session day ids
method to_sess_string(this)
to_sess_string - Formats the session time into a session string
Namespace types: SessionTime
Parameters:
this (SessionTime) : - The session time object with the hour and minute of the time of the day
Returns: - The string of the session time
method to_sess_string(this)
to_sess_string - Formats the session time into a session string
Namespace types: SessionTimeRange
Parameters:
this (SessionTimeRange) : - The session time range object with the start and end time of the daily session
Returns: - The string of the session time
method to_sess_string(this)
to_sess_string - Formats the session into a session string
Namespace types: Session
Parameters:
this (Session) : - The session object with the day and the time range selection
Returns: - The string of the session
method from_sess_string(this, sess)
from_sess_string - Initialize the session days object from the session string
Namespace types: SessionDays
Parameters:
this (SessionDays) : - The session days object that will hold the day selection
sess (string) : - The session string part that represents the days
Returns: - The session days object
method from_sess_string(this, sess)
from_sess_string - Initialize the session time object from the session string in exchange timezone (syminfo.timezone)
Namespace types: SessionTime
Parameters:
this (SessionTime) : - The session time object that will hold the hour and minute of the time
sess (string) : - The session string part that represents the time HHmm
Returns: - The session time object
method from_sess_string(this, sess, refTimezone)
from_sess_string - Initialize the session time object from the session string
Namespace types: SessionTime
Parameters:
this (SessionTime) : - The session time object that will hold the hour and minute of the time
sess (string) : - The session string part that represents the time HHmm
refTimezone (simple string) : - The timezone of reference of the 'hour' and 'minute'
Returns: - The session time object
method from_sess_string(this, sess)
from_sess_string - Initialize the session time range object from the session string in exchange timezone (syminfo.timezone)
Namespace types: SessionTimeRange
Parameters:
this (SessionTimeRange) : - The session time range object that will hold the start and end time of the daily session
sess (string) : - The session string part that represents the time range HHmm-HHmm
Returns: - The session time range object
method from_sess_string(this, sess, refTimezone)
from_sess_string - Initialize the session time range object from the session string
Namespace types: SessionTimeRange
Parameters:
this (SessionTimeRange) : - The session time range object that will hold the start and end time of the daily session
sess (string) : - The session string part that represents the time range HHmm-HHmm
refTimezone (simple string) : - The timezone of reference of the time ranges
Returns: - The session time range object
method from_sess_string(this, sess)
from_sess_string - Initialize the session object from the session string in exchange timezone (syminfo.timezone)
Namespace types: Session
Parameters:
this (Session) : - The session object that will hold the day and the time range selection
sess (string) : - The session string that represents the session HHmm-HHmm,HHmm-HHmm:ddddddd
Returns: - The session time range object
method from_sess_string(this, sess, refTimezone)
from_sess_string - Initialize the session object from the session string
Namespace types: Session
Parameters:
this (Session) : - The session object that will hold the day and the time range selection
sess (string) : - The session string that represents the session HHmm-HHmm,HHmm-HHmm:ddddddd
refTimezone (simple string) : - The timezone of reference of the time ranges
Returns: - The session time range object
method nth_day_after(this, day, n)
nth_day_after - The nth day after the given day that is a session day (true) in the object
Namespace types: SessionDays
Parameters:
this (SessionDays) : - The session days object with the day selection
day (int) : - The day id of the reference day
n (int) : - The number of days after
Returns: - The day id of the nth session day of the week after the given day
method nth_day_before(this, day, n)
nth_day_before - The nth day before the given day that is a session day (true) in the object
Namespace types: SessionDays
Parameters:
this (SessionDays) : - The session days object with the day selection
day (int) : - The day id of the reference day
n (int) : - The number of days after
Returns: - The day id of the nth session day of the week before the given day
method next_day(this)
next_day - The next day that is a session day (true) in the object
Namespace types: SessionDays
Parameters:
this (SessionDays) : - The session days object with the day selection
Returns: - The day id of the next session day of the week
method previous_day(this)
previous_day - The previous day that is session day (true) in the object
Namespace types: SessionDays
Parameters:
this (SessionDays) : - The session days object with the day selection
Returns: - The day id of the previous session day of the week
method get_sec_in_day(this)
get_sec_in_day - Count the seconds since the start of the day this session time represents
Namespace types: SessionTime
Parameters:
this (SessionTime) : - The session time object with the hour and minute of the time of the day
Returns: - The number of seconds passed from the start of the day until that session time
method get_ms_in_day(this)
get_ms_in_day - Count the milliseconds since the start of the day this session time represents
Namespace types: SessionTime
Parameters:
this (SessionTime) : - The session time object with the hour and minute of the time of the day
Returns: - The number of milliseconds passed from the start of the day until that session time
method is_day_included(this, day)
is_day_included - Check if the given day is inside the session days
Namespace types: SessionDays
Parameters:
this (SessionDays) : - The session days object with the day selection
day (int) : - The day to check if it is a trading day
Returns: - Whether the current day is included in the session days
DateTimeWindow
DateTimeWindow - Object that represents a datetime window with a beginning and an end
Fields:
fromDateTime (series int) : - The beginning of the datetime window
toDateTime (series int) : - The end of the datetime window
SessionDays
SessionDays - Object that represent the trading days of the week
Fields:
days (map) : - The map that contains all days of the week and their session flag
SessionTime
SessionTime - Object that represents the time (hour and minutes)
Fields:
hourInDay (series int) : - The hour of the day that ranges from 0 to 24
minuteInHour (series int) : - The minute of the hour that ranges from 0 to 59
minuteInDay (series int) : - The minute of the day that ranges from 0 to 1440. They will be calculated based on hourInDay and minuteInHour when method is called
SessionTimeRange
SessionTimeRange - Object that represents a range that extends from the start to the end time
Fields:
startTime (SessionTime) : - The beginning of the time range
endTime (SessionTime) : - The end of the time range
isOvernight (series bool) : - Whether or not this is an overnight time range
Session
Session - Object that represents a session
Fields:
days (SessionDays) : - The map of the trading days
timeRanges (array) : - The array with all time ranges of the session during the trading days
SessionView
SessionView - Object that visualize a session
Fields:
sess (Session) : - The Session object to be visualized
names (array) : - The names of the session time ranges
colors (array) : - The colors of the session time ranges

[Statistics] killzone SFPSFP Statistics (ICT Sessions)
This indicator automatically finds and draws the high and low of the Asia, London, and New York trading sessions. It then hunts for Swing Failure Patterns (SFPs) that sweep these key session levels.
The main purpose of this script is to gather statistics on when these high-probability SFPs occur, allowing you to map out and identify the times of day when they are most frequent.
How to Use This Indicator
Set Your SFP Timeframe: In the settings, choose the timeframe you want to hunt for SFPs on (e.g., 1H, 15m). Important: You must also set your main chart to this exact same timeframe for the statistics to be collected correctly.
Define Your Sessions: Go to the "Session Definitions" tab.
Set the Global Timezone to your preferred trading timezone (e.g., "America/New_York"). This controls all session times and table times.
Adjust the start and end times for Asia, London, and NY AM sessions.
You can turn off sessions you don't want to track (like NY Lunch or NY PM).
You can also change the colors and text style for the session boxes here.
Set Confirmation Bars: In "SFP Engine Settings," the "Confirmation Bars" (default is 2) defines how many bars must close after the SFP bar without invalidating the level. An SFP is only "confirmed" and drawn after this period.
0 = Confirms immediately on the SFP candle's close.
2 = Confirms 2 bars after the SFP candle's close.
Read the Statistics: The "Custom SFP Statistics" table will appear on your chart. This table logs every confirmed SFP and tells you:
Which time of day they happen most.
How many were Bearish (swept a high) vs. Bullish (swept a low).
It's set by default to show the "Top 20" most frequent times, sorted chronologically.
Filter Your Chart (Optional): If your chart feels cluttered, go to "Visual Time Filter" and turn it ON.
Set a time window (e.g., "09:30-11:00").
The indicator will now only draw SFP signals that occurred within that specific time window. This is perfect for focusing on a single killzone.
How to Set Up Alerts
You can set up server-side alerts to be notified every time a new SFP is confirmed.
Check the "Enable SFP Alerts" box at the top of the indicator's settings.
Click the "Alert" button (alarm clock icon) on the TradingView toolbar.
In the "Condition" dropdown, select "SFP Statistics (ICT Sessions)".
In the second dropdown, choose "Any alert() function call".
Most Important Step: In the "Message" box, delete any default text and type in this exact placeholder:
{{alert_message}}
Set the trigger to "Once Per Bar Close".
Click "Create".
How Alerts Work (Triggers & Filtering)
Trigger: Alerts are tied to the confirmed signal. An alert will only fire after your "Confirmation Bars" have passed and the SFP is locked in. This prevents you from getting alerts on fake-outs.
Alert Filtering: The alerts are linked to the "Visual Time Filter". If you turn on the Visual Time Filter (e.g., to 09:30-11:00), you will only receive alerts for SFPs that are confirmed within that time window. If an SFP happens at 14:00, the script will ignore it, it will not be drawn, and it will not send you an alert. This allows you to get alerts only for the session you are actively trading.
Note: This is a first draft of this indicator. I will continue to work on it and improve it over time, as it may still contain small bugs.
Acknowledgements:
A big thank you to TFO (tradeforopp). The session detection logic and the visual style for the session boxes were adapted from his excellent "ICT Killzones & Pivots " indicator.

Globex Trap w/ percentage [SLICKRICK]Globex Trap w/ Percentage
Overview
The Globex Trap w/ Percentage indicator is a powerful tool designed to help traders identify high-probability trading opportunities by analyzing price action during the Globex (overnight) session and regular trading hours. By combining Globex session ranges with Supply & Demand zones, this indicator highlights potential "trap" areas where significant price reactions may occur. Additionally, it calculates the Globex session range as a percentage of the daily Average True Range (ATR), providing valuable context for assessing market volatility.
This indicator is ideal for traders in futures markets or other instruments traded during Globex sessions, offering a visual and analytical edge for spotting key price levels and potential reversals or breakouts.
Key Features
Globex Session Tracking:
Visualizes the high and low of the Globex session (default: 3:00 PM to 6:30 AM PST) with customizable time settings.
Displays a semi-transparent box to mark the Globex range, with labels for "Globex High" and "Globex Low."
Calculates the Globex range as a percentage of the daily ATR, displayed as a label for quick reference.
Supply & Demand Zones:
Identifies Supply & Demand zones during regular trading hours (default: 6:00 AM to 8:00 AM PST) with customizable time settings.
Draws semi-transparent boxes to highlight these zones, aiding in the identification of key support and resistance areas.
Trap Area Identification:
Highlights potential trap zones where Globex ranges and Supply & Demand zones overlap, indicating areas where price may reverse or consolidate due to trapped traders.
Customizable Settings:
Adjust Globex and Supply & Demand session times to suit your trading preferences.
Toggle visibility of Globex and Supply & Demand zones independently.
Customize box colors for better chart readability.
Set the lookback period (default: 10 days) to control how many historical zones are displayed.
Configure the ATR length (default: 14) for the percentage calculation.
PST Timezone Default:
All times are based on Pacific Standard Time (PST) by default, ensuring accurate session tracking for users in this timezone or those aligning with U.S. West Coast market hours.
Recommended Usage
Timeframes: Best used on 1-hour charts or lower (e.g., 15-minute, 5-minute) for precise entry and exit points.
Markets: Optimized for futures (e.g., ES, NQ, CL) and other instruments traded during Globex sessions.
Historical Data: Ensure at least 10 days of historical data for optimal visualization of zones.
Strategy Integration: Use the indicator to identify potential reversals or breakouts at Globex highs/lows or Supply & Demand zones. The ATR percentage provides context for whether the Globex range is significant relative to typical daily volatility.
How It Works
Globex Session:
Tracks the high and low prices during the user-defined Globex session (default: 3:00 PM to 6:30 AM PST).
When the session ends, a box is drawn from the start to the end of the session, capturing the high and low prices.
Labels are placed at the midpoint of the session, showing "Globex High," "Globex Low," and the range as a percentage of the daily ATR (e.g., "75.23% of Daily ATR").
Supply & Demand Zones:
Tracks the high and low prices during the user-defined regular trading hours (default: 6:00 AM to 8:00 AM PST).
Draws a box to mark these zones, which often act as key support or resistance levels.
ATR Percentage:
Calculates the Globex range (high minus low) and divides it by the daily ATR to express it as a percentage.
This metric helps traders gauge whether the overnight price movement is significant compared to the instrument’s typical volatility.
Time Handling:
Uses PST (UTC-8) for all time calculations, ensuring accurate session timing for users aligning with this timezone.
Properly handles overnight sessions that cross midnight, ensuring seamless tracking.
Input Settings
Globex Session Settings:
Show Globex Session: Enable/disable Globex session visualization (default: true).
Globex Start/End Time: Set the start and end times for the Globex session (default: 3:00 PM to 6:30 AM PST).
Globex Box Color: Customize the color of the Globex session box (default: semi-transparent gray).
Supply & Demand Zone Settings:
Show Supply & Demand Zone: Enable/disable zone visualization (default: true).
Zone Start/End Time: Set the start and end times for Supply & Demand zones (default: 6:00 AM to 8:00 AM PST).
Zone Box Color: Customize the color of the zone box (default: semi-transparent aqua).
General Settings:
Days to Look Back: Number of historical days to display zones (default: 10).
ATR Length: Period for calculating the daily ATR (default: 14).
Notes
All times are in Pacific Standard Time (PST). Adjust the start and end times if your market operates in a different timezone or if you prefer different session windows.
The indicator is optimized for instruments with active Globex sessions, such as futures. Results may vary for non-24/5 markets.
A typo in the label "Globe Low" (should be "Globex Low") will be corrected in future updates.
Ensure your TradingView chart is set to display sufficient historical data to view the full lookback period.
Why Use This Indicator?
The Globex Trap w/ Percentage indicator provides a unique combination of session-based range analysis, Supply & Demand zone identification, and volatility context via the ATR percentage. Whether you’re a day trader, swing trader, or scalper, this tool helps you:
Pinpoint key price levels where institutional traders may act.
Assess the significance of overnight price movements relative to daily volatility.
Identify potential trap zones for high-probability setups.
Customize the indicator to fit your trading style and market preferences.

STOCK EXCHANGE + SILVER BULLET FRAMESThis script is an updated version of the " NY/LDN/TOK Stock Exchange Opening Hours " script.
Objective
Displays global stock exchange sessions (New York, London, Tokyo) with session frames, highs/lows, and opening lines. Includes ICT Silver Bullet windows (NY, London, Tokyo) with configurable shading. Past sessions are frozen at close, ongoing sessions update dynamically until closure, and upcoming sessions are pre-drawn. Fully customizable with options for weekends, labels, padding, opacity, and individual session toggles.
It is designed to help traders quickly interpret market context, liquidity zones, and session-based price behavior.
Main Features
Past sessions (historical data)
• Session Frames:
• Each box is frozen at the session’s close.
• The left edge aligns with the opening time, while the right edge is fixed at the closing time.
• The top and bottom reflect the highest and lowest prices during the session.
• Session Labels:
• Names (NY, LDN, TOK) displayed above the frame, aligned left, in the same color as the frame.
• Opening Lines:
• Vertical dotted lines mark the start of each session.
Ongoing and upcoming sessions (live market)
• Dynamic Session Frames:
• The right edge is locked at the future close time.
• The top and bottom update in real time as new highs and lows form.
• Labels and Lines:
• The session label is visible above the active frame.
• Opening lines are drawn as soon as the session begins.
Silver Bullet Time Windows (ICT concept)
• Highlights key liquidity windows within sessions:
• New York: 10:00–11:00 and 14:00–15:00
• London: 08:00–09:00
• Tokyo: 09:00–10:00
• Silver Bullet zones are shaded with configurable opacity (default 5%).
Customization and Options
• Enable or disable individual sessions (NY, London, Tokyo).
• Toggle weekend display (frames and Silver Bullets).
• Adjust label size, padding, and text visibility.
• Control frame opacity (default 0%).
• Optimized memory management with automatic pruning of old graphical objects.

Weekday Signal [QuantAlchemy]### Weekday Signal Indicator
#### Overview
The "Weekday Signal " indicator offers a method for triggering entry and exit signals based on specific weekdays and defined trading sessions. This allows traders to tailor their strategies to time slots and days, ensuring strategic execution and optimal trading periods.
Additionally, this indicator exposes signals for external use in other scripts, enabling integration with additional trading strategies or indicators, thereby enhancing its utility and flexibility for trading systems.
#### Definitions
- **Weekday Signal**: An indicator designed to trigger entry and exit signals based on specific weekdays within defined trading sessions.
- **Time Zone**: The local or preferred time zone setting to match market hours across global exchanges.
- **Trading Session**: The specific hours within a day when the trading signals are active.
#### Plots
- **Enter Signal**: Plots a signal when the conditions for entering a trade are met.
- **Exit Signal**: Plots a signal when the conditions for exiting a trade are met.
#### Properties
- **Flexible Time Zones**: Allows users to set their preferred time zone to align with global market hours.
- **Customizable Entry and Exit Days**: Users can select specific weekdays for entry and exit signals.
- **Defined Trading Sessions**: Users can define trading session hours to restrict signals to optimal market times.
- **Visual Indicators**: Provides clear visual plots and background colors on the chart to indicate when entry and exit criteria are met.
- **Dual Group Configuration**: Separate controls for entry and exit setups, offering flexibility in managing trading signals.
#### How to Read
1. **Green Background**: Indicates a potential entry signal.
2. **Red Background**: Indicates a potential exit signal.
3. **Status Line and Data Window**: Shows a value of 1 when an entry or exit condition is met and 0 otherwise.
#### Proposed Interpretations
- **Entry Signals**: When the background turns green and the status line/data window shows a value of 1, it indicates a potential time to enter a trade based on the selected weekday and session.
- **Exit Signals**: When the background turns red and the status line/data window shows a value of 1, it indicates a potential time to exit a trade based on the selected weekday and session.
#### Essential Knowledge
- **Weekdays and Trading Sessions**: Understanding the significance of specific trading days and sessions can help in optimizing trade timings.
- **Time Zones**: Correctly setting the time zone ensures alignment with market hours and accurate signal generation.
#### Deeper Concepts
- **Signal Filtering**: The script uses the `time_filter` library to determine if the current time falls within the defined entry or exit periods.
#### Typical Use Cases
- **Intraday Trading**: Traders who want to restrict their trades to specific weekdays and trading sessions.
- **Strategy Integration**: Users can integrate the signals from this indicator into broader trading strategies or other Pine Scripts using the signals as an external reference to an input.
#### Limitations
- **Time Zone Settings**: Incorrect time zone settings can lead to misaligned signals.
- **Trading Sessions**: Signals are limited to the defined trading session hours, which may not cover all market conditions.
#### Final Thoughts
The "Weekday Signal " indicator is a tool for traders looking to refine their entry and exit points based on specific days and sessions. By leveraging customizable time zones and trading sessions, traders can refine their strategic execution.
#### Disclaimer
This indicator is for educational purposes only and should not be construed as financial advice. Trading involves risk, and you should consult with a qualified financial advisor before making any trading decisions.

TRIZONACCI_Mean reversal_signalsMarket State Engine
Deterministic Confidence-Scoring System for TradingView
A professional-grade PineScript v5 indicator that scores market conditions from 0-100, helping traders identify high-quality trading opportunities through systematic structure analysis, VWAP positioning, order flow dynamics, and time-based context.
🎯 Overview
The Market State Engine is not a trading bot—it's a noise-reduction and opportunity-ranking system designed to filter market conditions and surface only the highest-quality setups.
Instead of blindly taking every signal, this indicator:
✅ Scores market conditions objectively (0-100 scale)
✅ Filters out low-probability setups automatically
✅ Classifies opportunities into A, A+, and A++ grades
✅ Alerts only on confirmed structure shifts with supporting context
✅ Keeps the human in control - provides intelligence, not automation
Philosophy: Reduce Noise. Enforce Discipline. Surface Quality.
🚀 Key Features
Deterministic Scoring - No black boxes, fully explainable logic
Multi-Factor Analysis - Combines 4 independent market state components
Structure-First Approach - Only alerts on confirmed pivot breaks
VWAP Mean Reversion Logic - Directional filtering based on VWAP zones
Order Flow Proxy - CVD divergence and confirmation detection
Session-Aware Scoring - Prioritizes high-volume New York sessions
Alert De-Duplication - One alert per unique structure shift
Zero Repainting - Uses confirmed pivots only (left=2, right=2)
Fully Configurable - All parameters exposed as inputs
Visual Feedback - VWAP bands, setup labels, and real-time score panel
📊 Scoring System (0-100)
The Market State Engine evaluates four independent components, each contributing up to 25 points for a maximum total score of 100.
🎯 Component Breakdown
Component Max Points Description
VWAP Context 25 Measures price deviation from session VWAP
Structure Shift 25 Confirms pivot breakout (HARD GATE)
CVD Alignment 25 Detects order flow divergence/confirmation
Time-of-Day 25 Identifies high-probability trading sessions
1️⃣ VWAP Context (Max 25 Points)
Purpose: Identifies extreme price deviations from fair value for mean-reversion opportunities.
VWAP (Volume-Weighted Average Price) is calculated session-anchored to New York market time, with standard deviation bands creating zones of opportunity.
Band Structure:
1st Band: ±1σ from VWAP (fair value zone)
2nd Band: ±2σ from VWAP (moderate deviation)
3rd Band: ±3σ from VWAP (extreme deviation)
Scoring Logic (Exclusive):
Price in 3rd VWAP Band (>2σ and ≤3σ) → +25 points
Price in 2nd VWAP Band (>1σ and ≤2σ) → +15 points
Otherwise (inside 1σ or beyond 3σ) → 0 points
Key Insight: The further price stretches from VWAP, the higher the probability of mean reversion.
2️⃣ Structure Shift (Max 25 Points) — HARD GATE
Purpose: Confirms momentum shift through confirmed pivot breakouts.
⚠️ CRITICAL: Structure shift is mandatory. If no valid structure shift occurs, the total score becomes 0 regardless of other factors.
Detection Method:
Uses TradingView's ta.pivothigh() and ta.pivotlow() functions with locked parameters:
Left bars: 2
Right bars: 2
Source: Configurable (Wick or Body)
Break confirmation: Candle close only
Bullish Structure Shift:
✅ Prior swing high exists (confirmed pivot)
✅ Current candle closes above swing high + tick buffer
✅ Must occur in VWAP 2nd or 3rd band
✅ VWAP Filter: Price must be at or below VWAP (lower bands)
Bearish Structure Shift:
✅ Prior swing low exists (confirmed pivot)
✅ Current candle closes below swing low - tick buffer
✅ Must occur in VWAP 2nd or 3rd band
✅ VWAP Filter: Price must be at or above VWAP (upper bands)
Scoring:
Valid structure shift → +25 points
No structure shift → Total score = 0
Tick Buffer: Default 5 ticks (configurable) - prevents false breaks from minor price noise.
3️⃣ CVD Alignment (Max 25 Points)
Purpose: Detects institutional order flow through volume delta analysis.
CVD (Cumulative Volume Delta) is a proxy for order flow:
Close > Open → +Volume (buying pressure)
Close < Open → -Volume (selling pressure)
Scoring Logic:
Condition Points Description
Divergence +25 Price makes higher high + CVD makes lower high (bearish)
Price makes lower low + CVD makes higher low (bullish)
Confirmation +20 Price and CVD both make higher highs or lower lows
Neutral 0 No clear divergence or confirmation
Lookback Window: Last 20 bars (configurable) - prevents stale divergences.
Key Insight: Divergences suggest weakening momentum, while confirmations validate the trend.
4️⃣ Time-of-Day Context (Max 25 Points)
Purpose: Prioritizes high-volume, high-volatility New York sessions.
Scored Sessions (America/New_York timezone):
Session Time Range (NY) Points Description
Pre-Market 03:00 - 04:00 +25 Early liquidity injection
Market Open 09:30 - 11:30 +25 Highest volume period
Off-Hours All other times 0 Lower probability setups
Key Insight: Structure shifts during active sessions have higher follow-through probability.
🏆 Setup Classification
Setups are graded based on total score thresholds (configurable):
Grade Score Range Typical Components Quality Level
A++ Setup ≥90 All 4 factors aligned
(VWAP 3rd band + Structure + CVD + Session) Premium - Rare
A+ Setup ≥75 Structure + VWAP + CVD or Session
(3 of 4 factors) High - Select
A Setup ≥60 Structure + VWAP + Session
(Minimum viable setup) Good - Regular
No Grade <60 Insufficient confluence Filtered out
Default Thresholds:
A Setup: 60 points
A+ Setup: 75 points
A++ Setup: 90 points
📥 Installation
Step 1: Download the Indicator
Download the market_state_engine.pine file from this repository.
Step 2: Add to TradingView
Open TradingView
Open the Pine Editor (bottom panel)
Click "New" → "Blank indicator"
Delete all default code
Paste the contents of market_state_engine.pine
Click "Add to Chart"
Step 3: Configure for Your Symbol
Click the gear icon next to the indicator name
Adjust Tick Size for your instrument:
ES futures: 0.25
NQ futures: 0.25
Stocks: 0.01
Save settings
⚙️ Configuration
Symbol Settings
Parameter Default Description
Tick Size 0.25 Minimum price movement for your symbol
Tick Buffer Count 5 Ticks beyond swing for valid break
VWAP Settings
Parameter Default Description
VWAP Band 1 (σ) 1.0 1st standard deviation multiplier
VWAP Band 2 (σ) 2.0 2nd standard deviation multiplier
VWAP Band 3 (σ) 3.0 3rd standard deviation multiplier
Session Settings
Parameter Default Description
Session 1 0300-0400 Pre-market window (NY time)
Session 2 0930-1130 Market open window (NY time)
Score Thresholds
Parameter Default Description
A Setup Threshold 60 Minimum score for A grade
A+ Setup Threshold 75 Minimum score for A+ grade
A++ Setup Threshold 90 Minimum score for A++ grade
CVD Settings
Parameter Default Description
CVD Divergence Lookback 20 Maximum bars for divergence detection
Swing Settings
Parameter Default Options Description
Swing Detection Method Wick Wick / Body Use high/low or open/close for pivots
Visual Settings
Parameter Default Description
Show VWAP Bands ✅ Display VWAP and standard deviation bands
Show Setup Labels ✅ Display setup markers on chart
Show Score Panel ✅ Display real-time score breakdown
📖 How to Use
Step 1: Apply to 1-Minute Chart
⚠️ The indicator is locked to 1-minute timeframe - do not use on other timeframes.
Step 2: Understand the Visual Signals
Setup Labels
Green Triangle (▲) - Bullish (Long) setup detected
Red Triangle (▼) - Bearish (Short) setup detected
Label shows Grade (A/A+/A++) and Total Score
VWAP Bands
Yellow Line - Session VWAP (fair value)
Blue Bands - ±1σ (fair value zone)
Purple Bands - ±2σ (moderate deviation)
Red Bands - ±3σ (extreme deviation)
Score Panel (Top Right)
Real-time breakdown of all four components:
Component Score
VWAP Zone 15/25
Structure 25/25
CVD 20/25
Session 25/25
TOTAL 85/100 (A+)
Step 3: Interpret Signals
Valid Long Setup:
✅ Green triangle below candle
✅ Price in lower VWAP bands (below VWAP)
✅ Structure shift breaks swing high
✅ Score ≥60
Valid Short Setup:
✅ Red triangle above candle
✅ Price in upper VWAP bands (above VWAP)
✅ Structure shift breaks swing low
✅ Score ≥60
Step 4: Set Up Alerts (See Alert Conditions section)
🚦 Signal Filters (VWAP Zone Logic)
The indicator uses directional VWAP filtering to prevent counter-trend signals:
Long Signals (Green)
Only allowed when price is AT or BELOW VWAP
✅ Lower 2nd band (-2σ to -1σ)
✅ Lower 3rd band (-3σ to -2σ)
✅ At VWAP exactly
❌ BLOCKED in upper bands (above VWAP)
Logic: Longs when price is stretched below fair value (mean reversion)
Short Signals (Red)
Only allowed when price is AT or ABOVE VWAP
✅ Upper 2nd band (+1σ to +2σ)
✅ Upper 3rd band (+2σ to +3σ)
✅ At VWAP exactly
❌ BLOCKED in lower bands (below VWAP)
Logic: Shorts when price is stretched above fair value (mean reversion)
🎨 Visual Elements
Chart Overlays
Element Color Description
VWAP Line Yellow Session-anchored fair value
±1σ Bands Blue Fair value zone (no score)
±2σ Bands Purple Moderate deviation (15 pts)
±3σ Bands Red Extreme deviation (25 pts)
Swing Highs Red ▼ Confirmed pivot highs
Swing Lows Green ▲ Confirmed pivot lows
Session Background Light Green Active high-value session
Setup Labels
Bullish Setup:
A+
▲ 75
Green label below candle, shows grade and score
Bearish Setup:
A++
▼ 90
Red label above candle, shows grade and score
Score Panel
Real-time table in top-right corner:
Individual component scores (0-25 each)
Total score (0-100)
Current setup grade (A/A+/A++)
Updates in real-time as market conditions change
🔔 Alert Conditions
Setting Up Alerts
Method 1: Built-in Alert Conditions
Click "Create Alert" in TradingView
Select Market State Engine as condition
Choose alert type:
Bullish Setup - Long signals only
Bearish Setup - Short signals only
Any Setup - All signals
Set to "Once Per Bar Close"
Configure notification method (app, email, webhook)
Method 2: Custom Alert Message
Alert messages include full breakdown:
A+ Setup Detected (Score: 85)
Components: VWAP(25) + Structure(25) + CVD(20) + Time(15)
CVD State: Confirmation
Direction: Long
Timeframe: 1m
Alert Behavior
✅ One alert per unique pivot break - no spam
✅ Fires on candle close only - no repainting
✅ Minimum score filter - only A grade or higher (≥60)
✅ Direction-specific - separate bullish/bearish conditions
⚠️ No cooldown between different pivots - multiple alerts per session allowed if different swing levels break
🔧 Technical Details
Timeframe Lock
Required: 1-minute chart only
Reason: Scoring model calibrated for 1m micro-structure
Future: Multi-timeframe support planned for v2
Timezone Configuration
Hard-coded: America/New_York
Session Detection: Uses TradingView's native session functions
Consistency: All time-based logic uses NY timezone
Swing Detection Parameters
Locked to specification:
ta.pivothigh(source, left=2, right=2)
ta.pivotlow(source, left=2, right=2)
Implications:
Pivots confirmed 2 bars after formation
No repainting - historical pivots don't move
4-bar minimum swing structure (2 left + pivot + 2 right)
VWAP Calculation
Type: Session-anchored (resets daily)
Source: Typical price (high + low + close) / 3
Weighting: Volume-weighted
Standard Deviation: True population standard deviation
CVD Proxy Formula
barDelta = close > open ? volume : close < open ? -volume : 0
CVD = cumulative sum of barDelta (session-reset)
Performance Limits
Max Labels: 500 (TradingView limit)
Max Bars Back: 500
Memory: Lightweight - uses only essential variables
💡 Best Practices
1. Use as a Filter, Not a Strategy
❌ Don't: Blindly take every signal
✅ Do: Use score as confluence for your existing analysis
2. Higher Grades = Better Probability
A Setups (60-74): Regular opportunities, still require discretion
A+ Setups (75-89): High-quality, multiple factors aligned
A++ Setups (90-100): Rare premium opportunities, strongest edge
3. Respect the VWAP Zone Filter
The indicator automatically blocks:
Longs in upper VWAP bands (counter-trend)
Shorts in lower VWAP bands (counter-trend)
Trust this logic - it enforces mean reversion discipline.
4. Monitor the Score Panel
Watch which components are scoring to understand why a setup formed:
Missing CVD score? → No order flow confirmation
Missing Time score? → Outside high-volume sessions
Low VWAP score? → Weak deviation from fair value
5. Combine with Risk Management
The indicator provides opportunity scoring, not position sizing:
Use stop losses based on swing structure
Scale position size with setup grade (larger on A++, smaller on A)
Set profit targets at VWAP or opposing band
6. Session Awareness
Prioritize signals during active sessions:
03:00-04:00 NY: Pre-market momentum
09:30-11:30 NY: Highest volume, tightest spreads
Off-hours signals (0 time score) are lower probability but still valid if other factors strong.
7. Understand the Hard Gate
If no structure shift occurs:
Total score = 0
No alerts fire
Other components irrelevant
Why? Structure shift confirms momentum change - without it, there's no tradable opportunity.
8. Avoid Over-Optimization
Default settings are well-calibrated:
Don't chase "perfect" parameters
Test changes on historical data before live use
Document any modifications
9. Leverage Alert De-Duplication
The indicator prevents spam automatically:
One alert per unique swing break
New swing levels = new alerts
No need to manually filter notifications
10. Supplement with Price Action
Use the indicator alongside:
Support/resistance levels
Order flow footprint charts
Volume profile
Market internals (breadth, TICK, etc.)
📚 Example Scenarios
Example 1: A++ Premium Setup (Score: 95)
Price: In lower 3rd VWAP band (-2.8σ) → VWAP: 25 pts
Structure: Close breaks swing high → Structure: 25 pts
CVD: Price LL + CVD HL (bullish div) → CVD: 25 pts
Time: 10:15 AM NY (market open) → Time: 25 pts
Direction: LONG (price below VWAP) → Valid
Grade: A++ (95/100)
Interpretation: All factors aligned - premium mean-reversion long opportunity.
Example 2: A+ Strong Setup (Score: 80)
Price: In upper 2nd VWAP band (+1.5σ) → VWAP: 15 pts
Structure: Close breaks swing low → Structure: 25 pts
CVD: Price HH + CVD LH (bearish div) → CVD: 25 pts
Time: 2:00 PM NY (off-hours) → Time: 0 pts
Direction: SHORT (price above VWAP) → Valid
Grade: A+ (65/100)
Interpretation: Strong setup despite off-hours, bearish divergence adds confidence.
Example 3: Filtered Setup (Score: 0)
Price: In upper 3rd VWAP band (+2.5σ) → VWAP: 25 pts (if allowed)
Structure: Close breaks swing high → Structure: BLOCKED
CVD: Price HH + CVD HH (confirmation) → CVD: 20 pts (if allowed)
Time: 10:00 AM NY → Time: 25 pts (if allowed)
Direction: LONG (price ABOVE VWAP) → ❌ INVALID ZONE
Grade: None (0/100) - NO ALERT
Interpretation: VWAP filter blocked long signal in upper band - prevents counter-trend trade.
🛠️ Troubleshooting
No Signals Appearing
✅ Verify you're on 1-minute chart
✅ Check Tick Size matches your symbol
✅ Ensure VWAP Bands are visible
✅ Wait for confirmed pivots (requires at least 5 bars of history)
Alerts Not Firing
✅ Confirm alert is set to "Once Per Bar Close"
✅ Check score threshold (must be ≥60 by default)
✅ Verify VWAP zone filter isn't blocking signals
✅ Check that structure shift is actually occurring
Score Always Zero
✅ No structure shift detected (hard gate active)
✅ Price may not be in valid VWAP zone (2nd or 3rd band)
✅ Insufficient swing history (wait for pivots to form)
Too Many/Too Few Signals
Too many signals:
Increase A Setup Threshold (e.g., 70 instead of 60)
Increase Tick Buffer Count (reduces false breaks)
Too few signals:
Decrease A Setup Threshold (e.g., 50 instead of 60)
Decrease Tick Buffer Count (more sensitive to breaks)
📜 License
This indicator is provided under the Mozilla Public License 2.0.
🤝 Credits
Developed as a professional trading tool for systematic opportunity identification.
Philosophy: Reduce noise. Enforce discipline. Keep the human in control.
📞 Support
For questions, issues, or feature requests, please consult:
This README documentation
The specification document (pinescript_market_state_engine_spec.docx)
Inline code comments in market_state_engine.pine
🔄 Version History
v1.0 (Current)
Initial release
4-component scoring model (VWAP + Structure + CVD + Time)
VWAP zone directional filtering
Alert de-duplication
Configurable inputs
Real-time score panel
Session-aware logic
🎓 Understanding the Numbers
Quick Reference Card
Score Range Grade Quality Typical Use
90-100 A++ Premium Highest conviction trades
75-89 A+ High Strong probability setups
60-74 A Good Acceptable with discretion
0-59 None Filtered Skip or wait for confluence
Component Contribution Examples
Minimum A Setup (60 points):
Structure (25) + VWAP 3rd band (25) + Time (25) = 75 ✅
Typical A+ Setup (75 points):
Structure (25) + VWAP 2nd band (15) + CVD confirm (20) + Time (25) = 85 ✅
Maximum A++ Setup (100 points):
Structure (25) + VWAP 3rd band (25) + CVD divergence (25) + Time (25) = 100 ✅
🎯 Final Reminder
This is NOT a trading bot.
This is NOT financial advice.
This is a decision-support tool.
Always:
✅ Use proper risk management
✅ Understand the logic before trading
✅ Backtest on your symbols
✅ Keep the human in control
Happy Trading! 📈

Power Hour Money StrategyDescription of the Pine Script Code: "Power Hour Money Strategy"
This Pine Script strategy, "Power Hour Money Strategy," is designed to trade based on the alignment of multiple time frames (month, week, day, and hour). The strategy aims to enter long or short positions depending on whether all selected time frames are in sync (all green for long positions, all red for short positions). Additionally, the script includes configurations for trading during specific sessions and automatically closing positions at the end of the trading day.
Core Features:
1. Time Frame Sync Check:
- The strategy evaluates whether the current price is higher than the opening price for the month, week, day, and hour to determine if each time frame is "green" (bullish) or "red" (bearish).
2. Session Control:
- The user can select between different trading sessions:
- "NY Session 9:30-11:30"
- "Extended NY Session 8-4"
- "All Sessions"
- Trades are only executed if the current time falls within the selected session.
3. Trailing Stop Mechanism:
- The strategy includes an optional trailing stop mechanism for both long and short positions.
- The trailing stop is configured with a percentage loss from the current price to protect gains.
4. End-of-Day Position Management:
- An option is provided to automatically close all positions at the end of the trading day (5:45 PM Eastern Time).
Detailed Code Breakdown:
1. Input Settings:
- **Session Selection**: Allows the user to choose the trading session.
- **End-of-Day Close**: Option to automatically close positions at the end of the day.
- **Trailing Stop Loss**: Enables or disables the trailing stop loss feature and sets the percentage for long and short positions.
2. Time Frame Calculations:
- The script uses `request.security` to get the opening prices for higher time frames (monthly, weekly, daily, and hourly).
- It compares the current close price to these opening prices to determine if each time frame is green or red.
3. Session Time Definitions:
- Defines the start and end times for the NY session (9:30-11:30 AM) and the extended session (8:00 AM - 4:00 PM).
4. Trade Execution:
- The strategy checks if all selected time frames are in sync and if the current time falls within the trading session.
- If all conditions are met, it enters a long or short position.
5. Trailing Stop Loss Implementation:
- Adjusts the stop price based on the trailing percentage and the current position's size.
- Automatically exits positions if the trailing stop condition is met.
6. End-of-Day Close Implementation:
- Uses a timestamp to check if the current time is 5:45 PM Eastern Time.
- Closes all positions if the end-of-day condition is met.
7. Plotting and Logging:
- Plots indicators to visualize the green/red status of each time frame.
- Logs information about the status of each time frame for debugging and analysis.
Example Usage:
Entering a Long Position: If the month, week, day, and hour are all green and the current time is within the selected session, a long position is entered.
Entering a Short Position: If the month, week, day, and hour are all red and the current time is within the selected session, a short position is entered.
Trailing Stop: Protects gains by exiting the position if the price moves against the set trailing stop percentage.
End-of-Day Close: Automatically closes all open positions at 5:45 PM Eastern Time if enabled.
This strategy is particularly useful for traders who want to ensure that multiple time frames are in alignment before entering a trade and who wish to manage positions effectively throughout the trading day with specific session controls and trailing stops.

Scalping The BullNome: Scalping The Bull (Indicatore)
Categoria: Scalping, Trend Following, Mean Reversion.
Timeframe: 1M, 5M, 30M, 1D, secondo la conformazione specifica.
(follow description in english)
Analisi tecnica: l’indicatore supporta le operatività descritte nei video di YouTube del canale “Scalping The Bull”. Di norma si basa su price action e medie mobili esponenziali.
Le varie tecniche che possono essere usate insieme all’indicatore sono sintetizzate nei settaggi dell’indicatore e si può fare riferimento ai video specifici per la spiegazione completa.
Utilizzo consigliato: Altcoin che presentano forti trend per scalping e operazioni intra-day.
Configurazione: È possibile configurare lo strumento in maniera semplice e completa.
Medie:
Medie per mercato: e’ possibile utilizzare le medie mobili esponenziali (EMA) esclusivamente per il mercato Crypto (5/10/60/223).
Media addizionale: e’ possibile visualizzare una media aggiuntiva, e.g. a 20 periodi.
Elementi del grafico:
Sfondo: segnala con lo sfondo del grafico in verde una situazione di uptrend ( EMA 60 > EMA 223) e in rosso sfondo rosso una situazione di downtrend (EMA 60 < EMA 223).
Separatori di sessioni: indica l’inizio della sessione corrente.
Punti Trigger:
Massimi e minimi di oggi: disegna sul grafico il prezzo di apertura della candela daily e i massimi e i minimi di giornata.
Massimi minimi di ieri: disegna sul grafico il prezzo di apertura della candela daily, i massimi e i minimi del giorno prima.
(English description)
Name: Scalping The Bull (Indicator)
Category: Scalping, Trend Following, Mean Reversion.
Timeframe: 1M, 5M, 30M, 1D depending on the specific signal.
Technical Analysis: The indicator supports the operations described in the YouTube videos of the channel "Scalping The Bull". Usually it is based on price action and exponential moving averages.
The various techniques that can be used in conjunction with the indicator are summarized in the indicator settings and you can refer to the specific videos for the full explanation.
Suggested usage: Altcoin showing strong trends for scalping and intra-day trades.
Configuration:
Exponential Moving Averages
Per market: you can display averages exclusively for the Crypto market (5/10/60/223).
Additional Average: You can display an additional average, e.g. 20-period average.
Chart elements:
Session Separators: indicates the beginning of the current session.
Background: signals with the background in green an uptrend situation ( 60 > 223) and in red background a downtrend situation (60 < 223).
Trigger points:
Today's highs and lows: draw on the chart the opening price of the daily candle and the highs and lows of the day.
Yesterday's highs and lows: draw on the chart the opening price of the daily candle, the highs and lows of the previous day.

Advanced Market TheoryADVANCED MARKET THEORY (AMT)
This is not an indicator. It is a lens through which to see the true nature of the market.
Welcome to the definitive application of Auction Market Theory. What you have before you is the culmination of decades of market theory, fused with state-of-the-art data analysis and visual engineering. It is an institutional-grade intelligence engine designed for the serious trader who seeks to move beyond simplistic indicators and understand the fundamental forces that drive price.
This guide is your complete reference. Read it. Study it. Internalize it. The market is a complex story, and this tool is the language with which to read it.
PART I: THE GRAND THEORY - A UNIVERSE IN AN AUCTION
To understand the market, you must first understand its purpose. The market is a mechanism of discovery, organized by a continuous, two-way auction.
This foundational concept was pioneered by the legendary trader J. Peter Steidlmayer at the Chicago Board of Trade in the 1980s. He observed that beneath the chaotic facade of ticking prices lies a beautifully organized structure. The market's primary function is not to go up or down, but to facilitate trade by seeking a price level that encourages the maximum amount of interaction between buyers and sellers. This price is "value."
The Organizing Principle: The Normal Distribution
Over any given period, the market's activity will naturally form a bell curve (a normal distribution) turned on its side. This is the blueprint of the auction.
The Point of Control (POC): This is the peak of the bell curve—the single price level where the most trade occurred. It represents the point of maximum consensus, the "fairest price" as determined by the market participants. It is the gravitational center of the session.
The Value Area (VA): This is the heart of the bell curve, typically containing 70% of the session's activity (one standard deviation). This is the zone of "accepted value." Prices within this area are considered fair and are where the market is most comfortable conducting business.
The Extremes: The thin areas at the top and bottom of the curve are the "unfair" prices. These are levels where one side of the auction (buyers at the top, sellers at the bottom) was shut off, and trade was quickly rejected. These are areas of emotional trading and excess.
The Narrative of the Day: Balance vs. Imbalance
Every trading session is a story of the market's search for value.
Balance: When the market rotates and builds a symmetrical, bell-shaped profile, it is in a state of balance . Buyers and sellers are in agreement, and the market is range-bound.
Imbalance: When the market moves decisively away from a balanced area, it is in a state of imbalance . This is a trend. The market is actively seeking new information and a new area of value because the old one was rejected.
Your Purpose as a Trader
Your job is to read this story in real-time. Are we in balance or imbalance? Is the auction succeeding or failing at these new prices? The Advanced Market Theory engine is your Rosetta Stone to translate this complex narrative into actionable intelligence.
PART II: THE AMT ENGINE - AN EVOLUTION IN MARKET VISION
A standard market profile tool shows you a picture. The AMT Engine gives you the architect's full schematics, the engineer's stress tests, and the psychologist's behavioral analysis, all at once.
This is what makes it the Advanced Market Theory. We have fused the timeless principles with layers of modern intelligence:
TRINITY ANALYSIS: You can view the market through three distinct lenses. A Volume Profile shows where the money traded. A TPO (Time) Profile shows where the market spent its time. The revolutionary Hybrid Profile fuses both, giving you a complete picture of market conviction—marrying volume with duration.
AUTOMATED STRUCTURAL DECODING: The engine acts as your automated analyst, identifying critical structural phenomena in real-time:
Poor Highs/Lows: Weak auction points that signal a high probability of reversal.
Single Prints & Ledges: Footprints of rapid, aggressive market moves and areas of strong institutional acceptance.
Day Type Classification: The engine analyzes the session's personality as it develops ("Trend Day," "Normal Day," etc.), allowing you to adapt your strategy to the market's current character.
MACRO & MICRO FUSION: Via the Composite Profile , the engine merges weeks of data to reveal the major institutional battlegrounds that govern long-term price action. You can see the daily skirmish and the multi-month war on a single chart.
ORDER FLOW INTELLIGENCE: The ultimate advancement is the integrated Cumulative Volume Delta (CVD) engine. This moves beyond structure to analyze the raw aggression of buyers versus sellers. It is your window into the market's soul, automatically detecting critical Divergences that often precede major trend shifts.
ADAPTIVE SIGNALING: The engine's signal generation is not static; it is a thinking system. It evaluates setups based on a multi-factor Confluence Score , understands the market Regime (e.g., High Volatility), and adjusts its own confidence ( Probability % ) based on the complete context.
This is not a tool that gives you signals. This is a tool that gives you understanding .
PART III: THE VISUAL KEY - A LEXICON OF MARKET STRUCTURE
Every element on your chart is a piece of information. This is your guide to reading it fluently.
--- THE CORE ARCHITECTURE ---
The Profile Histogram: The primary visual on the left of each session. Its shape is the story. A thin profile is a trend; a fat, symmetrical profile is balance.
Blue Box : The zone of accepted, "fair" value. The heart of the session's business.
Bright Orange Line & Label : The Point of Control. The gravitational center. The price of maximum consensus. The most significant intraday level.
Dashed Blue Lines & Labels : The boundaries of value. Critical inflection points where the market decides to either remain in balance or seek value elsewhere.
Dashed Cyan Lines & Labels : The major, long-term structural levels derived from weeks of data. These are institutional reference points and carry immense weight. Treat them as primary support and resistance.
Dashed Orange Lines & Labels : Marks a Poor or Unfinished Auction . These represent emotional, weak extremes and are high-probability targets for future price action.
Diamond Markers : Mark Single Prints , which are footprints of aggressive, one-sided moves that left a "liquidity vacuum." Price is often drawn back to these levels to "repair" the poor structure.
Arrow Markers : Mark Ledges , which are areas of strong horizontal acceptance. They often act as powerful support/resistance in the future.
Dotted Gray Lines & Labels : The projected daily range based on multiples of the Initial Balance . Use them to set realistic profit targets and gauge the day's potential.
--- THE SIGNAL SUITE ---
Colored Triangles : These are your high-probability entry signals. The color is a strategic playbook:
Gold Triangle : ELITE Signal. An A+ setup with overwhelming confluence. This is the highest quality signal the engine can produce.
Yellow Triangle : FADE Signal. A counter-trend setup against an exhausted move at a structural extreme.
Cyan Triangle : BREAKOUT Signal. A momentum setup attempting to capitalize on a breakout from the value area.
Purple Triangle : ROTATION Signal. A mean-reversion setup within the value area, typically from one edge towards the POC.
Magenta Triangle : LIQUIDITY Signal. A sophisticated setup that identifies a "stop run" or liquidity sweep.
Percentage Number: The engine's calculated probability of success . This is not a guarantee, but a data-driven confidence score.
Dotted Gray Line: The signal's Entry Price .
Dashed Green Lines: The calculated Take Profit Targets .
Dashed Red Line: The calculated Stop Loss level.
PART IV: THE DASHBOARD - YOUR STRATEGIC COMMAND CENTER
The dashboard is your real-time intelligence briefing. It synthesizes all the engine's analysis into a clear, concise, and constantly updating summary.
--- CURRENT SESSION ---
POC, VAH, VAL: The live values for the core structure.
Profile Shape: Is the current auction top-heavy ( b-shaped ), bottom-heavy ( P-shaped ), or balanced ( D-shaped )?
VA Width: Is the value area expanding (trending) or contracting (balancing)?
Day Type: The engine's judgment on the day's personality. Use this to select the right strategy.
IB Range & POC Trend: Key metrics for understanding the opening sentiment and its evolution.
--- CVD ANALYSIS ---
Session CVD: The raw order flow. Is there more net buying or selling pressure in this session?
CVD Trend & DIVERGENCE: This is your order flow intelligence. Is the order flow confirming the price action? If "DIVERGENCE" flashes, it is a critical, high-alert warning of a potential reversal.
--- MARKET METRICS ---
Volume, ATR, RSI: Your standard contextual metrics, providing a quick read on activity, volatility, and momentum.
Regime: The engine's assessment of the broad market environment: High Volatility (favor breakouts), Low Volatility (favor mean reversion), or Normal .
--- PROFILE STATS, COMPOSITE, & STRUCTURE ---
These sections give you a quick quantitative summary of the profile structure, the major long-term Composite levels, and any active Poor Structures.
--- SIGNAL TYPES & ACTIVE SIGNAL ---
A permanent key to the signal colors and their meanings, along with the full details of the most recent active signal: its Type , Probability , Entry , Stop , and Target .
PART V: THE INPUTS MENU - CALIBRATING YOUR LENS
This engine is designed to be calibrated to your specific needs as a trader. Every input is a lever. This is not a "one size fits all" tool. The extensive tooltips are your built-in user manual, but here are the key areas of focus:
--- MARKET PROFILE ENGINE ---
Profile Mode: This is the most fundamental choice. Volume is the standard for price-based support and resistance. TPO is for analyzing time-based acceptance. Hybrid is the professional's choice, fusing both for a complete picture.
Profile Resolution: This is your zoom lens. Lower values for scalping and intraday precision. Higher values for a cleaner, big-picture view suitable for swing trading.
Composite Sessions: Your timeframe for macro analysis. 5-10 sessions for a weekly view; 20-30 sessions for a monthly, structural view.
--- SESSION & VALUE AREA ---
These settings must be configured correctly for your specific asset. The Session times are critical. The Initial Balance should reflect the key opening period for your market (60 minutes is standard for equities).
--- SIGNAL ENGINE & RISK MANAGEMENT ---
Signal Mode: THIS IS YOUR PERSONAL RISK PROFILE. Set it to Conservative to see only the absolute best A+ setups. Use Elite or Balanced for a standard approach. Use Aggressive only if you are an experienced scalper comfortable with managing more frequent, lower-probability setups.
ATR Multipliers: This suite gives you full, dynamic control over your risk/reward parameters. You can precisely define your initial stop loss distance and profit targets based on the market's current volatility.
A FINAL WORD FROM THE ARCHITECT
The creation of this engine was a journey into the very heart of market dynamics. It was born from a frustrating truth: that the most profound market theories were often confined to books and expensive institutional platforms, inaccessible to the modern retail trader. The goal was to bridge that gap.
The challenge was monumental. Making each discrete system—the volume profile, the TPO counter, the composite engine, the CVD tracker, the signal generator, the dynamic dashboard—work was a task in itself. But the true struggle, the frustrating, painstaking process that consumed countless hours, was making them work in unison . It was about ensuring the CVD analysis could intelligently inform the signal engine, that the day type classification could adjust the probability scores, and that the composite levels could provide context to the intraday structure, all in a seamless, real-time dance of data.
This engine is the result of that relentless pursuit of integration. It is built on the belief that a trader's greatest asset is not a signal, but clarity . It was designed to clear the noise, to organize the chaos, and to present the elegant, underlying logic of the market auction so that you can make better, more informed, and more confident decisions.
It is now in your hands. Use it not as a crutch, but as a lens. See the market for what it truly is.
"The market can remain irrational longer than you can remain solvent."
- John Maynard Keynes
DISCLAIMER
This script is an advanced analytical tool provided for informational and educational purposes only. It is not financial advice. All trading involves substantial risk, and past performance is not indicative of future results. The signals, probabilities, and metrics generated by this indicator do not constitute a recommendation to buy or sell any financial instrument. You, the user, are solely responsible for all trading decisions, risk management, and outcomes. Use this tool to supplement your own analysis and trading strategy.
PUBLISHING CATEGORIES
Volume Profile
Market Profile
Order Flow

Blue Ocean BOATS 24/5 US Market DataThis script utilizes Blue Ocean's ATS (Alternative Trading System) and U.S. exchange market data to create a continuous candlestick chart. The continuous data has the option to be used as an indicator or strategy source.
Requirements
The main chart symbol (which can be unrelated to the user-input Ticker Symbol) needs to be a 24/7 chart. An example symbol is CRYPTO:BTCUSD. CME_MINI:ES1! and FX:SPX500 work too, but are not truly 24/5 and will miss ~4 hours of the total trading week from the extended U.S. session.
The main chart's timeframe needs to be intraday. Because the script's output is currently inconsistent on daily or higher timeframes, it will disable itself.
The Ticker Symbol chosen should be a ticker that is traded on U.S. exchanges. This will provide both U.S. extended session data and a BOATS equivalent.
Usage & configuration
This script visualizes the 24-hour Monday-Friday chart of a U.S. exchange ticker. Going a step further, it can be used to compare the performance indices or cryptocurrencies to stock constituents of indices, cryptocurrency treasury stocks or holding ETFs.
The script's output, candlesticks, can be overlaid on the main chart or used as is. A "Price Source" plot is used for indicators or strategies.
Ticker Symbol: The U.S. ticker you'd like to view extended session and Blue Ocean ATS session data for.
Price Source: Price source that can be used for indicators or strategies.
Highlight Sessions: Highlight the different trading sessions.
Last Price Line: Show a horizontal line at the last traded price.
Ticker Symbol Check: Plots a label that will display only if the selected Ticker Symbol is not detected as a U.S. exchange traded ticker.
Earnings Label: Creates a label at the time of past earnings of the chosen Ticker Symbol. The time that the earnings are plotted is approximate. Because of this, the label is meant as an explanation for price action.
What this script does and how it works
It creates OHLC candlesticks by merging Blue Ocean's ATS market data and U.S. exchange data. From the OHLC data of both, a single output can be used for indicators or strategies.
References and further information
www.tradingview.com
The Blue Ocean ATS allows trading from 20:00 to 4:00 Eastern Time, Sunday through Thursday. This critical timeframe bridges the eight-hour overnight gap when major U.S. exchanges are closed.
blueocean-tech.io
Blue Ocean ATS, LLC is a US broker dealer which operates the alternative trading system BOATS. Our trading platform offers electronic access, price discovery, compliant regulatory reporting requirements, and standard clearing and settlement processes.
www.nyse.com
Hours mentioned are in Eastern Time.
Overnight trading remains far less active than extended hours trading. The hour with the highest overnight volume is 9:00PM, which averages 2.94 million shares per day and coincides with several Asian market opens. This volume is a fraction of the last hour of extended hours trading, which averages 43.22 million shares. The first hour of pre-core reported volume averages 113.30 million shares per day.
Overnight executions, in addition to the peak in the 9:00PM hour, also exhibits a smaller peak at 3:00AM, of 2.35 million shares. This coincides with several Asian bourses’ end of their regular trading day.
Example of using the script in the main chart window and the difference in how RSI may be calculated.
Note: ATS is not the name of the 20:00 to 4:00 ET session itself, and the term refers to a broader definition of trading systems that include dark pools, which can be different.
24/5 Monday-Friday really means NY time Sunday night to Friday afternoon.

Luxy VWAP Magic - MTF Projection EngineThis indicator transforms the classic VWAP into a comprehensive trading system. Instead of switching between multiple indicators, you get everything in one place: multi-timeframe analysis, statistical bands, momentum detection, volume profiling, session tracking, and divergence signals.
What Makes This Different
Traditional VWAP indicators show a single line. This tool treats VWAP as a foundation for complete market analysis. The indicator automatically detects your asset type (stocks, crypto, forex, futures) and adjusts its behavior accordingly. Crypto traders get 24/7 session tracking. Stock traders get proper market hours handling. Everyone gets institutional-grade analytics.
Anchor Period Options
The anchor period determines when VWAP resets and recalculates. You have three categories of options:
Time-Based Anchors:
Session - Resets at market open. Best for intraday stock trading where you want fresh VWAP each day.
Day - Resets at midnight UTC. Standard option for most traders.
Week / Month / Quarter / Year - Longer reset periods for swing traders and position traders who want broader context.
Rolling Window Anchors:
Rolling 5D - A sliding 5-day window that never resets. Solves the Monday problem where weekly VWAP equals daily VWAP on first day of week.
Rolling 21D - Approximately one month of trading data in continuous calculation. Excellent for crypto and forex markets that trade 24/7 without clear session breaks.
Event-Based Anchors:
Dividends - Resets on ex-dividend dates. Track institutional cost basis from dividend events.
Splits - Resets on stock split dates. Useful for analyzing post-split trading behavior.
Earnings - Resets on earnings report dates. See where volume-weighted trading occurred since last quarterly report.
Standard Deviation Bands
Three sets of bands surround the main VWAP line:
Band 1 (Aqua) - Plus and minus one standard deviation. Approximately 68% of price action occurs within this range under normal distribution. Touches suggest minor extension.
Band 2 (Fuchsia) - Plus and minus two standard deviations. Only 5% of trading should occur outside this range statistically. Touches here indicate significant overextension and high probability of mean reversion.
Band 3 (Purple) - Plus and minus three standard deviations. Touches are rare (0.3% probability) and represent extreme conditions. Often marks climax moves or panic selling/buying.
Each band can be toggled independently. Most traders show Band 1 by default and add Band 2 and 3 for specific setups or volatile instruments.
Multi-Timeframe VWAP System
The MTF section plots previous period VWAPs as horizontal support and resistance levels:
Daily VWAP - Previous day's final VWAP value. Key intraday reference level.
Weekly VWAP - Previous week's final VWAP. Important for swing traders.
Monthly VWAP - Previous month's final VWAP. Institutional benchmark level.
Quarterly VWAP - Previous quarter's final VWAP. Major support/resistance for position traders.
Previous Day VWAP - Yesterday's closing VWAP specifically, separate from current daily calculation.
The Confluence Zone percentage setting determines how close multiple VWAPs must be to trigger a confluence alert. When two or more timeframe VWAPs converge within this threshold, you get a high-probability support/resistance zone.
Session VWAPs for Global Markets
For forex, crypto, and futures traders who operate in 24/7 markets, the indicator tracks three major global sessions:
Asia Session - UTC 21:00 to 08:00. Gold colored line. Typically lower volatility, range-bound action that sets overnight levels.
London Session - UTC 08:00 to 17:00. Orange colored line. Often determines daily direction with high volume European participation.
New York Session - UTC 13:00 to 22:00. Blue colored line. Highest volume session globally. Sharp directional moves common.
Previous session VWAP values display as horizontal lines when each session closes, acting as intraday support and resistance. The table shows which sessions are currently active with checkmarks.
On-Chart Labels and Signals
The indicator plots several types of labels directly on price action when significant events occur:
Volume Spike Labels
Fire when current bar volume exceeds configurable thresholds relative to both the previous bar and the 20-bar average. Default settings require 300% of previous bar AND 200% of average volume. Green labels indicate bullish candles. Red labels indicate bearish candles. These spikes often mark institutional entry points.
Momentum Shift Labels
Appear when VWAP acceleration changes direction. The Slowing label warns when an active trend loses steam, often preceding reversal. The Accelerating label confirms trend continuation or potential bottom during downtrends. Filters available to show only reversal signals in existing trends.
VWAP Squeeze Labels
Detect when standard deviation bands contract relative to ATR (Average True Range). Low volatility compression often precedes explosive breakout moves. When the squeeze fires (releases), a label appears with directional prediction based on VWAP slope.
Divergence Labels
Mark price/volume divergences using CVD (Cumulative Volume Delta) analysis:
Bullish divergence: Price makes lower low, but CVD makes higher low. Hidden accumulation despite price weakness.
Bearish divergence: Price makes higher high, but CVD makes lower high. Hidden distribution despite price strength.
Dynamic VWAP Coloring
The main VWAP line changes color based on its slope direction:
Green - VWAP is rising. Institutional buying pressure. Volume-weighted price increasing.
Red - VWAP is falling. Institutional selling pressure. Volume-weighted price decreasing.
Gray - VWAP is flat. Consolidation or balance between buyers and sellers.
This coloring can be disabled for a static blue line if you prefer cleaner visuals. The VWAP label next to the line shows the current trend direction and delta percentage.
Calculated Projection Cone
One of the most powerful features is the Calculated Projection Cone. Unlike traditional extrapolation methods that simply extend a trend line forward, this system analyzes what actually happened in similar market conditions throughout the chart's history.
How It Works:
The system classifies each bar into one of 27 unique market states:
Z-Score Level - LOW (oversold), MID (fair value), or HIGH (overbought) based on configurable thresholds
Trend Direction - DOWN, FLAT, or UP based on VWAP slope
Volume Profile - LOW (below 80%), NORMAL (80-150%), or HIGH (above 150%) relative volume
When you look at the current bar, the indicator:
1. Identifies the current market state (e.g., LOW Z-Score + UP Trend + HIGH Volume)
2. Searches through all historical bars on the chart that had the same state
3. Calculates what happened in those bars X bars later (where X is your projection horizon)
4. Shows you the probability of up/down and the average move size
Visual Elements:
Probability Cone - Colored green (bullish probability above 55%), red (bearish below 45%), or gold (neutral). The cone width represents the historical range of outcomes (roughly the 20th to 80th percentile).
Center Line - Shows the average expected price based on historical outcomes in similar conditions.
Probability Label - Displays direction probability and average move. Example: "67% UP (+0.8%)" means 67% of similar past cases moved up, averaging 0.8% gain.
Fallback System:
When the exact 27-state match has insufficient historical data:
First fallback: Uses Z-Score plus Trend only (9 broader states, ignoring volume)
Second fallback: Uses Z-Score only (3 states)
When fallback is active, confidence automatically adjusts
Settings:
Projection Horizon - How many bars forward to analyze outcomes (5, 10, 15, or 20 bars, default 10)
Lookback Period - Historical data window in days (30-252, default 60)
Minimum Samples - Cases needed before using fallback (5-30, default 10)
Z-Score Threshold - Bucket boundary for LOW/MID/HIGH classification (1.0, 1.5, or 2.0 sigma)
Cloud Transparency - Adjust visibility (50-95%)
Colors - Customize bullish, bearish, and neutral cone colors
Confidence Levels:
HIGH - 30 or more similar historical cases found
MEDIUM - 15-29 similar cases
LOW - Fewer than 15 cases (more uncertainty)
IMPORTANT DISCLAIMER:
The Calculated Projection is based on past patterns only. It is NOT a price prediction or financial advice. Similar market states in the past do not guarantee similar outcomes in the future. The probability shown is historical frequency, not a guarantee. Always combine with other analysis and never rely solely on projections for trading decisions.
Alert Conditions
The indicator includes over 20 pre-built alert conditions:
Price vs VWAP:
Price crosses above VWAP
Price crosses below VWAP
Band Touches:
Price touches plus or minus one sigma band
Price touches plus or minus two sigma band (extreme)
Price touches plus or minus three sigma band (very extreme)
Z-Score Extremes:
Z-Score crosses above plus two (overbought extreme)
Z-Score crosses below minus two (oversold extreme)
Momentum and Trend:
Momentum slowing
Momentum accelerating
Trend turns bullish/bearish/neutral
Volume:
Volume spike detected
CVD Direction:
Buyers take control
Sellers take control
High Probability Signals:
Bullish reversal signal (oversold plus accelerating momentum)
Bearish reversal signal (overbought plus slowing momentum)
MTF and Special:
MTF confluence zone entry
VWAP squeeze fired
Bullish/Bearish divergence detected
Any significant signal (catch-all)
All signals use confirmed bar data to prevent false alerts from incomplete candles.
Settings Overview
Settings are organized into logical groups:
VWAP Settings
Anchor Period selection
Show/Hide VWAP line
Dynamic coloring toggle
VWAP label visibility
Bands Visibility
Toggle each of three bands independently
Info Table
Show/Hide table
Table position (9 options)
Text size
Volume spike label settings with adjustable thresholds
Momentum label settings with filters
Signal labels limited to 5 most recent (auto-managed)
Probability engine lookback period
Multi-Timeframe VWAP
Enable/Disable MTF system
Show MTF in table
Show MTF lines on chart
Individual timeframe toggles
Confluence zone threshold
Squeeze detection toggle
Session VWAPs
Enable/Disable session tracking
Apply to all assets option
Show session labels
Divergence Detection
Enable/Disable divergence
Pivot lookback period
Show divergence labels
Calculated Projection
Enable/Disable projection cone
Projection horizon (5, 10, 15, or 20 bars)
Lookback period in days (30-252)
Minimum samples threshold
Z-Score classification threshold (1.0, 1.5, or 2.0 sigma)
Cloud transparency adjustment
Bullish, bearish, and neutral colors
The Info Table - Your Trading Dashboard
The right side of your chart displays a compact table with up to twelve metrics.
Row-by-Row Breakdown:
Asset and Period - Shows what the indicator detected (US Stock, Crypto, Forex, etc.) and your selected anchor period. The detection happens automatically based on exchange data, so VWAP resets and calculations match your actual trading instrument.
Delta Percentage - How far current price sits from VWAP, expressed as a percentage. Positive means price trades above fair value. Negative means below. Large delta values (beyond 1-2%) often precede mean reversion moves. Day traders watch this for overextension.
Z-Score - Statistical deviation from VWAP measured in standard deviations. Unlike raw delta, Z-Score accounts for volatility. A 2% move in a volatile biotech stock differs from 2% in a stable utility. Z-Score normalizes this. Values beyond plus or minus two sigma occur only 5% of the time statistically.
Trend Direction - Whether VWAP itself is rising, falling, or flat. Rising VWAP means the volume-weighted average price is increasing, which indicates institutional accumulation. Falling VWAP suggests distribution. This differs from price trend since it weights by volume.
Momentum State - Is the trend accelerating or slowing down? This measures the rate of change in VWAP slope. When an uptrend shows slowing momentum, it often precedes reversal. Accelerating momentum in a downtrend can signal capitulation and potential bottom.
Relative Volume - Current bar volume compared to the 20-bar average, shown as percentage. Values above 150% indicate above-average activity. Spikes above 200-300% often mark institutional involvement. Low volume (below 80%) warns of potential fake moves.
MTF Bias - Four checkmarks or X marks showing whether price sits above or below Daily, Weekly, Monthly, and Quarterly VWAP. Four checkmarks means strong bullish alignment across all timeframes. Four X marks indicates bearish alignment. Mixed readings suggest consolidation or transition.
Band Probabilities - Historical statistics showing how often price touched each standard deviation band over your lookback period. This helps you understand if mean reversion or trend following works better for your specific instrument.
Session Status - Which global trading sessions are currently active (Asia, London, New York). Shows checkmarks for active sessions. Important for forex and crypto traders who need to know when major liquidity windows open and close.
Divergence State - Whether the indicator detects bullish or bearish divergence between price and cumulative volume delta. Bullish divergence occurs when price makes lower lows but buying pressure (CVD) makes higher lows, suggesting hidden accumulation.
Confidence Score - A weighted composite of all factors displayed as a progress bar and percentage. Combines MTF alignment, Z-Score, trend direction, volume delta, momentum, and relative volume into a single 0-100 score. Higher scores indicate stronger conviction setups.
Calculated Projection - When the Projection Cone is enabled, shows the historical probability of price direction and expected move. For example: "▲ 67% (+0.8%)" means in similar market states historically, price moved up 67% of the time with an average gain of 0.8%. The system analyzes 27 unique market states based on Z-Score, Trend, and Volume conditions.
Recommended Use Cases
Day Trading Stocks:
Use Session anchor with Band 1 visible. Watch for price returning to VWAP after morning move. Volume spikes near VWAP often mark institutional accumulation zones.
Swing Trading:
Use Weekly or Rolling 21D anchor. Enable MTF lines for Daily and Weekly levels. Trade pullbacks to these levels in direction of MTF bias.
Crypto and Forex:
Enable Session VWAPs. Use Rolling anchors to avoid artificial resets. Monitor session transitions for breakout opportunities.
Mean Reversion:
Focus on Z-Score reaching plus or minus two. Add Band 2 visibility. Combine with slowing momentum for highest probability reversals.
Trend Following:
Watch MTF bias alignment. Four checkmarks plus accelerating momentum plus high volume confirms trend continuation setups.
Projection Planning:
Enable the Calculated Projection to see what happened historically in similar market conditions. Use 5-10 bars for intraday setups, 15-20 bars for swing trade planning. Focus on high probability readings (above 60%) with HIGH confidence (30 or more samples). The cone shows the probable range of outcomes based on actual historical data. Combine with other factors like MTF alignment and volume for higher conviction setups.
Important Notes
The indicator does not repaint. MTF values use previous period's confirmed data.
Rolling VWAP works best on 15-minute timeframes and above due to bar lookback requirements.
Session VWAPs apply to global markets by default (forex, crypto, futures). Enable the all-assets option for stocks if desired.
Volume data for forex represents tick volume, not actual traded volume.
All alert conditions fire only on confirmed (closed) bars to prevent false signals.
The Calculated Projection updates each bar as market state changes. This is expected behavior. The projection shows probabilities based on similar past conditions, not a fixed prediction.
Q AND A
Q: Does this indicator repaint?
A: No. The main VWAP calculation uses standard TradingView VWAP methodology. Multi-timeframe values use previous period's confirmed data with appropriate lookahead settings. All alert signals require bar confirmation.
Q: Why does my Rolling VWAP look different on 1-minute versus 15-minute charts?
A: Rolling VWAP calculates across a fixed number of trading days. On very short timeframes, the bar lookback may hit TradingView limits. For best Rolling VWAP accuracy, use 15-minute or higher timeframes.
Q: Can I use this on any instrument?
A: Yes. The indicator automatically detects asset type and adjusts behavior. Stocks use standard market hours. Crypto uses 24/7 calculations. Forex uses tick volume. Everything adapts automatically.
Q: What does the Confidence Score actually measure?
A: The score combines six weighted factors: MTF alignment (25%), Z-Score position (20%), Trend direction (20%), CVD pressure (15%), Momentum state (10%), and Relative volume (10%). Higher scores indicate more factors aligned in one direction.
Q: Why are Session VWAPs not showing on my stock chart?
A: Session VWAPs apply to 24-hour markets by default (forex, crypto, futures). For stocks, enable the Use for All Assets option in Session VWAP settings.
Q: The Divergence labels appear delayed. Is this a bug?
A: Divergence detection requires pivot confirmation, which needs bars on both sides of the pivot point. The label appears at the actual pivot location (several bars back) once confirmed. This is intentional and prevents false signals.
Q: Can I change the band colors?
A: Yes. Each of the three bands has its own color input setting. You can customize Band 1, Band 2, and Band 3 colors to match your preferences. The defaults are Aqua, Fuchsia, and Purple. The main VWAP line color adapts dynamically based on slope direction or can be set to static blue.
Q: How do I set up alerts?
A: Right-click on the chart, select Add Alert, choose this indicator, and select your desired condition from the dropdown. All conditions include descriptive alert messages with relevant data.
Q: What is the Probability Engine lookback period?
A: This setting determines how many trading days the indicator analyzes to calculate band touch rates and mean reversion statistics. Default is 60 days (approximately 3 months). Longer periods provide more stable statistics but may miss recent behavior changes.
Q: Why do I see fewer labels than expected?
A: Signal labels (Volume, Momentum, Squeeze, Divergence) are limited to 5 most recent labels on the chart to keep it clean. When a new label appears, the oldest one is automatically removed. Additionally, momentum labels have several filters: check the slope multiplier setting (higher values require stronger trends) and the Only Reversal Signals option (when enabled, labels only appear for potential reversals, not trend confirmations).
Q: What is the Calculated Projection and how accurate is it?
A: The Calculated Projection analyzes what happened in past market conditions similar to the current state. It classifies each bar by Z-Score level, Trend direction, and Volume profile (27 unique states), then shows the historical probability of up vs down and the average move size. It is NOT a price prediction or guarantee. The probability shown is how often similar conditions led to up/down moves historically, not a future guarantee. Always use it as one input among many.
Q: Why does the Projection probability change?
A: The projection updates on each bar as market state changes. If Z-Score moves from LOW to MID, or trend shifts from UP to FLAT, the system looks up a different historical category. This is expected behavior. The projection shows what happened in similar past conditions to the current bar's state.
Q: The Projection shows LOW confidence. What does that mean?
A: Confidence levels indicate sample size: HIGH means 30 or more historical cases found, MEDIUM means 15-29 cases, LOW means fewer than 15 cases. When sample size is low, the system uses a fallback: first aggregating by Z-Score plus Trend only (ignoring volume), then by Z-Score only. LOW confidence means less statistical reliability, so weight other factors more heavily in your decision.
Q: Why does the cone sometimes show 50/50 probability?
A: A 50/50 reading means that in similar past market states, price moved up roughly half the time and down half the time. This indicates a neutral or balanced condition where historical patterns provide no directional edge. Consider waiting for a higher probability setup or using other analysis methods.
CREDITS AND ACKNOWLEDGMENTS
Methodology Foundation:
VWAP (Volume Weighted Average Price) - Standard institutional benchmark calculation, widely used since the 1980s for algorithmic execution and fair value assessment
Standard Deviation Bands - Statistical volatility measurement applying normal distribution principles to price deviation from mean
Z-Score Analysis - Classic statistical normalization technique for comparing values across different volatility regimes
Cumulative Volume Delta (CVD) - Order flow analysis concept measuring aggressive buying versus selling pressure
Concept Integration:
Mean reversion probability engine - Custom historical statistics tracking for band touch rates
Momentum acceleration detection - Second derivative analysis of VWAP slope changes
VWAP Squeeze - Volatility compression concept adapted from TTM Squeeze methodology applied to VWAP bands versus ATR
Confidence scoring system - Weighted composite scoring combining multiple technical factors
Calculated Projection Cone - Probability-based projection using 27-state market classification (Z-Score, Trend, Volume) with historical outcome analysis and weighted fallback system
All calculations use standard public domain formulas and TradingView built-in functions. No proprietary third-party code was used.
For questions, feedback, or feature requests, please comment below or send a private message.
Happy Trading!

Advanced Volume Profile Pro Delta + POC + VAH/VAL# Advanced Volume Profile Pro - Delta + POC + VAH/VAL Analysis System
## WHAT THIS SCRIPT DOES
This script creates a comprehensive volume profile analysis system that combines traditional volume-at-price distribution with delta volume calculations, Point of Control (POC) identification, and Value Area (VAH/VAL) analysis. Unlike standard volume indicators that show only total volume over time, this script analyzes volume distribution across price levels and estimates buying vs selling pressure using multiple calculation methods to provide deeper market structure insights.
## WHY THIS COMBINATION IS ORIGINAL AND USEFUL
**The Problem Solved:** Traditional volume indicators show when volume occurs but not where price finds acceptance or rejection. Standalone volume profiles lack directional bias information, while basic delta calculations don't provide structural context. Traders need to understand both volume distribution AND directional sentiment at key price levels.
**The Solution:** This script implements an integrated approach that:
- Maps volume distribution across price levels using configurable row density
- Estimates delta (buying vs selling pressure) using three different methodologies
- Identifies Point of Control (highest volume price level) for key support/resistance
- Calculates Value Area boundaries where 70% of volume traded
- Provides real-time alerts for key level interactions and volume imbalances
**Unique Features:**
1. **Developing POC Visualization**: Real-time tracking of Point of Control migration throughout the session via blue dotted trail, revealing institutional accumulation/distribution patterns before they complete
2. **Multi-Method Delta Calculation**: Price Action-based, Bid/Ask estimation, and Cumulative methods for different market conditions
3. **Adaptive Timeframe System**: Auto-adjusts calculation parameters based on chart timeframe for optimal performance
4. **Flexible Profile Types**: N Bars Back (precise control), Days Back (calendar-based), and Session-based analysis modes
5. **Advanced Imbalance Detection**: Identifies and highlights significant buying/selling imbalances with configurable thresholds
6. **Comprehensive Alert System**: Monitors POC touches, Value Area entry/exit, and major volume imbalances
## HOW THE SCRIPT WORKS TECHNICALLY
### Core Volume Profile Methodology:
**1. Price Level Distribution:**
- Divides price range into user-defined rows (10-50 configurable)
- Calculates row height: `(Highest Price - Lowest Price) / Number of Rows`
- Distributes each bar's volume across price levels it touched proportionally
**2. Delta Volume Calculation Methods:**
**Price Action Method:**
```
Price Range = High - Low
Buy Pressure = (Close - Low) / Price Range
Sell Pressure = (High - Close) / Price Range
Buy Volume = Total Volume × Buy Pressure
Sell Volume = Total Volume × Sell Pressure
Delta = Buy Volume - Sell Volume
```
**Bid/Ask Estimation Method:**
```
Average Price = (High + Low + Close) / 3
Buy Volume = Close > Average ? Volume × 0.6 : Volume × 0.4
Sell Volume = Total Volume - Buy Volume
```
**Cumulative Method:**
```
Buy Volume = Close > Open ? Volume : Volume × 0.3
Sell Volume = Close ≤ Open ? Volume : Volume × 0.3
```
**3. Point of Control (POC) Identification:**
- Scans all price levels to find maximum volume concentration
- POC represents the price level with highest trading activity
- Acts as significant support/resistance level
- **Developing POC Feature**: Tracks POC evolution in real-time via blue dotted trail, showing how institutional interest migrates throughout the session. Upward POC migration indicates accumulation patterns, downward migration suggests distribution, providing early trend signals before price confirmation.
**4. Value Area Calculation:**
- Starts from POC and expands up/down to encompass 70% of total volume
- VAH (Value Area High): Upper boundary of value area
- VAL (Value Area Low): Lower boundary of value area
- Expansion algorithm prioritizes direction with higher volume
**5. Adaptive Range Selection:**
Based on profile type and timeframe optimization:
- **N Bars Back**: Fixed lookback period with performance optimization (20-500 bars)
- **Days Back**: Calendar-based analysis with automatic timeframe adjustment (1-365 days)
- **Session**: Current trading session or custom session times
### Performance Optimization Features:
- **Sampling Algorithm**: Reduces calculation load on large datasets while maintaining accuracy
- **Memory Management**: Clears previous drawings to prevent performance degradation
- **Safety Constraints**: Prevents excessive memory usage with configurable limits
## HOW TO USE THIS SCRIPT
### Initial Setup:
1. **Profile Configuration**: Select profile type based on trading style:
- N Bars Back: Precise control over data range
- Days Back: Intuitive calendar-based analysis
- Session: Real-time session development
2. **Row Density**: Set number of rows (30 default) - more rows = higher resolution, slower performance
3. **Delta Method**: Choose calculation method based on market type:
- Price Action: Best for trending markets
- Bid/Ask Estimate: Good for ranging markets
- Cumulative: Smoothed approach for volatile markets
4. **Visual Settings**: Configure colors, position (left/right), and display options
### Reading the Profile:
**Volume Bars:**
- **Length**: Represents relative volume at that price level
- **Color**: Green = net buying pressure, Red = net selling pressure
- **Intensity**: Darker colors indicate volume imbalances above threshold
**Key Levels:**
- **POC (Blue Line)**: Highest volume price - major support/resistance
- **VAH (Purple Dashed)**: Value Area High - upper boundary of fair value
- **VAL (Orange Dashed)**: Value Area Low - lower boundary of fair value
- **Value Area Fill**: Shaded region showing main trading range
**Developing POC Trail:**
- **Blue Dotted Lines**: Show real-time POC evolution throughout the session
- **Migration Patterns**: Upward trail indicates bullish accumulation, downward trail suggests bearish distribution
- **Early Signals**: POC movement often precedes price movement, providing advance warning of institutional activity
- **Institutional Footprints**: Reveals where smart money concentrated volume before final POC establishment
### Trading Applications:
**Support/Resistance Analysis:**
- POC acts as magnetic price level - expect reactions
- VAH/VAL provide intermediate support/resistance levels
- Profile edges show areas of low volume acceptance
**Developing POC Analysis:**
- **Upward Migration**: POC moving higher = institutional accumulation, bullish bias
- **Downward Migration**: POC moving lower = institutional distribution, bearish bias
- **Stable POC**: Tight clustering = balanced market, range-bound conditions
- **Early Trend Detection**: POC direction change often precedes price breakouts
**Entry Strategies:**
- Buy at VAL with POC as target (in uptrends)
- Sell at VAH with POC as target (in downtrends)
- Breakout plays above/below profile extremes
**Volume Imbalance Trading:**
- Strong buying imbalance (>60% threshold) suggests continued upward pressure
- Strong selling imbalance suggests continued downward pressure
- Imbalances near key levels provide high-probability setups
**Multi-Timeframe Context:**
- Use higher timeframe profiles for major levels
- Lower timeframe profiles for precise entries
- Session profiles for intraday trading structure
## SCRIPT SETTINGS EXPLANATION
### Volume Profile Settings:
- **Profile Type**: Determines data range for calculation
- N Bars Back: Exact number of bars (20-500 range)
- Days Back: Calendar days with timeframe adaptation (1-365 days)
- Session: Trading session-based (intraday focus)
- **Number of Rows**: Profile resolution (10-50 range)
- **Profile Width**: Visual width as chart percentage (10-50%)
- **Value Area %**: Volume percentage for VA calculation (50-90%, 70% standard)
- **Auto-Adjust**: Automatically optimizes for different timeframes
### Delta Volume Settings:
- **Show Delta Volume**: Enable/disable delta calculations
- **Delta Calculation Method**: Choose methodology based on market conditions
- **Highlight Imbalances**: Visual emphasis for significant volume imbalances
- **Imbalance Threshold**: Percentage for imbalance detection (50-90%)
### Session Settings:
- **Session Type**: Daily, Weekly, Monthly, or Custom periods
- **Custom Session Time**: Define specific trading hours
- **Previous Sessions**: Number of historical sessions to display
### Days Back Settings:
- **Lookback Days**: Number of calendar days to analyze (1-365)
- **Automatic Calculation**: Script automatically converts days to bars based on timeframe:
- Intraday: Accounts for 6.5 trading hours per day
- Daily: 1 bar per day
- Weekly/Monthly: Proportional adjustment
### N Bars Back Settings:
- **Lookback Bars**: Exact number of bars to analyze (20-500)
- **Precise Control**: Best for systematic analysis and backtesting
### Visual Customization:
- **Colors**: Bullish (green), Bearish (red), and level colors
- **Profile Position**: Left or Right side of chart
- **Profile Offset**: Distance from current price action
- **Labels**: Show/hide level labels and values
- **Smooth Profile Bars**: Enhanced visual appearance
### Alert Configuration:
- **POC Touch**: Alerts when price interacts with Point of Control
- **VA Entry/Exit**: Alerts for Value Area boundary interactions
- **Major Imbalance**: Alerts for significant volume imbalances
## VISUAL FEATURES
### Profile Display:
- **Horizontal Bars**: Volume distribution across price levels
- **Color Coding**: Delta-based coloring for directional bias
- **Smooth Rendering**: Optional smoothing for cleaner appearance
- **Transparency**: Configurable opacity for chart readability
### Level Lines:
- **POC**: Solid blue line with optional label
- **VAH/VAL**: Dashed colored lines with value displays
- **Extension**: Lines extend across relevant time periods
- **Value Area Fill**: Optional shaded region between VAH/VAL
### Information Table:
- **Current Values**: Real-time POC, VAH, VAL prices
- **VA Range**: Value Area width calculation
- **Positioning**: Multiple table positions available
- **Text Sizing**: Adjustable for different screen sizes
## IMPORTANT USAGE NOTES
**Realistic Expectations:**
- Volume profile analysis provides structural context, not trading signals
- Delta calculations are estimations based on price action, not actual order flow
- Past volume distribution does not guarantee future price behavior
- Combine with other analysis methods for comprehensive market view
**Best Practices:**
- Use appropriate profile types for your trading style:
- Day Trading: Session or Days Back (1-5 days)
- Swing Trading: Days Back (10-30 days) or N Bars Back
- Position Trading: Days Back (60-180 days)
- Consider market context (trending vs ranging conditions)
- Verify key levels with additional technical analysis
- Monitor profile development for changing market structure
**Performance Considerations:**
- Higher row counts increase calculation complexity
- Large lookback periods may affect chart performance
- Auto-adjust feature optimizes for most use cases
- Consider using session profiles for intraday efficiency
**Limitations:**
- Delta calculations are estimations, not actual transaction data
- Profile accuracy depends on available price/volume history
- Effectiveness varies across different instruments and market conditions
- Requires understanding of volume profile concepts for optimal use
**Data Requirements:**
- Requires volume data for accurate calculations
- Works best on liquid instruments with consistent volume
- May be less effective on very low volume or exotic instruments
This script serves as a comprehensive volume analysis tool for traders who need detailed market structure information with integrated directional bias analysis and real-time POC development tracking for informed trading decisions.

DCStatCalcs_v0.1DCStatCalcs_v0.1 - Session-Based Statistical Projections
This Pine Script indicator overlays customizable horizontal lines on your chart to visualize a session's opening price and its statistical projections based on historical standard deviation (SD). Designed for traders who want to analyze price behavior within defined time sessions, it calculates and plots the session open price along with optional projection lines at 0.5, 1.0, 1.5, 2.0, and 2.5 standard deviations above and below the open, derived from past session data.
Key Features:
Customizable Sessions: Define your session time (e.g., 0600-1500) and timezone (e.g., America/New_York).
Historical Analysis: Uses a user-specified number of past sessions (default: 20) to compute the standard deviation of price movements relative to the session open.
Projection Lines: Displays toggleable lines at multiple SD levels with adjustable styles, colors, and widths for easy visualization.
Flexible Display: Extend lines beyond the current bar with an offset setting, and adjust label sizes for clarity.
Real-Time Updates: Lines dynamically extend as the session progresses, keeping projections relevant to the current bar.
How It Works:
At the start of each user-defined session, the indicator records the opening price and calculates the SD based on price deviations from the open across historical sessions. It then plots the open price line and, if enabled, projection lines at the specified SD intervals. These lines help traders identify potential support, resistance, or volatility zones based on statistical norms.
Use Case:
Ideal for day traders or analysts working with intraday charts to gauge price ranges and volatility within specific trading sessions, such as market opens or key economic hours.
Published under the Mozilla Public License 2.0. Created by dc_77.

Final Scalping Strategy - RELAXED ENTRY, jangan gopoh braderEMA Scalping System (MTF) Guide (1HR direction, 15 min entry)
Objective
To capture small, consistent profits by entering trades when 15-minute momentum aligns with the 1-hour trend.
Trades are executed only during high-liquidity London and New York sessions to increase the probability of execution and success.
Strategy Setup
Chart Timeframe (Execution): 15-Minute (M15).
Trend Filter (HTF): 1-Hour (H1) chart data is used for the long-term EMA.
Long-Term Trend Filter: 50-Period EMA (based on H1 data).
Short-Term Momentum Signal: 20-Period EMA (based on M15 data).
Risk
Metric: 14-period ATR for dynamic Stop Loss calculation.
✅ Trading Rules🟢
Long (Buy) Entry Conditions
Session: Must be within the London (0800-1700 GMT) or New York (1300-2200 GMT) sessions.
HTF Trend: Current price must be above the 1-Hour EMA 50.
Momentum Signal: Price crosses above the 15-Minute EMA 20.
Confirmation: The bar immediately following the crossover must close above the 15-Minute EMA 20.
Ent
ry: A market order is executed on the close of the confirmation candle.
🔴 Short (Sell) Entry Conditions
Session: Must be within the London (0800-1700 GMT) or New York (1300-2200 GMT) sessions.
HTF Trend: Current price must be below the 1-Hour EMA 50.
Momentum Signal: Price crosses below the 15-Minute EMA 20.
Confirmation: The bar immediately following the crossover must close below the 15-Minute EMA 20.
Entry: A market order is executed on the close of the confirmation candle.
🛑 Trade Management & Exits
Stop Loss (SL): Placed dynamically at 2.0 times the 14-period ATR distance from the entry candle's low (for Buys) or high (for Sells).
Take Profit (TP): Placed dynamically to achieve a 1.5 Risk-Reward Ratio (RR) (TP distance = 1.5 x SL d
istance).
📊 On-Chart Visuals
Detailed Labels: A box appears on the entry bar showing the action, SL/TP prices, Risk/Reward in Pips, and the exact R:R ratio.
Horizontal Lines: Dashed lines display the calculated SL (Red) and TP (Green) levels while the trade is active.
Background: The chart background is shaded to highlight the active London and New York tradi
ng sessions.

Advanced Psychological Levels with Dynamic Spacing═══════════════════════════════════════
ADVANCED PSYCHOLOGICAL LEVELS WITH DYNAMIC SPACING
═══════════════════════════════════════
A comprehensive psychological price level indicator that automatically identifies and displays round number levels across multiple timeframes. Features dynamic ATR-based spacing, smart crypto detection, distance tracking, and customizable alert system.
───────────────────────────────────────
WHAT THIS INDICATOR DOES
───────────────────────────────────────
This indicator automatically draws psychological price levels (round numbers) that often act as support and resistance:
- Dynamic ATR-Based Spacing - Adapts level spacing to market volatility
- Multiple Level Types - Major (250 pip), Standard (100 pip), Mid, and Intraday levels
- Smart Asset Detection - Automatically adjusts for Forex, Crypto, Indices, and CFDs
- Crypto Price Adaptation - Intelligent level spacing based on cryptocurrency price magnitude
- Distance Information Table - Real-time percentage distance to nearest levels
- Combined Level Labels - Clear identification when multiple level types coincide
- Performance Optimized - Configurable visible range and label limits
- Comprehensive Alerts - Notifications when price crosses any level type
───────────────────────────────────────
HOW IT WORKS
───────────────────────────────────────
PSYCHOLOGICAL LEVELS CONCEPT:
Psychological levels are round numbers where traders tend to place orders, creating natural support and resistance zones. These include:
- Forex: 1.0000, 1.0100, 1.0050 (pips)
- Crypto: $100, $1,000, $10,000 (whole numbers)
- Indices: 10,000, 10,500, 11,000 (points)
Why They Matter:
- Traders naturally gravitate to round numbers
- Stop losses cluster at these levels
- Take profit orders concentrate here
- Institutional algorithmic trading often targets these levels
DYNAMIC ATR-BASED SPACING:
Traditional Method:
- Fixed spacing regardless of volatility
- May be too tight in volatile markets
- May be too wide in quiet markets
Dynamic Method (Recommended):
- Uses ATR (Average True Range) to measure volatility
- Automatically adjusts level spacing
- Tighter levels in low volatility
- Wider levels in high volatility
Calculation:
1. Calculate ATR over specified period (default: 14)
2. Multiply by ATR multiplier (default: 2.0)
3. Round to nearest psychological level
4. Generate levels at dynamic intervals
Benefits:
- Adapts to market conditions
- More relevant levels in all volatility regimes
- Reduces clutter in trending markets
- Provides more detail in ranging markets
LEVEL TYPES:
Major Levels (250 pip/point):
- Highest significance
- Primary support/resistance zones
- Color: Red (default)
- Style: Solid lines
- Spacing: 2.5x standard step
Standard Levels (100 pip/point):
- Secondary importance
- Common psychological barriers
- Color: Blue (default)
- Style: Dashed lines
- Spacing: Standard step
Mid Levels (50% between major):
- Optional intermediate levels
- Halfway between major levels
- Color: Gray (default)
- Style: Dotted lines
- Usage: Additional confluence points
Intraday Levels (sub-100 pip):
- For intraday traders
- Fine-grained precision
- Color: Yellow (default)
- Style: Dotted lines
- Only shown on intraday timeframes
SMART ASSET DETECTION:
Forex Pairs:
- Detects major currency pairs automatically
- Uses pip-based calculations
- Standard: 100 pips (0.0100)
- Major: 250 pips (0.0250)
- Intraday: 20, 50, 80 pip subdivisions
Cryptocurrencies:
- Automatic price magnitude detection
- Adaptive spacing based on price:
* Under $0.10: Levels at $0.01, $0.05
* $0.10-$1: Levels at $0.10, $0.50
* $1-$10: Levels at $1, $5
* $10-$100: Levels at $10, $50
* $100-$1,000: Levels at $100, $500
* $1,000-$10,000: Levels at $1,000, $5,000
* Over $10,000: Levels at $5,000, $10,000
Indices & CFDs:
- Fixed point-based system
- Major: 500 point intervals (with 250 sub-levels)
- Standard: 100 point intervals
- Suitable for stock indices like SPX, NASDAQ
COMBINED LEVEL LABELS:
When multiple level types coincide at the same price:
- Single line drawn (highest priority color)
- Combined label shows all types
- Priority: Major > Standard > Mid > Intraday
Example Label Formats:
- "1.1000 Major" - Major level only
- "1.1000 Std + Major" - Both standard and major
- "50000 Intra + Mid + Std" - Three levels coincide
Benefits:
- Cleaner chart appearance
- Clear identification of confluence
- Reduced visual clutter
- Easy to spot high-importance levels
DISTANCE INFORMATION TABLE:
Real-time tracking of nearest levels:
Table Contents:
- Nearest major level above (price and % distance)
- Nearest standard level above (price and % distance)
- Nearest standard level below (price and % distance)
Display:
- Top right corner (configurable)
- Color-coded by level type
- Real-time percentage calculations
- Helpful for position management
Usage:
- Identify proximity to key levels
- Set realistic profit targets
- Gauge potential move magnitude
- Monitor approaching resistance/support
ALERT SYSTEM:
Comprehensive crossing alerts:
Alert Types:
- Major Level Crosses
- Standard Level Crosses
- Intraday Level Crosses
Alert Modes:
- First Cross Only: Alert once when level is crossed
- All Crosses: Alert every time level is crossed
Alert Information:
- Level type crossed
- Specific price level
- Direction (above/below)
- One alert per bar to prevent spam
Configuration:
- Enable/disable by level type
- Choose alert frequency
- Customize for your trading style
───────────────────────────────────────
HOW TO USE
───────────────────────────────────────
INITIAL SETUP:
General Settings:
1. Enable "Use Dynamic ATR-Based Spacing" (recommended)
2. Set ATR Period (14 is standard)
3. Adjust ATR Multiplier (2.0 is balanced)
Visibility Settings:
1. Set Visible Range % (10% recommended for clarity)
2. Adjust Label Offset for readability
3. Configure performance limits if needed
Level Selection:
1. Enable/disable level types based on trading style
2. Adjust line counts for each type
3. Choose line styles and colors for visibility
TRADING STRATEGIES:
Breakout Trading:
1. Wait for price to approach major or standard level
2. Monitor for consolidation near level
3. Enter on confirmed break above/beyond level
4. Stop loss just beyond the broken level
5. Target: Next major or standard level
Rejection Trading:
1. Identify major psychological level
2. Wait for price to test the level
3. Look for rejection signals (wicks, bearish/bullish candles)
4. Enter in direction of rejection
5. Stop beyond the level
6. Target: Previous level or mid-level
Range Trading:
1. Identify range between two major levels
2. Buy at lower psychological level
3. Sell at upper psychological level
4. Use standard and mid-levels for position management
5. Exit if major level breaks with volume
Confluence Trading:
1. Look for combined levels (Std + Major)
2. These represent high-probability zones
3. Use as primary support/resistance
4. Increase position size at confluence
5. Expect stronger reactions at these levels
Session-Based Trading:
1. Note opening level at session start (Asian/London/NY)
2. Trade breakouts of major levels during high-volume sessions
3. London/NY sessions: More likely to break levels
4. Asian session: More likely to respect levels (range trading)
RISK MANAGEMENT WITH PSYCHOLOGICAL LEVELS:
Stop Loss Placement:
- Place stops just beyond psychological levels
- Add buffer (5-10 pips for forex)
- Avoid exact round numbers (stop hunting risk)
- Use previous major level as maximum stop
Take Profit Strategy:
- First target: Next standard level (partial profit)
- Second target: Next major level (remaining position)
- Trail stops to breakeven at first target
- Use distance table to calculate risk/reward
Position Sizing:
- Larger positions at major levels (higher probability)
- Smaller positions at intraday levels (lower probability)
- Scale in at standard levels between major levels
- Reduce size when multiple levels are close together
TIMEFRAME CONSIDERATIONS:
Higher Timeframes (4H, Daily, Weekly):
- Focus on Major and Standard levels only
- Disable Intraday and Mid levels
- Wider level spacing expected
- Use for swing trading and position trading
Lower Timeframes (5m, 15m, 1H):
- Enable all level types
- Use Intraday levels for precision
- Tighter level spacing acceptable
- Good for day trading and scalping
Multi-Timeframe Approach:
- Identify major levels on Daily/4H charts
- Refine entries using 15m/1H intraday levels
- Trade in direction of higher timeframe bias
- Use lower timeframe levels for position management
───────────────────────────────────────
CONFIGURATION GUIDE
───────────────────────────────────────
GENERAL SETTINGS:
Dynamic ATR-Based Spacing:
- Enabled: Recommended for most markets
- Disabled: Fixed psychological levels
- ATR Period: 14 (standard), 10 (responsive), 20 (smooth)
- ATR Multiplier: 1.0-5.0 (2.0 is balanced)
VISIBILITY SETTINGS:
Visible Range %:
- 5%: Very tight range, minimal clutter
- 10%: Balanced view (recommended)
- 20%: Wide range, more context
- 50%: Maximum range, all levels visible
Label Offset:
- 10-20 bars: Close to current price
- 30-50 bars: Moderate distance
- 50-100 bars: Far from price action
Performance Limits:
- Max Historical Bars: Reduce if indicator loads slowly
- Max Labels: Reduce for cleaner chart (20-30 recommended)
LEVEL CUSTOMIZATION:
Line Count:
- Lower (1-3): Cleaner chart, fewer levels
- Medium (4-6): Balanced view
- Higher (7-10): More context, busier chart
Line Styles:
- Solid: High importance, easy to see
- Dashed: Medium importance, clear but subtle
- Dotted: Low importance, minimal visual weight
Colors:
- Use contrasting colors for different level types
- Red/Blue/Yellow default works well
- Adjust based on chart background and personal preference
DISTANCE TABLE:
Position:
- Top Right: Doesn't interfere with price action
- Top Left: Good for right-side price scale
- Bottom positions: Less common but available
Colors:
- Default (white text, dark background) works for most charts
- Match your chart theme for consistency
- Ensure text is readable against background
ALERT CONFIGURATION:
Alert by Level Type:
- Major: Most important, fewer false signals
- Standard: Balance of frequency and importance
- Intraday: Many signals, best for active traders
Alert Frequency:
- First Cross Only: Cleaner, less noise (recommended for swing trading)
- All Crosses: Every touch, good for scalping
Alert Setup in TradingView:
1. Configure desired alert types in indicator settings
2. Right-click chart → Add Alert
3. Select this indicator
4. Choose "Any alert() function call"
5. Set delivery method (mobile, email, webhook)
───────────────────────────────────────
ASSET-SPECIFIC TIPS
───────────────────────────────────────
FOREX (EUR/USD, GBP/USD, etc.):
- Major levels at x.x000, x.x500
- Standard levels at x.xx00
- Intraday levels at 20/50/80 pips
- Most effective during London/NY sessions
- Watch for "figure" levels (1.0000, 1.1000)
CRYPTOCURRENCIES (BTC, ETH, etc.):
- Enable dynamic spacing for volatile markets
- Levels adjust automatically based on price
- Watch major $1,000 increments for BTC
- $100 levels important for ETH
- Smaller caps: Use standard levels
- High volatility: Increase ATR multiplier to 3.0
STOCK INDICES (SPX, NASDAQ, etc.):
- 100-point levels most important
- 500-point levels for major S/R
- 50-point mid-levels for refinement
- Watch end-of-day for level reactions
- Futures often lead spot on level breaks
GOLD/COMMODITIES:
- Major levels at $50 increments ($1,900, $1,950)
- Standard levels at $10 increments
- Very reactive to psychological levels
- Watch for false breaks during low volume
- Best reactions during active trading hours
───────────────────────────────────────
BEST PRACTICES
───────────────────────────────────────
Chart Setup:
- Use clean price action charts
- Avoid too many indicators
- Ensure psychological levels are clearly visible
- Match colors to your chart theme
Level Selection:
- Start with Major and Standard levels only
- Add Mid and Intraday as needed
- Less is more - avoid chart clutter
- Adjust based on timeframe
Combining with Other Tools:
- Volume profile for confluence
- Trendlines intersecting psychological levels
- Moving averages near round numbers
- Fibonacci levels coinciding with psychological levels
Common Mistakes to Avoid:
- Trading every level touch (be selective)
- Ignoring volume confirmation
- Setting stops exactly at levels (stop hunting)
- Forgetting to adjust for different assets
- Over-relying on levels without price action confirmation
Performance Optimization:
- Reduce visible range for faster loading
- Lower max historical bars on lower timeframes
- Limit labels to 30-50 for clarity
- Disable unused level types
───────────────────────────────────────
EDUCATIONAL DISCLAIMER
───────────────────────────────────────
This indicator identifies psychological price levels based on round numbers that tend to act as support and resistance. The methodology includes:
- Round number detection algorithms
- ATR-based dynamic spacing calculations
- Asset-specific level determination
- Distance percentage calculations
Psychological levels are a recognized concept in technical analysis, studied by traders and institutions. However, they do not guarantee price reactions and should be used as part of a comprehensive trading strategy including proper risk management, volume analysis, and price action confirmation.
───────────────────────────────────────
USAGE DISCLAIMER
───────────────────────────────────────
This tool is for educational and analytical purposes. Psychological levels can act as support or resistance but price reactions are not guaranteed. Dynamic spacing may generate different levels in different market conditions. Always conduct independent analysis, use proper risk management, and never risk capital you cannot afford to lose. Past performance does not indicate future results.
───────────────────────────────────────
CREDITS & ATTRIBUTION
───────────────────────────────────────
Original Concept: Sonar Lab
