EMA20 Cross Strategy with countertrades and signalsEMA20 Cross Strategy Documentation
Overview
The EMA20 Cross Strategy with Counter-Trades and Instant Signals is a Pine Script (version 6) trading strategy designed for the TradingView platform. It implements an Exponential Moving Average (EMA) crossover system to generate buy and sell signals, with optional trend filtering, session-based trading, instant signal processing, and visual/statistical feedback. The strategy supports counter-trades (closing opposing positions before entering new ones) and operates with a fixed trade size in EUR.
Features
EMA Crossover Mechanism:
Uses a short-term EMA (configurable length, default: 1) and a long-term EMA (default: 20) to detect crossovers.
A buy signal is generated when the short EMA crosses above the long EMA.
A sell signal is generated when the short EMA crosses below the long EMA.
Instant Signals:
If enabled (useInstantSignals), signals are based on the current price crossing the short EMA, rather than waiting for the candle close.
This allows faster trade execution but may increase sensitivity to price fluctuations.
Trend Filter:
Optionally filters trades based on the trend direction (useTrendFilter).
Long trades are allowed only when the short EMA (or price, for instant signals) is above the long EMA.
Short trades are allowed only when the short EMA (or price) is below the long EMA.
Session Filter:
Restricts trading to specific market hours (sessionStart, default: 09:00–17:00) if enabled (useSessionFilter).
Ensures trades occur only during active market sessions, reducing exposure to low-liquidity periods.
Customizable Timeframe:
The EMA calculations can use a higher timeframe (e.g., 5m, 15m, 1H, 4H, 1D, default: 1H) via request.security.
This allows the strategy to base signals on longer-term trends while operating on a shorter-term chart.
Trade Management:
Fixed trade size of €100,000 per trade (tradeAmount), with a maximum quantity cap (maxQty = 10,000) to prevent oversized trades.
Counter-trades: Closes short positions before entering a long position and vice versa.
Trades are executed with a minimum quantity of 1 to ensure valid orders.
Visualization:
EMA Lines: The short EMA is colored based on the last signal (green for buy, red for sell, gray for neutral), and the long EMA is orange.
Signal Markers: Displays buy/sell signals as arrows (triangles) above/below candles if enabled (showSignalShapes).
Background/Candle Coloring: Optionally colors the chart background or candles green (bullish) or red (bearish) based on the trend (useColoredBars).
Statistics Display:
If enabled (useStats), a label on the chart shows:
Total closed trades
Open trades
Win rate (%)
Number of winning/losing trades
Profit factor (gross profit / gross loss)
Net profit
Maximum drawdown
Configuration Inputs
EMA Short Length (emaLength): Length of the short-term EMA (default: 1).
Trend EMA Length (trendLength): Length of the long-term EMA (default: 20).
Enable Trend Filter (useTrendFilter): Toggles trend-based filtering (default: true).
Color Candles (useColoredBars): Colors candles instead of the background (default: true).
Enable Session Filter (useSessionFilter): Restricts trading to specified hours (default: false).
Trading Session (sessionStart): Defines trading hours (default: 09:00–17:00).
Show Statistics (useStats): Displays performance stats on the chart (default: true).
Show Signal Arrows (showSignalShapes): Displays buy/sell signals as arrows (default: true).
Use Instant Signals (useInstantSignals): Generates signals based on live price action (default: false).
EMA Timeframe (emaTimeframe): Timeframe for EMA calculations (options: 5m, 15m, 1H, 4H, 1D; default: 1H).
Strategy Logic
Signal Generation:
Standard Mode: Signals are based on EMA crossovers (short EMA crossing long EMA) at candle close.
Instant Mode: Signals are based on the current price crossing the short EMA, enabling faster reactions.
Trade Execution:
On a buy signal, closes any short position and opens a long position.
On a sell signal, closes any long position and opens a short position.
Position size is calculated as the minimum of €100,000 or available equity, divided by the current price, capped at 10,000 units.
Filters:
Trend Filter: Ensures trades align with the trend direction (if enabled).
Session Filter: Restricts trades to user-defined market hours (if enabled).
Visual Feedback
EMA Lines: Provide a clear view of the short and long EMAs, with the short EMA’s color reflecting the latest signal.
Signal Arrows: Large green triangles (buy) below candles or red triangles (sell) above candles for easy signal identification.
Chart Coloring: Highlights bullish (green) or bearish (red) trends via background or candle colors.
Statistics Label: Displays key performance metrics in a label above the chart for quick reference.
Usage Notes
Initial Capital: €100,000 (configurable via initial_capital).
Currency: EUR (set via currency).
Order Processing: Orders are processed at candle close (process_orders_on_close=true) unless instant signals are enabled.
Dynamic Requests: Allows dynamic timeframe adjustments for EMA calculations (dynamic_requests=true).
Platform: Designed for TradingView, compatible with any market supported by the platform (e.g., stocks, forex, crypto).
Example Use Case
Scenario: Trading on a 5-minute chart with a 1-hour EMA timeframe, trend filter enabled, and session filter set to 09:00–17:00.
Behavior: The strategy will:
Calculate EMAs on the 1-hour timeframe.
Generate buy signals when the short EMA crosses above the long EMA (and price is above the long EMA).
Generate sell signals when the short EMA crosses below the long EMA (and price is below the long EMA).
Execute trades only during 09:00–17:00.
Display green/red candles and performance stats on the chart.
Limitations
Instant Signals: May lead to more frequent signals, increasing the risk of false positives in volatile markets.
Fixed Trade Size: Does not adjust dynamically based on market conditions beyond equity and max quantity limits.
Session Filter: Simplified and may not account for complex session rules or holidays.
Statistics: Displayed on-chart, which may clutter the view in smaller charts.
Customization
Adjust emaLength and trendLength to suit different market conditions (e.g., shorter for scalping, longer for swing trading).
Toggle useInstantSignals for faster or more stable signal generation.
Modify sessionStart to align with specific market hours.
Disable useStats or showSignalShapes for a cleaner chart.
This strategy is versatile for both manual and automated trading, offering flexibility for various markets and trading styles while providing clear visual and statistical feedback.
Search in scripts for "sessions"

Session Filter [Trendoscope]🎲 Session Filter: A Customisable Trading Indicator for Defining Preferred Trade Sessions
Session Filter is a simple trading indicator that enables traders to define their preferred trading sessions and optimise their approach based on individual preferences. By providing a range of flexible customisation options, Session Filter can help traders reduce risk, increase accuracy, by helping them to adhere to their trading sessions. Features include
🎯 Customisable Trading Sessions
One of the key features of Session Filter is the ability to select from four different trading sessions. These sessions are designed to be flexible, making it easy to tailor your approach to specific markets, assets, and trading styles. By selecting the sessions that are most relevant to your strategy, you can reduce the risk of making trades during less favourable market conditions.
For example, if you prefer to trade during the Asian session, you can set the session times to "Asian Session" in input settings. This will highlight the specific times when the Asian markets are open, allowing you to focus your trading activity during these periods. By doing so, you can avoid trading during times when the market is less active or more volatile.
🎯 Customisable Timezone and Days of the Week:
In addition to customisable trading sessions, Session Filter also allows users to select a timezone and specific days of the week. This ensures that the displayed trading zones and signals are aligned with your local time, and that you can tailor your approach to your preferred schedule. This is particularly useful for traders who have other commitments, or who prefer to focus on specific markets or assets on certain days.
For example, if you are based in New York and prefer to trade during the European session, you can select the "European Session" option in Session Filter and adjust the timezone to reflect your local time. You can also select specific days of the week when you prefer to trade during the European session, such as Tuesday through Thursday. This allows you to optimize your approach based on your personal preferences and schedule.
🎯 Easy Visual Interpretation:
Session Filter uses green and red overlays on the chart to indicate the trading zones, making it easy for users to visually identify their trading sessions
For example, when a green overlay is displayed on the chart, this indicates that the market is within the selected trading session and that it may be a good time to start trade. Conversely, when a red overlay is displayed, this indicates that the market is outside of the selected trading session and that it may be a good time close all trading. By providing this visual feedback, Session Filter helps traders stay focused and disciplined, and avoid making impulsive trading decisions.
🎯Force Exit Signal for Risk Management:
Session Filter also offers the ability to generate a force exit signal when not in any of the selected sessions. This can be used in conjunction with alerts to exit all trades outsize session zone.
For example, if you are using Session Filter to trade during the European session, but the market is particularly volatile during a specific day, the force exit signal will be generated to indicate that it may be a good time to exit your trade. This helps you avoid potential losses and stay disciplined during periods of market turbulence.
🎯External Signal Plots:
In addition to the chart overlays, Session Filter also plots signals on the data window that can be used as external inputs in other indicators and strategies. This feature allows traders to incorporate the signals generated by Session Filter into their existing trading systems and this can be used as additional filters on an existing strategy or methodology.
🎯Alerts using Alert Conditions
Alerts are provided for start and end of session so that users can make use of it to set auto turn on or off their bots.
Settings are pretty simple and are explained here.

Macro Times [Blu_Ju]About ICT Macro Times:
The Inner Circle Trader (ICT) has taught that there are certain time sessions when the Interbank Price Delivery Algorithm (IPDA) is running a macro. The macro itself could be a repricing macro, a consolidation macro, etc. - this depends on where price currently is in relation to its draw. The times the macro is active do not change however, and are always the following (in New York local time):
8:50-9:10 (premarket macro)
9:50-10:10 (AM macro 1)
10:50-11:10 (AM macro 2)
11:50-12:10 (lunch macro)
13:10-13:40 (PM macro)
15:15-15:45 (final hour macro)
Because these times are fixed, traders can anticipate a setup is likely to form in or around these sessions. Setups may involve sweeps of liquidity (highs/lows), repricing to inefficiencies (e.g., fair value gaps), breaker setups, etc. (The specific setup involved is beyond the scope of this script; this script is concerned with visually marking the time sessions only.)
About this Script:
The scope of this script is to visually identify the macro active time sessions. This script draws vertical lines to mark the start and end of the macro time sessions. Optionally, the user can use a background color for the macro session with or without the vertical lines. The user can also toggle on or off any of the macro sessions, if he or she is only interested in certain ones. The user also has the freedom to change the times of the macro sessions if he or she is interested in a different time.
What makes this script unique is that it plots the macro time sessions after midnight for each day, before the real-time bar reaches the macro times. This is advantageous to the trader, as it gives the trader a visual cue that the macro times are approaching. When watching price it is easy to lose track of time, and the purpose of this script is to help the trader maintain where price is in relation to the macro time sessions in a simple, visual way.

STOCK EXCHANGE + SILVER BULLET FRAMESThis script is an updated version of the " NY/LDN/TOK Stock Exchange Opening Hours " script.
Objective
Displays global stock exchange sessions (New York, London, Tokyo) with session frames, highs/lows, and opening lines. Includes ICT Silver Bullet windows (NY, London, Tokyo) with configurable shading. Past sessions are frozen at close, ongoing sessions update dynamically until closure, and upcoming sessions are pre-drawn. Fully customizable with options for weekends, labels, padding, opacity, and individual session toggles.
It is designed to help traders quickly interpret market context, liquidity zones, and session-based price behavior.
Main Features
Past sessions (historical data)
• Session Frames:
• Each box is frozen at the session’s close.
• The left edge aligns with the opening time, while the right edge is fixed at the closing time.
• The top and bottom reflect the highest and lowest prices during the session.
• Session Labels:
• Names (NY, LDN, TOK) displayed above the frame, aligned left, in the same color as the frame.
• Opening Lines:
• Vertical dotted lines mark the start of each session.
Ongoing and upcoming sessions (live market)
• Dynamic Session Frames:
• The right edge is locked at the future close time.
• The top and bottom update in real time as new highs and lows form.
• Labels and Lines:
• The session label is visible above the active frame.
• Opening lines are drawn as soon as the session begins.
Silver Bullet Time Windows (ICT concept)
• Highlights key liquidity windows within sessions:
• New York: 10:00–11:00 and 14:00–15:00
• London: 08:00–09:00
• Tokyo: 09:00–10:00
• Silver Bullet zones are shaded with configurable opacity (default 5%).
Customization and Options
• Enable or disable individual sessions (NY, London, Tokyo).
• Toggle weekend display (frames and Silver Bullets).
• Adjust label size, padding, and text visibility.
• Control frame opacity (default 0%).
• Optimized memory management with automatic pruning of old graphical objects.

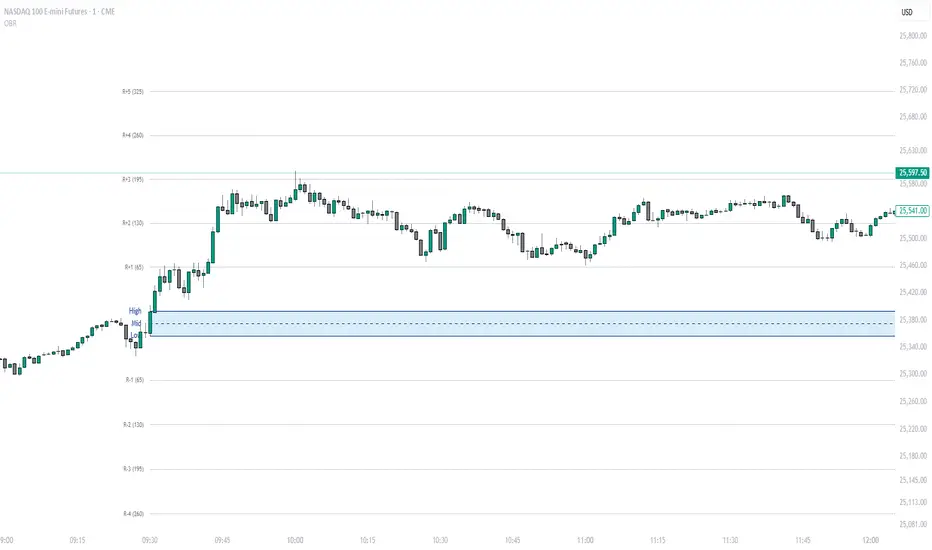
Session Opening Bar RangeSession Opening Bar Range (OBR) - Advanced Opening Range Indicator with Statistical Analysis
Overview
The Session First Bar Range (FBR) indicator is a comprehensive tool that captures and projects key levels based on the first bar of a user-defined trading session. Unlike traditional daily opening range indicators, this script allows traders to focus on specific session windows (New York RTH, London, Asia, etc.) and analyze price behavior relative to the initial momentum established in that session's opening bar.
What makes this indicator unique is its combination of three distinct projection methodologies: statistical analysis based on historical range data, Fibonacci extensions, and fixed-point rotation levels commonly used by institutional traders. To our knowledge, this is the only opening range indicator that incorporates statistical standard deviation levels calculated from historical first bar ranges, making it both a technical and probabilistic tool.
Core Concept
The opening range concept is based on the principle that the initial price action of a trading session often sets the tone for the remainder of that session.
Professional traders have long observed that:
The first bar's high and low act as key reference points
Price often respects or breaks these levels with significance
Expansion beyond the opening range tends to occur in measurable increments
This indicator takes these observations and enhances them with:
Historical probability analysis - "Based on the last 60 sessions, price typically extends X standard deviations beyond the opening range"
Proportional projections - Fibonacci-based extensions showing where measured moves typically target
Fixed-point rotations - Institutional rotation levels (e.g., 65 points for NQ, 15 points for ES)
How It Works
Session Detection & First Bar Capture
The indicator uses Pine Script's time() function with timezone support to precisely detect when a trading session begins. When the first bar of the selected timeframe occurs within the session window, the script captures:
High (H): The high of the first bar
Low (L): The low of the first bar
Mid (M): The midpoint (hl2) of the first bar
Critical Detail: These levels are fixed from the first bar only - they do not update as the session progresses. This differs from many "opening range" indicators that use a time period (e.g., first 30 minutes). Here, you select the bar timeframe (default 5-minute), and only that single first bar's range is captured.
Statistical Level Calculation
The indicator maintains a rolling array of the last N session's first bar ranges (default: 60 sessions). For each new session, it calculates:
Average Range: Mean of historical first bar ranges
Standard Deviation: Volatility of those ranges
Projection Levels: High/Low ± (Average Range + Std Dev × Multiplier)
This provides probability-based levels. For example, a +2σ level suggests: "Historically, price extending this far beyond the opening range is a 2-standard-deviation event (approximately 95th percentile)."
Fibonacci Extensions
Using the first bar range as the base unit (100%), the indicator projects Fibonacci levels:
100% extension: One full range above the high / below the low
1.618x extension: (Default) Golden ratio projection
2.618x, 3.618x extensions: Additional Fibonacci levels
Calculation: Range = H - L, then Target = H + (Range × Multiplier) for upside projections.
OR Rotation Levels
These are fixed-point increments from the first bar's high and low. Unlike percentage-based methods, rotations use absolute point values:
NQ traders often use 65-point increments
ES traders often use 15-point increments
Gold/bonds use different values
The indicator draws 5 levels above the high (R+1 through R+5) and 5 below the low (R-1 through R-5), each separated by your specified point increment.
Features:
Session Options
Pre-configured Sessions:
New York RTH (9:30am - 4:00pm)
New York Futures (8:00am - 5:00pm)
London (2:00am - 8:00am)
Asia (7:00pm - 2:00am)
Midnight to 5pm
ZB/Gold/Silver OR (8:20am - 4:00pm)
CL OR (9:00am - 4:00pm)
Custom Session: Define your own start/end times in HHMM format
Timezone Support: All sessions respect the selected timezone (default: America/New_York)
Customizable Timeframe
Select any timeframe for the first bar (1min, 5min, 15min, etc.)
Default: 5-minute bars
Important: This is the timeframe for the first bar capture, independent of your chart's timeframe
Display Options
Historical Ranges: Show/hide past session ranges (with configurable limit to manage performance)
Line Styles: Choose between Solid, Dashed, or Dotted for range lines and midline
Label Position: Left or Right side of range
Show Prices: Optionally display actual price values on labels
Custom Colors: Fully customizable colors for all components
Statistical Levels
Lookback Period: Number of historical sessions to analyze (default: 60)
Two Multiplier Levels: Default 1σ and 2σ, fully adjustable
Separate styling: Different line styles (dashed vs dotted) for each sigma level
Optional Labels: Show/hide sigma notation labels
Fibonacci Extensions
Four Extension Levels: 100%, 1.618x, 2.618x, 3.618x (all customizable)
Bidirectional: Projections both above and below the opening range
Optional Labels: Toggle percentage/multiplier labels
OR Rotation Levels
Configurable Increment: Set the point value for your instrument
Five Levels Each Direction: R±1 through R±5
Dynamic Labels: Show both rotation number and point value (e.g., "R+1 (65)")
Three Line Styles: Solid, Dashed, or Dotted
How to Use
Setup
Add the indicator to your chart
Select your trading session from the dropdown
Set the timeframe for first bar capture (typically 5-15 minutes)
Configure which projection methods you want to see (Statistical, Fibonacci, and/or Rotations)
For Day Traders
Scenario: Trading NQ during New York RTH
Session: Select "New York RTH (9:30am - 4:00pm)"
Timeframe: 5-minute (captures 9:30-9:35 bar)
Enable: OR Rotations with 65-point increments
Strategy:
Watch for acceptance/rejection at rotation levels
Use R+1/R-1 as initial profit targets
R+2/R-2 as extended targets
Statistical levels show when price is in "outlier" territory
and rotation levels
Performance Notes
The indicator limits objects to stay within TradingView's constraints (500 max)
If you enable all features, reduce "Maximum Historical Ranges" to prevent slowdown
Typical configuration: 10-20 historical ranges with all features enabled works well
Settings Guide
Session Settings
Session: Choose from pre-configured sessions or "Custom"
Custom Session Start/End: HHMM format (e.g., "0930" for 9:30am)
Timezone: Critical for accurate session detection
Opening Bar Format
Timeframe: The bar size for capturing the first bar's range
Show Midline: Toggle the mid-point line
Show Historical Ranges: Display previous sessions (recommended: leave ON)
Maximum Historical Ranges: Limit history to manage performance (1-500)
Range Style / MidLine Style: Solid, Dashed, or Dotted
Position: Label placement (Left or Right)
Show Prices: Include actual price values on labels
Statistical Levels
Lookback Periods: How many historical first bar ranges to analyze (default: 60)
Std Dev Multiplier 1/2: The sigma levels to project (default: 1.0 and 2.0)
All visual settings (colors, line width, label size)
Fibonacci Extensions
Show Fib Extensions: Enable/disable Fibonacci projections
Measured Move Extensions 1-4: The multipliers (default: 1.618, 2.618, 3.618, 4.618)
Visual customization options
OR Rotations
Rotation Increment: The point value for your instrument
NQ: 65 points
ES: 15 points
Adjust for other instruments based on their typical rotation behavior
Show Rotation Labels: Display level numbers and point values
Visual customization options
Use Cases
Gap Trading: When price gaps away from previous day's close, the first bar range shows the initial gap acceptance/rejection zone
Breakout Confirmation: Price breaking and holding above the first bar high with volume suggests trend day potential. Rotation levels provide measured targets.
Reversal Identification: Price reaching +2σ statistical level = rare event, potential exhaustion
Range Bound Days: Price oscillating between first bar high/low suggests range-bound session; trade reversals at extremes
Institutional Level Awareness: OR Rotations at 65 points (NQ) align with levels professional traders watch
Technical Notes
The indicator uses request.security() with lookahead=barmerge.lookahead_on to ensure the first bar levels are captured correctly
All drawing objects (lines, labels, fills) are managed in arrays with automatic cleanup to prevent memory issues
The statistical calculations use array.avg() and array.stdev() for accurate probability estimates
Rotation levels use individual line variables (like Fibonacci) rather than loops for reliability
Summary
This indicator is original in its combination of three distinct methodologies for projecting levels from a session's opening range:
Statistical Analysis - No other opening range indicator (to our knowledge) calculates standard deviation projections from historical first bar ranges
Time-Based Session Flexibility - Most OR indicators use only daily or fixed time periods; this allows any custom session window
Multiple Projection Methods - Traders can use statistical, Fibonacci, AND rotation levels together or separately
Range Trading StrategyOVERVIEW
The Range Trading Strategy is a systematic trading approach that identifies price ranges
from higher timeframe candles or trading sessions, tracks pivot points, and generates
trading signals when range extremes are mitigated and confirmed by pivot levels.
CORE CONCEPT
The strategy is based on the principle that when a candle (or session) closes within the
range of the previous candle (or session), that previous candle becomes a "range" with
identifiable high and low extremes. When price breaks through these extremes, it creates
trading opportunities that are confirmed by pivot levels.
RANGE DETECTION MODES
1. HTF (Higher Timeframe) Mode:
Automatically selects a higher timeframe based on the current chart timeframe
Uses request.security() to fetch HTF candle data
Range is created when an HTF candle closes within the previous HTF candle's range
The previous HTF candle's high and low become the range extremes
2. Sessions Mode:
- Divides the trading day into 4 sessions (UTC):
* Session 1: 00:00 - 06:00 (6 hours)
* Session 2: 06:00 - 12:00 (6 hours)
* Session 3: 12:00 - 20:00 (8 hours)
* Session 4: 20:00 - 00:00 (4 hours, spans midnight)
- Tracks high, low, and close for each session
- Range is created when a session closes within the previous session's range
- The previous session's high and low become the range extremes
PIVOT DETECTION
Pivots are detected based on candle color changes (bullish/bearish transitions):
1. Pivot Low:
Created when a bullish candle appears after a bearish candle
Pivot low = minimum of the current candle's low and previous candle's low
The pivot bar is the actual bar where the low was formed (current or previous bar)
2. Pivot High:
Created when a bearish candle appears after a bullish candle
Pivot high = maximum of the current candle's high and previous candle's high
The pivot bar is the actual bar where the high was formed (current or previous bar)
IMPORTANT: There is always only ONE active pivot high and ONE active pivot low at any
given time. When a new pivot is created, it replaces the previous one.
RANGE CREATION
A range is created when:
(HTF Mode) An HTF candle closes within the previous HTF candle's range AND a new HTF
candle has just started
(Sessions Mode) A session closes within the previous session's range AND a new session
has just started
Or Range Can Be Created when the Extreme of Another Range Gets Mitigated and We Have a Pivot low Just Above the Range Low or Pivot High just Below the Range High
Range Properties:
rangeHigh: The high extreme of the range
rangeLow: The low extreme of the range
highStartTime: The timestamp when the range high was actually formed (found by looping
backwards through bars)
lowStartTime: The timestamp when the range low was actually formed (found by looping
backwards through bars)
highMitigated / lowMitigated: Flags tracking whether each extreme has been broken
isSpecial: Flag indicating if this is a "special range" (see Special Ranges section)
RANGE MITIGATION
A range extreme is considered "mitigated" when price interacts with it:
High is mitigated when: high >= rangeHigh (any interaction at or above the level)
Low is mitigated when: low <= rangeLow (any interaction at or below the level)
Mitigation can happen:
At the moment of range creation (if price is already beyond the extreme)
At any point after range creation when price touches the extreme
SIGNAL GENERATION
1. Pending Signals:
When a range extreme is mitigated, a pending signal is created:
a) BEARISH Pending Signal:
- Triggered when: rangeHigh is mitigated
- Confirmation Level: Current pivotLow
- Signal is confirmed when: close < pivotLow
- Stop Loss: Current pivotHigh (at time of confirmation)
- Entry: Short position
Signal Confirmation
b) BULLISH Pending Signal:
- Triggered when: rangeLow is mitigated
- Confirmation Level: Current pivotHigh
- Signal is confirmed when: close > pivotHigh
- Stop Loss: Current pivotLow (at time of confirmation)
- Entry: Long position
IMPORTANT: There is only ever ONE pending bearish signal and ONE pending bullish signal
at any given time. When a new pending signal is created, it replaces the previous one
of the same type.
2. Signal Confirmation:
- Bearish: Confirmed when price closes below the pivot low (confirmation level)
- Bullish: Confirmed when price closes above the pivot high (confirmation level)
- Upon confirmation, a trade is entered immediately
- The confirmation line is drawn from the pivot bar to the confirmation bar
TRADE EXECUTION
When a signal is confirmed:
1. Position Management:
- Any existing position in the opposite direction is closed first
- Then the new position is entered
2. Stop Loss:
- Bearish (Short): Stop at pivotHigh
- Bullish (Long): Stop at pivotLow
3. Take Profit:
- Calculated using Risk:Reward Ratio (default 2:1)
- Risk = Distance from entry to stop loss
- Target = Entry ± (Risk × R:R Ratio)
- Can be disabled with "Stop Loss Only" toggle
4. Trade Comments:
- "Range Bear" for short trades
- "Range Bull" for long trades
SPECIAL RANGES
Special ranges are created when:
- A range high is mitigated AND the current pivotHigh is below the range high
- A range low is mitigated AND the current pivotLow is above the range low
In these cases:
- The pivot value is stored in an array (storedPivotHighs or storedPivotLows)
- A "special range" is created with only ONE extreme:
* If pivotHigh < rangeHigh: Creates a range with rangeHigh = pivotLow, rangeLow = na
* If pivotLow > rangeLow: Creates a range with rangeLow = pivotHigh, rangeHigh = na
- Special ranges can generate signals just like normal ranges
- If a special range is mitigated on the creation bar or the next bar, it is removed
entirely without generating signals (prevents false signals)
Special Ranges
REVERSE ON STOP LOSS
When enabled, if a stop loss is hit, the strategy automatically opens a trade in the
opposite direction:
1. Long Stop Loss Hit:
- Detects when: position_size > 0 AND position_size <= 0 AND low <= longStopLoss
- Action: Opens a SHORT position
- Stop Loss: Current pivotHigh
- Trade Comment: "Reverse on Stop"
2. Short Stop Loss Hit:
- Detects when: position_size < 0 AND position_size >= 0 AND high >= shortStopLoss
- Action: Opens a LONG position
- Stop Loss: Current pivotLow
- Trade Comment: "Reverse on Stop"
The reverse trade uses the same R:R ratio and respects the "Stop Loss Only" setting.
VISUAL ELEMENTS
1. Range Lines:
- Drawn from the time when the extreme was formed to the mitigation point (or current
time if not mitigated)
- High lines: Blue (or mitigated color if mitigated)
- Low lines: Red (or mitigated color if mitigated)
- Style: SOLID
- Width: 1
2. Confirmation Lines:
- Drawn when a signal is confirmed
- Extends from the pivot bar to the confirmation bar
- Bearish: Red, solid line
- Bullish: Green, solid line
- Width: 1
- Can be toggled on/off
STRATEGY SETTINGS
1. Range Detection Mode:
- HTF: Uses higher timeframe candles
- Sessions: Uses trading session boundaries
2. Auto HTF:
- Automatically selects HTF based on current chart timeframe
- Can be disabled to use manual HTF selection
3. Risk:Reward Ratio:
- Default: 2.0 (2:1)
- Minimum: 0.5
- Step: 0.5
4. Stop Loss Only:
- When enabled: Trades only have stop loss (no take profit)
- Trades close on stop loss or when opposite signal confirms
5. Reverse on Stop Loss:
- When enabled: Hitting a stop loss opens opposite trade with stop at opposing pivot
6. Max Ranges to Display:
- Limits the number of ranges kept in memory
- Oldest ranges are purged when limit is exceeded
KEY FEATURES
1. Dynamic Pivot Tracking:
- Pivots update on every candle color change
- Always maintains one high and one low pivot
2. Range Lifecycle:
- Ranges are created when price closes within previous range
- Ranges are tracked until mitigated
- Mitigation creates pending signals
- Signals are confirmed by pivot levels
3. Signal Priority:
- Only one pending signal of each type at a time
- New signals replace old ones
- Confirmation happens on close of bar
4. Position Management:
- Closes opposite positions before entering new trades
- Tracks stop loss levels for reverse functionality
- Respects pyramiding = 1 (only one position per direction)
5. Time-Based Drawing:
- Uses time coordinates instead of bar indices for line drawing
- Prevents "too far from current bar" errors
- Lines can extend to any historical point
USAGE NOTES
- Best suited for trending and ranging markets
- Works on any timeframe, but HTF mode adapts automatically
- Sessions mode is ideal for intraday trading
- Pivot detection requires clear candle color changes
- Range detection requires price to close within previous range
- Signals are generated on bar close, not intra-bar
The strategy combines range identification, pivot tracking, and signal confirmation to
create a systematic approach to trading breakouts and reversals based on price structure, past performance does not in any way predict future performance

Initial Balance Breakout Signals [LuxAlgo]The Initial Balance Breakout Signals help traders identify breakouts of the Initial Balance (IB) range.
The indicator includes automatic detection of IB or can use custom sessions, highlights top and bottom IB extensions, custom Fibonacci levels, and goes further with an IB forecast with two different modes.
🔶 USAGE
The initial balance is the price range made within the first hour of the trading session. It is an intraday concept based on the idea that high volume and volatility enter the market through institutional trading at the start of the session, setting the tone for the rest of the day.
The initial balance is useful for gauging market sentiment, or, in other words, the relationship between buyers and sellers.
Bullish sentiment: Price trades above the IB range.
Mixed sentiment: Price trades within the IB range.
Bearish sentiment: Price trades below the IB range.
The initial balance high and low are important levels that many traders use to gauge sentiment. There are two main ideas behind trading around the IB range.
IB Extreme Breakout: When the price breaks and holds the IB high or low, there is a high probability that the price will continue in that direction.
IB Extreme Rejection: When the price tries to break those levels but fails, there is a high probability that it will reach the opposite IB extreme.
This indicator is a complete Initial Balance toolset with custom sessions, breakout signals, IB extensions, Fibonacci retracements, and an IB forecast. All of these features will be explained in the following sections.
🔹 Custom Sessions and Signals
By default, sessions for Initial Balance and breakout signals are in Auto mode. This means that Initial Balance takes the first hour of the trading session and shows breakout signals for the rest of the session.
With this option, traders can use the tool for open range trading, making it highly versatile. The concept behind open range (OR) is the same as that of initial balance (IB), but in OR, the range is determined by the first minute, three or five minutes, or up to the first 30 minutes of the trading session.
As shown in the image above, the top chart uses the Auto feature for the IB and Breakouts sessions. The bottom chart has the Auto feature disabled to use custom sessions for both parameters. In this case, the first three minutes of the trading session are used, turning the tool into an Open Range trading indicator.
This chart shows another example of using custom sessions to display overnight NASDAQ futures sessions.
The left chart shows a custom session from the Tokyo open to the London open, and the right chart shows a custom session from the London open to the New York open.
The chart shows both the Asian and European sessions, their top and bottom extremes, and the breakout signals from those extremes.
🔹 Initial Balance Extensions
Traders can easily extend both extremes of the Initial Balance to display their preferred targets for breakouts. Enable or disable any of them and set the IB percentage to use for the extension.
As the chart shows, the percentage selected on the settings panel directly affects the displayed levels.
Setting 25 means the tool will use a quarter of the detected initial balance range for extensions beyond the IB extremes. Setting 100 means the full IB range will be used.
Traders can use these extensions as targets for breakout signals.
🔹 Fibonacci Levels
Traders can display default or custom Fibonacci levels on the IB range to trade retracements and assess the strength of market movements. Each level can be enabled or disabled and customized by level, color, and line style.
As we can see on the chart, after the IB was completed, prices were unable to fall below the 0.236 Fibonacci level. This indicates significant bullish pressure, so it is expected that prices will rise.
Traders can use these levels as guidelines to assess the strength of the side trying to penetrate the IB. In this case, the sellers were unable to move the market beyond the first level.
🔹 Initial Balance Forecast
The tool features two different forecasting methods for the current IB. By default, it takes the average of the last ten values and applies a multiplier of one.
IB Against Previous Open: averages the difference between IB extremes and the open of the previous session.
Filter by current day of the week: averages the difference between IB extremes and the open of the current session for the same day of the week.
This feature allows traders to see the difference between the current IB and the average of the last IBs. It makes it very easy to interpret: if the current IB is higher than the average, buyers are in control; if it is lower than the average, sellers are in control.
For example, on the left side of the chart, we can see that the last day was very bullish because the IB was completely above the forecasted value. This is the IB mean of the last ten trading days.
On the right, we can see that on Monday, September 15, the IB traded slightly higher but within the forecasted value of the IB mean of the last ten Mondays. In this case, it is within expectations.
🔶 SETTINGS
Display Last X IBs: Select how many IBs to display.
Initial Balance: Choose a custom session or enable the Auto feature.
Breakouts: Enable or disable breakouts. Choose custom session or enable the Auto feature.
🔹 Extensions
Top Extension: Enable or disable the top extension and choose the percentage of IB to use.
Bottom extension: Enable or disable the bottom extension and choose the percentage of IB to use.
🔹 Fibonacci Levels
Display Fibonacci: Enable or disable Fibonacci levels.
Reverse: Reverse Fibonacci levels.
Levels, Colors & Style
Display Labels: Enable or disable labels and choose text size.
🔹 Forecast
Display Forecast: Select the forecast method.
- IB Against Previous Open: Calculates the average difference between the IB high and low and the previous day's IB open price.
- Filter by Current Day of Week: Calculates the average difference between the IB high and low and the IB open price for the same day of the week.
Forecast Memory: The number of data points used to calculate the average.
Forecast Multiplier: This multiplier will be applied to the average. Bigger numbers will result in wider predicted ranges.
Forecast Colors: Choose from a variety of colors.
Forecast Style: Choose a line style.
🔹 Style
Initial Balance Colors
Extension Transparency: Choose the extension's transparency. 0 is solid, and 100 is fully transparent.

Session Open Range, Breakout & Trap Framework - TrendPredator OBSession Open Range, Breakout & Trap Framework — TrendPredator Open Box
Stacey Burke’s trading approach combines concepts from George Douglas Taylor, Tony Crabel, Steve Mauro, and Robert Schabacker. His framework focuses on reading price behaviour across daily templates and identifying how markets move through recurring cycles of expansion, contraction, and reversal. While effective, much of this analysis requires real-time interpretation of session-based behaviour, which can be demanding for traders working on lower intraday timeframes.
The TrendPredator indicators formalize parts of this methodology by introducing mechanical rules for multi-timeframe bias tracking and session structure analysis. They aim to present the key elements of the system—bias, breakouts, fakeouts, and range behaviour—in a consistent and objective way that reduces discretionary interpretation.
The Open Box indicator focuses specifically on the opening behaviour of major trading sessions. It builds on principles found in classical Open Range Breakout (ORB) techniques described by Tony Crabel, where a defined time window around the session open forms a structural reference range. Price behaviour relative to this range—breaking out, failing back inside, or expanding—can highlight developing session bias, potential trap formation, and directional conviction.
This indicator applies these concepts throughout the major equity sessions. It automatically maps the session’s initial range (“Open Box”) and tracks how price interacts with it as liquidity and volatility increase. It also incorporates related structural references such as:
* the first-hour high and low of the futures session
* the exact session open level
* an anchored VWAP starting at the session open
* automated expansion levels projected from the Open Box
In combination, these components provide a unified view of early session activity, including breakout attempts, fakeouts, VWAP reactions, and liquidity targeting. The Open Box offers a structured lens for observing how price transitions through the major sessions (Asia → London → New York) and how these behaviours relate to higher-timeframe bias defined in the broader TrendPredator framework.
Core Features
Open Box (Session Structure)
The indicator defines an initial session range beginning at the selected session open. This “Open Box” represents a fixed time window—commonly the first 30 minutes, or any user-defined duration—that serves as a structural reference for analysing early session behaviour.
The range highlights whether price remains inside the box, breaks out, or rejects the boundaries, providing a consistent foundation for interpreting early directional tendencies and recognising breakout, continuation, or fakeout characteristics.
How it works:
* At the session open, the indicator calculates the high and low over the specified time window.
* This range is plotted as the initial structure of the session.
* Price behaviour at the boundaries can illustrate emerging bias or potential trap formation.
* An optional secondary range (e.g., 15-minute high/low) can be enabled to capture early volatility with additional precision.
Inputs / Options:
* Session specifications (Tokyo, London, New York)
* Open Box start and end times (e.g., equity open + first 30 minutes, or any custom length)
* Open Box colour and label settings
* Formatting options for Open Box high and low lines
* Optional secondary range per session (e.g., 15-minute high/low)
* Forward extension of Open Box high/low lines
* Number of historic Open Boxes to display
Session VWAPs
The indicator plots VWAPs for each major trading session—Asia, London, and New York—anchored to their respective session opens. These session-specific VWAPs assist in tracking how value develops through the day and how price interacts with session-based volume distributions.
How it works:
* At each session open, a VWAP is anchored to the open price.
* The VWAP updates throughout the session as new volume and price data arrive.
* Deviations above or below the VWAP may indicate balance, imbalance, or directional control.
* Viewed together, session VWAPs help identify transitions in value across sessions.
Inputs / Options:
* Enable or disable VWAP per session
* Adjustable anchor and end times (optionally to end of day)
* Line styling and label settings
* Number of historic VWAPs to draw
First Hour High/Low Extensions
The indicator marks the high and low formed during the first hour of each session. These reference points often function as early control levels and provide context for assessing whether the session is establishing bias, consolidating, or exhibiting reversal behaviour.
How it works:
* After the session starts, the indicator records the highest and lowest prices during the first hour.
* These levels are plotted and extended across the session.
* They provide a visual reference for observing reactions, targets, or rejection zones.
Inputs / Options:
* Enable or disable for each session
* Line style, colour, and label visibility
* Number of historic sessions displayed
EQO Levels (Equity Open)
The indicator plots the opening price of each configured session. These “Equity Open” levels represent short-term reference points that can attract price early in the session.
Once the level is revisited after the Open Box has formed, it is automatically cut to avoid clutter. If not revisited, the line remains as an untested reference, similar to a naked point of control.
How it works:
* At session open, the open price is recorded.
* The level is plotted as a local reference.
* If price interacts with the level after the Open Box completes, the line is cut.
* Untested EQOs extend forward until interacted with.
Inputs / Options:
* Enable/disable per session
* Line style and label settings
* Optional extension into the next day
* Option for cutting vs. hiding on revisit
* Number of historic sessions displayed
OB Range Expansions (Automatic)
Range expansions are calculated from the height of the Open Box. These levels provide structured reference zones for identifying potential continuation or exhaustion areas within a session.
How it works:
* After the Open Box is formed, multiples of the range (e.g., 1×, 2×, 3×) are projected.
* These expansion levels are plotted above and below the range.
* Price reactions near these areas can illustrate continuation, hesitation, or potential reversal.
Inputs / Options:
* Enable or disable per session
* Select number of multiples
* Line style, colour, and label settings
* Extension length into the session
Stacey Burke 12-Candle Window Marker
The indicator can highlight the 12-candle window often referenced in Stacey Burke’s session methodology. This window represents the key active period of each session where breakout attempts, volatility shifts, and reversal signatures often occur.
How it works:
* A configurable window (default 12 candles) is highlighted from each session open.
* This window acts as a guide for observing active session behaviour.
* It remains visible throughout the session for structural context.
Inputs / Options:
* Enable/disable per session
* Configurable window duration (default: 3 hours)
* Colour and transparency controls
Concept and Integration
The Open Box is built around the same multi-timeframe logic that underpins the broader TrendPredator framework.
While higher-timeframe tools track bias and setups across the H8–D–W–M levels, the Open Box focuses on the H1–M30 domain to define session structure and observe how early intraday behaviour aligns with higher-timeframe conditions.
The indicator integrates with the TrendPredator FO (Breakout, Fakeout & Trend Switch Detector), which highlights microstructure signals on lower timeframes (M15/M5). Together they form a layered workflow:
* Higher timeframes: context, bias, and developing setups
* TrendPredator OB: intraday and intra-session structure
* TrendPredator FO: microstructure confirmation (e.g., FOL/FOH, switches)
This alignment provides a structured way to observe how daily directional context interacts with intraday behaviour.
See the public open source indicator TP FO here (click on it for access):
Practical Application
Before Session Open
* Review previous session Open Box, Open level, and VWAPs
* Assess how higher-timeframe bias aligns with potential intraday continuation or reversal
* Note untested EQO levels or VWAPs that may function as liquidity attractors
During Session Open
* Observe behaviour around the first-hour high/low and higher-timeframe reference levels
* Monitor how the M15 and 30-minute ranges close
* Track reactions relative to the session open level and the session VWAP
After the Open Box completes
* Assess price interaction with Open Box boundaries and first-hour levels
* Use microstructure signals (e.g., FOH/FOL, switches) for potential confirmation
* Refer to expansion levels as reference zones for management or target setting
After Session
* Review how price behaved relative to the Open Box, EQO levels, VWAPs, and expansion zones
* Analyse breakout attempts, fakeouts, and whether intraday structure aligned with the broader daily move
Example Workflow and Trade
1. Higher-timeframe analysis signals a Daily Fakeout Low Continuation (bullish context).
2. The New York session forms an Open Box; price breaks above and holds above the first-hour high.
3. A Fakeout Low + Switch Bar appears on M5 (via FO), after retesting the session VWAP triggering the entry.
4. 1x expansion level serves as reference targets for take profit.
Relation to the TrendPredator Ecosystem
The Open Box is part of the TrendPredator Indicator Family, designed to apply multi-timeframe logic consistently across:
* higher-timeframe context and setups
* intraday and session structure (OB)
* microstructure confirmation (FO)
Together, these modules offer a unified structure for analysing how daily and intraday cycles interact.
Disclaimer
This indicator is for educational purposes only and does not guarantee profits.
It does not provide buy or sell signals but highlights structural and behavioural areas for analysis.
Users are solely responsible for their trading decisions and outcomes.

DCSessionStatsOHLC_v1.0DCSessionStatsOHLC_v1.0
© dc_77 | Pine Script™ v6 | Licensed under Mozilla Public License 2.0
This indicator overlays customizable session-based OHLC (Open, High, Low, Close) statistics on your TradingView chart. It tracks price action within user-defined sessions, calculates average manipulation and distribution levels based on historical data, and visually projects these levels with lines and labels. Additionally, it provides a session count table to monitor bullish and bearish sessions.
Key Features:
Session Customization: Define session time (e.g., "0000-1600") and time zone (e.g., UTC, America/New_York). Analyze up to 20 historical sessions.
Anchor Line: Displays a vertical line at session start with customizable style, color, and optional label.
Session Open Line: Plots a horizontal line at the session’s opening price with adjustable appearance and label.
Manipulation Levels: Calculates and projects average price extensions (high/low relative to open) for manipulative moves, shown as horizontal lines with labels.
Distribution Levels: Displays average price ranges (high/low beyond open) for distribution phases, with customizable lines and labels.
Visual Flexibility: Adjust line styles (solid, dashed, dotted), colors, widths, label sizes, and projection offsets (bars beyond session start).
Session Stats Table: Optional table showing counts of bullish (close > open) and bearish (close < open) sessions, with configurable position and size.
How It Works:
Tracks OHLC data within each session and identifies session start/end based on the specified time range.
Computes averages for manipulation (e.g., low below open in bullish sessions) and distribution (e.g., high above open) levels from past sessions.
Projects these levels forward as horizontal lines, extending them by a user-defined offset for easy reference.
Updates a table with real-time bullish/bearish session counts.
Use Case:
Ideal for traders analyzing intraday or custom session behavior, identifying key price levels, and gauging market sentiment over time.
Toggle individual elements on/off and fine-tune visuals to suit your trading style.

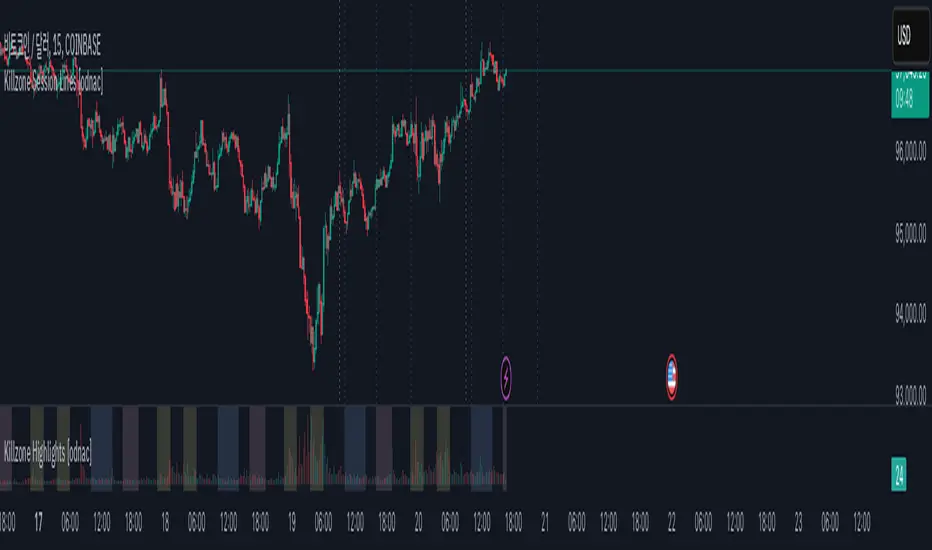
Killzone Session Lines [odnac]This Pine Script indicator displays vertical lines marking the start of key market sessions, known as Killzones, for both today and yesterday. These lines help traders identify important trading hours for the Asia, Europe, and New York sessions.
Killzone Vertical Lines:
Draws vertical lines for the start of the Asia, Europe, and New York sessions.
Displays lines for both today and the previous day to compare price action across sessions.
Customizable Time Settings:
Users can set the exact start hour and minute for each Killzone.
Time zones adjust automatically based on the chart's time zone.
Visual Customization:
Change the color, width, and style of the vertical lines (solid, dotted, dashed).
Toggle each session's lines individually for a cleaner chart.
Previous Start Lines:
Optional lines for the opening of today, the previous day, and the previous week, providing historical context for support and resistance levels.
Why Use This Indicator?
Session Awareness: Know exactly when major market sessions start to identify potential volatility spikes.
Historical Context: Compare today’s price action with previous sessions to spot recurring patterns.
Clean Charting: Automatic updates prevent clutter, keeping your workspace organized.
Flexible Customization: Tailor the display to fit your trading style and preferences.
2022 Model ICT Entry Strategy [TradingFinder] One Setup For Life🔵 Introduction
The ICT 2022 model, introduced by Michael Huddleston, is an advanced trading strategy rooted in liquidity and price imbalance, where time and price serve as the core elements. This ICT 2022 trading strategy is an algorithmic approach designed to analyze liquidity and imbalances in the market. It incorporates concepts such as Fair Value Gap (FVG), Liquidity Sweep, and Market Structure Shift (MSS) to help traders identify liquidity movements and structural changes in the market, enabling them to determine optimal entry and exit points for their trades.
This Full ICT Day Trading Model empowers traders to pinpoint the Previous Day High/Low as well as the highs and lows of critical sessions like the London and New York sessions. These levels act as Liquidity Zones, which are frequently swept prior to a market structure shift (MSS) or a retracement to areas such as Optimal Trade Entry (OTE).
Bullish :
Bearish :
🔵 How to Use
The ICT 2022 model is a sophisticated trading strategy that focuses on identifying key liquidity levels and price movements. It operates based on two main principles. In the first phase, the price approaches liquidity zones and sweeps critical levels such as the previous day’s high or low and key session levels.
This movement is known as a Liquidity Sweep. In the second phase, following the sweep, the price retraces to areas like the FVG (Fair Value Gap), creating ideal entry points for trades. Below is a detailed explanation of how to apply this strategy in bullish and bearish setups.
🟣 Bullish ICT 2022 Model Setup
To use the ICT 2022 model in a bullish setup, start by identifying the Previous Day High/Low or key session levels, such as those of the London or New York sessions. In a bullish setup, the price usually moves downward first, sweeping the Liquidity Low. This move, known as a Liquidity Sweep, reflects the collection of buy orders by major market participants.
After the liquidity sweep, the price should shift market structure and start moving upward; this shift, referred to as Market Structure Shift (MSS), signals the beginning of an upward trend. Following MSS, areas like FVG, located within the Discount Zone, are identified. At this stage, the trader waits for the price to retrace to these zones. Once the price returns, a long trade is executed.
Finally, the stop-loss should be set below the liquidity low to manage risk, while the take-profit target is usually placed above the previous day’s high or other identified liquidity levels. This structure enables traders to take advantage of the upward price movement after the liquidity sweep.
🟣 Bearish ICT 2022 Model Setup
To identify a bearish setup in the ICT 2022 model, begin by marking the Previous Day High/Low or key session levels, such as the London or New York sessions. In this scenario, the price typically moves upward first, sweeping the Liquidity High. This move, known as a Liquidity Sweep, signifies the collection of sell orders by key market players.
After the liquidity sweep, the price should shift market structure downward. This movement, called the Market Structure Shift (MSS), indicates the start of a downtrend. Following MSS, areas such as FVG, found within the Premium Zone, are identified. At this stage, the trader waits for the price to retrace to these areas. Once the price revisits these zones, a short trade is executed.
In this setup, the stop-loss should be placed above the liquidity high to control risk, while the take-profit target is typically set below the previous day’s low or another defined liquidity level. This approach allows traders to capitalize on the downward price movement following the liquidity sweep.
🔵 Settings
Swing period : You can set the swing detection period.
Max Swing Back Method : It is in two modes "All" and "Custom". If it is in "All" mode, it will check all swings, and if it is in "Custom" mode, it will check the swings to the extent you determine.
Max Swing Back : You can set the number of swings that will go back for checking.
FVG Length : Default is 120 Bar.
MSS Length : Default is 80 Bar.
FVG Filter : This refines the number of identified FVG areas based on a specified algorithm to focus on higher quality signals and reduce noise.
Types of FVG filters :
Very Aggressive Filter: Adds a condition where, for an upward FVG, the last candle's highest price must exceed the middle candle's highest price, and for a downward FVG, the last candle's lowest price must be lower than the middle candle's lowest price. This minimally filters out FVGs.
Aggressive Filter: Builds on the Very Aggressive mode by ensuring the middle candle is not too small, filtering out more FVGs.
Defensive Filter: Adds criteria regarding the size and structure of the middle candle, requiring it to have a substantial body and specific polarity conditions, filtering out a significant number of FVGs.
Very Defensive Filter: Further refines filtering by ensuring the first and third candles are not small-bodied doji candles, retaining only the highest quality signals.
🔵 Conclusion
The ICT 2022 model is a comprehensive and advanced trading strategy designed around key concepts such as liquidity, price imbalance, and market structure shifts (MSS). By focusing on the sweep of critical levels such as the previous day’s high/low and important trading sessions like London and New York, this strategy enables traders to predict market movements with greater precision.
The use of tools like FVG in this model helps traders fine-tune their entry and exit points and take advantage of bullish and bearish trends after liquidity sweeps. Moreover, combining this strategy with precise timing during key trading sessions allows traders to minimize risk and maximize returns.
In conclusion, the ICT 2022 model emphasizes the importance of time and liquidity, making it a powerful tool for both professional and novice traders. By applying the principles of this model, you can make more informed trading decisions and seize opportunities in financial markets more effectively.

skThis Pine Script is an indicator designed to mark and highlight specific trading sessions on a TradingView chart. Here's a description of the script's functionality:
1. *Session Selection*: The script allows you to select a session time frame using the `session_input` input. The available options for session time frames are "D" (daily), "W" (weekly), "M" (monthly), "H" (hourly), "15" (15 minutes), "5" (5 minutes), and "1" (1 minute).
2. *Session Times*: You can specify the start and end times for three different trading sessions - CBDR (Central Bank Dealer Range), Asia, and London - using the corresponding input options. These times are specified in Indian Standard Time (IST).
3. *Time Calculation*: The script calculates the start and end times for each session based on the specified hours and minutes. It uses the `timestamp` function to create time objects for these sessions.
4. *Session Highlighting*: The script creates rectangles on the chart to highlight each session:
- CBDR Session: A gray rectangle is drawn during the CBDR session time.
- Asia Session: Another gray rectangle is drawn during the Asia session time.
- London Session: A green rectangle is drawn at the top of the chart during the London session time.
5. *Transparency*: The rectangles have a transparency level of 90%, allowing you to see the price data beneath them while still marking the sessions.
6. *Overlay*: The indicator is set to overlay on the price chart, so it doesn't obstruct the price data.
7. *Customization*: You can customize the session times and appearance by adjusting the input values in the settings panel of the indicator.
Overall, this script provides a visual way to identify and highlight specific trading sessions on your TradingView chart, helping traders understand price action in different market sessions.

Session Highs and LowsThis indicator highlights the New York, London, and Asian trading sessions — plotting each session’s highs and lows directly on your chart to help visualize intraday ranges and liquidity levels.
⸻
✨ Features
• Session Range Visualization
Automatically marks the high and low of each trading session with colored lines.
This makes it easy to identify where price expanded, consolidated, or built liquidity during each market phase.
• Session Background Zones (Optional)
Toggle background fills to highlight active sessions for clearer visual separation of NY, London, and Asian trading hours.
• Customizable Settings
• Enable or disable each session independently
• Adjust session times and colors
• Choose whether to fill session backgrounds
• Timezone Aware
All sessions are aligned to New York time by default, ensuring consistent mapping across instruments.
⸻
🎯 Use Case
A perfect tool for traders who track session-based liquidity, breaks of structure, or session-to-session continuity.
Quickly spot the Asian range, London expansion, and New York reversal windows — key components in intraday strategy development.
⸻
⚙️ Inputs
• Toggle sessions: NY / London / Asian
• Background fill on/off
• Label color customization
• Adjustable session times
⸻
📈 Why Use It
Understanding where each session establishes its range high and low provides critical context for liquidity grabs, session overlaps, and structural shifts throughout the day.
This simple yet powerful visual map enhances precision for ICT-style, smart money, or price action-based trading models.

Dual Session ORB S/R Lines Pro by Yendor_BShort description:
Clean opening-range breakout support/resistance lines for London and US sessions with confirmed breakout labels and alert-ready signals. UTC-based, adjustable start point, customizable styling, minimal clutter.
Detailed description:
What it does:
Captures the Opening Range (default first 15 minutes) for London and New York (US) sessions in UTC, plots the high and low as support/resistance lines, and marks confirmed breakouts when price closes beyond those levels. Lines can begin at either the range end or session start and persist for the configured session length.
Key Features:
ORB defined over the first N minutes after session open (configurable, default 15).
Two sessions: London and US (New York) with separate start times.
High/low support & resistance lines per session:
Selectable start point: Range End or Session Start.
Independently customizable color, width, and style (solid/dashed/dotted) for each high and low.
Confirmed breakout labels: only on the first candle that closes beyond the ORB high or low after the range completes (prior close must be inside).
Alerts and alertconditions for breakout long/short per session, usable in TradingView’s alert dialog.
Fully UTC-based. Works on any timeframe; 1-minute or 5-minute recommended for precision.
Minimal visual clutter; no persistent shaded boxes in this version.
Inputs explained:
ORB Duration (minutes): Length of the opening range used to calculate session high and low.
Session Length (hours): How long the S/R lines remain active (typically full session).
London / US Start (UTC): Session open times in UTC.
Line Start Point: Choose whether the lines begin at the range end or at the session start.
High/Low Styling: Independent color, thickness, and style for each session’s high and low.
Breakout Labels: Toggle one-time confirmed breakout annotations.
Alerts: Enable breakout alert messages.
Example workflows:
Monitor the first 15 minutes of the London session.
After the range, wait for a candle to close beyond the high or low for a confirmed breakout.
Use the label or alert to trigger entry logic (retest, continuation, etc.).
Repeat for the US session; compare overlaps for higher conviction.
Alert setup:
Open the Alerts panel. Choose one of the built-in alertconditions: London Breakout Long, London Breakout Short, US Breakout Long, US Breakout Short. Set frequency to Once Per Bar Close. Customize notification/webhook payload if automating.
Preset suggestions:
Standard London ORB: 15 minute range, lines from range end, green high / lime low.
Standard US ORB: 15 minute range, lines from range end, blue high / aqua low.
Overlap Bias: Both sessions active, lines start from session start, differentiated styles.
Tips & best practices:
Combine with external volume or volatility filters to reduce false breakouts. Use on correlated pairs to observe consistent session structure. Treat broken ORB levels as flipped support/resistance on revisit. Prefer confirmed closes beyond lines rather than wick touches.
Limitations / disclaimer:
Provides structural visualization and breakout signaling; does not guarantee profitability. Always apply proper risk management and confirm with additional context. Backtest settings before live use.
Tags:
#ORB #OpeningRangeBreakout #SessionTrading #LondonSession #NewYorkSession #SupportResistance #Breakout #Intraday #Pinev6 #TradingView #Forex #TrendStructure #Alerts #USD #EURUSD #TradingSignals #UTCBased #PriceAction #MarketStructure #IntradayBreakouts

Session Breakouts & Trend Indicator# Session Breakouts & Trend Indicator
This indicator identifies high-probability trading opportunities by tracking key intraday sessions and their breakouts while aligning them with the overall market trend direction.
## What Makes This Indicator Unique
Unlike standard breakout indicators that only identify when price crosses a threshold, this indicator:
- Dynamically identifies and tracks important daily sessions (default: AM 09:00-10:00 and PM 15:00-16:00)
- Determines trend direction using a triple EMA system (20/50/200)
- Shows when breakouts align with the overall trend (higher probability setups)
- Provides visual confirmation with session ranges, breakout levels, and background highlighting
- Includes a comprehensive information panel showing trend/session alignment
## How It Works
The indicator tracks two important daily sessions:
1. **AM Session**: Typically the first hour of trading (default: 09:00-10:00)
2. **PM Session**: Typically the last hour of trading (default: 15:00-16:00)
For each session, it:
- Marks the high and low range
- Establishes breakout levels above/below these ranges
- Detects when price breaks beyond these levels
- Determines if the breakout aligns with the prevailing trend
The trend is calculated using three EMAs (20, 50, 200) for reliable trend identification.
## How To Use
1. Apply the indicator to your chart (works best on 5-minute timeframes)
2. Adjust session times to match your trading schedule if needed
3. Watch for breakouts above session highs (bullish) or below session lows (bearish)
4. Check the information panel to see if the breakout aligns with the trend
5. Enter trades in the direction of trend-aligned breakouts for higher probability setups
6. Set stop losses below the opposite side of the session range
## Settings
- **Session Times**: Customize AM and PM session times
- **EMA Lengths**: Adjust trend determination sensitivity
- **Visualization Options**: Toggle display of sessions, breakouts, and VWAP
- **Alert Settings**: Configure alerts for breakouts and trend-aligned conditions
This indicator is valuable for day traders and swing traders looking for objective entry points with higher probability of success.

ICT Session by LasinsName: ICT Session by Lasins
Purpose: To visually identify and differentiate between the Asian, London, and New York trading sessions on the chart.
Features:
Highlights the background of the chart during each session.
Includes a mini dashboard in the top-right corner to show the active session.
Allows customization of time zones (exchange timezone or UTC).
Displays copyright and author information.
Key Components
Inputs:
useExchangeTimezone: A boolean input to toggle between using the exchange timezone or UTC for session times.
showDashboard: A boolean input to toggle the visibility of the mini dashboard.
Session Times:
The script defines three trading sessions:
Asian Session: 2000-0000 UTC (or adjusted for exchange timezone).
London Session: 0200-0500 UTC (or adjusted for exchange timezone).
New York Session: 0700-1000 UTC (or adjusted for exchange timezone).
Session Detection:
The is_session function checks if the current time falls within a specified session using the time function.
Background Coloring:
The bgcolor function is used to highlight the chart background during each session:
Asian Session: Red background.
London Session: Green background.
New York Session: Blue background.
Mini Dashboard:
A table is created in the top-right corner of the chart to display the active session and its corresponding color.
The dashboard includes:
A header row with "Session" and "Color".
Rows for each session (Asian, London, New York) with their respective colors.
Copyright and Author Information:
A label is added to the chart to display the copyright and author information ("© ICT Session by Lasins Raj").
How It Works
The script checks the current time and compares it to the predefined session times.
If the current time falls within a session, the chart background is highlighted with the corresponding color.
The mini dashboard updates to reflect the active session.
The copyright and author information is displayed at the bottom of the chart.
Customization
You can adjust the session times in the script to match your preferred timezone or trading hours.
The useExchangeTimezone input allows you to switch between UTC and the exchange timezone.
The showDashboard input lets you toggle the visibility of the mini dashboard.
Example Use Case
Traders who follow the ICT (Inner Circle Trader) methodology can use this indicator to identify key trading sessions and plan their trades accordingly.
The visual representation of sessions helps traders quickly recognize when major markets are open and active.

Forex Session Volume ExplorerFigure out the best time to trade your favorite Currency Pair, Commodity, or Crypto!
This indicator is an exploration of how Forex Sessions affect volume. The colored plots below represent the accumulative volume during each of the four major trading sessions: London, New York, Tokyo, and Sydney.
Plots have been normalized as a percentage of total volume, i.e. London = 34.2 signifies that 34.2% of all volume occurs during the London Session.
Trading the session with the highest volume will greatly benefit your Win Rate, especially when using "typical" indicators and strategies.
Use in conjunction with my previous tool for a clean & customizable visual representation of Forex Sesssions:
Forex Trading Sessions
Cheers,
EFX (@DasanC)

NYCSessionLibrary "NYCSession"
Library for New York trading session time functions
@author abneralvarado
@version 1.0
isInNYSession(sessionStart, sessionEnd)
Determines if the current bar is within New York trading session
Parameters:
sessionStart (simple int) : Starting time of NY session in 24hr format (HHMM) like 0930 for 9:30 AM ET
sessionEnd (simple int) : Ending time of NY session in 24hr format (HHMM) like 1600 for 4:00 PM ET
Returns: True if current bar is within the NY session time, false otherwise
getNYSessionStartTime(lookback, sessionStart)
Gets the start time of NY session for a given bar
Parameters:
lookback (simple int) : Bar index to check (0 is current bar)
sessionStart (simple int) : Starting time of NY session in 24hr format (HHMM)
Returns: Unix timestamp for the start of NY session on the given bar's date
getNYSessionEndTime(lookback, sessionEnd)
Gets the end time of NY session for a given bar
Parameters:
lookback (simple int) : Bar index to check (0 is current bar)
sessionEnd (simple int) : Ending time of NY session in 24hr format (HHMM)
Returns: Unix timestamp for the end of NY session on the given bar's date
isNYSessionOpen(sessionStart)
Checks if current bar opens the NY session
Parameters:
sessionStart (simple int) : Starting time of NY session in 24hr format (HHMM)
Returns: True if current bar marks the session opening, false otherwise
isNYSessionClose(sessionEnd)
Checks if current bar closes the NY session
Parameters:
sessionEnd (simple int) : Ending time of NY session in 24hr format (HHMM)
Returns: True if current bar marks the session closing, false otherwise
isWeekday()
Determines if the current day is a weekday (Mon-Fri)
Returns: True if current bar is on a weekday, false otherwise
getSessionBackgroundColor(sessionStart, sessionEnd, bgColor)
Gets session background color with transparency
Parameters:
sessionStart (simple int) : Starting time of NY session in 24hr format (HHMM)
sessionEnd (simple int) : Ending time of NY session in 24hr format (HHMM)
bgColor (color) : Background color for session highlighting
Returns: Color value for background or na if not in session

SAT_BACKTEST @description TODO: Regroupement of useful functionsLibrary "SAT_BACKTEST"
ex_timezone(tz)
switch case return exact @timezone for timezone input
Parameters:
tz (simple string)
Returns: syminfo.timezone or tz
if_in_date_range(usefromDate, fromDate, usetoDate, toDate, src_timezone, dst_timezone)
if_in_date_range : check if @time_close is range
Parameters:
usefromDate (simple bool)
fromDate (simple int)
usetoDate (simple bool)
toDate (simple int)
src_timezone (simple string)
dst_timezone (simple string)
Returns: true if @time_close is range
if_in_session(useSessionStart, sessionStartHour, sessionStartMinute, useSessionEnd, sessionEndHour, sessionEndMinute, useSessionDay, mon, tue, wed, thu, fri, sat, sun, src_timezone, dst_timezone)
if_in_session : check if @time_close is range
Parameters:
useSessionStart (simple bool)
sessionStartHour (simple int)
sessionStartMinute (simple int)
useSessionEnd (simple bool)
sessionEndHour (simple int)
sessionEndMinute (simple int)
useSessionDay (simple bool)
mon (simple bool)
tue (simple bool)
wed (simple bool)
thu (simple bool)
fri (simple bool)
sat (simple bool)
sun (simple bool)
src_timezone (simple string)
dst_timezone (simple string)
Returns: true if @time_close is range

Daily Candle Bias Backtesting Stats @MaxMaserati This indicator, is a powerful backtesting and probability tool designed to quantify the "follow-through" of specific candle types across different market sessions.
It identifies specific price action setups and tracks whether price hits a "Target" (continuation) or an "Invalidation" (reversal) first, providing real-time win rates for your favorite sessions.
The Candle Bias Stats indicator automatically categorizes every candle based on the MMM candle bias and tracks their historical success rate. It calculates how often a candle's high/low is broken before its opposite end is touched. By breaking this data down into sessions (Asian, London, NY), it identifies high-probability "time-of-day" windows where specific price action setups are most reliable.
MMM CANDLE LOGIC
Bullish Expansion & Breakout Signatures
Bullish Body Close Plus (BuBC Plus): Represents strong bullish momentum where price closes above the previous high and near its own top, signaling that buyers are in complete control.
Bullish Body Close Minus (BuBC Minus): Indicates weak bullish momentum; while the price closes above the previous high, a long top wick shows sellers pushed back, suggesting a potential retest of the previous high.
Bearish Expansion & Breakout Signatures
Bearish Body Close Plus (BeBC Plus): A very strong bearish signal where price closes below the previous low and near its own bottom, indicating sellers are dominant.
Bearish Body Close Minus (BeBC Minus): Signifies weak bearish momentum; the price breaks the previous low but finishes with a long bottom wick as buyers push back, often leading to a retest of the old ceiling.
Bullish Reversal & Trap Signatures (Affinity)
Bullish Affinity Plus (BuAF Plus): A strong bullish reversal where a new low is made, but sellers hit a wall and get trapped, causing price to finish near its top with a long bottom wick.
Bullish Affinity Minus (BuAF Minus): A weak bullish bounce where a new low is made and price finishes back inside the previous range, but buyers lack the energy for a significant move.
Bearish Reversal & Trap Signatures (Affinity)
Bearish Affinity Plus (BeAF Plus): A strong bearish reversal; buyers are trapped after making a new high, and price finishes near its bottom with a long top wick.
Bearish Affinity Minus (BeAF Minus): A weak bearish drop where sellers stop the rise but lack the energy to push price significantly lower.
Neutral & Volatility Signatures
Close Inside Bullish (CI•BuAF): Bullish neutral state where price stays inside the previous candle’s range but finishes in the top half, indicating buyers are slightly more active.
Close Inside Bearish (CI•BeAF): Bearish neutral state where price remains inside the previous box and finishes in the bottom half.
Seek & Destroy Bullish (S&D•BuAF): Bullish volatility characterized by price moving above and below the previous candle before buyers win the battle and close price near the top.
Seek & Destroy Bearish (S&D•BeAF): Bearish volatility where sellers win a high-chaos battle, closing price near the bottom after sweeping both sides of the previous candle.
H4 CANDLE EXAMPLE
Deep Dive: Analysis of the 4H Statistics
The image presents a comprehensive backtest of 4,999 total candles from September 2022 to December 2025. Here is the breakdown of what the interface is telling us:
1. The Strategy: Target vs. Invalidation
The indicator tracks BuBC (Bullish Body Close) and BeBC (Bearish Body Close).
The Target: For a Bullish candle, the target is the High. For a Bearish candle, it is the Low.
The Invalidation: The opposite end of the candle (the Low for Bullish, the High for Bearish).
The Goal: To see which level is touched first in the subsequent bars.
2. Global Performance (The Top Right Table)
Looking at the BuBC (1402 samples) section:
Target First (67.8%): In nearly 7 out of 10 cases, once a 4H candle closes "bullish" (breaking the previous high), the price continues higher to break its own high before it ever returns to take out its own low.
Both Hit (17.7%): This is a critical metric. It represents "Stop Runs" or "Wicks" where price hits the target but also hits the invalidation within the same tracking period.
Efficiency (1.3 Bars): This tells us the "follow-through" is almost immediate. If the trade doesn't work within 1 or 2 candles, the statistical edge drops off significantly.
3. The Session Breakdown (The Bottom Left Table)
This is where the "Edge" is found. Not all hours of the day are created equal.
Asian Late (02:00-06:00) – The "Star" Performer: With a 72.9% Target rate, this is labeled "BEST." It has the lowest "Both%" (6.5%), meaning moves during these hours are incredibly "clean." If a setup forms here, price usually moves directly to the target without looking back.
London Open & Overlap (06:00-14:00): These sessions maintain a high win rate (approx. 70%). This suggests that the European session provides reliable trend continuation for the S&P 500.
NY Session (14:00-18:00) – The "Trap" Zone: This is labeled "WORST" for a reason. While the win rate is basically a coin flip (49.6%), the Both% spikes to 36.7%. This means that even if you are right about the direction, the market is highly likely to "sweep" your stop loss before going to the target. It is the most volatile and "fake-out" prone time for this specific setup.
Summary of the Data
The statistics show that the S&P 500 4H Candle Bias is a highly reliable trend-following indicator, provided you trade it at the right time.
The data suggests a clear three-step logic:
Directional Edge: Both Bullish and Bearish body closes have a natural ~67% probability of continuation.
Timing is Everything: Trading during the Late Asian and London sessions increases your probability of success to over 70% with very low risk of a "fake-out."
Risk Warning: Avoid "Body Close" breakout strategies during the NY Mid-day (14:00-18:00). The statistics prove that this window is dominated by "Seek and Destroy" price action, where price is mathematically likely to hit both your target and your stop, usually hitting the stop first.

Advanced Psychological Levels with Dynamic Spacing═══════════════════════════════════════
ADVANCED PSYCHOLOGICAL LEVELS WITH DYNAMIC SPACING
═══════════════════════════════════════
A comprehensive psychological price level indicator that automatically identifies and displays round number levels across multiple timeframes. Features dynamic ATR-based spacing, smart crypto detection, distance tracking, and customizable alert system.
───────────────────────────────────────
WHAT THIS INDICATOR DOES
───────────────────────────────────────
This indicator automatically draws psychological price levels (round numbers) that often act as support and resistance:
- Dynamic ATR-Based Spacing - Adapts level spacing to market volatility
- Multiple Level Types - Major (250 pip), Standard (100 pip), Mid, and Intraday levels
- Smart Asset Detection - Automatically adjusts for Forex, Crypto, Indices, and CFDs
- Crypto Price Adaptation - Intelligent level spacing based on cryptocurrency price magnitude
- Distance Information Table - Real-time percentage distance to nearest levels
- Combined Level Labels - Clear identification when multiple level types coincide
- Performance Optimized - Configurable visible range and label limits
- Comprehensive Alerts - Notifications when price crosses any level type
───────────────────────────────────────
HOW IT WORKS
───────────────────────────────────────
PSYCHOLOGICAL LEVELS CONCEPT:
Psychological levels are round numbers where traders tend to place orders, creating natural support and resistance zones. These include:
- Forex: 1.0000, 1.0100, 1.0050 (pips)
- Crypto: $100, $1,000, $10,000 (whole numbers)
- Indices: 10,000, 10,500, 11,000 (points)
Why They Matter:
- Traders naturally gravitate to round numbers
- Stop losses cluster at these levels
- Take profit orders concentrate here
- Institutional algorithmic trading often targets these levels
DYNAMIC ATR-BASED SPACING:
Traditional Method:
- Fixed spacing regardless of volatility
- May be too tight in volatile markets
- May be too wide in quiet markets
Dynamic Method (Recommended):
- Uses ATR (Average True Range) to measure volatility
- Automatically adjusts level spacing
- Tighter levels in low volatility
- Wider levels in high volatility
Calculation:
1. Calculate ATR over specified period (default: 14)
2. Multiply by ATR multiplier (default: 2.0)
3. Round to nearest psychological level
4. Generate levels at dynamic intervals
Benefits:
- Adapts to market conditions
- More relevant levels in all volatility regimes
- Reduces clutter in trending markets
- Provides more detail in ranging markets
LEVEL TYPES:
Major Levels (250 pip/point):
- Highest significance
- Primary support/resistance zones
- Color: Red (default)
- Style: Solid lines
- Spacing: 2.5x standard step
Standard Levels (100 pip/point):
- Secondary importance
- Common psychological barriers
- Color: Blue (default)
- Style: Dashed lines
- Spacing: Standard step
Mid Levels (50% between major):
- Optional intermediate levels
- Halfway between major levels
- Color: Gray (default)
- Style: Dotted lines
- Usage: Additional confluence points
Intraday Levels (sub-100 pip):
- For intraday traders
- Fine-grained precision
- Color: Yellow (default)
- Style: Dotted lines
- Only shown on intraday timeframes
SMART ASSET DETECTION:
Forex Pairs:
- Detects major currency pairs automatically
- Uses pip-based calculations
- Standard: 100 pips (0.0100)
- Major: 250 pips (0.0250)
- Intraday: 20, 50, 80 pip subdivisions
Cryptocurrencies:
- Automatic price magnitude detection
- Adaptive spacing based on price:
* Under $0.10: Levels at $0.01, $0.05
* $0.10-$1: Levels at $0.10, $0.50
* $1-$10: Levels at $1, $5
* $10-$100: Levels at $10, $50
* $100-$1,000: Levels at $100, $500
* $1,000-$10,000: Levels at $1,000, $5,000
* Over $10,000: Levels at $5,000, $10,000
Indices & CFDs:
- Fixed point-based system
- Major: 500 point intervals (with 250 sub-levels)
- Standard: 100 point intervals
- Suitable for stock indices like SPX, NASDAQ
COMBINED LEVEL LABELS:
When multiple level types coincide at the same price:
- Single line drawn (highest priority color)
- Combined label shows all types
- Priority: Major > Standard > Mid > Intraday
Example Label Formats:
- "1.1000 Major" - Major level only
- "1.1000 Std + Major" - Both standard and major
- "50000 Intra + Mid + Std" - Three levels coincide
Benefits:
- Cleaner chart appearance
- Clear identification of confluence
- Reduced visual clutter
- Easy to spot high-importance levels
DISTANCE INFORMATION TABLE:
Real-time tracking of nearest levels:
Table Contents:
- Nearest major level above (price and % distance)
- Nearest standard level above (price and % distance)
- Nearest standard level below (price and % distance)
Display:
- Top right corner (configurable)
- Color-coded by level type
- Real-time percentage calculations
- Helpful for position management
Usage:
- Identify proximity to key levels
- Set realistic profit targets
- Gauge potential move magnitude
- Monitor approaching resistance/support
ALERT SYSTEM:
Comprehensive crossing alerts:
Alert Types:
- Major Level Crosses
- Standard Level Crosses
- Intraday Level Crosses
Alert Modes:
- First Cross Only: Alert once when level is crossed
- All Crosses: Alert every time level is crossed
Alert Information:
- Level type crossed
- Specific price level
- Direction (above/below)
- One alert per bar to prevent spam
Configuration:
- Enable/disable by level type
- Choose alert frequency
- Customize for your trading style
───────────────────────────────────────
HOW TO USE
───────────────────────────────────────
INITIAL SETUP:
General Settings:
1. Enable "Use Dynamic ATR-Based Spacing" (recommended)
2. Set ATR Period (14 is standard)
3. Adjust ATR Multiplier (2.0 is balanced)
Visibility Settings:
1. Set Visible Range % (10% recommended for clarity)
2. Adjust Label Offset for readability
3. Configure performance limits if needed
Level Selection:
1. Enable/disable level types based on trading style
2. Adjust line counts for each type
3. Choose line styles and colors for visibility
TRADING STRATEGIES:
Breakout Trading:
1. Wait for price to approach major or standard level
2. Monitor for consolidation near level
3. Enter on confirmed break above/beyond level
4. Stop loss just beyond the broken level
5. Target: Next major or standard level
Rejection Trading:
1. Identify major psychological level
2. Wait for price to test the level
3. Look for rejection signals (wicks, bearish/bullish candles)
4. Enter in direction of rejection
5. Stop beyond the level
6. Target: Previous level or mid-level
Range Trading:
1. Identify range between two major levels
2. Buy at lower psychological level
3. Sell at upper psychological level
4. Use standard and mid-levels for position management
5. Exit if major level breaks with volume
Confluence Trading:
1. Look for combined levels (Std + Major)
2. These represent high-probability zones
3. Use as primary support/resistance
4. Increase position size at confluence
5. Expect stronger reactions at these levels
Session-Based Trading:
1. Note opening level at session start (Asian/London/NY)
2. Trade breakouts of major levels during high-volume sessions
3. London/NY sessions: More likely to break levels
4. Asian session: More likely to respect levels (range trading)
RISK MANAGEMENT WITH PSYCHOLOGICAL LEVELS:
Stop Loss Placement:
- Place stops just beyond psychological levels
- Add buffer (5-10 pips for forex)
- Avoid exact round numbers (stop hunting risk)
- Use previous major level as maximum stop
Take Profit Strategy:
- First target: Next standard level (partial profit)
- Second target: Next major level (remaining position)
- Trail stops to breakeven at first target
- Use distance table to calculate risk/reward
Position Sizing:
- Larger positions at major levels (higher probability)
- Smaller positions at intraday levels (lower probability)
- Scale in at standard levels between major levels
- Reduce size when multiple levels are close together
TIMEFRAME CONSIDERATIONS:
Higher Timeframes (4H, Daily, Weekly):
- Focus on Major and Standard levels only
- Disable Intraday and Mid levels
- Wider level spacing expected
- Use for swing trading and position trading
Lower Timeframes (5m, 15m, 1H):
- Enable all level types
- Use Intraday levels for precision
- Tighter level spacing acceptable
- Good for day trading and scalping
Multi-Timeframe Approach:
- Identify major levels on Daily/4H charts
- Refine entries using 15m/1H intraday levels
- Trade in direction of higher timeframe bias
- Use lower timeframe levels for position management
───────────────────────────────────────
CONFIGURATION GUIDE
───────────────────────────────────────
GENERAL SETTINGS:
Dynamic ATR-Based Spacing:
- Enabled: Recommended for most markets
- Disabled: Fixed psychological levels
- ATR Period: 14 (standard), 10 (responsive), 20 (smooth)
- ATR Multiplier: 1.0-5.0 (2.0 is balanced)
VISIBILITY SETTINGS:
Visible Range %:
- 5%: Very tight range, minimal clutter
- 10%: Balanced view (recommended)
- 20%: Wide range, more context
- 50%: Maximum range, all levels visible
Label Offset:
- 10-20 bars: Close to current price
- 30-50 bars: Moderate distance
- 50-100 bars: Far from price action
Performance Limits:
- Max Historical Bars: Reduce if indicator loads slowly
- Max Labels: Reduce for cleaner chart (20-30 recommended)
LEVEL CUSTOMIZATION:
Line Count:
- Lower (1-3): Cleaner chart, fewer levels
- Medium (4-6): Balanced view
- Higher (7-10): More context, busier chart
Line Styles:
- Solid: High importance, easy to see
- Dashed: Medium importance, clear but subtle
- Dotted: Low importance, minimal visual weight
Colors:
- Use contrasting colors for different level types
- Red/Blue/Yellow default works well
- Adjust based on chart background and personal preference
DISTANCE TABLE:
Position:
- Top Right: Doesn't interfere with price action
- Top Left: Good for right-side price scale
- Bottom positions: Less common but available
Colors:
- Default (white text, dark background) works for most charts
- Match your chart theme for consistency
- Ensure text is readable against background
ALERT CONFIGURATION:
Alert by Level Type:
- Major: Most important, fewer false signals
- Standard: Balance of frequency and importance
- Intraday: Many signals, best for active traders
Alert Frequency:
- First Cross Only: Cleaner, less noise (recommended for swing trading)
- All Crosses: Every touch, good for scalping
Alert Setup in TradingView:
1. Configure desired alert types in indicator settings
2. Right-click chart → Add Alert
3. Select this indicator
4. Choose "Any alert() function call"
5. Set delivery method (mobile, email, webhook)
───────────────────────────────────────
ASSET-SPECIFIC TIPS
───────────────────────────────────────
FOREX (EUR/USD, GBP/USD, etc.):
- Major levels at x.x000, x.x500
- Standard levels at x.xx00
- Intraday levels at 20/50/80 pips
- Most effective during London/NY sessions
- Watch for "figure" levels (1.0000, 1.1000)
CRYPTOCURRENCIES (BTC, ETH, etc.):
- Enable dynamic spacing for volatile markets
- Levels adjust automatically based on price
- Watch major $1,000 increments for BTC
- $100 levels important for ETH
- Smaller caps: Use standard levels
- High volatility: Increase ATR multiplier to 3.0
STOCK INDICES (SPX, NASDAQ, etc.):
- 100-point levels most important
- 500-point levels for major S/R
- 50-point mid-levels for refinement
- Watch end-of-day for level reactions
- Futures often lead spot on level breaks
GOLD/COMMODITIES:
- Major levels at $50 increments ($1,900, $1,950)
- Standard levels at $10 increments
- Very reactive to psychological levels
- Watch for false breaks during low volume
- Best reactions during active trading hours
───────────────────────────────────────
BEST PRACTICES
───────────────────────────────────────
Chart Setup:
- Use clean price action charts
- Avoid too many indicators
- Ensure psychological levels are clearly visible
- Match colors to your chart theme
Level Selection:
- Start with Major and Standard levels only
- Add Mid and Intraday as needed
- Less is more - avoid chart clutter
- Adjust based on timeframe
Combining with Other Tools:
- Volume profile for confluence
- Trendlines intersecting psychological levels
- Moving averages near round numbers
- Fibonacci levels coinciding with psychological levels
Common Mistakes to Avoid:
- Trading every level touch (be selective)
- Ignoring volume confirmation
- Setting stops exactly at levels (stop hunting)
- Forgetting to adjust for different assets
- Over-relying on levels without price action confirmation
Performance Optimization:
- Reduce visible range for faster loading
- Lower max historical bars on lower timeframes
- Limit labels to 30-50 for clarity
- Disable unused level types
───────────────────────────────────────
EDUCATIONAL DISCLAIMER
───────────────────────────────────────
This indicator identifies psychological price levels based on round numbers that tend to act as support and resistance. The methodology includes:
- Round number detection algorithms
- ATR-based dynamic spacing calculations
- Asset-specific level determination
- Distance percentage calculations
Psychological levels are a recognized concept in technical analysis, studied by traders and institutions. However, they do not guarantee price reactions and should be used as part of a comprehensive trading strategy including proper risk management, volume analysis, and price action confirmation.
───────────────────────────────────────
USAGE DISCLAIMER
───────────────────────────────────────
This tool is for educational and analytical purposes. Psychological levels can act as support or resistance but price reactions are not guaranteed. Dynamic spacing may generate different levels in different market conditions. Always conduct independent analysis, use proper risk management, and never risk capital you cannot afford to lose. Past performance does not indicate future results.
───────────────────────────────────────
CREDITS & ATTRIBUTION
───────────────────────────────────────
Original Concept: Sonar Lab

ATR by Session Library [1CG]Library "ATRxSession"
This library shows you how big the bars usually are during a trading session. It looks only at the times you choose (like New York or London hours), measures the “true range” of every bar in that session, then finds the average for that session. It keeps the last N sessions and gives you their overall average, so you can quickly see how much the market typically moves per bar during your chosen session.
Call getSessionAtr(timezone, session, sessionCount) from your script, and it will return a single number: the average per-bar volatility during the chosen session, based on the last N completed sessions. This makes it easy to plug session-specific volatility into your own indicators or strategies.
getSessionAtr(_timezone, _session, _sessionCount)
getSessionAtr - Computes a session-aware ATR over completed sessions.
Parameters:
_timezone (string) : (string) - Timezone string to evaluate session timing.
_session (string) : (string) - Session time range string (e.g., "0930-1600").
_sessionCount (int) : (int) - Number of past completed sessions to include in the rolling average.
Returns: (float) - The average ATR across the last N completed sessions, or na if not enough data.

Volume Profile (Simple)Simple Volume Profile (Simple)
Master the Market's Structure with a Clear View of Volume
by mercaderoaurum
The Simple Volume Profile (Simple) indicator removes the guesswork by showing you exactly where the most significant trading activity has occurred. By visualizing the Point of Control (POC) and Value Area (VA) for today and yesterday, you can instantly identify the price levels that matter most, giving you a critical edge in your intraday trading.
This tool is specifically optimized for day trading SPY on a 1-minute chart, but it's fully customizable for any symbol or timeframe.
Key Features
Multi-Day Analysis: Automatically plots the volume profiles for the current and previous trading sessions, allowing you to see how today's market is reacting to yesterday's key levels.
Automatic Key Level Plotting: Instantly see the most important levels from each session:
Point of Control (POC): The single price level with the highest traded volume, acting as a powerful magnet for price.
Value Area High (VAH): The upper boundary of the area where 50% of the volume was traded. It often acts as resistance.
Value Area Low (VAL): The lower boundary of the 50% value area, often acting as support.
Extended Levels: The POC, VAH, and VAL from previous sessions are automatically extended into the current day, providing a clear map of potential support and resistance zones.
Customizable Sessions: While optimized for the US stock market, you can define any session time and time zone, making it a versatile tool for forex, crypto, and futures traders.
Core Trading Strategies
The Simple Volume Profile helps you understand market context. Instead of trading blind, you can now make decisions based on where the market has shown the most interest.
1. Identifying Support and Resistance
This is the most direct way to use the indicator. The extended lines from the previous day are your roadmap for the current session.
Previous Day's POC (pPOC): This is the most significant level. Watch for price to react strongly here. It can act as powerful support if approached from above or strong resistance if approached from below.
Previous Day's VAH (pVAH): Expect this level to act as initial resistance. A clean break above pVAH can signal a strong bullish trend.
Previous Day's VAL (pVAL): Expect this level to act as initial support. A firm break below pVAL can indicate a strong bearish trend.
Example Strategy: If SPY opens and rallies up to the previous day's VAH and stalls, this is a high-probability area to look for a short entry, with a stop loss just above the level.
2. The "Open-Drive" Rejection
How the market opens in relation to the previous day's value area is a powerful tell.
Open Above Yesterday's Value Area: If the market opens above the pVAH, it signals strength. The first pullback to test the pVAH is often a key long entry point. The level is expected to flip from resistance to support.
Open Below Yesterday's Value Area: If the market opens below the pVAL, it signals weakness. The first rally to test the pVAL is a potential short entry, as the level is likely to act as new resistance.
3. Fading the Extremes
When price pushes far outside the previous day's value area, it can become overextended.
Reversal at Highs: If price rallies significantly above the pVAH and then starts to lose momentum (e.g., forming bearish divergence on RSI or a topping pattern), it could be an opportunity to short the market, targeting a move back toward the pVAH or pPOC.
Reversal at Lows: Conversely, if price drops far below the pVAL and shows signs of bottoming, it can be a good opportunity to look for a long entry, targeting a reversion back to the value area.
Recommended Settings (SPY Intraday)
These settings are the default and are optimized for scalping or day trading SPY on a 1-minute chart.
Value Area (%): 50%. This creates a tighter, more sensitive value area, perfect for identifying the most critical intraday zones.
Number of Rows: 1000. This high resolution is essential for a low-volatility instrument like SPY, ensuring that the profile is detailed and the levels are precise.
Session Time: 0400-1800 in America/New_York. This captures the full pre-market and core session, which is crucial for understanding the day's complete volume story.
Ready to trade with an edge? Add the Simple Volume Profile (Multi-Day) to your chart now and see the market in a new light!
