Session Highs and LowsThis indicator highlights the New York, London, and Asian trading sessions — plotting each session’s highs and lows directly on your chart to help visualize intraday ranges and liquidity levels.
⸻
✨ Features
• Session Range Visualization
Automatically marks the high and low of each trading session with colored lines.
This makes it easy to identify where price expanded, consolidated, or built liquidity during each market phase.
• Session Background Zones (Optional)
Toggle background fills to highlight active sessions for clearer visual separation of NY, London, and Asian trading hours.
• Customizable Settings
• Enable or disable each session independently
• Adjust session times and colors
• Choose whether to fill session backgrounds
• Timezone Aware
All sessions are aligned to New York time by default, ensuring consistent mapping across instruments.
⸻
🎯 Use Case
A perfect tool for traders who track session-based liquidity, breaks of structure, or session-to-session continuity.
Quickly spot the Asian range, London expansion, and New York reversal windows — key components in intraday strategy development.
⸻
⚙️ Inputs
• Toggle sessions: NY / London / Asian
• Background fill on/off
• Label color customization
• Adjustable session times
⸻
📈 Why Use It
Understanding where each session establishes its range high and low provides critical context for liquidity grabs, session overlaps, and structural shifts throughout the day.
This simple yet powerful visual map enhances precision for ICT-style, smart money, or price action-based trading models.
Search in scripts for "sessions"

Dual Session ORB S/R Lines Pro by Yendor_BShort description:
Clean opening-range breakout support/resistance lines for London and US sessions with confirmed breakout labels and alert-ready signals. UTC-based, adjustable start point, customizable styling, minimal clutter.
Detailed description:
What it does:
Captures the Opening Range (default first 15 minutes) for London and New York (US) sessions in UTC, plots the high and low as support/resistance lines, and marks confirmed breakouts when price closes beyond those levels. Lines can begin at either the range end or session start and persist for the configured session length.
Key Features:
ORB defined over the first N minutes after session open (configurable, default 15).
Two sessions: London and US (New York) with separate start times.
High/low support & resistance lines per session:
Selectable start point: Range End or Session Start.
Independently customizable color, width, and style (solid/dashed/dotted) for each high and low.
Confirmed breakout labels: only on the first candle that closes beyond the ORB high or low after the range completes (prior close must be inside).
Alerts and alertconditions for breakout long/short per session, usable in TradingView’s alert dialog.
Fully UTC-based. Works on any timeframe; 1-minute or 5-minute recommended for precision.
Minimal visual clutter; no persistent shaded boxes in this version.
Inputs explained:
ORB Duration (minutes): Length of the opening range used to calculate session high and low.
Session Length (hours): How long the S/R lines remain active (typically full session).
London / US Start (UTC): Session open times in UTC.
Line Start Point: Choose whether the lines begin at the range end or at the session start.
High/Low Styling: Independent color, thickness, and style for each session’s high and low.
Breakout Labels: Toggle one-time confirmed breakout annotations.
Alerts: Enable breakout alert messages.
Example workflows:
Monitor the first 15 minutes of the London session.
After the range, wait for a candle to close beyond the high or low for a confirmed breakout.
Use the label or alert to trigger entry logic (retest, continuation, etc.).
Repeat for the US session; compare overlaps for higher conviction.
Alert setup:
Open the Alerts panel. Choose one of the built-in alertconditions: London Breakout Long, London Breakout Short, US Breakout Long, US Breakout Short. Set frequency to Once Per Bar Close. Customize notification/webhook payload if automating.
Preset suggestions:
Standard London ORB: 15 minute range, lines from range end, green high / lime low.
Standard US ORB: 15 minute range, lines from range end, blue high / aqua low.
Overlap Bias: Both sessions active, lines start from session start, differentiated styles.
Tips & best practices:
Combine with external volume or volatility filters to reduce false breakouts. Use on correlated pairs to observe consistent session structure. Treat broken ORB levels as flipped support/resistance on revisit. Prefer confirmed closes beyond lines rather than wick touches.
Limitations / disclaimer:
Provides structural visualization and breakout signaling; does not guarantee profitability. Always apply proper risk management and confirm with additional context. Backtest settings before live use.
Tags:
#ORB #OpeningRangeBreakout #SessionTrading #LondonSession #NewYorkSession #SupportResistance #Breakout #Intraday #Pinev6 #TradingView #Forex #TrendStructure #Alerts #USD #EURUSD #TradingSignals #UTCBased #PriceAction #MarketStructure #IntradayBreakouts

Session Breakouts & Trend Indicator# Session Breakouts & Trend Indicator
This indicator identifies high-probability trading opportunities by tracking key intraday sessions and their breakouts while aligning them with the overall market trend direction.
## What Makes This Indicator Unique
Unlike standard breakout indicators that only identify when price crosses a threshold, this indicator:
- Dynamically identifies and tracks important daily sessions (default: AM 09:00-10:00 and PM 15:00-16:00)
- Determines trend direction using a triple EMA system (20/50/200)
- Shows when breakouts align with the overall trend (higher probability setups)
- Provides visual confirmation with session ranges, breakout levels, and background highlighting
- Includes a comprehensive information panel showing trend/session alignment
## How It Works
The indicator tracks two important daily sessions:
1. **AM Session**: Typically the first hour of trading (default: 09:00-10:00)
2. **PM Session**: Typically the last hour of trading (default: 15:00-16:00)
For each session, it:
- Marks the high and low range
- Establishes breakout levels above/below these ranges
- Detects when price breaks beyond these levels
- Determines if the breakout aligns with the prevailing trend
The trend is calculated using three EMAs (20, 50, 200) for reliable trend identification.
## How To Use
1. Apply the indicator to your chart (works best on 5-minute timeframes)
2. Adjust session times to match your trading schedule if needed
3. Watch for breakouts above session highs (bullish) or below session lows (bearish)
4. Check the information panel to see if the breakout aligns with the trend
5. Enter trades in the direction of trend-aligned breakouts for higher probability setups
6. Set stop losses below the opposite side of the session range
## Settings
- **Session Times**: Customize AM and PM session times
- **EMA Lengths**: Adjust trend determination sensitivity
- **Visualization Options**: Toggle display of sessions, breakouts, and VWAP
- **Alert Settings**: Configure alerts for breakouts and trend-aligned conditions
This indicator is valuable for day traders and swing traders looking for objective entry points with higher probability of success.

NYCSessionLibrary "NYCSession"
Library for New York trading session time functions
@author abneralvarado
@version 1.0
isInNYSession(sessionStart, sessionEnd)
Determines if the current bar is within New York trading session
Parameters:
sessionStart (simple int) : Starting time of NY session in 24hr format (HHMM) like 0930 for 9:30 AM ET
sessionEnd (simple int) : Ending time of NY session in 24hr format (HHMM) like 1600 for 4:00 PM ET
Returns: True if current bar is within the NY session time, false otherwise
getNYSessionStartTime(lookback, sessionStart)
Gets the start time of NY session for a given bar
Parameters:
lookback (simple int) : Bar index to check (0 is current bar)
sessionStart (simple int) : Starting time of NY session in 24hr format (HHMM)
Returns: Unix timestamp for the start of NY session on the given bar's date
getNYSessionEndTime(lookback, sessionEnd)
Gets the end time of NY session for a given bar
Parameters:
lookback (simple int) : Bar index to check (0 is current bar)
sessionEnd (simple int) : Ending time of NY session in 24hr format (HHMM)
Returns: Unix timestamp for the end of NY session on the given bar's date
isNYSessionOpen(sessionStart)
Checks if current bar opens the NY session
Parameters:
sessionStart (simple int) : Starting time of NY session in 24hr format (HHMM)
Returns: True if current bar marks the session opening, false otherwise
isNYSessionClose(sessionEnd)
Checks if current bar closes the NY session
Parameters:
sessionEnd (simple int) : Ending time of NY session in 24hr format (HHMM)
Returns: True if current bar marks the session closing, false otherwise
isWeekday()
Determines if the current day is a weekday (Mon-Fri)
Returns: True if current bar is on a weekday, false otherwise
getSessionBackgroundColor(sessionStart, sessionEnd, bgColor)
Gets session background color with transparency
Parameters:
sessionStart (simple int) : Starting time of NY session in 24hr format (HHMM)
sessionEnd (simple int) : Ending time of NY session in 24hr format (HHMM)
bgColor (color) : Background color for session highlighting
Returns: Color value for background or na if not in session

ICT Session by LasinsName: ICT Session by Lasins
Purpose: To visually identify and differentiate between the Asian, London, and New York trading sessions on the chart.
Features:
Highlights the background of the chart during each session.
Includes a mini dashboard in the top-right corner to show the active session.
Allows customization of time zones (exchange timezone or UTC).
Displays copyright and author information.
Key Components
Inputs:
useExchangeTimezone: A boolean input to toggle between using the exchange timezone or UTC for session times.
showDashboard: A boolean input to toggle the visibility of the mini dashboard.
Session Times:
The script defines three trading sessions:
Asian Session: 2000-0000 UTC (or adjusted for exchange timezone).
London Session: 0200-0500 UTC (or adjusted for exchange timezone).
New York Session: 0700-1000 UTC (or adjusted for exchange timezone).
Session Detection:
The is_session function checks if the current time falls within a specified session using the time function.
Background Coloring:
The bgcolor function is used to highlight the chart background during each session:
Asian Session: Red background.
London Session: Green background.
New York Session: Blue background.
Mini Dashboard:
A table is created in the top-right corner of the chart to display the active session and its corresponding color.
The dashboard includes:
A header row with "Session" and "Color".
Rows for each session (Asian, London, New York) with their respective colors.
Copyright and Author Information:
A label is added to the chart to display the copyright and author information ("© ICT Session by Lasins Raj").
How It Works
The script checks the current time and compares it to the predefined session times.
If the current time falls within a session, the chart background is highlighted with the corresponding color.
The mini dashboard updates to reflect the active session.
The copyright and author information is displayed at the bottom of the chart.
Customization
You can adjust the session times in the script to match your preferred timezone or trading hours.
The useExchangeTimezone input allows you to switch between UTC and the exchange timezone.
The showDashboard input lets you toggle the visibility of the mini dashboard.
Example Use Case
Traders who follow the ICT (Inner Circle Trader) methodology can use this indicator to identify key trading sessions and plan their trades accordingly.
The visual representation of sessions helps traders quickly recognize when major markets are open and active.

SAT_BACKTEST @description TODO: Regroupement of useful functionsLibrary "SAT_BACKTEST"
ex_timezone(tz)
switch case return exact @timezone for timezone input
Parameters:
tz (simple string)
Returns: syminfo.timezone or tz
if_in_date_range(usefromDate, fromDate, usetoDate, toDate, src_timezone, dst_timezone)
if_in_date_range : check if @time_close is range
Parameters:
usefromDate (simple bool)
fromDate (simple int)
usetoDate (simple bool)
toDate (simple int)
src_timezone (simple string)
dst_timezone (simple string)
Returns: true if @time_close is range
if_in_session(useSessionStart, sessionStartHour, sessionStartMinute, useSessionEnd, sessionEndHour, sessionEndMinute, useSessionDay, mon, tue, wed, thu, fri, sat, sun, src_timezone, dst_timezone)
if_in_session : check if @time_close is range
Parameters:
useSessionStart (simple bool)
sessionStartHour (simple int)
sessionStartMinute (simple int)
useSessionEnd (simple bool)
sessionEndHour (simple int)
sessionEndMinute (simple int)
useSessionDay (simple bool)
mon (simple bool)
tue (simple bool)
wed (simple bool)
thu (simple bool)
fri (simple bool)
sat (simple bool)
sun (simple bool)
src_timezone (simple string)
dst_timezone (simple string)
Returns: true if @time_close is range

Forex Session Volume ExplorerFigure out the best time to trade your favorite Currency Pair, Commodity, or Crypto!
This indicator is an exploration of how Forex Sessions affect volume. The colored plots below represent the accumulative volume during each of the four major trading sessions: London, New York, Tokyo, and Sydney.
Plots have been normalized as a percentage of total volume, i.e. London = 34.2 signifies that 34.2% of all volume occurs during the London Session.
Trading the session with the highest volume will greatly benefit your Win Rate, especially when using "typical" indicators and strategies.
Use in conjunction with my previous tool for a clean & customizable visual representation of Forex Sesssions:
Forex Trading Sessions
Cheers,
EFX (@DasanC)

SMC Alpha Engine [PhenLabs]📊 SMC Alpha Engine
Version: PineScript™ v6
📌 Description
The SMC Alpha Engine is a comprehensive Smart Money Concepts indicator that automates institutional trading pattern recognition. Built for traders who understand that confluence is king, this indicator stacks multiple SMC elements together and scores them in real-time, allowing you to focus exclusively on high-probability setups.
Rather than manually tracking HTF bias, market structure, liquidity levels, order blocks, and fair value gaps separately, the SMC Alpha Engine consolidates everything into a unified scoring system. When enough factors align, you get a signal. When they don’t, you wait. This systematic approach removes emotion and subjectivity from SMC trading.
The indicator is designed around one core principle: only trade when the probabilities are stacked in your favor. By requiring multiple confluence factors before generating signals, it filters out the noise and keeps you focused on setups that institutional traders actually care about.
🚀 Points of Innovation
Automated confluence scoring system that evaluates 6 distinct SMC factors in real-time
HTF-to-LTF bias alignment ensuring trades flow with institutional direction
Intelligent liquidity sweep detection using wick-ratio analysis for confirmation
ATR-based FVG quality filtering that eliminates noise and shows only significant imbalances
Anti-spam signal logic preventing overtrading during volatile market conditions
Session-aware killzone integration timing entries with institutional activity windows
🔧 Core Components
HTF Bias Engine: Analyzes higher timeframe swing structure to establish directional bias using pivot high/low comparisons
Market Structure Module: Detects BOS (Break of Structure) and CHoCH (Change of Character) with real-time confirmation
Premium/Discount Calculator: Dynamically maps price zones relative to recent swing range equilibrium
Liquidity Tracker: Monitors swing points as liquidity targets and identifies sweep events with rejection confirmation
POI Detector: Identifies valid Order Blocks with displacement requirements and Fair Value Gaps with ATR filtering
Confluence Scorer: Aggregates all factors into bull/bear scores displayed on real-time dashboard
🔥 Key Features
Multi-timeframe analysis combining HTF directional bias with LTF precision entries
Customizable confluence threshold from 1 (low filter) to 5 (sniper mode)
Three killzone sessions: London (02:00-05:00), NY AM (08:30-11:00), NY PM (13:30-16:00)
Flexible mitigation options for OBs and FVGs: Wick, Close, 50%, or None
Visual structure labeling for BOS and CHoCH events on chart
Real-time info dashboard showing all current market conditions and scores
Built-in alert conditions for BOS, liquidity sweeps, and high-confluence signals
🎨 Visualization
Premium Zone: Red-tinted box above equilibrium indicating sell-side interest areas
Discount Zone: Green-tinted box below equilibrium indicating buy-side interest areas
Equilibrium Line: Dotted gray line marking the 50% level of current range
Order Blocks: Color-coded boxes (green for bullish, red for bearish) showing institutional candles
Fair Value Gaps: Teal boxes for bullish FVGs, maroon boxes for bearish FVGs
Killzone Backgrounds: Blue (London), Orange (NY AM), Purple (NY PM) session highlighting
Info Table: Top-right dashboard displaying HTF bias, LTF trend, zone, killzone status, and scores
📖 Usage Guidelines
HTF Settings
HTF Timeframe - Default: 60 - Controls higher timeframe for directional bias
HTF Swing Length - Default: 10, Range: 3+ - Determines pivot sensitivity for HTF trend
Market Structure Settings
LTF Swing Length - Default: 3, Range: 1-10 - Controls swing detection sensitivity
Show BOS/CHoCH - Default: Off - Toggles structure labels on chart
Show Strong/Weak Points - Default: Off - Displays swing point classifications
POI Settings
Show Valid Order Blocks - Default: Off - Displays OBs that caused displacement
Show Unmitigated FVGs - Default: On - Shows active fair value gaps
Filter FVG by ATR - Default: On - Only shows FVGs larger than 0.5x ATR
OB Mitigation Type - Options: Wick, Close, None - Determines when OBs are invalidated
FVG Mitigation Type - Options: Wick, Close, 50%, None - Determines when FVGs are filled
Confluence Settings
Minimum Score for Signal - Default: 4, Range: 1-5 - Required confluence level for entries
Show Entry Signals - Default: On - Toggles LONG/SHORT labels on chart
✅ Best Use Cases
Trend continuation trades during active killzone sessions with HTF alignment
Discount zone entries on bullish HTF bias with recent liquidity sweep below
Premium zone shorts on bearish HTF bias after liquidity grab above recent highs
Reversal identification following CHoCH with POI confluence in optimal zone
Filtering existing strategy signals by requiring minimum confluence score
⚠️ Limitations
HTF bias detection requires sufficient price history for accurate pivot identification
Liquidity sweep detection depends on wick-ratio settings and may miss some events
Order blocks require displacement confirmation which may exclude some valid zones
Confluence scoring is probabilistic and does not guarantee profitable outcomes
Killzone times are based on EST/EDT and require timezone adjustment for other regions
Signal spam prevention may delay valid signals by up to 10 bars after previous signal
💡 What Makes This Unique
Unified SMC Framework: Combines all major SMC concepts into one cohesive indicator rather than requiring multiple tools
Objective Scoring System: Removes subjectivity by quantifying confluence into measurable scores
Institutional Timing Integration: Built-in killzone awareness ensures signals align with high-volume sessions
Quality Filtering: ATR-based FVG filtering and displacement-required OBs eliminate low-quality setups
Anti-Overtrading Logic: Smart signal spacing prevents emotional trading during choppy conditions
🔬 How It Works
Step 1: HTF Bias Determination
Analyzes higher timeframe pivot highs and lows
Compares consecutive pivots to identify HH/HL (bullish) or LH/LL (bearish) sequences
Establishes directional filter that all signals must respect
Step 2: LTF Structure Mapping
Detects swing points on execution timeframe
Identifies BOS when price closes beyond confirmed swing level
Recognizes CHoCH when structure break occurs against current trend
Step 3: Confluence Calculation
Awards +1 for HTF bias alignment
Awards +1 for active killzone timing
Awards +1 for optimal zone positioning (discount for longs, premium for shorts)
Awards +1 for price at unmitigated POI
Awards +1 for recent liquidity sweep in trade direction
Awards +1 for recent supportive structure break
Step 4: Signal Generation
Compares total score against user-defined minimum threshold
Requires candle confirmation (bullish close for longs, bearish close for shorts)
Applies 10-bar spacing filter to prevent signal clustering
💡 Note:
This indicator is designed for traders already familiar with Smart Money Concepts. While it automates detection and scoring, understanding why each factor matters will significantly improve your ability to filter signals and manage trades effectively. Use the minimum confluence setting to match your risk tolerance, higher values mean fewer but higher-quality signals.

4H Candle Curves4H Candle Curves - Detailed User Guide
OVERVIEW
This indicator reveals curve vs continuation behavior in NQ Futures by analyzing how price responds after breaking the first-hour range. Based on 10+ years of statistical analysis (2013-2025, 3,136+ trading days), it identifies which 4-hour sessions exhibit mean reversion (curve) behavior versus trend continuation when Q2 (second hour) breaks Q1 (first hour) extremes.
⚠️ IMPORTANT: This indicator is specifically designed for NQ FUTURES ONLY. All curve probabilities and statistics were derived from a decade-long dataset of NQ 1-minute bars. Using this on other instruments will produce inaccurate results.
CORE CONCEPT: THE CURVE
What is a "Curve"?
A curve occurs when price breaks out of the first hour's range in Q2 (hour 2), but then reverses direction in the second half (Q3+Q4) to make a new extreme on the opposite side.
Curve Example (Upside Break → Downside Reversal):
Q1 (Hour 1): Price establishes range 25,000 - 25,050
Q2 (Hour 2): Price breaks ABOVE Q1 high, reaches 25,100
Q3+Q4 (Hours 3-4): Price curves back down, makes new LOW below 25,000
Result: Q2 broke high, but second half curved back to make new low below Q1 = CURVE
What is "Continuation"?
Continuation occurs when Q2 breaks Q1 range and the second half extends further in the same direction.
Continuation Example (Upside Break → Further Upside):
Q1 (Hour 1): Price establishes range 25,000 - 25,050
Q2 (Hour 2): Price breaks ABOVE Q1 high, reaches 25,100
Q3+Q4 (Hours 3-4): Price continues higher, makes new HIGH above 25,100
Result: Q2 broke high, second half made new high above Q2 = CONTINUATION
THE CRITICAL DISCOVERY: 6AM IS THE CURVE SESSION
Curve Probabilities by Session:
When Q2 Breaks Q1 HIGH:
6AM: 60.6% curve (new low below Q1) | 38.5% continuation
2AM: 38.4% curve | 46.7% continuation (balanced)
10AM: 17.2% curve | 60.4% continuation ← STRONG continuation bias
6PM: 29.6% curve | 59.0% continuation
10PM: 27.5% curve | 55.1% continuation
When Q2 Breaks Q1 LOW:
6AM: 64.4% curve (new high above Q1) | 35.0% continuation ← HIGHEST curve
2AM: 42.8% curve | 43.3% continuation (balanced)
10AM: 16.7% curve | 51.6% continuation ← STRONG continuation bias
6PM: 33.7% curve | 51.1% continuation
10PM: 33.1% curve | 48.6% continuation
Key Insight:
6AM is THE ONLY SESSION with >60% curve probability in both directions. This makes it a uniquely exploitable mean reversion session. When Q2 breaks Q1 range during 6AM, expect the second half to curve back 60-64% of the time.
10AM shows the opposite: Strong continuation bias (60% when Q2 breaks high, 52% when Q2 breaks low). 10AM breakouts tend to follow through.
HOW IT WORKS: THE QUARTER SYSTEM
The Six 4-Hour Candles (EST):
Each trading day (6pm-5pm) is divided into six 4-hour periods:
6PM (18:00-22:00) - Evening/Globex open | Blue box
10PM (22:00-02:00) - Asia session | Purple box
2AM (02:00-06:00) - Early London | Orange box
6AM (06:00-10:00) - Late London + NY Open | Green box ← THE CURVE SESSION
10AM (10:00-14:00) - NY Morning | Red box ← THE CONTINUATION SESSION
2PM (14:00-17:00) - NY Afternoon | Yellow box (3 hours only)
The Four Quarters:
Each 4-hour candle (except 2PM) is divided into four 1-hour quarters:
Q1 (Hour 1, minutes 0-60): Establishes initial range
Q2 (Hour 2, minutes 60-120): Tests Q1 range - breaks or holds?
Q3 (Hour 3, minutes 120-180): Second half begins
Q4 (Hour 4, minutes 180-240): Second half completes
2PM candle only has 3 hours (14:00-17:00), so quarters are adjusted accordingly.
The Three-Step Analysis:
STEP 1: Q1 Establishes Range
The first hour sets the high and low for the session. This becomes the reference range.
STEP 2: Q2 Break Detection
The indicator monitors whether Q2 (hour 2) breaks above Q1 high or below Q1 low.
STEP 3: Second Half Response
Once Q2 breaks Q1 range, the indicator tracks what happens in Q3+Q4:
Does price CURVE back to make new extreme on opposite side?
Does price CONTINUE to make new extreme in same direction?
Or does price stay within the established range?
VISUAL ELEMENTS EXPLAINED
1. 4-Hour Candle Boxes
Colored boxes display the high-to-low range of each 4H candle:
Blue = 6PM (evening session start)
Purple = 10PM (Asia session)
Orange = 2AM (early London)
Green = 6AM ← THE CURVE SESSION (watch for mean reversion)
Red = 10AM ← THE CONTINUATION SESSION (trend follow-through)
Yellow = 2PM (afternoon close, 3 hours only)
2. Quarter Separator Lines
Vertical dotted lines mark the boundaries between quarters (1H, 2H, 3H marks). This helps you see:
When Q1 ends (after 1 hour)
When Q2 ends / second half begins (after 2 hours)
When Q3 ends (after 3 hours)
3. Candle Name Labels
At the 2-hour mark (Q2/Q3 boundary), a label shows:
Candle name (e.g., "6am")
Directional indicator:
🔼 = Q2 broke Q1 HIGH
🔽 = Q2 broke Q1 LOW
⚠️ = Q2 broke BOTH Q1 high and low (extended range)
No symbol = Q2 stayed within Q1 range
THE LIVE STATUS TABLE
Located in your chosen corner (default: bottom-right), this table shows real-time analysis of the current 4H candle.
Header Row:
"LIVE: CANDLE" - Shows which 4H session you're currently in
Quarter Row:
"Quarter: Q1/Q2/Q3/Q4 (Hour X)" - Shows which quarter you're currently forming
STATUS Section:
The status updates dynamically based on what has happened:
During Q1-Q2 (First Half):
"⏳ Q1 Building..." - First hour forming, range being established
"⏳ Q2 Building..." - Second hour in progress, Q2 within Q1 range so far
"🔼 Q2 Broke Q1 HIGH" - Q2 has broken above Q1 high
"🔽 Q2 Broke Q1 LOW" - Q2 has broken below Q1 low
"⚠️ Q2 Broke BOTH Q1 Extremes" - Q2 extended range in both directions
During Q3-Q4 (Second Half):
"✓ CURVE CONFIRMED" - Q2 broke one direction, second half reversed to opposite side
"✓ CONTINUATION CONFIRMED" - Q2 broke one direction, second half extended further same direction
"⏳ 2nd Half In Progress" - Q2 broke Q1, waiting to see if curve or continuation
"📊 No Q2 Break Occurred" - Q2 stayed within Q1 range (no curve/continuation setup)
EXPECTATION Section:
Shows the probabilities based on the current state:
When Q2 breaks Q1 high in 6AM:
EXPECT 2nd half:
CURVE (low < Q1): 60.6%
CONT (high > Q2): 38.5%
This tells you there's a 60.6% chance the second half will curve back to make a new low below Q1, versus 38.5% chance it continues higher above Q2.
When curve/continuation is confirmed:
Q2 broke high → 2nd half made new LOW below Q1
Curve: 60.6%
Shows what actually happened and the historical probability.
Color Coding:
Purple background = Curve confirmed (mean reversion occurred)
Green background = Continuation confirmed (upside extension)
Red background = Continuation confirmed (downside extension)
Blue background = Second half in progress, watching
Yellow background = No Q2 break (no setup)
Gray background = Still in first half, building
THE CURVE REFERENCE TABLE
Located in your chosen corner (default: bottom-left), this table provides a quick reference for all sessions.
Table Structure:
TOP SECTION: "When Q2 BREAKS Q1 HIGH"
BOTTOM SECTION: "When Q2 BREAKS Q1 LOW"
How to Read:
"Curve" column = % of time second half makes new extreme on OPPOSITE side
"Cont" column = % of time second half makes new extreme in SAME direction
"Winner" column = Which behavior is more likely
Purple highlight = Curve is the winner (higher %)
Blue highlight = Continuation is the winner
🔥 symbol = Strong edge (>60%)
Quick Reference Usage:
You're in 10AM session, Q2 just broke Q1 high. Look at top section, 10AM row:
Curve: 17.2%
Cont: 60.4%
Winner: CONT
Interpretation: 10AM breakouts tend to follow through. Only 17% chance of curving back. Trade with the break, not against it.
PRACTICAL TRADING EXAMPLES
Example 1: Perfect 6AM Curve Setup
Scenario:
6AM candle in progress
7:00 AM: Q1 ends, range is 18,000 - 18,050
7:30 AM: Price breaks above 18,050, reaches 18,075 (Q2 broke Q1 high)
Live table shows: "🔼 Q2 Broke Q1 HIGH"
Expectation: "CURVE (low < Q1): 60.6%"
Trading Decision:
Even though price broke to new highs, the 60.6% curve probability suggests looking for short opportunities expecting price to curve back below 18,000 in Q3-Q4.
Typical Outcome:
8:15 AM (Q3): Price starts declining
9:15 AM (Q4): Price makes new low at 17,990
Result: ✓ CURVE CONFIRMED
Example 2: 10AM Continuation Signal
Scenario:
10AM candle in progress
11:00 AM: Q1 ends, range is 18,100 - 18,150
11:45 AM: Price breaks above 18,150, reaches 18,180 (Q2 broke Q1 high)
Live table shows: "🔼 Q2 Broke Q1 HIGH"
Expectation: "CONT (high > Q2): 60.4%"
Trading Decision:
With 60.4% continuation probability, breakout likely to follow through. Look for long opportunities expecting extension above 18,180 in Q3-Q4.
Typical Outcome:
12:30 PM (Q3): Price continues higher to 18,200
1:15 PM (Q4): Price makes new high at 18,225
Result: ✓ CONTINUATION CONFIRMED
Example 3: Using Reference Table During Live Trading
You see Q2 breaking Q1 low during 2AM session:
Quick reference check:
2AM row, "When Q2 BREAKS Q1 LOW" section
Curve: 42.8% | Cont: 43.3% | Winner: Balanced
Interpretation: This is a coin flip - 2AM session is balanced when Q2 breaks low. Don't force a directional bias. Wait for second half price action confirmation or skip the setup.
Example 4: No Setup Scenario
Scenario:
6AM candle, Q2 ends at 8:00 AM
Q2 stayed within Q1 range (no break above or below)
Live table shows: "📊 No Q2 Break Occurred"
Trading Decision:
No curve/continuation setup exists. This analysis only applies when Q2 breaks Q1 range. Monitor for different strategies or wait for next 4H candle.
UNDERSTANDING THE UNDERLYING METHODOLOGY
Data Foundation:
Instrument: NQ Futures (E-mini NASDAQ-100)
Timeframe: 1-minute bars for precise quarter tracking
Period: January 2013 - December 2025
Sample: 3,136+ complete trading days
Total 4H Candles Analyzed: ~18,800+ individual sessions
Analysis Process:
For each 4H candle in the dataset:
Calculate Q1 high and low (first hour range)
Track whether Q2 breaks Q1 high, Q1 low, both, or neither
When Q2 breaks Q1 range, measure second half response:
Did Q3+Q4 make new low below Q1? (curve when Q2 broke high)
Did Q3+Q4 make new high above Q1? (curve when Q2 broke low)
Did Q3+Q4 make new high above Q2? (continuation when Q2 broke high)
Did Q3+Q4 make new low below Q2? (continuation when Q2 broke low)
Calculate percentages for each session
Why NQ-Specific?
Different futures contracts exhibit different intraday personality:
NQ (NASDAQ):
Tech-heavy, volatility-prone
6AM shows extreme curve behavior (60-64%) due to NY Open reversal tendency
10AM shows strong continuation (60%) as trends establish
ES (S&P 500) would show different probabilities because:
Lower volatility than NQ
Different institutional participation patterns
Different response to macro events
The indicator's probabilities are calibrated specifically to NQ behavior patterns. Using it on ES, RTY, or other instruments will produce misleading signals.
ORIGINALITY & INNOVATION
What Makes This Indicator Unique:
Quarter-Based Curve Analysis: Unlike traditional indicators that only identify breakouts, this tracks what happens after the breakout. The curve vs continuation framework is novel and provides directional edge.
Session-Specific Behavior: Recognizes that 6AM behaves fundamentally differently than 10AM. Most indicators apply the same logic across all sessions. This indicator provides session-specific probabilities.
Statistical Validation: Every probability shown is backed by 10+ years of data (2,900+ candles per session). Not based on theory or discretionary observation.
Real-Time Quarter Tracking: Precisely identifies which quarter you're in and what stage of the pattern is forming. Provides forward-looking probabilities based on current state.
The 6AM Discovery: The 60-64% curve probability in 6AM is a quantified, repeatable edge that contradicts traditional "breakout = continuation" assumptions. This session exhibits mean reversion characteristics that most traders miss.
Dual-Direction Analysis: Tracks both upside breaks (Q2 > Q1 high) and downside breaks (Q2 < Q1 low) separately, as they can have different probabilities.
Visual Quarter System: The combination of colored boxes, quarter separators, and real-time labels provides instant visual understanding of pattern stage and expected behavior.
HOW TO USE THIS INDICATOR
Step 1: Identify Current 4H Candle
Check which colored box you're in and what session it represents.
Step 2: Wait for Q2 to Complete
The setup doesn't exist until Q2 (hour 2) breaks Q1 range. Monitor the live table.
Step 3: Check Q2 Break Status
Did Q2 break Q1 high? Q1 low? Both? Or neither?
Step 4: Consult Reference Table
Look up current session in curve reference table. What's the probability?
Step 5: Apply Session-Specific Strategy
For 6AM (60-64% curve):
Q2 breaks high → Expect curve back for new low
Q2 breaks low → Expect curve back for new high
Strategy: FADE the Q2 break, look for reversal entries in Q3-Q4
For 10AM (52-60% continuation):
Q2 breaks high → Expect continuation higher
Q2 breaks low → Expect continuation lower
Strategy: TRADE WITH the Q2 break, look for continuation entries in Q3-Q4
For 2AM (38-43% curve, 43-47% continuation):
Balanced probabilities
Strategy: Wait for Q3 price action to confirm direction, or skip
For 6PM/10PM (50-59% continuation):
Moderate continuation bias
Strategy: Lean with the break but use tight stops
Step 6: Monitor Live Status
Watch the live table for confirmation:
"✓ CURVE CONFIRMED" = Mean reversion occurred
"✓ CONTINUATION CONFIRMED" = Follow-through occurred
"⏳ 2nd Half In Progress" = Still developing
BEST PRACTICES
Focus on 6AM for curve trades - This is THE high-probability mean reversion session
Focus on 10AM for continuation trades - This is THE high-probability breakout session
Be cautious with 2AM - Balanced probabilities mean lower edge
Use quarter separators - Enter trades early in Q3 after Q2 break, don't wait for Q4
Combine with price action - Don't blindly fade 6AM or follow 10AM; wait for confirming price structure
Respect the 60% rule - 6AM curve happens 60% of time, which means 40% it doesn't. Manage risk accordingly
Watch for "No Q2 Break" - If Q2 doesn't break Q1, this analysis doesn't apply
Consider overnight context - If 6AM opens with huge gap, curve probability may be affected
SETTINGS & CUSTOMIZATION
Display Settings:
Show 4H Candle Boxes - Toggle colored range boxes
Box Colors - Customize color for each session
Show Quarter Separators - Show/hide 1H, 2H, 3H lines
Show Candle Name Labels - Show/hide session labels at 2H mark
Separator Line Style - Solid/Dashed/Dotted
Max Historical Candles - How many past 4H candles to display (1-50)
Table Settings:
Show Live Status Table - Toggle real-time analysis table
Show Curve Reference Table - Toggle probability reference table
Table Positions - Place tables in any corner
Table Text Size - Tiny/Small/Normal
LIMITATIONS & DISCLAIMERS
NQ FUTURES ONLY - All probabilities are NQ-specific, do not use on other instruments
Requires Q2 break - No curve/continuation setup exists if Q2 stays within Q1 range
Probabilities, not certainties - 60% means it happens 6 out of 10 times, not every time
Lower timeframe noise - 1-minute tracking can be choppy, consider using 5min+ for entries
Gap days - Large overnight gaps may affect curve/continuation probabilities
Not standalone - Use as confluence with your strategy, not as sole decision factor
Historical performance - Past statistics don't guarantee future results
WHY THE CURVE CONCEPT MATTERS
Traditional trading wisdom says: "Breakout = Continuation"
This indicator proves that's not always true. Specifically, during the 6AM session (late London + NY Open), when Q2 breaks the Q1 range, price curves back to the opposite extreme 60-64% of the time.
This creates a unique exploitable edge:
Most breakout traders go LONG when Q2 breaks Q1 high
But in 6AM, 60.6% of the time, price curves back down for new low
Shorting the breakout (counter-intuitive) is the higher-probability trade
The 10AM session shows the opposite:
Breakouts in 10AM tend to follow through (52-60%)
Traditional "trade the breakout" strategy works better here
By knowing which session you're in, you can adapt your strategy to match the session's personality.
FINAL NOTES
This indicator distills 10+ years of NQ intraday behavior into actionable, session-specific probabilities. The discovery that 6AM exhibits 60-64% curve behavior while 10AM exhibits 52-60% continuation behavior provides a statistical edge for mean reversion and trend-following traders respectively.
The highest-probability setups:
6AM Q2 break → FADE (60-64% edge for curve)
10AM Q2 break → FOLLOW (52-60% edge for continuation)
2AM = SKIP (balanced probabilities, no clear edge)
Master the 6AM curve and 10AM continuation first. These two sessions provide the clearest statistical edges.
Remember: Trade with proper risk management. This tool provides probabilities based on historical behavior, not predictions of future performance.

Daily Candle Bias Backtesting Stats @MaxMaserati This indicator, is a powerful backtesting and probability tool designed to quantify the "follow-through" of specific candle types across different market sessions.
It identifies specific price action setups and tracks whether price hits a "Target" (continuation) or an "Invalidation" (reversal) first, providing real-time win rates for your favorite sessions.
The Candle Bias Stats indicator automatically categorizes every candle based on the MMM candle bias and tracks their historical success rate. It calculates how often a candle's high/low is broken before its opposite end is touched. By breaking this data down into sessions (Asian, London, NY), it identifies high-probability "time-of-day" windows where specific price action setups are most reliable.
MMM CANDLE LOGIC
Bullish Expansion & Breakout Signatures
Bullish Body Close Plus (BuBC Plus): Represents strong bullish momentum where price closes above the previous high and near its own top, signaling that buyers are in complete control.
Bullish Body Close Minus (BuBC Minus): Indicates weak bullish momentum; while the price closes above the previous high, a long top wick shows sellers pushed back, suggesting a potential retest of the previous high.
Bearish Expansion & Breakout Signatures
Bearish Body Close Plus (BeBC Plus): A very strong bearish signal where price closes below the previous low and near its own bottom, indicating sellers are dominant.
Bearish Body Close Minus (BeBC Minus): Signifies weak bearish momentum; the price breaks the previous low but finishes with a long bottom wick as buyers push back, often leading to a retest of the old ceiling.
Bullish Reversal & Trap Signatures (Affinity)
Bullish Affinity Plus (BuAF Plus): A strong bullish reversal where a new low is made, but sellers hit a wall and get trapped, causing price to finish near its top with a long bottom wick.
Bullish Affinity Minus (BuAF Minus): A weak bullish bounce where a new low is made and price finishes back inside the previous range, but buyers lack the energy for a significant move.
Bearish Reversal & Trap Signatures (Affinity)
Bearish Affinity Plus (BeAF Plus): A strong bearish reversal; buyers are trapped after making a new high, and price finishes near its bottom with a long top wick.
Bearish Affinity Minus (BeAF Minus): A weak bearish drop where sellers stop the rise but lack the energy to push price significantly lower.
Neutral & Volatility Signatures
Close Inside Bullish (CI•BuAF): Bullish neutral state where price stays inside the previous candle’s range but finishes in the top half, indicating buyers are slightly more active.
Close Inside Bearish (CI•BeAF): Bearish neutral state where price remains inside the previous box and finishes in the bottom half.
Seek & Destroy Bullish (S&D•BuAF): Bullish volatility characterized by price moving above and below the previous candle before buyers win the battle and close price near the top.
Seek & Destroy Bearish (S&D•BeAF): Bearish volatility where sellers win a high-chaos battle, closing price near the bottom after sweeping both sides of the previous candle.
H4 CANDLE EXAMPLE
Deep Dive: Analysis of the 4H Statistics
The image presents a comprehensive backtest of 4,999 total candles from September 2022 to December 2025. Here is the breakdown of what the interface is telling us:
1. The Strategy: Target vs. Invalidation
The indicator tracks BuBC (Bullish Body Close) and BeBC (Bearish Body Close).
The Target: For a Bullish candle, the target is the High. For a Bearish candle, it is the Low.
The Invalidation: The opposite end of the candle (the Low for Bullish, the High for Bearish).
The Goal: To see which level is touched first in the subsequent bars.
2. Global Performance (The Top Right Table)
Looking at the BuBC (1402 samples) section:
Target First (67.8%): In nearly 7 out of 10 cases, once a 4H candle closes "bullish" (breaking the previous high), the price continues higher to break its own high before it ever returns to take out its own low.
Both Hit (17.7%): This is a critical metric. It represents "Stop Runs" or "Wicks" where price hits the target but also hits the invalidation within the same tracking period.
Efficiency (1.3 Bars): This tells us the "follow-through" is almost immediate. If the trade doesn't work within 1 or 2 candles, the statistical edge drops off significantly.
3. The Session Breakdown (The Bottom Left Table)
This is where the "Edge" is found. Not all hours of the day are created equal.
Asian Late (02:00-06:00) – The "Star" Performer: With a 72.9% Target rate, this is labeled "BEST." It has the lowest "Both%" (6.5%), meaning moves during these hours are incredibly "clean." If a setup forms here, price usually moves directly to the target without looking back.
London Open & Overlap (06:00-14:00): These sessions maintain a high win rate (approx. 70%). This suggests that the European session provides reliable trend continuation for the S&P 500.
NY Session (14:00-18:00) – The "Trap" Zone: This is labeled "WORST" for a reason. While the win rate is basically a coin flip (49.6%), the Both% spikes to 36.7%. This means that even if you are right about the direction, the market is highly likely to "sweep" your stop loss before going to the target. It is the most volatile and "fake-out" prone time for this specific setup.
Summary of the Data
The statistics show that the S&P 500 4H Candle Bias is a highly reliable trend-following indicator, provided you trade it at the right time.
The data suggests a clear three-step logic:
Directional Edge: Both Bullish and Bearish body closes have a natural ~67% probability of continuation.
Timing is Everything: Trading during the Late Asian and London sessions increases your probability of success to over 70% with very low risk of a "fake-out."
Risk Warning: Avoid "Body Close" breakout strategies during the NY Mid-day (14:00-18:00). The statistics prove that this window is dominated by "Seek and Destroy" price action, where price is mathematically likely to hit both your target and your stop, usually hitting the stop first.

Advanced Psychological Levels with Dynamic Spacing═══════════════════════════════════════
ADVANCED PSYCHOLOGICAL LEVELS WITH DYNAMIC SPACING
═══════════════════════════════════════
A comprehensive psychological price level indicator that automatically identifies and displays round number levels across multiple timeframes. Features dynamic ATR-based spacing, smart crypto detection, distance tracking, and customizable alert system.
───────────────────────────────────────
WHAT THIS INDICATOR DOES
───────────────────────────────────────
This indicator automatically draws psychological price levels (round numbers) that often act as support and resistance:
- Dynamic ATR-Based Spacing - Adapts level spacing to market volatility
- Multiple Level Types - Major (250 pip), Standard (100 pip), Mid, and Intraday levels
- Smart Asset Detection - Automatically adjusts for Forex, Crypto, Indices, and CFDs
- Crypto Price Adaptation - Intelligent level spacing based on cryptocurrency price magnitude
- Distance Information Table - Real-time percentage distance to nearest levels
- Combined Level Labels - Clear identification when multiple level types coincide
- Performance Optimized - Configurable visible range and label limits
- Comprehensive Alerts - Notifications when price crosses any level type
───────────────────────────────────────
HOW IT WORKS
───────────────────────────────────────
PSYCHOLOGICAL LEVELS CONCEPT:
Psychological levels are round numbers where traders tend to place orders, creating natural support and resistance zones. These include:
- Forex: 1.0000, 1.0100, 1.0050 (pips)
- Crypto: $100, $1,000, $10,000 (whole numbers)
- Indices: 10,000, 10,500, 11,000 (points)
Why They Matter:
- Traders naturally gravitate to round numbers
- Stop losses cluster at these levels
- Take profit orders concentrate here
- Institutional algorithmic trading often targets these levels
DYNAMIC ATR-BASED SPACING:
Traditional Method:
- Fixed spacing regardless of volatility
- May be too tight in volatile markets
- May be too wide in quiet markets
Dynamic Method (Recommended):
- Uses ATR (Average True Range) to measure volatility
- Automatically adjusts level spacing
- Tighter levels in low volatility
- Wider levels in high volatility
Calculation:
1. Calculate ATR over specified period (default: 14)
2. Multiply by ATR multiplier (default: 2.0)
3. Round to nearest psychological level
4. Generate levels at dynamic intervals
Benefits:
- Adapts to market conditions
- More relevant levels in all volatility regimes
- Reduces clutter in trending markets
- Provides more detail in ranging markets
LEVEL TYPES:
Major Levels (250 pip/point):
- Highest significance
- Primary support/resistance zones
- Color: Red (default)
- Style: Solid lines
- Spacing: 2.5x standard step
Standard Levels (100 pip/point):
- Secondary importance
- Common psychological barriers
- Color: Blue (default)
- Style: Dashed lines
- Spacing: Standard step
Mid Levels (50% between major):
- Optional intermediate levels
- Halfway between major levels
- Color: Gray (default)
- Style: Dotted lines
- Usage: Additional confluence points
Intraday Levels (sub-100 pip):
- For intraday traders
- Fine-grained precision
- Color: Yellow (default)
- Style: Dotted lines
- Only shown on intraday timeframes
SMART ASSET DETECTION:
Forex Pairs:
- Detects major currency pairs automatically
- Uses pip-based calculations
- Standard: 100 pips (0.0100)
- Major: 250 pips (0.0250)
- Intraday: 20, 50, 80 pip subdivisions
Cryptocurrencies:
- Automatic price magnitude detection
- Adaptive spacing based on price:
* Under $0.10: Levels at $0.01, $0.05
* $0.10-$1: Levels at $0.10, $0.50
* $1-$10: Levels at $1, $5
* $10-$100: Levels at $10, $50
* $100-$1,000: Levels at $100, $500
* $1,000-$10,000: Levels at $1,000, $5,000
* Over $10,000: Levels at $5,000, $10,000
Indices & CFDs:
- Fixed point-based system
- Major: 500 point intervals (with 250 sub-levels)
- Standard: 100 point intervals
- Suitable for stock indices like SPX, NASDAQ
COMBINED LEVEL LABELS:
When multiple level types coincide at the same price:
- Single line drawn (highest priority color)
- Combined label shows all types
- Priority: Major > Standard > Mid > Intraday
Example Label Formats:
- "1.1000 Major" - Major level only
- "1.1000 Std + Major" - Both standard and major
- "50000 Intra + Mid + Std" - Three levels coincide
Benefits:
- Cleaner chart appearance
- Clear identification of confluence
- Reduced visual clutter
- Easy to spot high-importance levels
DISTANCE INFORMATION TABLE:
Real-time tracking of nearest levels:
Table Contents:
- Nearest major level above (price and % distance)
- Nearest standard level above (price and % distance)
- Nearest standard level below (price and % distance)
Display:
- Top right corner (configurable)
- Color-coded by level type
- Real-time percentage calculations
- Helpful for position management
Usage:
- Identify proximity to key levels
- Set realistic profit targets
- Gauge potential move magnitude
- Monitor approaching resistance/support
ALERT SYSTEM:
Comprehensive crossing alerts:
Alert Types:
- Major Level Crosses
- Standard Level Crosses
- Intraday Level Crosses
Alert Modes:
- First Cross Only: Alert once when level is crossed
- All Crosses: Alert every time level is crossed
Alert Information:
- Level type crossed
- Specific price level
- Direction (above/below)
- One alert per bar to prevent spam
Configuration:
- Enable/disable by level type
- Choose alert frequency
- Customize for your trading style
───────────────────────────────────────
HOW TO USE
───────────────────────────────────────
INITIAL SETUP:
General Settings:
1. Enable "Use Dynamic ATR-Based Spacing" (recommended)
2. Set ATR Period (14 is standard)
3. Adjust ATR Multiplier (2.0 is balanced)
Visibility Settings:
1. Set Visible Range % (10% recommended for clarity)
2. Adjust Label Offset for readability
3. Configure performance limits if needed
Level Selection:
1. Enable/disable level types based on trading style
2. Adjust line counts for each type
3. Choose line styles and colors for visibility
TRADING STRATEGIES:
Breakout Trading:
1. Wait for price to approach major or standard level
2. Monitor for consolidation near level
3. Enter on confirmed break above/beyond level
4. Stop loss just beyond the broken level
5. Target: Next major or standard level
Rejection Trading:
1. Identify major psychological level
2. Wait for price to test the level
3. Look for rejection signals (wicks, bearish/bullish candles)
4. Enter in direction of rejection
5. Stop beyond the level
6. Target: Previous level or mid-level
Range Trading:
1. Identify range between two major levels
2. Buy at lower psychological level
3. Sell at upper psychological level
4. Use standard and mid-levels for position management
5. Exit if major level breaks with volume
Confluence Trading:
1. Look for combined levels (Std + Major)
2. These represent high-probability zones
3. Use as primary support/resistance
4. Increase position size at confluence
5. Expect stronger reactions at these levels
Session-Based Trading:
1. Note opening level at session start (Asian/London/NY)
2. Trade breakouts of major levels during high-volume sessions
3. London/NY sessions: More likely to break levels
4. Asian session: More likely to respect levels (range trading)
RISK MANAGEMENT WITH PSYCHOLOGICAL LEVELS:
Stop Loss Placement:
- Place stops just beyond psychological levels
- Add buffer (5-10 pips for forex)
- Avoid exact round numbers (stop hunting risk)
- Use previous major level as maximum stop
Take Profit Strategy:
- First target: Next standard level (partial profit)
- Second target: Next major level (remaining position)
- Trail stops to breakeven at first target
- Use distance table to calculate risk/reward
Position Sizing:
- Larger positions at major levels (higher probability)
- Smaller positions at intraday levels (lower probability)
- Scale in at standard levels between major levels
- Reduce size when multiple levels are close together
TIMEFRAME CONSIDERATIONS:
Higher Timeframes (4H, Daily, Weekly):
- Focus on Major and Standard levels only
- Disable Intraday and Mid levels
- Wider level spacing expected
- Use for swing trading and position trading
Lower Timeframes (5m, 15m, 1H):
- Enable all level types
- Use Intraday levels for precision
- Tighter level spacing acceptable
- Good for day trading and scalping
Multi-Timeframe Approach:
- Identify major levels on Daily/4H charts
- Refine entries using 15m/1H intraday levels
- Trade in direction of higher timeframe bias
- Use lower timeframe levels for position management
───────────────────────────────────────
CONFIGURATION GUIDE
───────────────────────────────────────
GENERAL SETTINGS:
Dynamic ATR-Based Spacing:
- Enabled: Recommended for most markets
- Disabled: Fixed psychological levels
- ATR Period: 14 (standard), 10 (responsive), 20 (smooth)
- ATR Multiplier: 1.0-5.0 (2.0 is balanced)
VISIBILITY SETTINGS:
Visible Range %:
- 5%: Very tight range, minimal clutter
- 10%: Balanced view (recommended)
- 20%: Wide range, more context
- 50%: Maximum range, all levels visible
Label Offset:
- 10-20 bars: Close to current price
- 30-50 bars: Moderate distance
- 50-100 bars: Far from price action
Performance Limits:
- Max Historical Bars: Reduce if indicator loads slowly
- Max Labels: Reduce for cleaner chart (20-30 recommended)
LEVEL CUSTOMIZATION:
Line Count:
- Lower (1-3): Cleaner chart, fewer levels
- Medium (4-6): Balanced view
- Higher (7-10): More context, busier chart
Line Styles:
- Solid: High importance, easy to see
- Dashed: Medium importance, clear but subtle
- Dotted: Low importance, minimal visual weight
Colors:
- Use contrasting colors for different level types
- Red/Blue/Yellow default works well
- Adjust based on chart background and personal preference
DISTANCE TABLE:
Position:
- Top Right: Doesn't interfere with price action
- Top Left: Good for right-side price scale
- Bottom positions: Less common but available
Colors:
- Default (white text, dark background) works for most charts
- Match your chart theme for consistency
- Ensure text is readable against background
ALERT CONFIGURATION:
Alert by Level Type:
- Major: Most important, fewer false signals
- Standard: Balance of frequency and importance
- Intraday: Many signals, best for active traders
Alert Frequency:
- First Cross Only: Cleaner, less noise (recommended for swing trading)
- All Crosses: Every touch, good for scalping
Alert Setup in TradingView:
1. Configure desired alert types in indicator settings
2. Right-click chart → Add Alert
3. Select this indicator
4. Choose "Any alert() function call"
5. Set delivery method (mobile, email, webhook)
───────────────────────────────────────
ASSET-SPECIFIC TIPS
───────────────────────────────────────
FOREX (EUR/USD, GBP/USD, etc.):
- Major levels at x.x000, x.x500
- Standard levels at x.xx00
- Intraday levels at 20/50/80 pips
- Most effective during London/NY sessions
- Watch for "figure" levels (1.0000, 1.1000)
CRYPTOCURRENCIES (BTC, ETH, etc.):
- Enable dynamic spacing for volatile markets
- Levels adjust automatically based on price
- Watch major $1,000 increments for BTC
- $100 levels important for ETH
- Smaller caps: Use standard levels
- High volatility: Increase ATR multiplier to 3.0
STOCK INDICES (SPX, NASDAQ, etc.):
- 100-point levels most important
- 500-point levels for major S/R
- 50-point mid-levels for refinement
- Watch end-of-day for level reactions
- Futures often lead spot on level breaks
GOLD/COMMODITIES:
- Major levels at $50 increments ($1,900, $1,950)
- Standard levels at $10 increments
- Very reactive to psychological levels
- Watch for false breaks during low volume
- Best reactions during active trading hours
───────────────────────────────────────
BEST PRACTICES
───────────────────────────────────────
Chart Setup:
- Use clean price action charts
- Avoid too many indicators
- Ensure psychological levels are clearly visible
- Match colors to your chart theme
Level Selection:
- Start with Major and Standard levels only
- Add Mid and Intraday as needed
- Less is more - avoid chart clutter
- Adjust based on timeframe
Combining with Other Tools:
- Volume profile for confluence
- Trendlines intersecting psychological levels
- Moving averages near round numbers
- Fibonacci levels coinciding with psychological levels
Common Mistakes to Avoid:
- Trading every level touch (be selective)
- Ignoring volume confirmation
- Setting stops exactly at levels (stop hunting)
- Forgetting to adjust for different assets
- Over-relying on levels without price action confirmation
Performance Optimization:
- Reduce visible range for faster loading
- Lower max historical bars on lower timeframes
- Limit labels to 30-50 for clarity
- Disable unused level types
───────────────────────────────────────
EDUCATIONAL DISCLAIMER
───────────────────────────────────────
This indicator identifies psychological price levels based on round numbers that tend to act as support and resistance. The methodology includes:
- Round number detection algorithms
- ATR-based dynamic spacing calculations
- Asset-specific level determination
- Distance percentage calculations
Psychological levels are a recognized concept in technical analysis, studied by traders and institutions. However, they do not guarantee price reactions and should be used as part of a comprehensive trading strategy including proper risk management, volume analysis, and price action confirmation.
───────────────────────────────────────
USAGE DISCLAIMER
───────────────────────────────────────
This tool is for educational and analytical purposes. Psychological levels can act as support or resistance but price reactions are not guaranteed. Dynamic spacing may generate different levels in different market conditions. Always conduct independent analysis, use proper risk management, and never risk capital you cannot afford to lose. Past performance does not indicate future results.
───────────────────────────────────────
CREDITS & ATTRIBUTION
───────────────────────────────────────
Original Concept: Sonar Lab

ATR by Session Library [1CG]Library "ATRxSession"
This library shows you how big the bars usually are during a trading session. It looks only at the times you choose (like New York or London hours), measures the “true range” of every bar in that session, then finds the average for that session. It keeps the last N sessions and gives you their overall average, so you can quickly see how much the market typically moves per bar during your chosen session.
Call getSessionAtr(timezone, session, sessionCount) from your script, and it will return a single number: the average per-bar volatility during the chosen session, based on the last N completed sessions. This makes it easy to plug session-specific volatility into your own indicators or strategies.
getSessionAtr(_timezone, _session, _sessionCount)
getSessionAtr - Computes a session-aware ATR over completed sessions.
Parameters:
_timezone (string) : (string) - Timezone string to evaluate session timing.
_session (string) : (string) - Session time range string (e.g., "0930-1600").
_sessionCount (int) : (int) - Number of past completed sessions to include in the rolling average.
Returns: (float) - The average ATR across the last N completed sessions, or na if not enough data.

Volume Profile (Simple)Simple Volume Profile (Simple)
Master the Market's Structure with a Clear View of Volume
by mercaderoaurum
The Simple Volume Profile (Simple) indicator removes the guesswork by showing you exactly where the most significant trading activity has occurred. By visualizing the Point of Control (POC) and Value Area (VA) for today and yesterday, you can instantly identify the price levels that matter most, giving you a critical edge in your intraday trading.
This tool is specifically optimized for day trading SPY on a 1-minute chart, but it's fully customizable for any symbol or timeframe.
Key Features
Multi-Day Analysis: Automatically plots the volume profiles for the current and previous trading sessions, allowing you to see how today's market is reacting to yesterday's key levels.
Automatic Key Level Plotting: Instantly see the most important levels from each session:
Point of Control (POC): The single price level with the highest traded volume, acting as a powerful magnet for price.
Value Area High (VAH): The upper boundary of the area where 50% of the volume was traded. It often acts as resistance.
Value Area Low (VAL): The lower boundary of the 50% value area, often acting as support.
Extended Levels: The POC, VAH, and VAL from previous sessions are automatically extended into the current day, providing a clear map of potential support and resistance zones.
Customizable Sessions: While optimized for the US stock market, you can define any session time and time zone, making it a versatile tool for forex, crypto, and futures traders.
Core Trading Strategies
The Simple Volume Profile helps you understand market context. Instead of trading blind, you can now make decisions based on where the market has shown the most interest.
1. Identifying Support and Resistance
This is the most direct way to use the indicator. The extended lines from the previous day are your roadmap for the current session.
Previous Day's POC (pPOC): This is the most significant level. Watch for price to react strongly here. It can act as powerful support if approached from above or strong resistance if approached from below.
Previous Day's VAH (pVAH): Expect this level to act as initial resistance. A clean break above pVAH can signal a strong bullish trend.
Previous Day's VAL (pVAL): Expect this level to act as initial support. A firm break below pVAL can indicate a strong bearish trend.
Example Strategy: If SPY opens and rallies up to the previous day's VAH and stalls, this is a high-probability area to look for a short entry, with a stop loss just above the level.
2. The "Open-Drive" Rejection
How the market opens in relation to the previous day's value area is a powerful tell.
Open Above Yesterday's Value Area: If the market opens above the pVAH, it signals strength. The first pullback to test the pVAH is often a key long entry point. The level is expected to flip from resistance to support.
Open Below Yesterday's Value Area: If the market opens below the pVAL, it signals weakness. The first rally to test the pVAL is a potential short entry, as the level is likely to act as new resistance.
3. Fading the Extremes
When price pushes far outside the previous day's value area, it can become overextended.
Reversal at Highs: If price rallies significantly above the pVAH and then starts to lose momentum (e.g., forming bearish divergence on RSI or a topping pattern), it could be an opportunity to short the market, targeting a move back toward the pVAH or pPOC.
Reversal at Lows: Conversely, if price drops far below the pVAL and shows signs of bottoming, it can be a good opportunity to look for a long entry, targeting a reversion back to the value area.
Recommended Settings (SPY Intraday)
These settings are the default and are optimized for scalping or day trading SPY on a 1-minute chart.
Value Area (%): 50%. This creates a tighter, more sensitive value area, perfect for identifying the most critical intraday zones.
Number of Rows: 1000. This high resolution is essential for a low-volatility instrument like SPY, ensuring that the profile is detailed and the levels are precise.
Session Time: 0400-1800 in America/New_York. This captures the full pre-market and core session, which is crucial for understanding the day's complete volume story.
Ready to trade with an edge? Add the Simple Volume Profile (Multi-Day) to your chart now and see the market in a new light!

Advanced Market TheoryADVANCED MARKET THEORY (AMT)
This is not an indicator. It is a lens through which to see the true nature of the market.
Welcome to the definitive application of Auction Market Theory. What you have before you is the culmination of decades of market theory, fused with state-of-the-art data analysis and visual engineering. It is an institutional-grade intelligence engine designed for the serious trader who seeks to move beyond simplistic indicators and understand the fundamental forces that drive price.
This guide is your complete reference. Read it. Study it. Internalize it. The market is a complex story, and this tool is the language with which to read it.
PART I: THE GRAND THEORY - A UNIVERSE IN AN AUCTION
To understand the market, you must first understand its purpose. The market is a mechanism of discovery, organized by a continuous, two-way auction.
This foundational concept was pioneered by the legendary trader J. Peter Steidlmayer at the Chicago Board of Trade in the 1980s. He observed that beneath the chaotic facade of ticking prices lies a beautifully organized structure. The market's primary function is not to go up or down, but to facilitate trade by seeking a price level that encourages the maximum amount of interaction between buyers and sellers. This price is "value."
The Organizing Principle: The Normal Distribution
Over any given period, the market's activity will naturally form a bell curve (a normal distribution) turned on its side. This is the blueprint of the auction.
The Point of Control (POC): This is the peak of the bell curve—the single price level where the most trade occurred. It represents the point of maximum consensus, the "fairest price" as determined by the market participants. It is the gravitational center of the session.
The Value Area (VA): This is the heart of the bell curve, typically containing 70% of the session's activity (one standard deviation). This is the zone of "accepted value." Prices within this area are considered fair and are where the market is most comfortable conducting business.
The Extremes: The thin areas at the top and bottom of the curve are the "unfair" prices. These are levels where one side of the auction (buyers at the top, sellers at the bottom) was shut off, and trade was quickly rejected. These are areas of emotional trading and excess.
The Narrative of the Day: Balance vs. Imbalance
Every trading session is a story of the market's search for value.
Balance: When the market rotates and builds a symmetrical, bell-shaped profile, it is in a state of balance . Buyers and sellers are in agreement, and the market is range-bound.
Imbalance: When the market moves decisively away from a balanced area, it is in a state of imbalance . This is a trend. The market is actively seeking new information and a new area of value because the old one was rejected.
Your Purpose as a Trader
Your job is to read this story in real-time. Are we in balance or imbalance? Is the auction succeeding or failing at these new prices? The Advanced Market Theory engine is your Rosetta Stone to translate this complex narrative into actionable intelligence.
PART II: THE AMT ENGINE - AN EVOLUTION IN MARKET VISION
A standard market profile tool shows you a picture. The AMT Engine gives you the architect's full schematics, the engineer's stress tests, and the psychologist's behavioral analysis, all at once.
This is what makes it the Advanced Market Theory. We have fused the timeless principles with layers of modern intelligence:
TRINITY ANALYSIS: You can view the market through three distinct lenses. A Volume Profile shows where the money traded. A TPO (Time) Profile shows where the market spent its time. The revolutionary Hybrid Profile fuses both, giving you a complete picture of market conviction—marrying volume with duration.
AUTOMATED STRUCTURAL DECODING: The engine acts as your automated analyst, identifying critical structural phenomena in real-time:
Poor Highs/Lows: Weak auction points that signal a high probability of reversal.
Single Prints & Ledges: Footprints of rapid, aggressive market moves and areas of strong institutional acceptance.
Day Type Classification: The engine analyzes the session's personality as it develops ("Trend Day," "Normal Day," etc.), allowing you to adapt your strategy to the market's current character.
MACRO & MICRO FUSION: Via the Composite Profile , the engine merges weeks of data to reveal the major institutional battlegrounds that govern long-term price action. You can see the daily skirmish and the multi-month war on a single chart.
ORDER FLOW INTELLIGENCE: The ultimate advancement is the integrated Cumulative Volume Delta (CVD) engine. This moves beyond structure to analyze the raw aggression of buyers versus sellers. It is your window into the market's soul, automatically detecting critical Divergences that often precede major trend shifts.
ADAPTIVE SIGNALING: The engine's signal generation is not static; it is a thinking system. It evaluates setups based on a multi-factor Confluence Score , understands the market Regime (e.g., High Volatility), and adjusts its own confidence ( Probability % ) based on the complete context.
This is not a tool that gives you signals. This is a tool that gives you understanding .
PART III: THE VISUAL KEY - A LEXICON OF MARKET STRUCTURE
Every element on your chart is a piece of information. This is your guide to reading it fluently.
--- THE CORE ARCHITECTURE ---
The Profile Histogram: The primary visual on the left of each session. Its shape is the story. A thin profile is a trend; a fat, symmetrical profile is balance.
Blue Box : The zone of accepted, "fair" value. The heart of the session's business.
Bright Orange Line & Label : The Point of Control. The gravitational center. The price of maximum consensus. The most significant intraday level.
Dashed Blue Lines & Labels : The boundaries of value. Critical inflection points where the market decides to either remain in balance or seek value elsewhere.
Dashed Cyan Lines & Labels : The major, long-term structural levels derived from weeks of data. These are institutional reference points and carry immense weight. Treat them as primary support and resistance.
Dashed Orange Lines & Labels : Marks a Poor or Unfinished Auction . These represent emotional, weak extremes and are high-probability targets for future price action.
Diamond Markers : Mark Single Prints , which are footprints of aggressive, one-sided moves that left a "liquidity vacuum." Price is often drawn back to these levels to "repair" the poor structure.
Arrow Markers : Mark Ledges , which are areas of strong horizontal acceptance. They often act as powerful support/resistance in the future.
Dotted Gray Lines & Labels : The projected daily range based on multiples of the Initial Balance . Use them to set realistic profit targets and gauge the day's potential.
--- THE SIGNAL SUITE ---
Colored Triangles : These are your high-probability entry signals. The color is a strategic playbook:
Gold Triangle : ELITE Signal. An A+ setup with overwhelming confluence. This is the highest quality signal the engine can produce.
Yellow Triangle : FADE Signal. A counter-trend setup against an exhausted move at a structural extreme.
Cyan Triangle : BREAKOUT Signal. A momentum setup attempting to capitalize on a breakout from the value area.
Purple Triangle : ROTATION Signal. A mean-reversion setup within the value area, typically from one edge towards the POC.
Magenta Triangle : LIQUIDITY Signal. A sophisticated setup that identifies a "stop run" or liquidity sweep.
Percentage Number: The engine's calculated probability of success . This is not a guarantee, but a data-driven confidence score.
Dotted Gray Line: The signal's Entry Price .
Dashed Green Lines: The calculated Take Profit Targets .
Dashed Red Line: The calculated Stop Loss level.
PART IV: THE DASHBOARD - YOUR STRATEGIC COMMAND CENTER
The dashboard is your real-time intelligence briefing. It synthesizes all the engine's analysis into a clear, concise, and constantly updating summary.
--- CURRENT SESSION ---
POC, VAH, VAL: The live values for the core structure.
Profile Shape: Is the current auction top-heavy ( b-shaped ), bottom-heavy ( P-shaped ), or balanced ( D-shaped )?
VA Width: Is the value area expanding (trending) or contracting (balancing)?
Day Type: The engine's judgment on the day's personality. Use this to select the right strategy.
IB Range & POC Trend: Key metrics for understanding the opening sentiment and its evolution.
--- CVD ANALYSIS ---
Session CVD: The raw order flow. Is there more net buying or selling pressure in this session?
CVD Trend & DIVERGENCE: This is your order flow intelligence. Is the order flow confirming the price action? If "DIVERGENCE" flashes, it is a critical, high-alert warning of a potential reversal.
--- MARKET METRICS ---
Volume, ATR, RSI: Your standard contextual metrics, providing a quick read on activity, volatility, and momentum.
Regime: The engine's assessment of the broad market environment: High Volatility (favor breakouts), Low Volatility (favor mean reversion), or Normal .
--- PROFILE STATS, COMPOSITE, & STRUCTURE ---
These sections give you a quick quantitative summary of the profile structure, the major long-term Composite levels, and any active Poor Structures.
--- SIGNAL TYPES & ACTIVE SIGNAL ---
A permanent key to the signal colors and their meanings, along with the full details of the most recent active signal: its Type , Probability , Entry , Stop , and Target .
PART V: THE INPUTS MENU - CALIBRATING YOUR LENS
This engine is designed to be calibrated to your specific needs as a trader. Every input is a lever. This is not a "one size fits all" tool. The extensive tooltips are your built-in user manual, but here are the key areas of focus:
--- MARKET PROFILE ENGINE ---
Profile Mode: This is the most fundamental choice. Volume is the standard for price-based support and resistance. TPO is for analyzing time-based acceptance. Hybrid is the professional's choice, fusing both for a complete picture.
Profile Resolution: This is your zoom lens. Lower values for scalping and intraday precision. Higher values for a cleaner, big-picture view suitable for swing trading.
Composite Sessions: Your timeframe for macro analysis. 5-10 sessions for a weekly view; 20-30 sessions for a monthly, structural view.
--- SESSION & VALUE AREA ---
These settings must be configured correctly for your specific asset. The Session times are critical. The Initial Balance should reflect the key opening period for your market (60 minutes is standard for equities).
--- SIGNAL ENGINE & RISK MANAGEMENT ---
Signal Mode: THIS IS YOUR PERSONAL RISK PROFILE. Set it to Conservative to see only the absolute best A+ setups. Use Elite or Balanced for a standard approach. Use Aggressive only if you are an experienced scalper comfortable with managing more frequent, lower-probability setups.
ATR Multipliers: This suite gives you full, dynamic control over your risk/reward parameters. You can precisely define your initial stop loss distance and profit targets based on the market's current volatility.
A FINAL WORD FROM THE ARCHITECT
The creation of this engine was a journey into the very heart of market dynamics. It was born from a frustrating truth: that the most profound market theories were often confined to books and expensive institutional platforms, inaccessible to the modern retail trader. The goal was to bridge that gap.
The challenge was monumental. Making each discrete system—the volume profile, the TPO counter, the composite engine, the CVD tracker, the signal generator, the dynamic dashboard—work was a task in itself. But the true struggle, the frustrating, painstaking process that consumed countless hours, was making them work in unison . It was about ensuring the CVD analysis could intelligently inform the signal engine, that the day type classification could adjust the probability scores, and that the composite levels could provide context to the intraday structure, all in a seamless, real-time dance of data.
This engine is the result of that relentless pursuit of integration. It is built on the belief that a trader's greatest asset is not a signal, but clarity . It was designed to clear the noise, to organize the chaos, and to present the elegant, underlying logic of the market auction so that you can make better, more informed, and more confident decisions.
It is now in your hands. Use it not as a crutch, but as a lens. See the market for what it truly is.
"The market can remain irrational longer than you can remain solvent."
- John Maynard Keynes
DISCLAIMER
This script is an advanced analytical tool provided for informational and educational purposes only. It is not financial advice. All trading involves substantial risk, and past performance is not indicative of future results. The signals, probabilities, and metrics generated by this indicator do not constitute a recommendation to buy or sell any financial instrument. You, the user, are solely responsible for all trading decisions, risk management, and outcomes. Use this tool to supplement your own analysis and trading strategy.
PUBLISHING CATEGORIES
Volume Profile
Market Profile
Order Flow

Session Coloring Bar with ICT Macro [dani]The Session Coloring Bar is customizable Pine Script indicator designed to visually enhance your charts by applying unique colors to specific trading sessions or timeframes. This tool allows traders to easily identify and differentiate between macro sessions (e.g., 24-hour cycles) and custom-defined sessions (e.g., Session A, Session B), making it ideal for analyzing market activity during specific periods.
In the context of trading, the term "ICT Macro" , as discussed by Michael J. Huddleston (ICT), refers to specific timeframes or "windows" where market behavior often follows predictable patterns. Traders typically focus on the last 10 minutes of an hour and the first 10 minutes of the next hour (e.g., 0150-0210 , 0050-0110 , or 0950-1010 ) to identify key price movements, liquidity shifts, or market inefficiencies.
This script highlights these macro timeframes, enabling traders to visually analyze price action during these critical periods. Use this tool to support your strategy, but always combine it with your own analysis and risk management.
With this indicator, you can:
Highlight Macro Sessions : Automatically color bars based on predefined 24-hour macro sessions.
Customize Session Settings : Define up to three custom sessions (A & B) with individual start/end times, visibility toggles, and unique bar colors.
Timeframe Filtering : Hide session coloring above a specified timeframe to avoid clutter on higher timeframes.
Personal Notes : Add comments to each session for better organization and quick reference.
Dynamic Color Logic : Bars are colored based on their direction (up, down, or neutral) within the active session.
How to Use:
Enable/Disable Sessions :
Use the Show Coloring toggle to enable or disable session coloring for Macro, Session A, Session B, or Session C.
Set Session Times :
Define the start and end times for each session in the format HHMM-HHMM (e.g., 1600-0930 for an overnight session).
Choose Colors :
Assign unique colors for upward (Bar Up) and downward (Bar Down) bars within each session.
Adjust Timeframe Visibility :
Use the Hide above this TF input to specify the maximum timeframe where session coloring will be visible.
Add Notes :
Use the Comment field to add personal notes or labels for each session.
Example Use Cases:
Overnight Sessions :
Highlight overnight trading hours (e.g., 1600-0930) to analyze price action during low liquidity periods.
Asian/European/US Sessions : Define separate sessions for major trading regions to track regional market behavior.
Macro Analysis : Use the predefined 24-hour macro sessions to study hourly price movements across a full trading day.
Disclaimer:
The Session Coloring Bar is not a trading signal generator and does not predict market direction or provide buy/sell signals. Instead, it is a visualization tool designed to help you identify and analyze specific trading sessions or timeframes on your chart. By highlighting key sessions and their corresponding price movements, this indicator enables you to focus on periods of interest and make more informed trading decisions.
Thank you for choosing this indicator! I hope it becomes a valuable part of your trading toolkit. Remember, trading is a journey, and having the right tools can make all the difference. Whether you're a seasoned trader or just starting out, this indicator is designed to help you stay organized and focused on what matters most—price action. Happy trading, and may your charts be ever in your favor! 😊
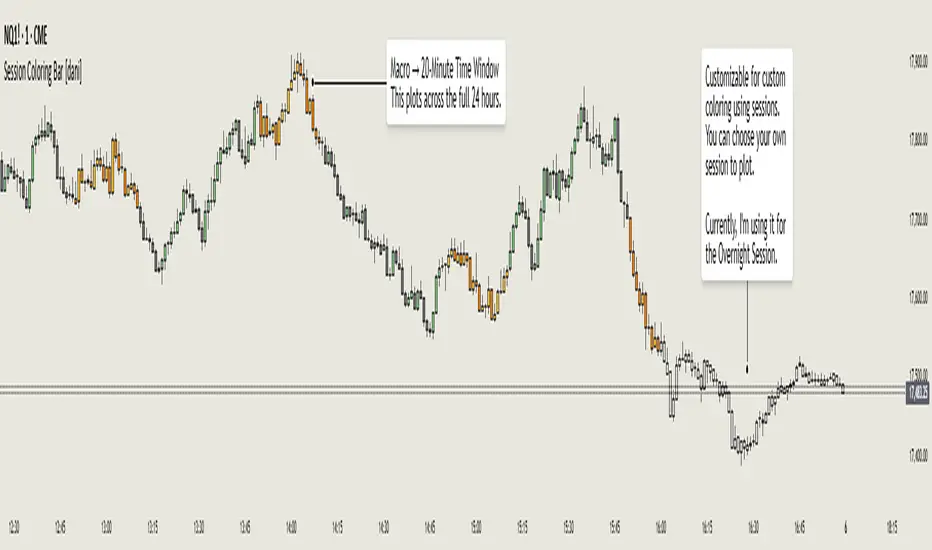
Killzone Highlights with Volume [odnac]
Description:
This indicator seamlessly integrates volume analysis with kill zone highlights across different market sessions.
The indicator dynamically displays trading volume and visually emphasizes key trading sessions in various time zones, including Asia, Europe, and New York (both AM and PM sessions).
Users have the flexibility to customize the colors of bullish and bearish volume bars, as well as the transparency and color of the kill zone highlights, allowing for tailored visual analysis of trading periods.
Features:
Bullish and Bearish Volume Colors:
Displays the volume of trades with user-defined colors for bullish (up) and bearish (down) candles.
Killzone Highlights:
Highlights the kill zones for Asia, Europe, New York AM, and New York PM sessions with user-defined colors and transparency.
Customization Options:
Allows users to adjust the colors, transparency, and time settings for each kill zone.
Weekend Handling:
Option to hide kill zone highlights during weekends.
Timeframe Limitation:
Users can set the maximum timeframe for which the kill zone highlights will be displayed.
Usage:
This indicator is designed for traders who want to gain insights into market activity during key trading sessions.
By combining volume data with visually distinct kill zone highlights, it helps traders make informed decisions based on the most active trading periods.
Ideal for intraday traders looking to leverage session-based strategies for more effective trading decisions.
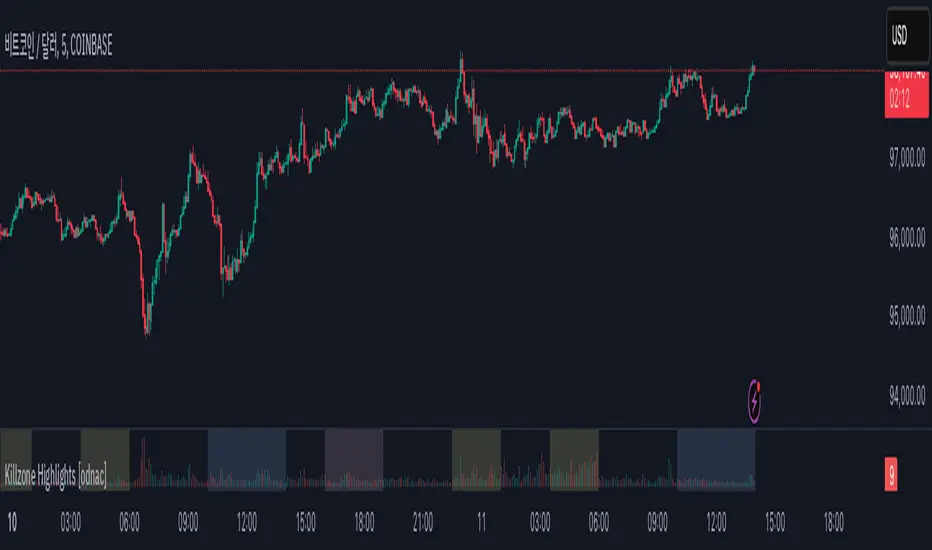
CANDLE RANGE THEORY (H1 Only)Hello traders.
This indicator identifies CRT candles
-Each candle is a range.
-Each candle has its own po3.
-Focus on specific times of the day. By recognizing the importance of time and price, we can capture high-quality trades. Together with HTF PD array, Look for 4-hour candles forming at specific times of the day. (1am - 5am - 9am EST)
-After the 1st candle, wait for the 2nd candle to clear the high/low of the 1st candle and then close inside the 1st candle range at a specific time (1-5-9) and look for entries in the LTF
Why choose 1 5 9 hours EST?
### **1. 1:00 AM (EST)**
- **Trading Session:** This is the time between the Tokyo (Asian) session and the Sydney (Australian) session. The Asian market is very active.
- **Characteristics:**
- Liquidity: Moderate, as only the Asian market is active.
- Volatility: Pairs involving JPY (Japanese Yen), AUD (Australian Dollar), and NZD (New Zealand Dollar) tend to have higher volatility.
- Trading Opportunities: Suitable for traders who like to trade trends or news in the Asian region.
- **Note:** Volatility may be lower than the London or New York session.
### **2. 5:00 AM (EST)**
- **Trading Session:** This is the time near the end of the Tokyo session and the London (European) session is about to open.
- **Characteristics:**
- Liquidity: Starts to increase due to the preparation of the European market.
- Volatility: This is the time between two trading sessions, there can be strong fluctuations, especially in major currency pairs such as EUR/USD, GBP/USD.
- Trading opportunities: Suitable for breakout trading strategies when liquidity increases.
- **Note:** The overlap between Tokyo and London can cause sudden fluctuations.
### **3. 9:00 AM (EST)**
- **Trading sessions:** This time is within the London session and near the beginning of the New York session.
- **Characteristics:**
- Liquidity: Very high, as this is the period between the two largest sessions – London and New York.
- Volatility: Extremely strong, especially for major currency pairs such as EUR/USD, GBP/USD, USD/JPY.
- Trading opportunities: Suitable for both news trading and trend trading, as this is the time when a lot of economic data is released (usually from the US or the European region).
- **Note:** High volatility can bring big profits, but also comes with high risks.
### **Summary of effects:**
- **1 AM (EST):** Moderate volatility, focusing on Asian currency pairs.
- **5 AM (EST):** Increased liquidity and volatility, suitable for breakout trading.
- **9 AM (EST):** High volatility and high liquidity, the best time for Forex trading.
==> How to trade, when the high/low of CRT is swept, move to LTF to wait for confirmation to enter the order
Only sell at high level and buy at discount price.
Find CE at specific important time. Trading CRT with HTF direction has better win rate.
The more inside bars, the higher the probability.
Place a partial and Move breakeven at 50% range.
Do a backtest and post your chart.

Market Structure & Session Alerts### Market Structure & Session Alerts Indicator
#### Overview
The "Market Structure & Session Alerts" indicator is a comprehensive tool designed to assist traders in identifying key market structure levels, detecting liquidity sweeps, and receiving alerts for specific trading sessions. This indicator is particularly useful for traders who want to keep an eye on previous high and low levels and be alerted during pre-London and pre-New York sessions.
#### Features
1. **Previous High/Low Levels:**
- **Daily, Weekly, and Monthly Highs and Lows:** The indicator plots the previous day, week, and month high and low levels on the chart. These levels can be crucial for identifying support and resistance zones.
- **Toggle Display:** Users can choose to show or hide these levels using the "Show Previous Day/Week/Month High/Low" option.
2. **Liquidity Sweep Detection:**
- **Liquidity Sweep Identification:** The indicator detects liquidity sweeps when the current price closes above the previous day's high. This can signal potential reversals or continuations in the market.
- **Visual Alerts:** When a liquidity sweep is detected, a green triangle is plotted below the bar.
3. **Session Alerts:**
- **Session Timings:** Users can set specific start and end times for the pre-London and pre-New York sessions to match their timezone.
- **Visual Background Highlight:** The background of the chart is highlighted in yellow during the defined session times to provide a visual cue.
- **Alert Messages:** The indicator can generate alerts to notify traders when the market enters the pre-London or pre-New York session.
4. **Current Price Line:**
- The current price is plotted as a black line, providing a clear visual reference for the current market price.
#### How to Use
1. **Input Parameters:**
- `Show Previous Day/Week/Month High/Low`: Enable or disable the display of previous high/low levels.
- `Show Liquidity Sweep`: Enable or disable the detection and display of liquidity sweeps.
- `Show Session Alerts`: Enable or disable session alerts and background highlights.
2. **Session Timing Adjustments:**
- Set the `Pre-London Start`, `Pre-London End`, `Pre-New York Start`, and `Pre-New York End` times according to your timezone to ensure accurate session alerts.
3. **Alerts:**
- Make sure alerts are enabled in your TradingView settings to receive notifications when the market enters the pre-London or pre-New York sessions.
#### Example Use Cases
- **Day Traders:** Identify potential support and resistance levels using the previous day's high and low.
- **Swing Traders:** Use weekly and monthly high and low levels to determine significant market structure points.
- **Scalpers:** Detect liquidity sweeps to identify potential quick trades.
- **Session Traders:** Be alerted when the market enters key trading sessions to align your trading strategy with major market activities.
This indicator combines multiple market analysis tools into one, providing a robust system for traders to enhance their trading decisions and market awareness.

Power Hour Money StrategyDescription of the Pine Script Code: "Power Hour Money Strategy"
This Pine Script strategy, "Power Hour Money Strategy," is designed to trade based on the alignment of multiple time frames (month, week, day, and hour). The strategy aims to enter long or short positions depending on whether all selected time frames are in sync (all green for long positions, all red for short positions). Additionally, the script includes configurations for trading during specific sessions and automatically closing positions at the end of the trading day.
Core Features:
1. Time Frame Sync Check:
- The strategy evaluates whether the current price is higher than the opening price for the month, week, day, and hour to determine if each time frame is "green" (bullish) or "red" (bearish).
2. Session Control:
- The user can select between different trading sessions:
- "NY Session 9:30-11:30"
- "Extended NY Session 8-4"
- "All Sessions"
- Trades are only executed if the current time falls within the selected session.
3. Trailing Stop Mechanism:
- The strategy includes an optional trailing stop mechanism for both long and short positions.
- The trailing stop is configured with a percentage loss from the current price to protect gains.
4. End-of-Day Position Management:
- An option is provided to automatically close all positions at the end of the trading day (5:45 PM Eastern Time).
Detailed Code Breakdown:
1. Input Settings:
- **Session Selection**: Allows the user to choose the trading session.
- **End-of-Day Close**: Option to automatically close positions at the end of the day.
- **Trailing Stop Loss**: Enables or disables the trailing stop loss feature and sets the percentage for long and short positions.
2. Time Frame Calculations:
- The script uses `request.security` to get the opening prices for higher time frames (monthly, weekly, daily, and hourly).
- It compares the current close price to these opening prices to determine if each time frame is green or red.
3. Session Time Definitions:
- Defines the start and end times for the NY session (9:30-11:30 AM) and the extended session (8:00 AM - 4:00 PM).
4. Trade Execution:
- The strategy checks if all selected time frames are in sync and if the current time falls within the trading session.
- If all conditions are met, it enters a long or short position.
5. Trailing Stop Loss Implementation:
- Adjusts the stop price based on the trailing percentage and the current position's size.
- Automatically exits positions if the trailing stop condition is met.
6. End-of-Day Close Implementation:
- Uses a timestamp to check if the current time is 5:45 PM Eastern Time.
- Closes all positions if the end-of-day condition is met.
7. Plotting and Logging:
- Plots indicators to visualize the green/red status of each time frame.
- Logs information about the status of each time frame for debugging and analysis.
Example Usage:
Entering a Long Position: If the month, week, day, and hour are all green and the current time is within the selected session, a long position is entered.
Entering a Short Position: If the month, week, day, and hour are all red and the current time is within the selected session, a short position is entered.
Trailing Stop: Protects gains by exiting the position if the price moves against the set trailing stop percentage.
End-of-Day Close: Automatically closes all open positions at 5:45 PM Eastern Time if enabled.
This strategy is particularly useful for traders who want to ensure that multiple time frames are in alignment before entering a trade and who wish to manage positions effectively throughout the trading day with specific session controls and trailing stops.

SmartVPSGTitle: Identifying Volume Spikes, Price Movements and Gap Ups: A TradingView Script
Introduction:
In the world of trading, identifying volume spikes and price movements can provide valuable insights into market trends and potential trading opportunities. In this article, we'll explore a TradingView script that helps traders visualize volume spikes, price up moves with volume spikes, and gap-up days on their charts.
Detecting Price Up Moves:
The script starts by calculating price up moves. It compares the current day's closing price with the previous day's closing price and checks if it has increased by 3% or more. This helps traders spot significant upward price movements.
Detecting Volume Spurts:
Next, the script focuses on detecting volume spikes, which are often associated with increased market activity and potential trading opportunities. It compares the current day's volume with the highest volume of the previous nine sessions. If the current volume exceeds all the volumes of the previous nine sessions, it is considered a volume spurt.
Example:
Let's consider a hypothetical scenario where we have the following volume data for a stock:
Day 1: 100,000
Day 2: 80,000
Day 3: 120,000
Day 4: 150,000
Day 5: 200,000
Day 6: 90,000
Day 7: 110,000
Day 8: 130,000
Day 9: 140,000
Day 10: 250,000 (current day)
To determine if there is a volume spurt on Day 10, the script compares the current day's volume (250,000) with the highest volume of the previous nine sessions. In this case, the highest volume among the previous nine sessions is 200,000 (on Day 5). Since the current day's volume (250,000) exceeds the highest volume of the previous nine sessions (200,000), it is considered a volume spurt.
Identifying Gap-Up Days:
Gap-up days occur when the market opens significantly higher than the previous day's close. To identify these days, the script compares the current day's low price with the previous day's high price. If the low price is greater than the previous day's high, it is marked as a gap-up day.
Visualizing the Findings:
To provide a clear visual representation of the identified patterns, the script uses different shapes and colors. First, it plots small red dots above the candles whenever a volume spurt is detected. These dots help traders quickly identify periods of increased volume activity.
For price up moves with volume spikes, the script utilizes blue triangular shapes below the candles. This allows traders to pinpoint instances where both price and volume are showing positive signs, indicating potential bullish movements.
Additionally, the script incorporates green candles to represent gap-up days. These candles help traders recognize days when the market opens with a significant upward gap, suggesting a potential shift in market sentiment.
Conclusion:
The TradingView script discussed in this article provides traders with a visual representation of volume spikes , price up moves with volume spikes , and gap-up days . By incorporating these visual cues into their analysis, traders can gain valuable insights into market trends and potential trading opportunities.
Remember, this script should be used for educational and informational purposes only and does not serve as financial advice or recommendations. Traders are encouraged to customize and modify the script according to their specific trading strategies and risk tolerance.
Share this script with other traders on TradingView to enhance their chart analysis and trading decisions.
PS: This TradingView script is designed to work specifically on the daily timeframe (daily candles). It calculates and identifies volume spurts based on the volume data of the daily timeframe. Since it is designed for the daily timeframe, it may not produce accurate results or work as intended on other timeframes.

Trading Session TemplateDescription:
The Trading Session Template Indicator is a powerful script that allows traders to customize their own trading session time range on a chart. With this indicator, you have the flexibility to define specific hours during which you prefer to focus your trading activities. The example chart showcases the New York session hours, but you can easily adapt it to any desired time range based on your trading strategy and preferences.
Key Features:
Customizable Trading Session: The indicator empowers you to define your own trading session time range, tailored to your preferred market sessions or specific trading hours. This flexibility ensures that the indicator aligns with your unique trading strategy.
Highlighted Trading Session: When a new trading day begins, the script automatically scans for the specified time range. Once the first candle within the range begins printing, the background color of the chart is highlighted, indicating the beginning of the trading session. When the last candle within the range is closed, the background color returns to normal.
Focus on Specific Market Sessions: This indicator is particularly useful for traders who prefer to trade certain market sessions or specific hours during the day. By customizing the trading session, you can better align your trading activities with specific market conditions and trading opportunities.
Candle Pattern Detection: The indicator includes the ability to detect candle patterns such as Doji, Engulfing, Hammer, and Shooting Star. You can activate the desired candle patterns and set up alerts for them. When an alert is triggered, indicating the formation of a specific candle pattern, you can further analyze the market and make informed trading decisions.
ATR Filter: The indicator offers an ATR (Average True Range) filter to limit noise and focus on candle patterns with a size comparable to the ATR. You can set a minimum and maximum size for a candle compared to the ATR. This helps you filter out smaller or larger candles that may not align with your trading preferences.
Stop Loss (SL) and Take Profit (TP) Levels: When a candle pattern is detected, based on the ATR, the indicator can display suggested Stop Loss and Take Profit levels. This feature provides additional guidance for risk management and potential profit targets.
User-Friendly Interface: The indicator provides a user-friendly interface with adjustable settings and switches for customization. Tooltips are available to guide you through the various options and configurations, making it easy to adapt the indicator to your trading style and preferences.
Note:
The Trading Session Template Indicator is designed for timeframes lower than 1D. It does not plot any information on timeframes of 1D and higher.
Disclaimer:
The Trading Session Template Indicator is provided for informational and educational purposes only. Trading in the financial markets involves risk, and you should only trade with funds that you can afford to lose. The indicator's past performance is not indicative of future results. Always conduct your own research and due diligence before making any investment decisions. The creator of this indicator shall not be held responsible for any losses or damages incurred from the use of this indicator.
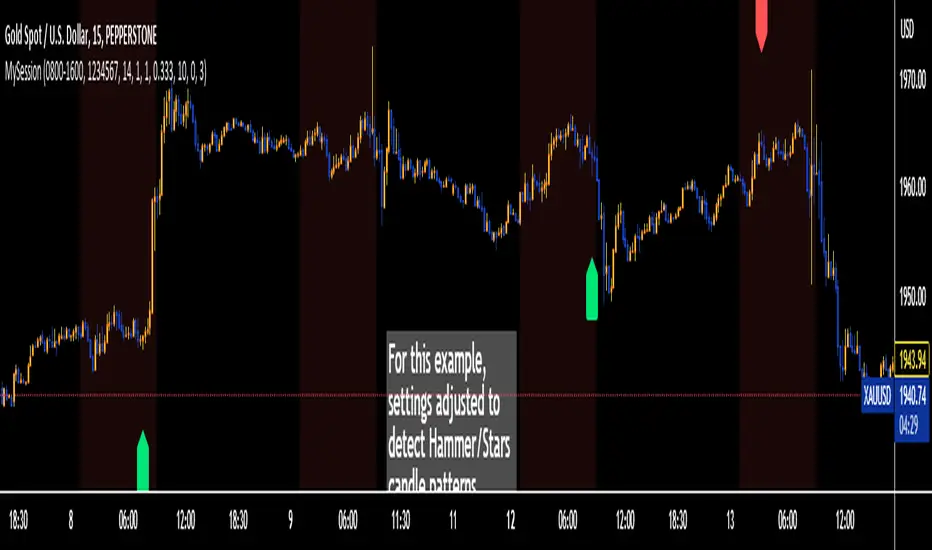
Universal Global SessionUniversal Global Session
This Script combines the world sessions of: Stocks, Forex, Bitcoin Kill Zones, strategic points, all configurable, in a single Script, to capitalize the opening and closing times of global exchanges as investment assets, becoming an Universal Global Session .
It is based on the great work of @oscarvs ( BITCOIN KILL ZONES v2 ) and the scripts of @ChrisMoody. Thank you Oscar and Chris for your excellent judgment and great work.
At the end of this writing you can find all the internet references of the extensive documentation that I present here. To maximize your benefits in the use of this Script, I recommend that you read the entire document to create an objective and practical criterion.
All the hours of the different exchanges are presented at GMT -6. In Market24hClock you can adjust it to your preferences.
After a deep investigation I have been able to show that the different world sessions reveal underlying investment cycles, where it is possible to find sustained changes in the nominal behavior of the trend before the passage from one session to another and in the natural overlaps between the sessions. These underlying movements generally occur 15 minutes before the start, close or overlap of the session, when the session properly starts and also 15 minutes after respectively. Therefore, this script is designed to highlight these particular trending behaviors. Try it, discover your own conclusions and let me know in the notes, thank you.
Foreign Exchange Market Hours
It is the schedule by which currency market participants can buy, sell, trade and speculate on currencies all over the world. It is open 24 hours a day during working days and closes on weekends, thanks to the fact that operations are carried out through a network of information systems, instead of physical exchanges that close at a certain time. It opens Monday morning at 8 am local time in Sydney —Australia— (which is equivalent to Sunday night at 7 pm, in New York City —United States—, according to Eastern Standard Time), and It closes at 5pm local time in New York City (which is equivalent to 6am Saturday morning in Sydney).
The Forex market is decentralized and driven by local sessions, where the hours of Forex trading are based on the opening range of each active country, becoming an efficient transfer mechanism for all participants. Four territories in particular stand out: Sydney, Tokyo, London and New York, where the highest volume of operations occurs when the sessions in London and New York overlap. Furthermore, Europe is complemented by major financial centers such as Paris, Frankfurt and Zurich. Each day of forex trading begins with the opening of Australia, then Asia, followed by Europe, and finally North America. As markets in one region close, another opens - or has already opened - and continues to trade in the currency market. The seven most traded currencies in the world are: the US dollar, the euro, the Japanese yen, the British pound, the Australian dollar, the Canadian dollar, and the New Zealand dollar.
Currencies are needed around the world for international trade, this means that operations are not dominated by a single exchange market, but rather involve a global network of brokers from around the world, such as banks, commercial companies, central banks, companies investment management, hedge funds, as well as retail forex brokers and global investors. Because this market operates in multiple time zones, it can be accessed at any time except during the weekend, therefore, there is continuously at least one open market and there are some hours of overlap between the closing of the market of one region and the opening of another. The international scope of currency trading means that there are always traders around the world making and satisfying demands for a particular currency.
The market involves a global network of exchanges and brokers from around the world, although time zones overlap, the generally accepted time zone for each region is as follows:
Sydney 5pm to 2am EST (10pm to 7am UTC)
London 3am to 12 noon EST (8pm to 5pm UTC)
New York 8am to 5pm EST (1pm to 10pm UTC)
Tokyo 7pm to 4am EST (12am to 9am UTC)
Trading Session
A financial asset trading session refers to a period of time that coincides with the daytime trading hours for a given location, it is a business day in the local financial market. This may vary according to the asset class and the country, therefore operators must know the hours of trading sessions for the securities and derivatives in which they are interested in trading. If investors can understand market hours and set proper targets, they will have a much greater chance of making a profit within a workable schedule.
Kill Zones
Kill zones are highly liquid events. Many different market participants often come together and perform around these events. The activity itself can be event-driven (margin calls or option exercise-related activity), portfolio management-driven (asset allocation rebalancing orders and closing buy-in), or institutionally driven (larger players needing liquidity to complete the size) or a combination of any of the three. This intense cross-current of activity at a very specific point in time often occurs near significant technical levels and the established trends emerging from these events often persist until the next Death Zone approaches or enters.
Kill Zones are evolving with time and the course of world history. Since the end of World War II, New York has slowly invaded London's place as the world center for commercial banking. So much so that during the latter part of the 20th century, New York was considered the new center of the financial universe. With the end of the cold war, that leadership appears to have shifted towards Europe and away from the United States. Furthermore, Japan has slowly lost its former dominance in the global economic landscape, while Beijing's has increased dramatically. Only time will tell how these death zones will evolve given the ever-changing political, economic, and socioeconomic influences of each region.
Financial Markets
New York
New York (NYSE Chicago, NASDAQ)
7:30 am - 2:00 pm
It is the second largest currency platform in the world, followed largely by foreign investors as it participates in 90% of all operations, where movements on the New York Stock Exchange (NYSE) can have an immediate effect (powerful) on the dollar, for example, when companies merge and acquisitions are finalized, the dollar can instantly gain or lose value.
A. Complementary Stock Exchanges
Brazil (BOVESPA - Brazilian Stock Exchange)
07:00 am - 02:55 pm
Canada (TSX - Toronto Stock Exchange)
07:30 am - 02:00 pm
New York (NYSE - New York Stock Exchange)
08:30 am - 03:00 pm
B. North American Trading Session
07:00 am - 03:00 pm
(from the beginning of the business day on NYSE and NASDAQ, until the end of the New York session)
New York, Chicago and Toronto (Canada) open the North American session. Characterized by the most aggressive trading within the markets, currency pairs show high volatility. As the US markets open, trading is still active in Europe, however trading volume generally decreases with the end of the European session and the overlap between the US and Europe.
C. Strategic Points
US main session starts in 1 hour
07:30 am
The euro tends to drop before the US session. The NYSE, CHX and TSX (Canada) trading sessions begin 1 hour after this strategic point. The North American session begins trading Forex at 07:00 am.
This constitutes the beginning of the overlap of the United States and the European market that spans from 07:00 am to 10:35 am, often called the best time to trade EUR / USD, it is the period of greatest liquidity for the main European currencies since it is where they have their widest daily ranges.
When New York opens at 07:00 am the most intense trading begins in both the US and European markets. The overlap of European and American trading sessions has 80% of the total average trading range for all currency pairs during US business hours and 70% of the total average trading range for all currency pairs during European business hours. The intersection of the US and European sessions are the most volatile overlapping hours of all.
Influential news and data for the USD are released between 07:30 am and 09:00 am and play the biggest role in the North American Session. These are the strategically most important moments of this activity period: 07:00 am, 08:00 am and 08:30 am.
The main session of operations in the United States and Canada begins
08:30 am
Start of main trading sessions in New York, Chicago and Toronto. The European session still overlaps the North American session and this is the time for large-scale unpredictable trading. The United States leads the market. It is difficult to interpret the news due to speculation. Trends develop very quickly and it is difficult to identify them, however trends (especially for the euro), which have developed during the overlap, often turn the other way when Europe exits the market.
Second hour of the US session and last hour of the European session
09:30 am
End of the European session
10:35 am
The trend of the euro will change rapidly after the end of the European session.
Last hour of the United States session
02:00 pm
Institutional clients and very large funds are very active during the first and last working hours of almost all stock exchanges, knowing this allows to better predict price movements in the opening and closing of large markets. Within the last trading hours of the secondary market session, a pullback can often be seen in the EUR / USD that continues until the opening of the Tokyo session. Generally it happens if there was an upward price movement before 04:00 pm - 05:00 pm.
End of the trade session in the United States
03:00 pm
D. Kill Zones
11:30 am - 1:30 pm
New York Kill Zone. The United States is still the world's largest economy, so by default, the New York opening carries a lot of weight and often comes with a huge injection of liquidity. In fact, most of the world's marketable assets are priced in US dollars, making political and economic activity within this region even more important. Because it is relatively late in the world's trading day, this Death Zone often sees violent price swings within its first hour, leading to the proven adage "never trust the first hour of trading in America. North.
---------------
London
London (LSE - London Stock Exchange)
02:00 am - 10:35 am
Britain dominates the currency markets around the world, and London is its main component. London, a central trading capital of the world, accounts for about 43% of world trade, many Forex trends often originate from London.
A. Complementary Stock Exchange
Dubai (DFM - Dubai Financial Market)
12:00 am - 03:50 am
Moscow (MOEX - Moscow Exchange)
12:30 am - 10:00 am
Germany (FWB - Frankfurt Stock Exchange)
01:00 am - 10:30 am
Afríca (JSE - Johannesburg Stock Exchange)
01:00 am - 09:00 am
Saudi Arabia (TADAWUL - Saudi Stock Exchange)
01:00 am - 06:00 am
Switzerland (SIX - Swiss Stock Exchange)
02:00 am - 10:30 am
B. European Trading Session
02:00 am - 11:00 am
(from the opening of the Frankfurt session to the close of the Order Book on the London Stock Exchange / Euronext)
It is a very liquid trading session, where trends are set that start during the first trading hours in Europe and generally continue until the beginning of the US session.
C. Middle East Trading Session
12:00 am - 06:00 am
(from the opening of the Dubai session to the end of the Riyadh session)
D. Strategic Points
European session begins
02:00 am
London, Frankfurt and Zurich Stock Exchange enter the market, overlap between Europe and Asia begins.
End of the Singapore and Asia sessions
03:00 am
The euro rises almost immediately or an hour after Singapore exits the market.
Middle East Oil Markets Completion Process
05:00 am
Operations are ending in the European-Asian market, at which time Dubai, Qatar and in another hour in Riyadh, which constitute the Middle East oil markets, are closing. Because oil trading is done in US dollars, and the region with the trading day coming to an end no longer needs the dollar, consequently, the euro tends to grow more frequently.
End of the Middle East trading session
06:00 am
E. Kill Zones
5:00 am - 7:00 am
London Kill Zone. Considered the center of the financial universe for more than 500 years, Europe still has a lot of influence in the banking world. Many older players use the European session to establish their positions. As such, the London Open often sees the most significant trend-setting activity on any trading day. In fact, it has been suggested that 80% of all weekly trends are set through the London Kill Zone on Tuesday.
F. Kill Zones (close)
2:00 pm - 4:00 pm
London Kill Zone (close).
---------------
Tokyo
Tokyo (JPX - Tokyo Stock Exchange)
06:00 pm - 12:00 am
It is the first Asian market to open, receiving most of the Asian trade, just ahead of Hong Kong and Singapore.
A. Complementary Stock Exchange
Singapore (SGX - Singapore Exchange)
07:00 pm - 03:00 am
Hong Kong (HKEx - Hong Kong Stock Exchange)
07:30 pm - 02:00 am
Shanghai (SSE - Shanghai Stock Exchange)
07:30 pm - 01:00 am
India (NSE - India National Stock Exchange)
09:45 pm - 04:00 am
B. Asian Trading Session
06:00 pm - 03:00 am
From the opening of the Tokyo session to the end of the Singapore session
The first major Asian market to open is Tokyo which has the largest market share and is the third largest Forex trading center in the world. Singapore opens in an hour, and then the Chinese markets: Shanghai and Hong Kong open 30 minutes later. With them, the trading volume increases and begins a large-scale operation in the Asia-Pacific region, offering more liquidity for the Asian-Pacific currencies and their crosses. When European countries open their doors, more liquidity will be offered to Asian and European crossings.
C. Strategic Points
Second hour of the Tokyo session
07:00 pm
This session also opens the Singapore market. The commercial dynamics grows in anticipation of the opening of the two largest Chinese markets in 30 minutes: Shanghai and Hong Kong, within these 30 minutes or just before the China session begins, the euro usually falls until the same moment of the opening of Shanghai and Hong Kong.
Second hour of the China session
08:30 pm
Hong Kong and Shanghai start trading and the euro usually grows for more than an hour. The EUR / USD pair mixes up as Asian exporters convert part of their earnings into both US dollars and euros.
Last hour of the Tokyo session
11:00 pm
End of the Tokyo session
12:00 am
If the euro has been actively declining up to this time, China will raise the euro after the Tokyo shutdown. Hong Kong, Shanghai and Singapore remain open and take matters into their own hands causing the growth of the euro. Asia is a huge commercial and industrial region with a large number of high-quality economic products and gigantic financial turnover, making the number of transactions on the stock exchanges huge during the Asian session. That is why traders, who entered the trade at the opening of the London session, should pay attention to their terminals when Asia exits the market.
End of the Shanghai session
01:00 am
The trade ends in Shanghai. This is the last trading hour of the Hong Kong session, during which market activity peaks.
D. Kill Zones
10:00 pm - 2:00 am
Asian Kill Zone. Considered the "Institutional" Zone, this zone represents both the launch pad for new trends as well as a recharge area for the post-American session. It is the beginning of a new day (or week) for the world and as such it makes sense that this zone often sets the tone for the remainder of the global business day. It is ideal to pay attention to the opening of Tokyo, Beijing and Sydney.
--------------
Sidney
Sydney (ASX - Australia Stock Exchange)
06:00 pm - 12:00 am
A. Complementary Stock Exchange
New Zealand (NZX - New Zealand Stock Exchange)
04:00 pm - 10:45 pm
It's where the global trading day officially begins. While it is the smallest of the megamarkets, it sees a lot of initial action when markets reopen Sunday afternoon as individual traders and financial institutions are trying to regroup after the long hiatus since Friday afternoon. On weekdays it constitutes the end of the current trading day where the change in the settlement date occurs.
B. Pacific Trading Session
04:00 pm - 12:00 am
(from the opening of the Wellington session to the end of the Sydney session)
Forex begins its business hours when Wellington (New Zealand Exchange) opens local time on Monday. Sydney (Australian Stock Exchange) opens in 2 hours. It is a session with a fairly low volatility, configuring itself as the calmest session of all. Strong movements appear when influential news is published and when the Pacific session overlaps the Asian Session.
C. Strategic Points
End of the Sydney session
12:00 am
---------------
Conclusions
The best time to trade is during overlaps in trading times between open markets. Overlaps equate to higher price ranges, creating greater opportunities.
Regarding press releases (news), it should be noted that these in the currency markets have the power to improve a normally slow trading period. When a major announcement is made regarding economic data, especially when it goes against the predicted forecast, the coin can lose or gain value in a matter of seconds. In general, the more economic growth a country produces, the more positive the economy is for international investors. Investment capital tends to flow to countries that are believed to have good growth prospects and subsequently good investment opportunities, leading to the strengthening of the country's exchange rate. Also, a country that has higher interest rates through its government bonds tends to attract investment capital as foreign investors seek high-yield opportunities. However, stable economic growth and attractive yields or interest rates are inextricably intertwined. It's important to take advantage of market overlaps and keep an eye out for press releases when setting up a trading schedule.
References:
www.investopedia.com
www.investopedia.com
www.investopedia.com
www.investopedia.com
market24hclock.com
market24hclock.com

Weekly Session BreakThis indicator plots a vertical line at the end of the trading week (Friday) to mark the weekly session break. It is designed to be used on intraday charts (sub-1 hour timeframes).
The line's appearance is fully customizable via the Inputs tab, allowing you to change its color, style (solid, dotted, or dashed), and thickness.
Key Features:
End-of-Week Marker: Accurately draws a vertical line on the last bar of the trading week.
Timeframe Specific: Lines are only visible on intraday charts (1-minute to 59-minute timeframes) to prevent clutter on higher timeframes.
Customizable: Adjust the line's color, style, and thickness from the Inputs menu.
