Session Range Boxes (Budapest time) GR V2.0Session Range Boxes (Budapest time)
This indicator draws intraday range boxes for the main Forex sessions based on Europe/Budapest time (CET/CEST).
Tracked sessions (Budapest time):
Asia: 01:00 – 08:00
Frankfurt (pre-London): 08:00 – 09:00
London: 09:00 – 18:00
New York: 14:30 – 23:00
For each session, the script:
Detects the session start and session end using the current chart timeframe and the Europe/Budapest time zone.
Tracks the high and low of price during the entire session.
Draws a box (rectangle) from session open to session close, covering the full price range between session high and low.
Optionally prints a small label above the first bar of each session (Asia, Fra, London, NY).
Color scheme:
Asia: soft orange box
Frankfurt: light aqua box
London: darker blue box
New York: light lime box
Use this tool to:
Quickly see which session created the high/low of the day,
Identify liquidity zones and session ranges that price may revisit,
Visually separate Asia, Frankfurt, London and New York volatility on intraday charts.
Optimized for intraday trading (Forex / indices), but it works on any symbol where session behavior matters.
Search in scripts for "sessions"

Market Profile Dominance Analyzer# Market Profile Dominance Analyzer
## 📊 OVERVIEW
**Market Profile Dominance Analyzer** is an advanced multi-factor indicator that combines Market Profile methodology with composite dominance scoring to identify buyer and seller strength across higher timeframes. Unlike traditional volume profile indicators that only show volume distribution, or simple buyer/seller indicators that only compare candle colors, this script integrates six distinct analytical components into a unified dominance measurement system.
This indicator helps traders understand **WHO controls the market** by analyzing price position relative to Market Profile key levels (POC, Value Area) combined with volume distribution, momentum, and trend characteristics.
## 🎯 WHAT MAKES THIS ORIGINAL
### **Hybrid Analytical Approach**
This indicator uniquely combines two separate methodologies that are typically analyzed independently:
1. **Market Profile Analysis** - Calculates Point of Control (POC) and Value Area (VA) using volume distribution across price channels on higher timeframes
2. **Multi-Factor Dominance Scoring** - Weights six independent factors to produce a composite dominance index
### **Six-Factor Composite Analysis**
The dominance score integrates:
- Price position relative to POC (equilibrium assessment)
- Price position relative to Value Area boundaries (acceptance/rejection zones)
- Volume imbalance within Value Area (institutional bias detection)
- Price momentum (directional strength)
- Volume trend comparison (participation analysis)
- Normalized Value Area position (precise location within fair value zone)
### **Adaptive Higher Timeframe Integration**
The script features an intelligent auto-selection system that automatically chooses appropriate higher timeframes based on the current chart period, ensuring optimal Market Profile structure regardless of the trading timeframe being analyzed.
## 💡 HOW IT WORKS
### **Market Profile Construction**
The indicator builds a Market Profile structure on a higher timeframe by:
1. **Session Identification** - Detects new higher timeframe sessions using `request.security()` to ensure accurate period boundaries
2. **Data Accumulation** - Stores high, low, and volume data for all bars within the current higher timeframe session
3. **Channel Distribution** - Divides the session's price range into configurable channels (default: 20 rows)
4. **Volume Mapping** - Distributes each bar's volume proportionally across all price channels it touched
### **Key Level Calculation**
**Point of Control (POC)**
- Identifies the price channel with the highest accumulated volume
- Represents the price level where the most trading activity occurred
- Serves as a magnetic level where price often returns
**Value Area (VA)**
- Starts at POC and expands both upward and downward
- Includes channels until reaching the specified percentage of total volume (default: 70%)
- Expansion algorithm compares adjacent volumes and prioritizes the direction with higher activity
- Defines the "fair value" zone where most market participants agreed to trade
### **Dominance Score Formula**
```
Dominance Score = (price_vs_poc × 10) +
(price_vs_va × 5) +
(volume_imbalance × 0.5) +
(price_momentum × 100) +
(volume_trend × 5) +
(va_position × 15)
```
**Component Breakdown:**
- **price_vs_poc**: +1 if above POC, -1 if below (shows which side of equilibrium)
- **price_vs_va**: +2 if above VAH, -2 if below VAL, 0 if inside VA
- **volume_imbalance**: Percentage difference between upper and lower VA volumes
- **price_momentum**: 5-period SMA of price change (directional acceleration)
- **volume_trend**: Compares 5-period vs 20-period volume averages
- **va_position**: Normalized position within Value Area (-1 to +1)
The composite score is then smoothed using EMA with configurable sensitivity to reduce noise while maintaining responsiveness.
### **Market State Determination**
- **BUYERS Dominant**: Smooth dominance > +10 (bullish control)
- **SELLERS Dominant**: Smooth dominance < -10 (bearish control)
- **NEUTRAL**: Between -10 and +10 (balanced market)
## 📈 HOW TO USE THIS INDICATOR
### **Trend Identification**
- **Green background** indicates buyers are in control - look for long opportunities
- **Red background** indicates sellers are in control - look for short opportunities
- **Gray background** indicates neutral market - consider range-bound strategies
### **Signal Interpretation**
**Buy Signals** (green triangle) appear when:
- Dominance crosses above -10 from oversold conditions
- Previous state was not already bullish
- Suggests shift from seller to buyer control
**Sell Signals** (red triangle) appear when:
- Dominance crosses below +10 from overbought conditions
- Previous state was not already bearish
- Suggests shift from buyer to seller control
### **Value Area Context**
Monitor the information table (top-right) to understand market structure:
- **Price vs POC**: Shows if trading above/below equilibrium
- **Volume Imbalance**: Positive values favor buyers, negative favors sellers
- **Market State**: Current dominant force (BUYERS/SELLERS/NEUTRAL)
### **Multi-Timeframe Strategy**
The auto-timeframe feature analyzes higher timeframe structure:
- On 1-minute charts → analyzes 2-hour structure
- On 5-minute charts → analyzes Daily structure
- On 15-minute charts → analyzes Weekly structure
- On Daily charts → analyzes Yearly structure
This higher timeframe context helps avoid counter-trend trades against the dominant force.
### **Confluence Trading**
Strongest signals occur when multiple factors align:
1. Price above VAH + positive volume imbalance + buyers dominant = Strong bullish setup
2. Price below VAL + negative volume imbalance + sellers dominant = Strong bearish setup
3. Price at POC + neutral state = Potential breakout/breakdown pivot
## ⚙️ INPUT PARAMETERS
- **Higher Time Frame**: Select specific HTF or use 'Auto' for intelligent selection
- **Value Area %**: Percentage of volume contained in VA (default: 70%)
- **Show Buy/Sell Signals**: Toggle signal triangles visibility
- **Show Dominance Histogram**: Toggle histogram display
- **Signal Sensitivity**: EMA period for dominance smoothing (1-20, default: 5)
- **Number of Channels**: Market Profile resolution (10-50, default: 20)
- **Color Settings**: Customize buyer, seller, and neutral colors
## 🎨 VISUAL ELEMENTS
- **Histogram**: Shows smoothed dominance score (green = buyers, red = sellers)
- **Zero Line**: Neutral equilibrium reference
- **Overbought/Oversold Lines**: ±50 levels marking extreme dominance
- **Background Color**: Highlights current market state
- **Information Table**: Displays key metrics (state, dominance, POC relationship, volume imbalance, timeframe, bars in session, total volume)
- **Signal Shapes**: Triangle markers for buy/sell signals
## 🔔 ALERTS
The indicator includes three alert conditions:
1. **Buyers Dominate** - Fires on buy signal crossovers
2. **Sellers Dominate** - Fires on sell signal crossovers
3. **Dominance Shift** - Fires when dominance crosses zero line
## 📊 BEST PRACTICES
### **Timeframe Selection**
- **Scalping (1-5min)**: Focus on 2H-4H dominance shifts
- **Day Trading (15-60min)**: Monitor Daily and Weekly structure
- **Swing Trading (4H-Daily)**: Track Weekly and Monthly dominance
### **Confirmation Strategies**
1. **Trend Following**: Enter in direction of dominance above/below ±20
2. **Reversal Trading**: Fade extreme readings beyond ±50 when diverging with price
3. **Breakout Trading**: Look for dominance expansion beyond ±30 with increasing volume
### **Risk Management**
- Avoid trading during NEUTRAL states (dominance between -10 and +10)
- Use POC levels as logical stop-loss placement
- Consider VAH/VAL as profit targets for mean reversion
## ⚠️ LIMITATIONS & WARNINGS
**Data Requirements**
- Requires sufficient historical data on current chart (minimum 100 bars recommended)
- Lower timeframes may show fewer bars per HTF session initially
- More accurate results after several complete HTF sessions have formed
**Not a Standalone System**
- This indicator analyzes market structure and participant control
- Should be combined with price action, support/resistance, and risk management
- Does not guarantee profitable trades - past dominance does not predict future results
**Repainting Characteristics**
- Higher timeframe levels (POC, VAH, VAL) update as new bars form within the session
- Dominance score recalculates with each new bar
- Historical signals remain fixed, but current session data is developing
**Volume Limitations**
- Uses exchange-provided volume data which varies by instrument type
- Forex and some CFDs use tick volume (not actual transaction volume)
- Most accurate on instruments with reliable volume data (stocks, futures, crypto)
## 🔍 TECHNICAL NOTES
**Performance Optimization**
- Uses `max_bars_back=5000` for extended historical analysis
- Efficient array management prevents memory issues
- Automatic cleanup of session data on new period
**Calculation Method**
- Market Profile uses actual volume distribution, not TPO (Time Price Opportunity)
- Value Area expansion follows traditional Market Profile auction theory
- All calculations occur on the chart's current symbol and timeframe
## 📚 EDUCATIONAL VALUE
This indicator helps traders understand:
- How institutional traders use Market Profile to identify fair value
- The relationship between price, volume, and market acceptance
- Multi-factor analysis techniques for assessing market conditions
- The importance of higher timeframe structure in trade planning
## 🎓 RECOMMENDED READING
To better understand the concepts behind this indicator:
- "Mind Over Markets" by James Dalton (Market Profile foundations)
- "Markets in Profile" by James Dalton (Value Area analysis)
- Volume Profile analysis in institutional trading
## 💬 USAGE TERMS
This indicator is provided as an educational and analytical tool. It does not constitute financial advice, investment recommendations, or trading signals. Users are responsible for their own trading decisions and should conduct their own research and due diligence.
Trading involves substantial risk of loss. Past performance does not guarantee future results. Always use proper risk management and never risk more than you can afford to lose.

Force DashboardScalping Dashboard - Complete User Guide
Overview
This scalping system consists of two complementary TradingView indicators designed for intraday trading with no overnight holds:
Force Dashboard - Single-row table showing real-time market bias and entry signals
Large Order Detection - Visual diamonds showing institutional order flow
Together, they provide a complete at-a-glance view of market conditions optimized for quick entries and exits.
Recommended Timeframes
Primary Scalping Timeframes
1-minute chart: Ultra-fast scalps (30 seconds - 3 minutes hold time)
2-minute chart: Quick scalps (2-5 minutes hold time)
5-minute chart: Standard scalps (5-15 minutes hold time)
Best Practices
Use 1-2 minute for highly liquid instruments (ES, NQ, major forex pairs)
Use 5-minute for less liquid markets or if you prefer fewer signals
Never hold past the last hour of trading to avoid overnight risk
Set hard stop times (e.g., exit all positions by 3:45 PM EST)
Dashboard Components Explained
Core Indicators (Circles ●)
MACD (5/13/5)
Green ● = Bullish momentum (MACD histogram positive)
Red ● = Bearish momentum (MACD histogram negative)
Gray ● = No clear momentum
Use: Confirms trend direction and momentum shifts
EMA (9/20/50)
Green ● = Price > EMA9 > EMA20 (uptrend)
Red ● = Price < EMA9 < EMA20 (downtrend)
Gray ● = Choppy/sideways
Use: Identifies the immediate micro-trend
Stoch (5-period Stochastic)
Green ● = Oversold (<20) - potential reversal up
Red ● = Overbought (>80) - potential reversal down
Gray ● = Neutral zone (20-80)
Use: Spots reversal opportunities at extremes
RSI (7-period)
Green ● = Oversold (<30)
Red ● = Overbought (>70)
Gray ● = Neutral
Use: Confirms overbought/oversold conditions
CVD (Cumulative Volume Delta)
Green ● = CVD above its moving average (buying pressure)
Red ● = CVD below its moving average (selling pressure)
Gray ● = Neutral
Use: Shows overall buying vs selling pressure
ΔCVD (Delta CVD - Rate of Change)
Green ● = CVD accelerating upward (buying acceleration)
Red ● = CVD accelerating downward (selling acceleration)
Gray ● = No acceleration
Use: Detects momentum shifts in order flow
Imbal (Order Flow Imbalance)
Green ● = Buy pressure >2x sell pressure
Red ● = Sell pressure >2x buy pressure
Gray ● = Balanced
Use: Identifies extreme one-sided order flow
Vol (Volume Strength)
Green ● = Volume >1.5x average (strong interest)
Red ● = Volume <0.7x average (low interest)
Gray ● = Normal volume
Yellow background = Volume surge (>2x average) - BIG MOVE ALERT
Use: Confirms conviction behind price moves
Tape (Tape Speed)
Green ● = Fast order flow (>1.3x normal)
Red ● = Slow order flow (<0.7x normal)
Gray ● = Normal speed
Yellow background = Very fast tape (>1.5x) - RAPID EXECUTION ALERT
Use: Measures urgency and speed of orders
Key Levels
Support (Supp)
Shows the nearest high-volume support level below current price
Bright Green background = Price is AT support (within 0.3%) - BOUNCE ZONE
Green background = Price above support (healthy)
Red background = Price below support (broken support, now resistance)
Resistance (Res)
Shows the nearest high-volume resistance level above current price
Bright Orange background = Price is AT resistance (within 0.3%) - REJECTION ZONE
Red background = Price below resistance (facing overhead supply)
Green background = Price above resistance (breakout)
These levels update automatically every 3 bars based on volume profile
Entry Signal Components
Score
Displays format: "6L" (6 long indicators) or "4S" (4 short indicators)
Bright Green = 6-7 indicators aligned for long
Light Green = 5 indicators aligned for long
Yellow = 4 indicators aligned (weaker setup)
Gray = No alignment
Red/Orange colors = Same scale for short setups
Score of 5+ indicates high-probability setup
SCALP (Main Entry Signal)
BRIGHT GREEN "LONG" = High-quality long scalp (Score 5+)
Green "LONG" = Decent long scalp (Score 4)
BRIGHT ORANGE "SHORT" = High-quality short scalp (Score 5+)
Red "SHORT" = Decent short scalp (Score 4)
Gray "WAIT" = No clear setup - STAY OUT
Entry Strategies
Strategy 1: High-Probability Scalps (Conservative)
When to Enter:
SCALP column shows BRIGHT GREEN "LONG" or BRIGHT ORANGE "SHORT"
Score is 5 or higher
Vol or Tape has yellow background (volume surge)
Example Long Setup:
SCALP = BRIGHT GREEN "LONG"
Score = 6L
Vol = Yellow background
Price AT Support (bright green Supp cell)
EMA, MACD, CVD, ΔCVD, Imbal all green
Entry: Enter immediately on next candle
Target: 0.5-1% move or resistance level
Stop: Below support or -0.3%
Hold Time: 2-10 minutes
Strategy 2: Momentum Scalps (Aggressive)
When to Enter:
Tape has yellow background (fast tape)
Vol has yellow background (volume surge)
ΔCVD is green (for longs) or red (for shorts)
Imbal shows strong imbalance in your direction
Score is 4+
Example Short Setup:
Tape & Vol = Yellow backgrounds
ΔCVD = Red, Imbal = Red
Price AT Resistance (bright orange)
Score = 5S
Entry: Enter immediately
Target: Quick 0.3-0.7% move
Stop: Tight -0.2%
Hold Time: 1-5 minutes
Strategy 3: Reversal Scalps (Mean Reversion)
When to Enter:
Stoch shows oversold (green) or overbought (red)
RSI confirms the extreme
Price is AT Support (for longs) or AT Resistance (for shorts)
ΔCVD and Imbal start reversing direction
Score is 4+
Example Long Setup:
Stoch = Green (oversold)
RSI = Green (oversold)
Supp = Bright green (at support)
ΔCVD turns green
Imbal turns green
Score = 4L or 5L
Entry: Wait for confirmation candle
Target: Move back to EMA9 or mid-range
Stop: Below the low
Hold Time: 3-8 minutes
Large Order Detection Usage
Diamond Signals
Green diamonds below bar = Large buy orders (institutional buying)
Red diamonds above bar = Large sell orders (institutional selling)
Size matters: Larger diamonds = larger order flow
How to Use with Dashboard
Confirmation Entries
Dashboard shows "LONG" signal
Green diamond appears
Enter immediately - institutions are buying
Divergence Alerts (CAUTION)
Dashboard shows "LONG" signal
RED diamond appears (institutions selling)
DO NOT ENTER - conflicting order flow
Cluster Patterns
Multiple green diamonds in row = Strong accumulation, stay long
Multiple red diamonds in row = Strong distribution, stay short
Alternating colors = Chop, avoid trading
Risk Management Rules
Position Sizing
Risk 0.5-1% of account per scalp
Maximum 3 concurrent positions
Reduce size after 2 consecutive losses
Stop Loss Guidelines
Tight stops: 0.2-0.3% for 1-2 min charts
Standard stops: 0.3-0.5% for 5 min charts
Always use stop loss - no exceptions
Place stops below support (longs) or above resistance (shorts)
Take Profit Targets
Target 1: 0.3-0.5% (take 50% off)
Target 2: 0.7-1% (take remaining 50%)
Move stop to breakeven after Target 1 hit
Trail stop if Score remains high
Time-Based Exits
Exit immediately if:
SCALP changes from LONG/SHORT to WAIT
Score drops below 3
Large diamond appears in opposite direction
Maximum hold time: 15 minutes (even if profitable)
Hard exit time: 30 minutes before market close
Trading Sessions
Best Times to Scalp
High-Liquidity Sessions
9:30-11:00 AM EST (Market open, highest volume)
2:00-3:30 PM EST (Afternoon session, good moves)
Avoid
11:30 AM-1:30 PM EST (Lunch, low volume)
Last 30 minutes (unpredictable, don't initiate new trades)
News releases (wait 5 minutes for volatility to settle)
Common Patterns & Setups
The Perfect Storm (Highest Probability)
Score = 6L or 7L
SCALP = BRIGHT GREEN
Vol + Tape = Yellow backgrounds
Green diamond appears
Price AT Support
Win rate: ~70-80%
The Fade Setup (Counter-Trend)
Price hits resistance (bright orange)
Stoch + RSI overbought (red)
Red diamond appears
CVD starts turning red
SCALP shows "SHORT"
Win rate: ~60-70%
The Breakout Continuation
Price breaks resistance (Res turns green)
EMA, MACD green
Vol surge (yellow)
Multiple green diamonds
SCALP = "LONG"
Win rate: ~65-75%
Warning Signs - DO NOT TRADE
Red Flags
❌ SCALP shows "WAIT"
❌ Score below 3
❌ Vol and Tape both gray (no volume)
❌ Conflicting signals (dashboard says LONG but red diamonds appearing)
❌ Alternating green/red circles (choppy market)
❌ Support and Resistance very close together (tight range)
Market Conditions to Avoid
Low volume periods
Major news releases (first 5 minutes after)
First 2 minutes after market open
Wide spreads
Consecutive losing trades (take a break after 2 losses)
Quick Reference Checklist
Before Taking ANY Trade:
☑ SCALP shows LONG or SHORT (not WAIT)
☑ Score is 4 or higher
☑ Vol or Tape shows activity
☑ No conflicting diamond signals
☑ Stop loss level identified
☑ Target profit level identified
☑ Not in restricted time periods
After Entering:
☑ Set stop loss immediately
☑ Set profit targets
☑ Watch SCALP column - exit if changes to WAIT
☑ Watch for opposite-colored diamonds
☑ Move stop to breakeven after first target
☑ Exit all by market close
Advanced Tips
Scalping Psychology
Be patient: Wait for Score 5+ setups
Be decisive: When signal appears, act immediately
Be disciplined: Follow your stop loss always
Be flexible: Exit quickly if dashboard reverses
Optimization
Backtest on your specific instrument
Adjust RSI/Stoch levels for your market
Fine-tune volume thresholds
Keep a trade journal to track which setups work best
Multi-Timeframe Confirmation
Use 5-min dashboard as "trend filter"
Take 1-min trades only in direction of 5-min SCALP signal
Increases win rate by ~10-15%
Troubleshooting
Q: Dashboard shows WAIT most of the time
Normal - scalping is about patience. Quality > Quantity
3-8 good setups per day is excellent
Q: Too many false signals
Increase minimum Score requirement to 5 or 6
Only trade with volume surge (yellow backgrounds)
Add large order detection confirmation
Q: Signals too slow
You may be on too high a timeframe
Try 1-minute chart for faster signals
Ensure real-time data feed is active
Q: Support/Resistance not updating
Normal - updates every 3 bars
If completely stuck, remove and re-add indicator
Summary
This scalping system works best when:
✅ Multiple indicators align (Score 5+)
✅ Volume and tape speed confirm the move
✅ Order flow (diamonds) confirms direction
✅ Price is at key levels (support/resistance)
✅ You manage risk strictly
✅ You exit before market close
The golden rule: When SCALP says WAIT, you WAIT. Discipline beats frequency.

ORB 30 Alerts (ATH)Overview
ATH ORB 30m automates the Opening Range Breakout (ORB) process across multiple global sessions — Tokyo, London, and New York — and delivers clean, consolidated alerts when fresh breakouts occur.
It’s built for traders who track several tickers and want precise, non-repeating signals that reflect genuine momentum shifts, not constant noise.
How it works
The script defines a 30-minute Opening Range (ORB) for each enabled session and plots its high, low, and midpoint levels.
Every 10-minute candle close is evaluated to detect first-time crosses of those range boundaries — upward or downward.
Once a breakout triggers, that side’s alert is disabled until price returns inside the range, where the system automatically re-arms.
Multiple triggers in the same bar are batched into one combined alert, listing all symbols that broke out.
A built-in debug panel and optional chart labels visualize each trigger and re-arm event in real time.
Key features
-Multi-session ORB logic (Tokyo, London, New York)
-10-minute confirmation filter to validate breakouts
-Automatic alert re-arming when price re-enters range
-Combined per-bar alert messages (no duplicates)
-Optional on-chart labels and debug diagnostics
-Optimized for watchlists and multi-symbol scanners
Usage
Designed for day traders and momentum scalpers, this tool highlights early directional strength during market opens.
Add it to your chart, enable your preferred sessions, and set alert conditions for “ORB Breakouts (BUY),” “ORB Breakdowns (SELL),” or "Any alert() function call" You’ll receive one concise message each bar showing exactly which symbols broke out and in which direction.
DISCLAIMER:
This script is for educational and informational purposes only.
It does not constitute financial advice or a recommendation to buy or sell any security.
Always perform your own due diligence and backtesting before using any trading strategy live.
Trading involves risk; past performance does not guarantee future results.

📋 Trading Checklist – Precision Entry SystemTake your trading discipline to the next level with this Precision Trading Checklist for TradingView. Designed for intraday traders following liquidity, structure, and Smart Money Concepts (SMC) AKA ICT Concepts, this overlay ensures you never miss a key confirmation before entering a trade.
Features:
✅ Pre-Market Preparation: Track previous session highs/lows, AM/PM sessions, and key liquidity zones.
✅ Bias & Narrative Check: Quickly confirm daily trend, price position relative to daily open, and higher timeframe confluence.
✅ Session-Specific Rules: Focused sessions like Silver Bullet (10:00–11:30), Afternoon (13:30–15:00), and Final Hour (15:00–16:00).
✅ Structure & Setup Validation: Confirm liquidity sweeps, market structure shifts, expansion candles, fair value gaps, and order blocks.
✅ Risk Management Reminders: Stop-loss, target points, risk percentage, breakeven management, and pyramiding rules.
✅ Post-Trade Journaling: Document entries, session, setup type, trade outcome, and grading for continuous improvement.
✅ Golden Rules: Visual reminders to enforce discipline, avoid emotional trades, and respect session limits.
Why Use It:
This checklist is perfect for traders who want to stay consistent, minimise mistakes, and follow a disciplined routine. Displayed as an overlay on your chart, it provides all essential checks in one glance, keeping you focused on the setup rather than scrolling through notes or separate trackers.
How to use:
Add the indicator to your chart
Click the settings/gear icon
Check off items as you complete them
The checklist on your chart updates in real-time with green checkmarks!
The checkboxes will persist as long as the indicator is on your chart,
making it perfect for tracking your pre-trade and post-trade routines!
Follow the checklist items step by step before entering trades.
Use the session-specific guidelines to filter setups.
Journal your trades post-execution for growth and analysis.

Quantura - Average Intraday Candle VolumeIntroduction
“Quantura – Average Intraday Candle Volume” is a quantitative visualization tool that calculates and displays the average traded volume for each intraday time position based on a user-defined historical lookback period. It allows traders to analyze recurring intraday volume patterns, identify high-activity sessions, and detect liquidity shifts throughout the trading day.
Originality & Value
This indicator goes beyond standard volume averages by normalizing and aligning volume data according to the time of day. Instead of simply smoothing recent bars, it builds an intraday volume profile based on historical daily averages, enabling users to understand when during the day volume typically peaks or drops.
Its originality and usefulness come from:
Converting standard volume data into time-aligned intraday averages.
Visualization of historical intraday liquidity behavior, not just total daily volume.
Dynamic scaling using normalization and transparency to emphasize active and quiet periods.
Optional day-separator lines for precise intraday structure recognition.
Gradient-based coloring for better visual interpretation of volume intensity.
Functionality & Core Logic
The indicator divides each day into discrete intraday time positions (based on chart timeframe).
For each position, it stores and updates historical volume values across the selected number of days.
It calculates an average volume per time position by aggregating all stored values and dividing them by the number of valid days.
The result is plotted as a continuous histogram showing typical intraday volume distribution.
The bar colors and transparency dynamically reflect the relative intensity of volume at each point in the day.
Parameters & Customization
Number of Days for Averaging: Defines how many past days are included in the volume average calculation (default: 365).
UTC Offset: Allows synchronization of intraday cycles with local or exchange time zones.
Base Color: Sets the main color for plotted volume columns.
Color Mode: Choose between “Gradient” (transparency dynamically adjusts by intensity) or “Normal” (fixed opacity).
Day Line: Toggles dashed vertical lines marking the start of each trading day.
Visualization & Display
Volume is plotted as a series of histogram bars, each representing the average volume for a specific intraday time position.
A gradient color mode enhances readability by fading lower-intensity areas and highlighting high-volume regions.
Optional day-separator lines visually segment historical sessions for easy reference.
Works seamlessly across all chart timeframes that divide the 24-hour day into regular bar intervals.
Use Cases
Identify when trading activity typically peaks (e.g., session opens, news windows, or overlapping markets).
Compare current intraday volume to historical averages for early anomaly detection.
Enhance algorithmic or discretionary strategies that depend on volume-timing alignment.
Combine with volatility or price structure indicators to confirm market activity zones.
Evaluate session consistency across different time zones using the UTC offset parameter.
Limitations & Recommendations
The indicator requires intraday data (below 1D resolution) to function properly.
Volume behavior may vary across brokers and assets; adjust averaging period accordingly.
Does not predict price movement — it provides volume-based context for analysis.
Works best when combined with structure or momentum-based indicators.
Markets & Timeframes
Compatible with all intraday markets — including crypto, Forex, equities, and futures — and all intraday timeframes (from 1 minute to 4 hours). It is particularly valuable for analyzing assets with continuous 24-hour trading activity.
Author & Access
Developed 100% by Quantura. Published as a Open-source script indicator. Access is free.
Important
This description complies with TradingView’s Script Publishing and House Rules. It provides a clear explanation of the indicator’s originality, logic, and purpose, without any unrealistic performance or predictive claims.

X Tail that Wagsintraday session-framework and ETH-anchored VWAP tool for TradingView. It draws today’s OVN (ETH) high/mid/low, today’s RTH-day open, previous day open/high/low, and a carried ETH VWAP handle (yesterday’s 4:00 PM NY VWAP, projected forward) to give you a clean, non-repainting scaffold for bias, structure, and execution. All timestamps are New York–local with DST handled explicitly, so historical sessions align correctly across time changes.
Key Capabilities
ETH OVN Range (18:00 → 09:30 NY)
Captures the rolling overnight high/low and computes the mid; at 09:30 NY it locks those levels and extends them to 16:00 NY (same day).
Optional labels (size/color configurable) placed slightly to the right of the 4 PM timestamp for readability.
Daily Handles (Today & Previous Day)
Today’s open line starts at the ETH open (anchor preserved) and extends toward 4 PM NY (or up to the “current bar + 5 bars” cap), with label control.
Previous day open/high/low plotted as discrete reference lines for carry-over structure.
ETH-Anchored VWAP (Live) + Bands
ETH-anchored VWAP runs only during the active ETH session (DST-aware).
Optional VWAP bands (0.5×, 1.0×, 2.0× multipliers) plotted as line-break series.
Carried ETH VWAP Handle (PD 4 PM Snapshot)
At 16:00 NY, the script snapshots the final ETH VWAP value.
On the next ETH open, it projects that value as a static dashed line through the session (non-mutating, non-repainting), with optional label.
Labeling & Styling
Single-toggle label system with color and five sizes.
Per-line color/width controls for quick visual hierarchy.
Internal “tail” logic keeps right endpoints near price (open-anchored lines extend to min(4 PM, now + 5 bars)), avoiding chart-wide overdraw.
Robust Session Logic
All session boundaries computed in NY local time; DST rules applied for historical bars.
Cross-midnight windows handled safely (no gaps or misalignment around day rolls).
Primary Use Cases
Session Bias & Context
Use OVN H/M/L and today’s open to define structural bias zones before RTH begins. A break-and-hold above OVN mid, for example, can filter long ideas; conversely, rejection at OVN high can warn of mean reversion.
Carry-Forward Mean/Value Reference
The carried ETH VWAP (PD 4 PM) acts as a “value memory” line for the next day. Traders can:
Fade tests away from it in balanced conditions,
Use it as a pullback/acceptance gauge during trends,
Track liquidity grabs when price spikes through and reclaims.
Execution Planning & Risk
Anchor stops/targets around PD H/L and OVN H/M/L for well-defined invalidation.
Combine with your entry model (order-flow, momentum, or pattern) to time fades at range extremes or momentum breaks from OVN mid.
Confluence Mapping
Layer the tool with opening range tools, HTF zones, or profile/VWAPs (weekly/daily) to spot high-quality confluence where multiple references cluster.
Regime & Day-Type Read
Quickly see whether RTH accepts/rejects the OVN range or gravitates to PD VWAP handle, helping classify the day (trend, balanced, double-distribution, etc.).
Quick Start
Apply to your intraday chart (any instrument supported by TradingView; best on ≤15m for live intraday context).
In Current Day group, keep Open and OVN HL on; optionally display the mid.
In Previous Day group, enable PD Open/HL for carry-over levels.
Enable AVWAP if you want live ETH-anchored VWAP and its Bands for distance context.
Keep PD VWAP on to project yesterday’s 4 PM ETH VWAP as a static dashed line into today.
Use the Label group to size/color the on-chart tags.
Settings Overview (Plain-English)
Label: Toggle labels on/off; choose label text color and size.
Current Day:
Open (color/width) — daily open line anchored at ETH open.
OVN HL (and Mid) — overnight high/low and midpoint, locked at 09:30 and extended to 16:00.
AVWAP + Bands — ETH-anchored VWAP with optional 0.5×/1×/2× bands.
Previous Day:
PD Open/HL — yesterday’s daily handles.
PD VWAP — the carried snapshot of yesterday’s 4 PM ETH VWAP projected forward (dashed).
Notes & Best Practices
Time Zone: All session logic is hard-coded to America/New_York and DST-robust. No manual DST tweaks required.
Non-Repainting: The carried PD VWAP line is a snapshot; once drawn, it does not back-fill or mutate.
Intraday Use: Designed for intraday execution. It will display on higher TFs, but the session granularity is most informative at ≤15m.
Performance: Script caps lines/labels (500) and uses short “tails” to keep charts responsive.
Compatibility: Uses request.security(..., "D", series, lookahead_on) intentionally to lock daily handles early for planning; this is by design.
Typical Playbook Examples
Fade Extremes in Balance: As RTH opens inside OVN, look for rejection wicks at OVN High with confluence from PD VWAP handle overhead; risk above OVN High.
Trend Continuation: In directional sessions, acceptances above OVN Mid with price pulling back to the live ETH VWAP can offer continuation entries.
Reversion to Value: Sharp extensions away from the carried PD VWAP that quickly stall often revert to that handle; use it as a target or as an acceptance test.

Volume Area 80 Rule Pro - Adaptive RTHSummary in one paragraph
Adaptive value area 80 percent rule for index futures large cap equities liquid crypto and major FX on intraday timeframes. It focuses activity only when multiple context gates align. It is original because the classic prior day value area traverse is fused with a daily regime classifier that remaps the operating parameters in real time.
Scope and intent
• Markets. ES NQ SPY QQQ large cap equities BTC ETH major FX pairs and other liquid RTH instruments
• Timeframes. One minute to one hour with daily regime context
• Default demo used in the publication. ES1 on five minutes
• Purpose. Trade only the balanced days where the 80 percent traverse has edge while standing aside or tightening rules during trend or shock
Originality and usefulness
• Unique fusion. Prior day value area logic plus a rolling daily regime classifier using percentile ranks of realized volatility and ADX. The regime remaps hold time end of window stop buffer and value area coverage on each session
• Failure mode addressed. False starts during strong trend or shock sessions and weak traverses during quiet grind
• Testability. All gates are visible in Inputs and debug flags can be plotted so users can verify why a suggestion appears
• Portable yardstick. The regime uses ATR divided by close and ADX percent ranks which behave consistently across symbols
Method overview in plain language
The script builds the prior session profile during regular trading hours. At the first regular bar it freezes yesterday value area low value area high and point of control. It then evaluates the current session open location the first thirty minute volume rank the open gap rank and an opening drive test. In parallel a daily series classifies context into Calm Balance Trend or Shock from rolling percentile ranks of realized volatility and ADX. The classifier scales the rules. Calm uses longer holds and a slightly wider value area. Trend and Shock shorten the window reduce holds and enlarge stop buffers.
Base measures
• Range basis. True Range smoothed over a configurable length on both the daily and intraday series
• Return basis. Not required. ATR over close is the unit for regime strength
Components
• Prior Value Area Engine. Builds yesterday value area low value area high and point of control from a binned volume profile with automatic TPO fallback and minimum integrity guards
• Opening Location. Detects whether the session opens above the prior value area or below it
• Inside Hold Counter. Counts consecutive bars that hold inside the value area after a re entry
• Volume Gate. Percentile of the first thirty minutes volume over a rolling sample
• Gap Gate. Percentile rank of the regular session open gap over a rolling sample
• Drive Gate. Opening drive check using a multiple of intraday ATR
• Regime Classifier. Percentile ranks of daily ATR over close and daily ADX classify Calm Balance Trend Shock and remap parameters
• Session windows optional. Windows follow the chart exchange time
Fusion rule
Minimum satisfied gates approach. A re entry must hold inside the value area for a regime scaled number of bars while the volume gap and drive gates allow the setup. The regime simultaneously scales value area coverage end minute time stop and stop buffer.
Signal rule
• Long suggestion appears when price opens below yesterday value area then re enters and holds for the required bars while all gates allow the setup
• Short suggestion appears when price opens above yesterday value area then re enters and holds for the required bars while all gates allow the setup
• WAIT shows implicitly when any required gate is missing
• Exit labels mark target touch stop touch or a time based close
Inputs with guidance
Setup
• Signal timeframe. Uses the chart by default
• Session windows optional. Start and end minutes inside regular trading hours
• Invert direction is not used. The logic is symmetric
Logic
• Hold bars inside value area. Typical range 3 to 12. Raising it reduces trades and favors better traverses. Lowering it increases frequency and risk of false starts
• Earliest minute since RTH open and Latest minute since RTH open. Typical range 0 to 390. Reducing the latest minute cuts late session trades
• Time stop bars after entry. Typical range 6 to 30. Larger values give setups more room
Filters
• Value area coverage. Typical range 0.70 to 0.85. Higher coverage narrows the traverse but accepts fewer days
• Bin size in ticks. Typical range 1 to 8. Larger bins stabilize noisy profiles
• Stop buffer ticks beyond edge. Typical range 2 to 20. Larger buffers survive noise
• First thirty minute volume percentile. Typical range 0.30 to 0.70. Higher values require more active opens
• Gap filter percentile. Typical range 0.70 to 0.95. Lower values block more gap days
• Opening drive multiple and bars. Higher multiple or longer bars block strong directional opens
Adaptivity
• Lookback days for regime ranks. Typical 150 to 500
• Calm RV percentile. Typical 25 to 45
• Trend ADX percentile. Typical 55 to 75
• Shock RV percentile. Typical 75 to 90
• End minute ratio in Trend and Shock. Typical 0.5 to 0.8
• Hold and Time stop scales per regime. Use values near one to keep behavior close to static settings
Realism and responsible publication
• No performance claims. Past results never guarantee future outcomes
• Shapes can move while a bar forms and settle on close
• Sessions use the chart exchange time
Honest limitations and failure modes
• Economic releases and thin liquidity can break the balance premise
• Gap heavy symbols may work better with stronger gap filters and a True Range focus
• Very quiet regimes reduce signal contrast. Consider longer windows or higher thresholds
Legal
Education and research only. Not investment advice. Test in simulation before any live use.

RAFEN-G - Kill Zones & Institutional Gaps🔍 What It Does
Kill Zones (KZ1, KZ2, KZ3)
Automatically highlights the main intraday liquidity windows such as the London open, NY AM, and NY PM sessions — customizable by time, color, and transparency.
Perfect for timing setups, identifying liquidity sweeps, or backtesting session behavior.
Institutional GAP Detection (NY 11:00 → 03:00)
Anchored on the New York H1 clock, the script automatically draws the “institutional gap” between the 11:00 close and the 03:00 open of the next trading day.
Each gap is drawn as a transparent box with a label showing its size in price units.
Dynamic Cleanup & Color Updates
Automatically removes old boxes beyond your chosen history limit and keeps all visuals perfectly synchronized in real-time.
⚙️ Key Features
3 fully independent and editable Kill Zones
Adjustable timezone (default: America/New_York)
Works on all intraday timeframes
Auto-management of historical data
Clean and lightweight visuals (up to 2000 boxes)
Real-time color and transparency updates
Alerts when each Kill Zone starts
🧠 Ideal For
Traders using ICT, SMC, or institutional frameworks who want clear visual separation of market sessions and automatic tracking of session-to-session gaps for confluence or imbalance analysis.
🕐 Recommended Use
Apply on 5 min / 15 min / 1 h charts, align timezone to NYC, and combine with liquidity or FVG tools for maximum insight.

Time & Session Dividers### indicator Summary
This indicator is a powerful utility designed to help you visualize time-based market structure by drawing customizable vertical lines on your chart. It allows you to clearly mark the beginning of new timeframes (like hours, days, or weeks) and highlight specific trading sessions or time slots (like the London open or a news event).
It comes with **6 independent dividers** that you can configure to your exact needs:
* **3 Timeframe Dividers**
* **3 Custom Time Slot Dividers**
### Key Features
* **Timeframe Separators:** Set up to 3 different higher timeframes (e.g., 1H, 4H, 1D). The indicator will automatically draw a vertical line at the start of each new bar for that timeframe, helping you easily see hourly, daily, or weekly boundaries.
* **Custom Time Slots (Sessions):** Define up to 3 specific time windows (e.g., "09:30-16:00" for the New York session). The indicator will draw a line at the **start** of this session and another line at the **end**, allowing you to isolate specific periods of market activity.
* **Full Customization:** Each of the 6 dividers is fully independent and can be customized with:
* A simple toggle to turn it on or off.
* A unique color.
* A line style (Solid, Dotted, or Dashed).
* A toggle to show or hide its text label.
* **Smart Labels:** Labels for timeframe dividers display the timeframe (e.g., "4H"), while labels for time slots automatically format to show the precise start or end time (e.g., "09:30" and "16:00").
### How to Use
1. Add the "Timeframe Vertical Lines" indicator to your chart.
2. Open the indicator's **Settings** panel.
3. **To add a timeframe line (e.g., Daily):**
* Go to the "Timeframe Divider 1" group.
* Check the "Show Divider 1" box.
* Set the "Timeframe 1" to "1D".
* Adjust the color, style, and text visibility to your liking.
4. **To add a session line (e.g., London Session):**
* Go to the "Time Slot Divider 1" group.
* Check the "Show Time Slot Divider 1" box.
* Set the "Time Slot 1" to your desired session, e.g., "0800-1700".
* Adjust the color and style. The script will now draw lines at 08:00 and 17:00 (based on the chart's timezone).
5. Repeat the process using the other available divider slots to build a complete temporal map of your chart.

Tristan's Tri-band StrategyTristan's Tri-band Strategy - Confluence Trading System
Strategy Overview:
This strategy combines three powerful technical indicators - RSI, Williams %R, and Bollinger Bands - into a single visual trading system. Instead of cluttering your chart with separate indicator panels, all signals are displayed directly on the price chart using color-coded gradient overlays, making it easy to spot high-probability trade setups at a glance.
How It Works:
The strategy identifies trading opportunities when multiple indicators align (confluence), suggesting strong momentum shifts:
📈 Long Entry Signals:
RSI drops to 30 or below (oversold)
Williams %R reaches -80 to -100 range (oversold)
Price touches or breaks below the lower Bollinger Band
All three conditions must align during your selected trading session
📉 Short Entry Signals:
RSI rises to 70 or above (overbought)
Williams %R reaches 0 to -20 range (overbought)
Price touches or breaks above the upper Bollinger Band
All three conditions must align during your selected trading session
Visual Indicators:
(faint) Green gradients below candles = Bullish oversold conditions (buying opportunity)
(faint) Red/Orange gradients above candles = Bearish overbought conditions (selling opportunity)
Stacked/brighter gradients = Multiple indicators confirming the same signal (higher probability) will stack and show brighter / less faint
Blue Bollinger Bands = Volatility boundaries and mean reversion zones
Exit Strategy:
Long trades exit when price reaches the upper Bollinger Band OR RSI becomes overbought (≥70)
Short trades exit when price reaches the lower Bollinger Band OR RSI becomes oversold (≤30)
Key Features:
✅ Session Filters - Trade only during NY (9:30 AM-4 PM), London (3 AM-11:30 AM), or Asia (7 PM-1 AM EST) sessions
✅ No Repainting - Signals are confirmed on candle close for realistic backtesting and live trading
✅ Customizable Parameters - Adjust RSI levels, BB standard deviations, Williams %R periods, and gradient visibility
✅ Visual Clarity - See all three indicators at once without switching between panels
✅ Built-in Alerts - Get notified when entry and exit conditions are met
How to Use Effectively:
Choose Your Trading Session - For day trading US stocks, enable only the NY session. For forex or 24-hour markets, select the sessions that match your schedule.
Look for Gradient Stacking - The brightest, most visible gradients occur when both RSI and Williams %R signal together. These are your highest-probability setups.
Confirm with Price Action - Wait for the candle to close before entering. The strategy enters on the next bar's open to prevent repainting.
Respect the Bollinger Bands - Entries occur at the outer bands (price extremes), and exits occur at the opposite band or when momentum reverses.
Backtest First - Test the strategy on your preferred instruments and timeframes. Works best on liquid assets with clear trends and mean reversion patterns (stocks, major forex pairs, indices).
Adjust Gradient Visibility - Use the "Gradient Strength" slider (lower = more visible) to make signals stand out on your chart style.
Best Timeframes: 5-minute to 1-hour charts for intraday trading; 4-hour to daily for swing trading (I have also found the 3 hour timeframe to work really well for some stocks / ETFs.)
Best Markets: Liquid instruments with volatility - SPY, QQQ, major stocks, EUR/USD, GBP/USD, major indices
Risk Management: This is a mean reversion strategy that works best in ranging or choppy markets. In strong trends, signals may appear less frequently. Always use proper position sizing and stop losses based on your risk tolerance.
----------------------------------------------
Note: Past performance does not guarantee future results. This strategy is provided for educational purposes. Always backtest thoroughly and practice proper risk management before live trading.RetryClaude can make mistakes. Please double-check responses. Sonnet 4.5

AlfaBitcoin Dashboard – Estrategia Combinada (Juan + Gael)Integrate the TradingView (TV) indicators with the sessions from October 16 and 21 (Gael Sánchez Smith and Juan Rodríguez). We can build an alert system or dashboard that combines what was discussed in both sessions with your custom indicators on TradingView.

Luxy BIG beautiful Dynamic ORBThis is an advanced Opening Range Breakout (ORB) indicator that tracks price breakouts from the first 5, 15, 30, and 60 minutes of the trading session. It provides complete trade management including entry signals, stop-loss placement, take-profit targets, and position sizing calculations.
The ORB strategy is based on the concept that the opening range of a trading session often acts as support/resistance, and breakouts from this range tend to lead to significant moves.
What Makes This Different?
Most ORB indicators simply draw horizontal lines and leave you to figure out the rest. This indicator goes several steps further:
Multi-Stage Tracking
Instead of just one ORB timeframe, this tracks FOUR simultaneously (5min, 15min, 30min, 60min). Each stage builds on the previous one, giving you multiple trading opportunities throughout the session.
Active Trade Management
When a breakout occurs, the indicator automatically calculates and displays entry price, stop-loss, and multiple take-profit targets. These lines extend forward and update in real-time until the trade completes.
Cycle Detection
Unlike indicators that only show the first breakout, this tracks the complete cycle: Breakout → Retest → Re-breakout. You can see when price returns to test the ORB level after breaking out (potential re-entry).
Failed Breakout Warning
If price breaks out but quickly returns inside the range (within a few bars), the label changes to "FAILED BREAK" - warning you to exit or avoid the trade.
Position Sizing Calculator
Built-in risk management that tells you exactly how many shares to buy based on your account size and risk tolerance. No more guessing or manual calculations.
Advanced Filtering
Optional filters for volume confirmation, trend alignment, and Fair Value Gaps (FVG) to reduce false signals and improve win rate.
Core Features Explained
### 1. Multi-Stage ORB Levels
The indicator builds four separate Opening Range levels:
ORB 5 - First 5 minutes (fastest signals, most volatile)
ORB 15 - First 15 minutes (balanced, most popular)
ORB 30 - First 30 minutes (slower, more reliable)
ORB 60 - First 60 minutes (slowest, most confirmed)
Each level is drawn as a horizontal range on your chart. As time progresses, the ranges expand to include more price action. You can enable or disable any stage and assign custom colors to each.
How it works: During the opening minutes, the indicator tracks the highest high and lowest low. Once the time period completes, those levels become your ORB high and low for that stage.
### 2. Breakout Detection
When price closes outside the ORB range, a label appears:
BREAK UP (green label above price) - Price closed above ORB High
BREAK DOWN (red label below price) - Price closed below ORB Low
The label shows which ORB stage triggered (ORB5, ORB15, etc.) and the cycle number if tracking multiple breakouts.
Important: Signals appear on bar close only - no repainting. What you see is what you get.
### 3. Retest Detection
After price breaks out and moves away, if it returns to test the ORB level, a "RETEST" label appears (orange). This indicates:
The original breakout level is now acting as support/resistance
Potential re-entry opportunity if you missed the first breakout
Confirmation that the level is significant
The indicator requires price to move a minimum distance away before considering it a valid retest (configurable in settings).
### 4. Failed Breakout Detection
If price breaks out but returns inside the ORB range within a few bars (before the breakout is "committed"), the original label changes to "FAILED BREAK" in orange.
This warns you:
The breakout lacked conviction
Consider exiting if already in the trade
Wait for better setup
Committed Breakout: The indicator tracks how many bars price stays outside the range. Only after staying outside for the minimum number of bars does it become a committed breakout that can be retested.
### 5. TP/SL Lines (Trade Management)
When a breakout occurs, colored horizontal lines appear showing:
Entry Line (cyan for long, orange for short) - Your entry price (the ORB level)
Stop Loss Line (red) - Where to exit if trade goes against you
TP1, TP2, TP3 Lines (same color as entry) - Profit targets at 1R, 2R, 3R
These lines extend forward as new bars form, making it easy to track your trade. When a target is hit, the line turns green and the label shows a checkmark.
Lines freeze (stop updating) when:
Stop loss is hit
The final enabled take-profit is hit
End of trading session (optional setting)
### 6. Position Sizing Dashboard
The dashboard (bottom-left corner by default) shows real-time information:
Current ORB stage and range size
Breakout status (Inside Range / Break Up / Break Down)
Volume confirmation (if filter enabled)
Trend alignment (if filter enabled)
Entry and Stop Loss prices
All enabled Take Profit levels with percentages
Risk/Reward ratio
Position sizing: Max shares to buy and total risk amount
Position Sizing Example:
If your account is $25,000 and you risk 1% per trade ($250), and the distance from entry to stop loss is $0.50, the calculator shows you can buy 500 shares (250 / 0.50 = 500).
### 7. FVG Filter (Fair Value Gap)
Fair Value Gaps are price inefficiencies - gaps left by strong momentum where one candle's high doesn't overlap with a previous candle's low (or vice versa).
When enabled, this filter:
Detects bullish and bearish FVGs
Draws semi-transparent boxes around these gaps
Only allows breakout signals if there's an FVG near the breakout level
Why this helps: FVGs indicate institutional activity. Breakouts through FVGs tend to be stronger and more reliable.
Proximity setting: Controls how close the FVG must be to the ORB level. 2.0x means the breakout can be within 2 times the FVG size - a reasonable default.
### 8. Volume & Trend Filters
Volume Filter:
Requires current volume to be above average (customizable multiplier). High volume breakouts are more likely to sustain.
Set minimum multiplier (e.g., 1.5x = 50% above average)
Set "strong volume" multiplier (e.g., 2.5x) that bypasses other filters
Dashboard shows current volume ratio
Trend Filter:
Only shows breakouts aligned with a higher timeframe trend. Choose from:
VWAP - Price above/below volume-weighted average
EMA - Price above/below exponential moving average
SuperTrend - ATR-based trend indicator
Combined modes (VWAP+EMA, VWAP+SuperTrend) for stricter filtering
### 9. Pullback Filter (Advanced)
Purpose:
Waits for price to pull back slightly after initial breakout before confirming the signal.
This reduces false breakouts from immediate reversals.
How it works:
- After breakout is detected, indicator waits for a small pullback (default 2%)
- Once pullback occurs AND price breaks out again, signal is confirmed
- If no pullback within timeout period (5 bars), signal is issued anyway
Settings:
Enable Pullback Filter: Turn this filter on/off
Pullback %: How much price must pull back (2% is balanced)
Timeout (bars): Max bars to wait for pullback (5 is standard)
When to use:
- Choppy markets with many fake breakouts
- When you want higher quality signals
- Combine with Volume filter for maximum confirmation
Trade-off:
- Better signal quality
- May miss some valid fast moves
- Slight entry delay
How to Use This Indicator
### For Beginners - Simple Setup
Add the indicator to your chart (5-minute or 15-minute timeframe recommended)
Leave all default settings - they work well for most stocks
Watch for BREAK UP or BREAK DOWN labels to appear
Check the dashboard for entry, stop loss, and targets
Use the position sizing to determine how many shares to buy
Basic Trading Plan:
Wait for a clear breakout label
Enter at the ORB level (or next candle open if you're late)
Place stop loss where the red line indicates
Take profit at TP1 (50% of position) and TP2 (remaining 50%)
### For Advanced Traders - Customized Setup
Choose which ORB stages to track (you might only want ORB15 and ORB30)
Enable filters: Volume (stocks) or Trend (trending markets)
Enable FVG filter for institutional confirmation
Set "Track Cycles" mode to catch retests and re-breakouts
Customize stop loss method (ATR for volatile stocks, ORB% for stable ones)
Adjust risk per trade and account size for accurate position sizing
Advanced Strategy Example:
Enable ORB15 only (disable others for cleaner chart)
Turn on Volume filter at 1.5x with Strong at 2.5x
Enable Trend filter using VWAP
Set Signal Mode to "Track Cycles" with Max 3 cycles
Wait for aligned breakouts (Volume + Trend + Direction)
Enter on retest if you missed the initial break
### Timeframe Recommendations
5-minute chart: Scalping, very active trading, crypto
15-minute chart: Day trading, balanced approach (most popular)
30-minute chart: Swing entries, less screen time
60-minute chart: Position trading, longer holds
The indicator works on any intraday timeframe, but ORB is fundamentally a day trading strategy. Daily charts don't make sense for ORB.
DEFAULT CONFIGURATION
ON by Default:
• All 4 ORB stages (5/15/30/60)
• Breakout Detection
• Retest Labels
• All TP levels (1/1.5/2/3)
• TP/SL Lines (Detailed mode)
• Dashboard (Bottom Left, Dark theme)
• Position Size Calculator
OFF by Default (Optional Filters):
• FVG Filter
• Pullback Filter
• Volume Filter
• Trend Filter
• HTF Bias Check
• Alerts
Recommended for Beginners:
• Leave all defaults
• Session Mode: Auto-Detect
• Signal Mode: Track Cycles
• Stop Method: ATR
• Add Volume Filter if trading stocks
Recommended for Advanced:
• Enable ORB15 + ORB30 only (disable 5 & 60)
• Enable: Volume + Trend + FVG
• Signal Mode: Track Cycles, Max 3
• Stop Method: ATR or Safer
• Enable HTF Daily bias check
## Settings Guide
The settings are organized into logical groups. Here's what each section controls:
### ORB COLORS Section
Show Edge Labels: Display "ORB 5", "ORB 15" labels at the right edge of the levels
Background: Fill the area between ORB high/low with color
Transparency: How see-through the background is (95% is nearly invisible)
Enable ORB 5/15/30/60: Turn each stage on or off individually
Colors: Assign colors to each ORB stage for easy identification
### SESSION SETTINGS Section
Session Mode: Choose trading session (Auto-Detect works for most instruments)
Custom Session Hours: Define your own hours if needed (format: HHMM-HHMM)
Auto-Detect uses the instrument's natural hours (stocks use exchange hours, crypto uses 24/7).
### BREAKOUT DETECTION Section
Enable Breakout Detection: Master switch for signals
Show Retest Labels: Display retest signals
Label Size: Visual size for all labels (Small recommended)
Enable FVG Filter: Require Fair Value Gap confirmation
Show FVG Boxes: Display the gap boxes on chart
Signal Mode: "First Only" = one signal per direction per day, "Track Cycles" = multiple signals
Max Cycles: How many breakout-retest cycles to track (6 is balanced)
Breakout Buffer: Extra distance required beyond ORB level (0.1-0.2% recommended)
Min Distance for Retest: How far price must move away before retest is valid (2% recommended)
Min Bars Outside ORB: Bars price must stay outside for committed breakout (2 is balanced)
### TARGETS & RISK Section
Enable Targets & Stop-Loss: Calculate and show trade management
TP1/TP2/TP3 checkboxes: Select which profit targets to display
Stop Method: How to calculate stop loss placement
- ATR: Based on volatility (best for most cases)
- ORB %: Fixed % of ORB range
- Swing: Recent swing high/low
- Safer: Widest of all methods
ATR Length & Multiplier: Controls ATR stop distance (14 period, 1.5x is standard)
ORB Stop %: Percentage beyond ORB for stop (20% is balanced)
Swing Bars: Lookback period for swing high/low (3 is recent)
### TP/SL LINES Section
Show TP/SL Lines: Display horizontal lines on chart
Label Format: "Short" = minimal text, "Detailed" = shows prices
Freeze Lines at EOD: Stop extending lines at session close
### DASHBOARD Section
Show Info Panel: Display the metrics dashboard
Theme: Dark or Light colors
Position: Where to place dashboard on chart
Toggle rows: Show/hide specific information rows
Calculate Position Size: Enable the position sizing calculator
Risk Mode: Risk fixed $ amount or % of account
Account Size: Your total trading capital
Risk %: Percentage to risk per trade (0.5-1% recommended)
### VOLUME FILTER Section
Enable Volume Filter: Require volume confirmation
MA Length: Average period (20 is standard)
Min Volume: Required multiplier (1.5x = 50% above average)
Strong Volume: Multiplier that bypasses other filters (2.5x)
### TREND FILTER Section
Enable Trend Filter: Require trend alignment
Trend Mode: Method to determine trend (VWAP is simple and effective)
Custom EMA Length: If using EMA mode (50 for swing, 20 for day trading)
SuperTrend settings: Period and Multiplier if using SuperTrend mode
### HIGHER TIMEFRAME Section
Check Daily Trend: Display higher timeframe bias in dashboard
Timeframe: What TF to check (D = daily, recommended)
Method: Price vs MA (stable) or Candle Direction (reactive)
MA Period: EMA length for Price vs MA method (20 is balanced)
Min Strength %: Minimum strength threshold for HTF bias to be considered
- For "Price vs MA": Minimum distance (%) from moving average
- For "Candle Direction": Minimum candle body size (%)
- 0.5% is balanced - increase for stricter filtering
- Lower values = more signals, higher values = only strong trends
### ALERTS Section
Enable Alerts: Master switch (must be ON to use any alerts)
Breakout Alerts: Notify on ORB breakouts
Retest Alerts: Notify when price retests after breakout
Failed Break Alerts: Notify on failed breakouts
Stage Complete Alerts: Notify when each ORB stage finishes forming
After enabling desired alert types, click "Create Alert" button, select this indicator, choose "Any alert() function call".
## Tips & Best Practices
### General Trading Tips
ORB works best on liquid instruments (stocks with good volume, major crypto pairs)
First hour of the session is most important - that's when ORB is forming
Breakouts WITH the trend have higher success rates - use the trend filter
Failed breakouts are common - use the "Min Bars Outside" setting to filter weak moves
Not every day produces good ORB setups - be patient and selective
### Position Sizing Best Practices
Never risk more than 1-2% of your account on a single trade
Use the built-in calculator - don't guess your position size
Update your account size monthly as it grows
Smaller accounts: use $ Amount mode for simplicity
Larger accounts: use % of Account mode for scaling
### Take Profit Strategy
Most traders use: 50% at TP1, 50% at TP2
Aggressive: Hold through TP1 for TP2 or TP3
Conservative: Full exit at TP1 (1:1 risk/reward)
After TP1 hits, consider moving stop to breakeven
TP3 rarely hits - only on strong trending days
### Filter Combinations
Maximum Quality: Volume + Trend + FVG (fewest signals, highest quality)
Balanced: Volume + Trend (good quality, reasonable frequency)
Active Trading: No filters or Volume only (many signals, lower quality)
Trending Markets: Trend filter essential (indices, crypto)
Range-Bound: Volume + FVG (avoid trend filter)
### Common Mistakes to Avoid
Chasing breakouts - wait for the bar to close, don't FOMO into wicks
Ignoring the stop loss - always use it, move it manually if needed
Over-leveraging - the calculator shows MAX shares, you can buy less
Trading every signal - quality > quantity, use filters
Not tracking results - keep a journal to see what works for YOU
## Pros and Cons
### Advantages
Complete all-in-one solution - from signal to position sizing
Multiple timeframes tracked simultaneously
Visual clarity - easy to see what's happening
Cycle tracking catches opportunities others miss
Built-in risk management eliminates guesswork
Customizable filters for different trading styles
No repainting - what you see is locked in
Works across multiple markets (stocks, forex, crypto)
### Limitations
Intraday strategy only - doesn't work on daily charts
Requires active monitoring during first 1-2 hours of session
Not suitable for after-hours or extended sessions by default
Can produce many signals in choppy markets (use filters)
Dashboard can be overwhelming for complete beginners
Performance depends on market conditions (trends vs ranges)
Requires understanding of risk management concepts
### Best For
Day traders who can watch the first 1-2 hours of market open
Traders who want systematic entry/exit rules
Those learning proper position sizing and risk management
Active traders comfortable with multiple signals per day
Anyone trading liquid instruments with clear sessions
### Not Ideal For
Swing traders holding multi-day positions
Set-and-forget / passive investors
Traders who can't watch market open
Complete beginners unfamiliar with trading concepts
Low volume / illiquid instruments
## Frequently Asked Questions
Q: Why are no signals appearing?
A: Check that you're on an intraday timeframe (5min, 15min, etc.) and that the current time is within your session hours. Also verify that "Enable Breakout Detection" is ON and at least one ORB stage is enabled. If using filters, they might be blocking signals - try disabling them temporarily.
Q: What's the best ORB stage to use?
A: ORB15 (15 minutes) is most popular and balanced. ORB5 gives faster signals but more noise. ORB30 and ORB60 are slower but more reliable. Many traders use ORB15 + ORB30 together.
Q: Should I enable all the filters?
A: Start with no filters to see all signals. If too many false signals, add Volume filter first (stocks) or Trend filter (trending markets). FVG filter is most restrictive - use for maximum quality but fewer signals.
Q: How do I know which stop loss method to use?
A: ATR works for most cases - it adapts to volatility. Use ORB% if you want predictable stop placement. Swing is for respecting chart structure. Safer gives you the most room but largest risk.
Q: Can I use this for swing trading?
A: Not really - ORB is fundamentally an intraday strategy. The ranges reset each day. For swing trading, look at weekly support/resistance or moving averages instead.
Q: Why do TP/SL lines disappear sometimes?
A: Lines freeze (stop extending) when: stop loss is hit, the last enabled take-profit is hit, or end of session arrives (if "Freeze at EOD" is enabled). This is intentional - the trade is complete.
Q: What's the difference between "First Only" and "Track Cycles"?
A: "First Only" shows one breakout UP and one DOWN per day maximum - clean but might miss opportunities. "Track Cycles" shows breakout-retest-rebreak sequences - more signals but busier chart.
Q: Is position sizing accurate for options/forex?
A: The calculator is designed for shares (stocks). For options, ignore the share count and use the risk amount. For forex, you'll need to adapt the lot size calculation manually.
Q: How much capital do I need to use this?
A: The indicator works for any account size, but practical day trading typically requires $25,000 in the US due to Pattern Day Trader rules. Adjust the "Account Size" setting to match your capital.
Q: Can I backtest this strategy?
A: This is an indicator, not a strategy script, so it doesn't have built-in backtesting. You can visually review historical signals or code a strategy script using similar logic.
Q: Why does the dashboard show different entry price than the breakout label?
A: If you're looking at an old breakout, the ORB levels may have changed when the next stage completed. The dashboard always shows the CURRENT active range and trade setup.
Q: What's a good win rate to expect?
A: ORB strategies typically see 40-60% win rate depending on market conditions and filters used. The strategy relies on positive risk/reward ratios (2:1 or better) to be profitable even with moderate win rates.
Q: Does this work on crypto?
A: Yes, but crypto trades 24/7 so you need to define what "session start" means. Use Session Mode = Custom and set your preferred daily reset time (e.g., 0000-2359 UTC).
## Credits & Transparency
### Development
This indicator was developed with the assistance of AI technology to implement complex ORB trading logic.
The strategy concept, feature specifications, and trading logic were designed by the publisher. The implementation leverages modern development tools to ensure:
Clean, efficient, and maintainable code
Comprehensive error handling and input validation
Detailed documentation and user guidance
Performance optimization
### Trading Concepts
This indicator implements several public domain trading concepts:
Opening Range Breakout (ORB): Trading strategy popularized by Toby Crabel, Mark Fisher and many more talanted traders.
Fair Value Gap (FVG): Price imbalance concept from ICT methodology
SuperTrend: ATR-based trend indicator using public formula
Risk/Reward Ratio: Standard risk management principle
All mathematical formulas and technical concepts used are in the public domain.
### Pine Script
Uses standard TradingView built-in functions:
ta.ema(), ta.atr(), ta.vwap(), ta.highest(), ta.lowest(), request.security()
No external libraries or proprietary code from other authors.
## Disclaimer
This indicator is provided for educational and informational purposes only. It is not financial advice.
Trading involves substantial risk of loss and is not suitable for every investor. Past performance shown in examples is not indicative of future results.
The indicator provides signals and calculations, but trading decisions are solely your responsibility. Always:
Test strategies on paper before using real money
Never risk more than you can afford to lose
Understand that all trading involves risk
Consider seeking advice from a licensed financial advisor
The publisher makes no guarantees regarding accuracy, profitability, or performance. Use at your own risk.
---
Version: 3.0
Pine Script Version: v6
Last Updated: October 2024
For support, questions, or suggestions, please comment below or send a private message.
---
Happy trading, and remember: consistent risk management beats perfect entry timing every time.

Simple VWAP + BandsSimple VWAP + Bands
A clean and customizable VWAP (Volume Weighted Average Price) indicator with standard deviation bands and RTH (Regular Trading Hours) session support.
Features:
- VWAP Line: Volume-weighted average price calculation
- Three Standard Deviation Bands: Configurable bands at 1σ, 2σ, and 3σ levels (above and below VWAP)
- RTH Session Support: Option to calculate VWAP only during regular trading hours
- Customizable Session Times: Configure your own trading session hours and timezone
- Clean Visualization: Line breaks between sessions prevent messy connections across non-trading periods
- Toggle Bands: Show/hide individual standard deviation bands as needed
Use Cases:
- Identify overbought/oversold conditions relative to volume-weighted price
- Track price deviation from VWAP during trading sessions
- Support and resistance levels based on standard deviations
- Mean reversion trading strategies

Svopex Session Highlighter# Session Highlighter
## Description
**Session Highlighter** is a powerful Pine Script indicator designed to visually identify and mark specific trading hours on your chart. This tool helps traders focus on their preferred trading sessions by highlighting the background during active hours and marking the session start with customizable visual markers.
## Key Features
- **📊 Session Background Highlighting**: Automatically shades the chart background during your defined trading hours (default: 7:00 - 23:00)
- **🎯 Smart Session Start Marker**: Places a marker on the last candle before session start, intelligently adapting to your timeframe:
- 1 Hour chart: Marker at 6:00
- 15 Minute chart: Marker at 6:45
- 5 Minute chart: Marker at 6:55
- 1 Minute chart: Marker at 6:59
- **🌍 Timezone Support**: Choose from multiple timezones (Europe/Prague, Europe/London, America/New_York, UTC)
- **🎨 5 Marker Styles**: Customize your session start indicator:
- Triangle
- Circle
- Diamond
- Label with time text
- Vertical line
- **⚙️ Fully Customizable**: Adjust start/end hours, timezone, and marker style through simple settings
## Settings
- **Start Hour**: Set your session start time (0-23)
- **End Hour**: Set your session end time (0-23)
- **Timezone**: Select your trading timezone
- **Marker Style**: Choose your preferred visual marker
## Use Cases
- Identify London/New York trading sessions
- Mark Asian session hours
- Highlight your personal trading windows
- Avoid trading during off-hours
- Perfect for day traders and scalpers
## Installation
1. Copy the Pine Script code
2. Open TradingView Pine Editor
3. Paste the code and click "Add to Chart"
4. Configure settings to match your trading schedule
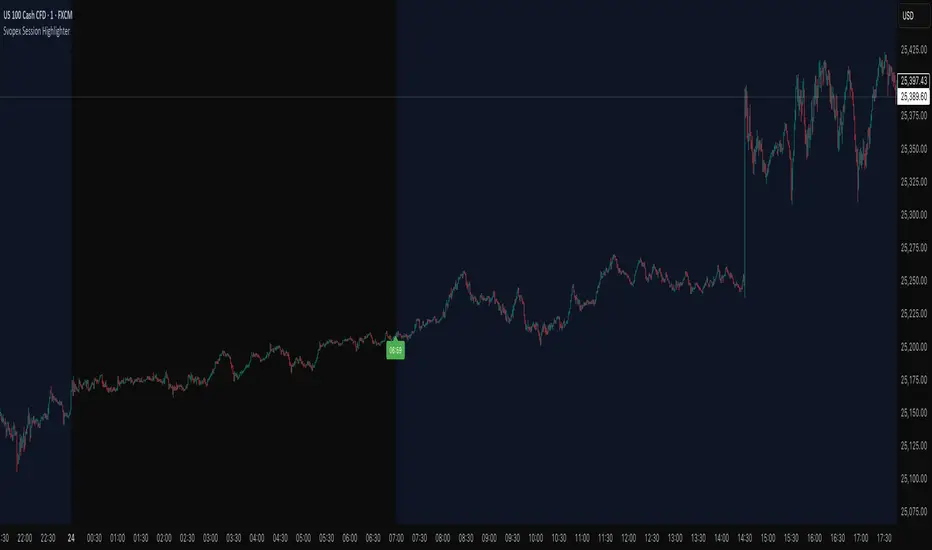
ICT HTF Volume Candles (Based on HTF Candles by Fadi)# ICT HTF Volume Candles - Multi-Timeframe Volume Analysis
## Overview
This indicator provides multi-timeframe volume visualization designed to complement price action analysis. It displays volume data from up to 6 higher timeframes simultaneously in a separate panel, allowing traders to identify volume spikes, divergences, and institutional activity without switching between timeframes.
**Original Concept Credits:** This indicator builds upon the HTF Candles framework by Fadi, adapting it specifically for volume analysis with enhanced features including gap-filling for extended hours, multiple scaling methods, and advanced synchronization.
## What Makes This Script Original
### Key Innovations:
1. **Three Volume Scaling Methods:**
- **Per-HTF Auto Scale:** Each timeframe scales independently for detailed comparison
- **Global Auto Scale:** All timeframes use unified scale for relative volume comparison
- **Manual Scale:** User-defined maximum for consistent analysis across sessions
2. **Bullish/Bearish Volume Differentiation:**
- Volume bars colored based on price movement (close vs open)
- Separate styling for bullish (green) and bearish (red) volume periods
- Helps identify whether volume supports price direction
3. **Advanced Time Synchronization:**
- Custom daily candle open times (Midnight, 8:30 AM, 9:30 AM ET)
- Timezone-aware calculations for New York trading hours
- Real-time countdown timers for each timeframe
- **Gap-filling technology** for continuous display during extended hours and weekends
4. **Flexible Display Options:**
- Configurable spacing and positioning
- Label placement (top, bottom, or both)
- Day-of-week or time interval labels on candles
- Works reliably in backtesting and live trading
## How It Works
### Volume Calculation
The indicator uses `request.security()` with optimized parameters to fetch volume data from higher timeframes:
- **Volume Open/High/Low/Close (OHLC):** Tracks volume changes within each HTF candle
- **Color Logic:** Compares HTF close vs open prices to determine bullish/bearish classification
- **Alignment:** All volume bars share a common baseline for easy visual comparison
- **Gap Handling:** Uses `gaps=barmerge.gaps_off` to maintain continuity during non-trading hours
### Technical Implementation
```
1. Monitors HTF timeframe changes using request.security() with lookahead
2. Creates new VolumeCandle object when HTF bar opens
3. Updates current candle's volume H/L/C on each chart bar
4. Applies selected scaling method to normalize display height
5. Repositions all candles and labels on each bar update
6. Fills gaps automatically during extended hours for consistent display
```
### Scaling Methods Explained
**Method 1 - Auto Scale per HTF:**
Each timeframe displays volume relative to its own maximum. Best for identifying patterns within each individual timeframe.
**Method 2 - Global Auto Scale:**
All timeframes share the same scale based on the highest volume across all HTFs. Best for comparing relative volume strength between timeframes.
**Method 3 - Manual Scale:**
User sets maximum volume value. Best for maintaining consistent scale across different trading sessions or instruments.
## How to Use This Indicator
### Setup
1. Add indicator to your chart (it appears in a separate panel below price)
2. Configure up to 6 higher timeframes (default: 5m, 15m, 1H, 4H, 1D, 1W)
3. Set number of candles to display for each timeframe
4. Choose volume scaling method based on your analysis needs
5. Enable "Fix gaps in non-trading hours" for extended hours trading (enabled by default)
### Interpretation
**Volume Spikes:**
- Sudden increase in volume height indicates institutional activity or strong conviction
- Compare volume between timeframes to identify where the real money is moving
- Look for volume spikes that appear across multiple timeframes simultaneously
**Bullish vs Bearish Volume:**
- **Green volume bars:** Price closed higher (buying pressure)
- **Red volume bars:** Price closed lower (selling pressure)
- High green volume during uptrend = confirmation of strength
- High red volume during downtrend = confirmation of weakness
- High volume opposite to trend = potential reversal warning
**Multi-Timeframe Context:**
- **5m/15m:** Scalping and day trading activity
- **1H/4H:** Swing trading and intraday institutional flows
- **Daily/Weekly:** Major position building and long-term trends
**Divergences:**
- Price making new highs but volume declining = weakening trend
- Volume increasing while price consolidates = potential breakout brewing
- Price breaks level but volume doesn't confirm = likely false breakout
### Practical Examples
**Example 1 - Institutional Confirmation:**
Price breaks above resistance. Check volume across timeframes:
- 5m shows spike = retail interest
- 15m + 1H + 4H all show spikes = institutional confirmation
- **Trade confidence: HIGH**
**Example 2 - False Breakout Detection:**
Price breaks resistance with:
- High volume on 5m only
- Normal/low volume on 1H and 4H
- **Interpretation:** Likely retail trap, institutions not participating
- **Action:** Wait for pullback or avoid
**Example 3 - Accumulation Phase:**
Price ranges sideways but:
- Daily volume gradually increasing
- Weekly volume above average
- **Interpretation:** Smart money accumulating
- **Action:** Prepare for breakout in direction of volume
**Example 4 - Volume Divergence:**
Price makes new high:
- Current high has lower volume than previous high across all timeframes
- **Interpretation:** Weakening momentum
- **Action:** Consider profit-taking or reversal trade
## Configuration Parameters
### Timeframe Settings
- **HTF 1-6:** Select timeframes (must be higher than chart timeframe)
- **Max Display:** Number of candles to show per timeframe (1-50)
- **Limit to Next HTFs:** Display only first N enabled timeframes (1-6)
### Styling
- **Bull/Bear Colors:** Separate colors for body, border, and wick
- **Padding from current candles:** Distance offset from live price action
- **Space between candles:** Gap between individual volume bars
- **Space between Higher Timeframes:** Gap between different timeframe groups
- **Candle Width:** Thickness of volume bars (1-4, multiplied by 2)
### Volume Settings
- **Volume Scale Method:** Choose 1, 2, or 3
- 1 = Auto Scale per HTF (each TF independent)
- 2 = Global Auto Scale (all TF unified)
- 3 = Manual Scale (user-defined max)
- **Auto Scale Volume:** Enable/disable automatic scaling
- **Manual Scale Max Volume:** Set maximum when using Method 3
### Label Settings
- **HTF Label:** Show/hide timeframe names with color and size options
- **Label Positions:** Display at Top, Bottom, or Both
- **Label Alignment:** Align centered or Follow Candles
- **Remaining Time:** Show countdown timer until next HTF candle
- **Interval Value:** Display day-of-week or time on each candle
### Custom Daily Candle
- **Enable Custom Daily:** Override default daily candle timing
- **Open Time Options:**
- **Midnight:** Standard 00:00 ET daily open
- **8:30 AM:** Align with economic data releases
- **9:30 AM:** Align with NYSE market open
- Useful for specific trading strategies or market alignment
### Advanced Settings
- **Fix gaps in non-trading hours:** Maintains alignment during extended hours and weekends (recommended: ON)
- Prevents visual gaps during forex weekend closures
- Ensures consistent display during crypto 24/7 trading
- Improves backtesting reliability
## Best Practices
1. **Pair with Price Action:** Use alongside HTF price candles indicator for complete picture
2. **Start Simple:** Enable 2-3 timeframes initially (e.g., 15m, 1H, 4H), add more as needed
3. **Match Settings:** Use same candle width/spacing as companion price indicator for visual alignment
4. **Scale Appropriately:**
- Use **Global scale** (Method 2) when comparing timeframes
- Use **Per-HTF scale** (Method 1) for pattern analysis within each timeframe
- Use **Manual scale** (Method 3) for consistent day-to-day comparison
5. **Watch for Volume Clusters:** High volume appearing simultaneously across multiple HTFs signals significant market events
6. **Confirm Breakouts:** Always check if volume supports the price movement across higher timeframes
7. **Extended Hours:** Keep "Fix gaps" enabled for 24/7 markets (Forex, Crypto) and weekend analysis
## Technical Notes
- **Timezone:** All calculations use America/New_York timezone for consistency
- **Real-time Updates:** Volume and timers update on each tick during market hours
- **Performance:** Optimized with max_bars_back=5000 for extensive historical analysis
- **Compatibility:** Works on all instruments with volume data (Stocks, Forex, Crypto, Futures)
- **Gap Handling:** Uses `barmerge.gaps_off` to fill data gaps during non-trading periods
- **Backtesting:** Uses `lookahead=barmerge.lookahead_on` for stable historical data without repainting
- **Data Continuity:** Automatically handles market closures, weekends, and extended hours
## Updates & Improvements
**Version 2.0 (Current):**
- ✅ Fixed alignment issues during extended hours and weekends
- ✅ Eliminated repainting in backtesting
- ✅ Added gap-filling technology for continuous display
- ✅ Improved data synchronization across all timeframes
- ✅ Enhanced NA value handling for data integrity
- ✅ Added advanced settings group for user control
## Support
For questions, suggestions, or feedback, please comment on the publication or message the author.
---
**Disclaimer:** This indicator is for educational and informational purposes only. It does not constitute financial advice. Past performance is not indicative of future results. Always perform your own analysis and implement proper risk management before making trading decisions.

Niv Deal + Previ D W M + OPR + Asian🧭 Indicator Description (English)
Name: Niveaux Dealers + Previous D/W/M Auto + OPR + Asian Session
Platform: TradingView (Pine Script v6)
Type: Multi-module visual indicator for market structure and session ranges
🧩 Overview
This indicator combines three complementary modules to help traders visualize key market levels, opening ranges, and session dynamics — all in one comprehensive tool.
It is designed primarily for index and futures trading (e.g. NQ, ES, DAX), but can be applied to any market or timeframe.
MODULE 1 — Dealers Levels + Previous High/Low (Auto)
This first module automatically extracts and plots custom Dealer Levels and Previous Period Levels.
It can parse manually entered price levels (from a single text input) such as daily max/min, control levels, put supports, and call resistances — then draw horizontal lines and labels on the chart.
Features:
One text input for all dealer levels (easy copy-paste format).
Automatic parsing of prices from text (ignores irrelevant characters).
Groups of levels:
Maxima (Max 1D / Event / Extreme)
Minima (Min 1D / Event / Extreme)
Buyer/Seller Controls
Put Supports and Call Resistances
Independent color, style, and width for each line.
Transparent rectangular labels positioned perfectly on the levels.
Previous Daily, Weekly, and Monthly High/Low levels added automatically.
Optional summary table showing all levels and values in real time.
MODULE 2 — OPR (Opening Price Range)
The second module highlights the Opening Price Range, defined by the first 15 minutes (or any chosen period) of the trading session.
Features:
Fully configurable start and end time (local chart timezone).
Displays:
High, Low, and Midline (median)
Optional rectangle between high/low
Optional labels on each line
Independent color, line style, and thickness.
Works perfectly with non-standard sessions (e.g. 13:30–22:00 UTC for U.S. futures).
Uses local chart time instead of exchange time for intuitive control.
MODULE 3 — Asian Session Range
The third module draws the Asian trading session range, automatically detecting price action between configurable hours (default 17:00 → 01:00).
Features:
Adjustable start and end time (supports overnight sessions).
Plots Asian High, Asian Low, and Asian Middle (mid-range line).
Highlights the Asian box area with semi-transparent color.
Optional labels at the end of each level.
Fully synchronized with the chart’s local timezone (same logic as OPR).
Simple toggle to enable or disable the entire Asian module.
⚙️ Customization & Display
Each module can be toggled independently.
Colors, line styles (solid, dashed, dotted), and thickness are customizable.
Label visibility and extensions (left/right) can be adjusted.
The indicator is lightweight and optimized for real-time performance.
💡 Use Case
Traders can use this multi-module setup to:
Identify dealer reaction zones and institutional levels.
Track previous highs/lows for potential liquidity sweeps.
Monitor session ranges (Opening and Asian) for volatility shifts.
Combine all three perspectives (Dealer, Session, Historical) into one unified view.
Would you like me to rewrite this description in TradingView publication form
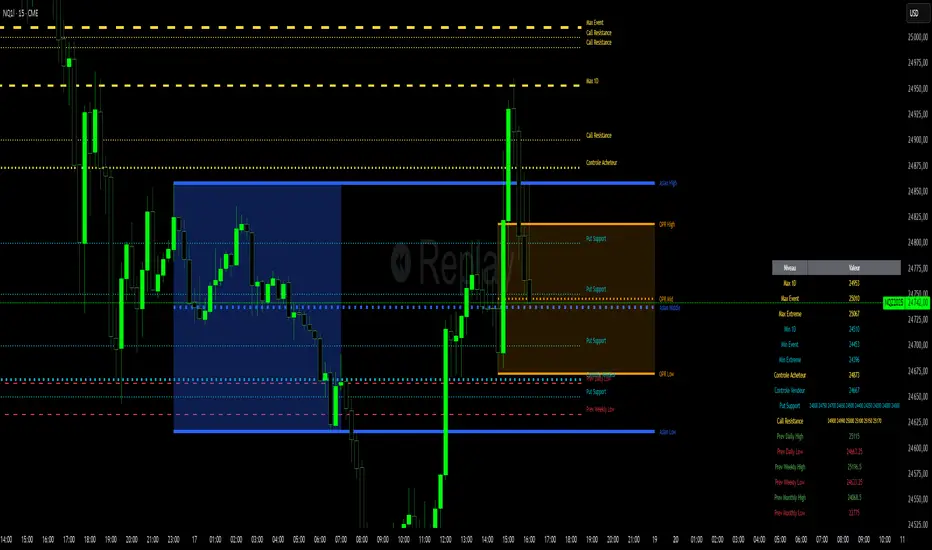
MTF Intraday v2.0📊 Description
MTF Intraday v2.0 is an informative indicator for analyzing trend strength across multiple timeframes simultaneously. Designed specifically for intraday (session) trading during European and US market hours.
The indicator shows the real market picture without lagging signals - you see the trend strength right now for each timeframe.
🎯 Key Features
1. Multi-Timeframe Analysis (D1, H4, H1, M30, M15)
Analyzes 4 indicators on each TF: SuperTrend, RSI, EMA crossover, EMA200
Shows strength for each timeframe: STRONG / MED / WEAK
Color indication: 🟢 green (LONG strong), 🔴 red (SHORT strong), 🟡 yellow (medium), ⚪ gray (weak)
2. Intraday Trading Hierarchy
D1 - global context (affects quality assessment)
H4 - general (sets the main trend)
H1 - reference point for intraday
M30/M15 - finding entry points during sessions
3. Market Pulse
🔥 HOT - when both H4 and H1 are STRONG (best time to enter!)
✓ GOOD - when H4 or H1 is STRONG
L:45 S:20 - balance of power between LONG and SHORT (statistics instead of "wait")
4. Volume Indicator (24 hours)
Shows volume change over the last 24 hours
SPIKE! - when volume increased by the set % (default 50%)
Considers candle color: 🟢 LONG spike (rise + green candle), 🔴 SHORT spike (rise + red candle)
Works on any timeframe (automatically recalculates)
5. Compact Mode
OFF - shows all details: every indicator for each TF
ON - only strength per timeframe (for clean chart)
⚙️ Settings
Main:
SuperTrend Period (21) / Multiplier (6.3)
RSI Length (14)
EMA Short (50) / Long (100) / 200
Compact Mode - hide detailed indicators
Volume:
Show Volume - show/hide volume indicator
Volume Alerts ON/OFF - enable/disable volume alerts
Volume Spike (%) - spike threshold (30% / 50% / 100%)
🔔 Alerts
The indicator has 5 types of alerts:
Market HOT - H4 and H1 simultaneously became STRONG
VOL LONG - volume spike on bullish candle
VOL SHORT - volume spike on bearish candle
EMA200 UP - price crossed EMA200 upward
EMA200 DN - price crossed EMA200 downward
Set up in TradingView: Create Alert → Select desired alert from the list
📈 How to Use
For finding entry points:
Check H4 - should be at least MED (better STRONG)
Verify H1 - main filter for intraday
Wait for pulse "🔥 HOT" or at least "✓ GOOD"
Look at M30/M15 - seek confirmation
Check 24h VOL - if SPIKE, momentum has started
Quality Assessment:
EXCELLENT ⭐ - all stars aligned (D1 with us, high score)
GOOD - good setup
WARNING ⚠️ - D1 against trend (counter-trend, be careful!)
Color Indication:
🟢 Green cells - bullish signal
🔴 Red cells - bearish signal
🟡 Yellow cells - neutral/waiting
🟠 Orange TF labels - for readability
⚠️ Important
This is an informative indicator, not a trading system
Does not give "entry/exit" signals - shows trend strength in the moment
Use together with Price Action and your trading strategy
RSI on M15 is displayed but not counted (too much noise)
💡 Who is it for
✅ Intraday traders (Europe/US sessions)
✅ Scalpers on crypto and forex
✅ Swing traders for trend confirmation
✅ Those who trade on multiple timeframes simultaneously

Friday & Monday HighlighterFriday & Monday Institutional Range Marker — Know Where Big Firms Set the Trap!
🧠 Description
This indicator automatically highlights Friday and Monday sessions on your chart — days when institutional players and algorithmic firms (like Citadel, Jane Street, or Tower Research) quietly shape the upcoming week’s price structure.
🔍 Why Friday & Monday matter
Friday : Large institutions often book profits or hedge into the weekend. Their final-hour moves reveal the next week’s bias.
Monday : Big players rebuild positions, absorbing liquidity left behind by retail traders.
Together, these two days define the range traps and breakout zones that often control price action until midweek.
> In short, the Friday–Monday high and low often act as invisible walls — guiding scalpers, option sellers, and swing traders alike.
🧩 What this tool does
✅ Highlights Friday (red) and Monday (green) sessions
✅ Adds optional day labels above bars
✅ Works across all timeframes (best on 15min to 1hr charts)
✅ Helps you visually identify where institutions likely built their positions
Use it to quickly spot:
* Range boundaries that trap traders
* Gap zones likely to get filled
* High–low sweeps before reversals
⚙️ Recommended Use
1. Mark Friday’s high–low → Watch for liquidity sweeps on Monday.
2. When Monday holds above Friday’s high , breakout continuation is likely.
3. When Monday fails below Friday’s low , expect a reversal or trap.
4. Combine this with OI shifts, IV crush, and FII–DII flow data for confirmation.
⚠️ Disclaimer
This indicator is for **educational and analytical purposes only**.
It does **not constitute financial advice** or a trading signal.
Markets are dynamic — always perform your own research before trading or investing.

Luxy Momentum, Trend, Bias and Breakout Indicators V7
TABLE OF CONTENTS
This is Version 7 (V7) - the latest and most optimized release. If you are using any older versions (V6, V5, V4, V3, etc.), it is highly recommended to replace them with V7.
Why This Indicator is Different
Who Should Use This
Core Components Overview
The UT Bot Trading System
Understanding the Market Bias Table
Candlestick Pattern Recognition
Visual Tools and Features
How to Use the Indicator
Performance and Optimization
FAQ
---
### CREDITS & ATTRIBUTION
This indicator implements proven trading concepts using entirely original code developed specifically for this project.
### CONCEPTUAL FOUNDATIONS
• UT Bot ATR Trailing System
- Original concept by @QuantNomad: (search "UT-Bot-Strategy"
- Our version is a complete reimplementation with significant enhancements:
- Volume-weighted momentum adjustment
- Composite stop loss from multiple S/R layers
- Multi-filter confirmation system (swing, %, 2-bar, ZLSMA)
- Full integration with multi-timeframe bias table
- Visual audit trail with freeze-on-touch
- NOTE: No code was copied - this is a complete reimplementation with enhancements.
• Standard Technical Indicators (Public Domain Formulas):
- Supertrend: ATR-based trend calculation with custom gradient fills
- MACD: Gerald Appel's formula with separation filters
- RSI: J. Welles Wilder's formula with pullback zone logic
- ADX/DMI: Custom trend strength formula inspired by Wilder's directional movement concept, reimplemented with volume weighting and efficiency metrics
- ZLSMA: Zero-lag formula enhanced with Hull MA and momentum prediction
### Custom Implementations
- Trend Strength: Inspired by Wilder's ADX concept but using volume-weighted pressure calculation and efficiency metrics (not traditional +DI/-DI smoothing)
- All code implementations are original
### ORIGINAL FEATURES (70%+ of codebase)
- Multi-Timeframe Bias Table with live updates
- Risk Management System (R-multiple TPs, freeze-on-touch)
- Opening Range Breakout tracker with session management
- Composite Stop Loss calculator using 6+ S/R layers
- Performance optimization system (caching, conditional calcs)
- VIX Fear Index integration
- Previous Day High/Low auto-detection
- Candlestick pattern recognition with interactive tooltips
- Smart label and visual management
- All UI/UX design and table architecture
### DEVELOPMENT PROCESS
**AI Assistance:** This indicator was developed over 2+ months with AI assistance (ChatGPT/Claude) used for:
- Writing Pine Script code based on design specifications
- Optimizing performance and fixing bugs
- Ensuring Pine Script v6 compliance
- Generating documentation
**Author's Role:** All trading concepts, system design, feature selection, integration logic, and strategic decisions are original work by the author. The AI was a coding tool, not the system designer.
**Transparency:** We believe in full disclosure - this project demonstrates how AI can be used as a powerful development tool while maintaining creative and strategic ownership.
---
1. WHY THIS INDICATOR IS DIFFERENT
Most traders use multiple separate indicators on their charts, leading to cluttered screens, conflicting signals, and analysis paralysis. The Suite solves this by integrating proven technical tools into a single, cohesive system.
Key Advantages:
All-in-One Design: Instead of loading 5-10 separate indicators, you get everything in one optimized script. This reduces chart clutter and improves TradingView performance.
Multi-Timeframe Bias Table: Unlike standard indicators that only show the current timeframe, the Bias Table aggregates trend signals across multiple timeframes simultaneously. See at a glance whether 1m, 5m, 15m, 1h are aligned bullish or bearish - no more switching between charts.
Smart Confirmations: The indicator doesn't just give signals - it shows you WHY. Every entry has multiple layers of confirmation (MA cross, MACD momentum, ADX strength, RSI pullback, volume, etc.) that you can toggle on/off.
Dynamic Stop Loss System: Instead of static ATR stops, the SL is calculated from multiple support/resistance layers: UT trailing line, Supertrend, VWAP, swing structure, and MA levels. This creates more intelligent, price-action-aware stops.
R-Multiple Take Profits: Built-in TP system calculates targets based on your initial risk (1R, 1.5R, 2R, 3R). Lines freeze when touched with visual checkmarks, giving you a clean audit trail of partial exits.
Educational Tooltips Everywhere: Every single input has detailed tooltips explaining what it does, typical values, and how it impacts trading. You're not guessing - you're learning as you configure.
Performance Optimized: Smart caching, conditional calculations, and modular design mean the indicator runs fast despite having 15+ features. Turn off what you don't use for even better performance.
No Repainting: All signals respect bar close. Alerts fire correctly. What you see in history is what you would have gotten in real-time.
What Makes It Unique:
Integrated UT Bot + Bias Table: No other indicator combines UT Bot's ATR trailing system with a live multi-timeframe dashboard. You get precision entries with macro trend context.
Candlestick Pattern Recognition with Interactive Tooltips: Patterns aren't just marked - hover over any emoji for a full explanation of what the pattern means and how to trade it.
Opening Range Breakout Tracker: Built-in ORB system for intraday traders with customizable session times and real-time status updates in the Bias Table.
Previous Day High/Low Auto-Detection: Automatically plots PDH/PDL on intraday charts with theme-aware colors. Updates daily without manual input.
Dynamic Row Labels in Bias Table: The table shows your actual settings (e.g., "EMA 10 > SMA 20") not generic labels. You know exactly what's being evaluated.
Modular Filter System: Instead of forcing a fixed methodology, the indicator lets you build your own strategy. Start with just UT Bot, add filters one at a time, test what works for your style.
---
2. WHO WHOULD USE THIS
Designed For:
Intermediate to Advanced Traders: You understand basic technical analysis (MAs, RSI, MACD) and want to combine multiple confirmations efficiently. This isn't a "one-click profit" system - it's a professional toolkit.
Multi-Timeframe Traders: If you trade one asset but check multiple timeframes for confirmation (e.g., enter on 5m after checking 15m and 1h alignment), the Bias Table will save you hours every week.
Trend Followers: The indicator excels at identifying and following trends using UT Bot, Supertrend, and MA systems. If you trade breakouts and pullbacks in trending markets, this is built for you.
Intraday and Swing Traders: Works equally well on 5m-1h charts (day trading) and 4h-D charts (swing trading). Scalpers can use it too with appropriate settings adjustments.
Discretionary Traders: This isn't a black-box system. You see all the components, understand the logic, and make final decisions. Perfect for traders who want tools, not automation.
Works Across All Markets:
Stocks (US, international)
Cryptocurrency (24/7 markets supported)
Forex pairs
Indices (SPY, QQQ, etc.)
Commodities
NOT Ideal For :
Complete Beginners: If you don't know what a moving average or RSI is, start with basics first. This indicator assumes foundational knowledge.
Algo Traders Seeking Black Box: This is discretionary. Signals require context and confirmation. Not suitable for blind automated execution.
Mean-Reversion Only Traders: The indicator is trend-following at its core. While VWAP bands support mean-reversion, the primary methodology is trend continuation.
---
3. CORE COMPONENTS OVERVIEW
The indicator combines these proven systems:
Trend Analysis:
Moving Averages: Four customizable MAs (Fast, Medium, Medium-Long, Long) with six types to choose from (EMA, SMA, WMA, VWMA, RMA, HMA). Mix and match for your style.
Supertrend: ATR-based trend indicator with unique gradient fill showing trend strength. One-sided ribbon visualization makes it easier to see momentum building or fading.
ZLSMA : Zero-lag linear-regression smoothed moving average. Reduces lag compared to traditional MAs while maintaining smooth curves.
Momentum & Filters:
MACD: Standard MACD with separation filter to avoid weak crossovers.
RSI: Pullback zone detection - only enter longs when RSI is in your defined "buy zone" and shorts in "sell zone".
ADX/DMI: Trend strength measurement with directional filter. Ensures you only trade when there's actual momentum.
Volume Filter: Relative volume confirmation - require above-average volume for entries.
Donchian Breakout: Optional channel breakout requirement.
Signal Systems:
UT Bot: The primary signal generator. ATR trailing stop that adapts to volatility and gives clear entry/exit points.
Base Signals: MA cross system with all the above filters applied. More conservative than UT Bot alone.
Market Bias Table: Multi-timeframe dashboard showing trend alignment across 7 timeframes plus macro bias (3-day, weekly, monthly, quarterly, VIX).
Candlestick Patterns: Six major reversal patterns auto-detected with interactive tooltips.
ORB Tracker: Opening range high/low with breakout status (intraday only).
PDH/PDL: Previous day levels plotted automatically on intraday charts.
VWAP + Bands : Session-anchored VWAP with up to three standard deviation band pairs.
---
4. THE UT BOT TRADING SYSTEM
The UT Bot is the heart of the indicator's signal generation. It's an advanced ATR trailing stop that adapts to market volatility.
Why UT Bot is Superior to Fixed Stops:
Traditional ATR stops use a fixed multiplier (e.g., "stop = entry - 2×ATR"). UT Bot is smarter:
It TRAILS the stop as price moves in your favor
It WIDENS during high volatility to avoid premature stops
It TIGHTENS during consolidation to lock in profits
It FLIPS when price breaks the trailing line, signaling reversals
Visual Elements You'll See:
Orange Trailing Line: The actual UT stop level that adapts bar-by-bar
Buy/Sell Labels: Aqua triangle (long) or orange triangle (short) when the line flips
ENTRY Line: Horizontal line at your entry price (optional, can be turned off)
Suggested Stop Loss: A composite SL calculated from multiple support/resistance layers:
- UT trailing line
- Supertrend level
- VWAP
- Swing structure (recent lows/highs)
- Long-term MA (200)
- ATR-based floor
Take Profit Lines: TP1, TP1.5, TP2, TP3 based on R-multiples. When price touches a TP, it's marked with a checkmark and the line freezes for audit trail purposes.
Status Messages: "SL Touched ❌" or "SL Frozen" when the trade leg completes.
How UT Bot Differs from Other ATR Systems:
Multiple Filters Available: You can require 2-bar confirmation, minimum % price change, swing structure alignment, or ZLSMA directional filter. Most UT implementations have none of these.
Smart SL Calculation: Instead of just using the UT line as your stop, the indicator suggests a better SL based on actual support/resistance. This prevents getting stopped out by wicks while keeping risk controlled.
Visual Audit Trail: All SL/TP lines freeze when touched with clear markers. You can review your trades weeks later and see exactly where entries, stops, and targets were.
Performance Options: "Draw UT visuals only on bar close" lets you reduce rendering load without affecting logic or alerts - critical for slower machines or 1m charts.
Trading Logic:
UT Bot flips direction (Buy or Sell signal appears)
Check Bias Table for multi-timeframe confirmation
Optional: Wait for Base signal or candlestick pattern
Enter at signal bar close or next bar open
Place stop at "Suggested Stop Loss" line
Scale out at TP levels (TP1, TP2, TP3)
Exit remaining position on opposite UT signal or stop hit
---
5. UNDERSTANDING THE MARKET BIAS TABLE
This is the indicator's unique multi-timeframe intelligence layer. Instead of looking at one chart at a time, the table aggregates signals across seven timeframes plus macro trend bias.
Why Multi-Timeframe Analysis Matters:
Professional traders check higher and lower timeframes for context:
Is the 1h uptrend aligning with my 5m entry?
Are all short-term timeframes bullish or just one?
Is the daily trend supportive or fighting me?
Doing this manually means opening multiple charts, checking each indicator, and making mental notes. The Bias Table does it automatically in one glance.
Table Structure:
Header Row:
On intraday charts: 1m, 5m, 15m, 30m, 1h, 2h, 4h (toggle which ones you want)
On daily+ charts: D, W, M (automatic)
Green dot next to title = live updating
Headline Rows - Macro Bias:
These show broad market direction over longer periods:
3 Day Bias: Trend over last 3 trading sessions (uses 1h data)
Weekly Bias: Trend over last 5 trading sessions (uses 4h data)
Monthly Bias: Trend over last 30 daily bars
Quarterly Bias: Trend over last 13 weekly bars
VIX Fear Index: Market regime based on VIX level - bullish when low, bearish when high
Opening Range Breakout: Status of price vs. session open range (intraday only)
These rows show text: "BULLISH", "BEARISH", or "NEUTRAL"
Indicator Rows - Technical Signals:
These evaluate your configured indicators across all active timeframes:
Fast MA > Medium MA (shows your actual MA settings, e.g., "EMA 10 > SMA 20")
Price > Long MA (e.g., "Price > SMA 200")
Price > VWAP
MACD > Signal
Supertrend (up/down/neutral)
ZLSMA Rising
RSI In Zone
ADX ≥ Minimum
These rows show emojis: GREEB (bullish), RED (bearish), GRAY/YELLOW (neutral/NA)
AVG Column:
Shows percentage of active timeframes that are bullish for that row. This is the KEY metric:
AVG > 70% = strong multi-timeframe bullish alignment
AVG 40-60% = mixed/choppy, no clear trend
AVG < 30% = strong multi-timeframe bearish alignment
How to Use the Table:
For a long trade:
Check AVG column - want to see > 60% ideally
Check headline bias rows - want to see BULLISH, not BEARISH
Check VIX row - bullish market regime preferred
Check ORB row (intraday) - want ABOVE for longs
Scan indicator rows - more green = better confirmation
For a short trade:
Check AVG column - want to see < 40% ideally
Check headline bias rows - want to see BEARISH, not BULLISH
Check VIX row - bearish market regime preferred
Check ORB row (intraday) - want BELOW for shorts
Scan indicator rows - more red = better confirmation
When AVG is 40-60%:
Market is choppy, mixed signals. Either stay out or reduce position size significantly. These are low-probability environments.
Unique Features:
Dynamic Labels: Row names show your actual settings (e.g., "EMA 10 > SMA 20" not generic "Fast > Slow"). You know exactly what's being evaluated.
Customizable Rows: Turn off rows you don't care about. Only show what matters to your strategy.
Customizable Timeframes: On intraday charts, disable 1m or 4h if you don't trade them. Reduces calculation load by 20-40%.
Automatic HTF Handling: On Daily/Weekly/Monthly charts, the table automatically switches to D/W/M columns. No configuration needed.
Performance Smart: "Hide BIAS table on 1D or above" option completely skips all table calculations on higher timeframes if you only trade intraday.
---
6. CANDLESTICK PATTERN RECOGNITION
The indicator automatically detects six major reversal patterns and marks them with emojis at the relevant bars.
Why These Six Patterns:
These are the most statistically significant reversal patterns according to trading literature:
High win rate when appearing at support/resistance
Clear visual structure (not subjective)
Work across all timeframes and assets
Studied extensively by institutions
The Patterns:
Bullish Patterns (appear at bottoms):
Bullish Engulfing: Green candle completely engulfs prior red candle's body. Strong reversal signal.
Hammer: Small body with long lower wick (at least 2× body size). Shows rejection of lower prices by buyers.
Morning Star: Three-candle pattern (large red → small indecision → large green). Very strong bottom reversal.
Bearish Patterns (appear at tops):
Bearish Engulfing: Red candle completely engulfs prior green candle's body. Strong reversal signal.
Shooting Star: Small body with long upper wick (at least 2× body size). Shows rejection of higher prices by sellers.
Evening Star: Three-candle pattern (large green → small indecision → large red). Very strong top reversal.
Interactive Tooltips:
Unlike most pattern indicators that just draw shapes, this one is educational:
Hover your mouse over any pattern emoji
A tooltip appears explaining: what the pattern is, what it means, when it's most reliable, and how to trade it
No need to memorize - learn as you trade
Noise Filter:
"Min candle body % to filter noise" setting prevents false signals:
Patterns require minimum body size relative to price
Filters out tiny candles that don't represent real buying/selling pressure
Adjust based on asset volatility (higher % for crypto, lower for low-volatility stocks)
How to Trade Patterns:
Patterns are NOT standalone entry signals. Use them as:
Confirmation: UT Bot gives signal + pattern appears = stronger entry
Reversal Warning: In a trade, opposite pattern appears = consider tightening stop or taking profit
Support/Resistance Validation: Pattern at key level (PDH, VWAP, MA 200) = level is being respected
Best combined with:
UT Bot or Base signal in same direction
Bias Table alignment (AVG > 60% or < 40%)
Appearance at obvious support/resistance
---
7. VISUAL TOOLS AND FEATURES
VWAP (Volume Weighted Average Price):
Session-anchored VWAP with standard deviation bands. Shows institutional "fair value" for the trading session.
Anchor Options: Session, Day, Week, Month, Quarter, Year. Choose based on your trading timeframe.
Bands: Up to three pairs (X1, X2, X3) showing statistical deviation. Price at outer bands often reverses.
Auto-Hide on HTF: VWAP hides on Daily/Weekly/Monthly charts automatically unless you enable anchored mode.
Use VWAP as:
Directional bias (above = bullish, below = bearish)
Mean reversion levels (outer bands)
Support/resistance (the VWAP line itself)
Previous Day High/Low:
Automatically plots yesterday's high and low on intraday charts:
Updates at start of each new trading day
Theme-aware colors (dark text for light charts, light text for dark charts)
Hidden automatically on Daily/Weekly/Monthly charts
These levels are critical for intraday traders - institutions watch them closely as support/resistance.
Opening Range Breakout (ORB):
Tracks the high/low of the first 5, 15, 30, or 60 minutes of the trading session:
Customizable session times (preset for NYSE, LSE, TSE, or custom)
Shows current breakout status in Bias Table row (ABOVE, BELOW, INSIDE, BUILDING)
Intraday only - auto-disabled on Daily+ charts
ORB is a classic day trading strategy - breakout above opening range often leads to continuation.
Extra Labels:
Change from Open %: Shows how far price has moved from session open (intraday) or daily open (HTF). Green if positive, red if negative.
ADX Badge: Small label at bottom of last bar showing current ADX value. Green when above your minimum threshold, red when below.
RSI Badge: Small label at top of last bar showing current RSI value with zone status (buy zone, sell zone, or neutral).
These labels provide quick at-a-glance confirmation without needing separate indicator windows.
---
8. HOW TO USE THE INDICATOR
Step 1: Add to Chart
Load the indicator on your chosen asset and timeframe
First time: Everything is enabled by default - the chart will look busy
Don't panic - you'll turn off what you don't need
Step 2: Start Simple
Turn OFF everything except:
UT Bot labels (keep these ON)
Bias Table (keep this ON)
Moving Averages (Fast and Medium only)
Suggested Stop Loss and Take Profits
Hide everything else initially. Get comfortable with the basic UT Bot + Bias Table workflow first.
Step 3: Learn the Core Workflow
UT Bot gives a Buy or Sell signal
Check Bias Table AVG column - do you have multi-timeframe alignment?
If yes, enter the trade
Place stop at Suggested Stop Loss line
Scale out at TP levels
Exit on opposite UT signal
Trade this simple system for a week. Get a feel for signal frequency and win rate with your settings.
Step 4: Add Filters Gradually
If you're getting too many losing signals (whipsaws in choppy markets), add filters one at a time:
Try: "Require 2-Bar Trend Confirmation" - wait for 2 bars to confirm direction
Try: ADX filter with minimum threshold - only trade when trend strength is sufficient
Try: RSI pullback filter - only enter on pullbacks, not chasing
Try: Volume filter - require above-average volume
Add one filter, test for a week, evaluate. Repeat.
Step 5: Enable Advanced Features (Optional)
Once you're profitable with the core system, add:
Supertrend for additional trend confirmation
Candlestick patterns for reversal warnings
VWAP for institutional anchor reference
ORB for intraday breakout context
ZLSMA for low-lag trend following
Step 6: Optimize Settings
Every setting has a detailed tooltip explaining what it does and typical values. Hover over any input to read:
What the parameter controls
How it impacts trading
Suggested ranges for scalping, day trading, and swing trading
Start with defaults, then adjust based on your results and style.
Step 7: Set Up Alerts
Right-click chart → Add Alert → Condition: "Luxy Momentum v6" → Choose:
"UT Bot — Buy" for long entries
"UT Bot — Sell" for short entries
"Base Long/Short" for filtered MA cross signals
Optionally enable "Send real-time alert() on UT flip" in settings for immediate notifications.
Common Workflow Variations:
Conservative Trader:
UT signal + Base signal + Candlestick pattern + Bias AVG > 70%
Enter only at major support/resistance
Wider UT sensitivity, multiple filters
Aggressive Trader:
UT signal + Bias AVG > 60%
Enter immediately, no waiting
Tighter UT sensitivity, minimal filters
Swing Trader:
Focus on Daily/Weekly Bias alignment
Ignore intraday noise
Use ORB and PDH/PDL less (or not at all)
Wider stops, patient approach
---
9. PERFORMANCE AND OPTIMIZATION
The indicator is optimized for speed, but with 15+ features running simultaneously, chart load time can add up. Here's how to keep it fast:
Biggest Performance Gains:
Disable Unused Timeframes: In "Time Frames" settings, turn OFF any timeframe you don't actively trade. Each disabled TF saves 10-15% calculation time. If you only day trade 5m, 15m, 1h, disable 1m, 2h, 4h.
Hide Bias Table on Daily+: If you only trade intraday, enable "Hide BIAS table on 1D or above". This skips ALL table calculations on higher timeframes.
Draw UT Visuals Only on Bar Close: Reduces intrabar rendering of SL/TP/Entry lines. Has ZERO impact on logic or alerts - purely visual optimization.
Additional Optimizations:
Turn off VWAP bands if you don't use them
Disable candlestick patterns if you don't trade them
Turn off Supertrend fill if you find it distracting (keep the line)
Reduce "Limit to 10 bars" for SL/TP lines to minimize line objects
Performance Features Built-In:
Smart Caching: Higher timeframe data (3-day bias, weekly bias, etc.) updates once per day, not every bar
Conditional Calculations: Volume filter only calculates when enabled. Swing filter only runs when enabled. Nothing computes if turned off.
Modular Design: Every component is independent. Turn off what you don't need without breaking other features.
Typical Load Times:
5m chart, all features ON, 7 timeframes: ~2-3 seconds
5m chart, core features only, 3 timeframes: ~1 second
1m chart, all features: ~4-5 seconds (many bars to calculate)
If loading takes longer, you likely have too many indicators on the chart total (not just this one).
---
10. FAQ
Q: How is this different from standard UT Bot indicators?
A: Standard UT Bot (originally by @QuantNomad) is just the ATR trailing line and flip signals. This implementation adds:
- Volume weighting and momentum adjustment to the trailing calculation
- Multiple confirmation filters (swing, %, 2-bar, ZLSMA)
- Smart composite stop loss system from multiple S/R layers
- R-multiple take profit system with freeze-on-touch
- Integration with multi-timeframe Bias Table
- Visual audit trail with checkmarks
Q: Can I use this for automated trading?
A: The indicator is designed for discretionary trading. While it has clear signals and alerts, it's not a mechanical system. Context and judgment are required.
Q: Does it repaint?
A: No. All signals respect bar close. UT Bot logic runs intrabar but signals only trigger on confirmed bars. Alerts fire correctly with no lookahead.
Q: Do I need to use all the features?
A: Absolutely not. The indicator is modular. Many profitable traders use just UT Bot + Bias Table + Moving Averages. Start simple, add complexity only if needed.
Q: How do I know which settings to use?
A: Every single input has a detailed tooltip. Hover over any setting to see:
What it does
How it affects trading
Typical values for scalping, day trading, swing trading
Start with defaults, adjust gradually based on results.
Q: Can I use this on crypto 24/7 markets?
A: Yes. ORB will not work (no defined session), but everything else functions normally. Use "Day" anchor for VWAP instead of "Session".
Q: The Bias Table is blank or not showing.
A: Check:
"Show Table" is ON
Table position isn't overlapping another indicator's table (change position)
At least one row is enabled
"Hide BIAS table on 1D or above" is OFF (if on Daily+ chart)
Q: Why are candlestick patterns not appearing?
A: Patterns are relatively rare by design - they only appear at genuine reversal points. Check:
Pattern toggles are ON
"Min candle body %" isn't too high (try 0.05-0.10)
You're looking at a chart with actual reversals (not strong trending market)
Q: UT Bot is too sensitive/not sensitive enough.
A: Adjust "Sensitivity (Key×ATR)". Lower number = tighter stop, more signals. Higher number = wider stop, fewer signals. Read the tooltip for guidance.
Q: Can I get alerts for the Bias Table?
A: The Bias Table is a dashboard for visual analysis, not a signal generator. Set alerts on UT Bot or Base signals, then manually check Bias Table for confirmation.
Q: Does this work on stocks with low volume?
A: Yes, but turn OFF the volume filter. Low volume stocks will never meet relative volume requirements.
Q: How often should I check the Bias Table?
A: Before every entry. It takes 2 seconds to glance at the AVG column and headline rows. This one check can save you from fighting the trend.
Q: What if UT signal and Base signal disagree?
A: UT Bot is more aggressive (ATR trailing). Base signals are more conservative (MA cross + filters). If they disagree, either:
Wait for both to align (safest)
Take the UT signal but with smaller size (aggressive)
Skip the trade (conservative)
There's no "right" answer - depends on your risk tolerance.
---
FINAL NOTES
The indicator gives you an edge. How you use that edge determines results.
For questions, feedback, or support, comment on the indicator page or message the author.
Happy Trading!

ICT Essentials [LDT]ICT Essentials
Overview
ICT Essentials is an all-in-one trading utility built to create a natural and efficient workflow for ICT-based traders.
Every component has been designed to integrate seamlessly and update dynamically across timeframes.
The indicator focuses on clarity, performance and customization, allowing traders to tailor every part of their trading experience.
Equal Highs & Lows
This feature automatically detects and marks Equal Highs (EQH) and Equal Lows (EQL) with full control over visuals and behavior.
Users can customize line colors, widths, and styles, label size, color, background transparency and text offset.
The logic uses an optimized scanning and caching system that maintains smooth performance even on higher timeframes.
It provides a precise and adaptive way to identify structural liquidity points whilst keeping the chart clean and readable.
Killzones & Session Pivots
Plots the main trading sessions such as Asia, London and New York (AM, Lunch, PM) with full flexibility and styling options.
Each session can be enabled or disabled individually, with its own color, transparency and label preferences.
Session highs and lows are automatically tracked and plotted as pivots with extension modes like Until Mitigated or Past Mitigation.
This system gives traders the ability to organize market sessions exactly how they prefer whilst keeping the chart consistent and efficient.
Daily Pivots and Tier System
Alongside session pivots, the script tracks daily highs and lows to provide a broader structural view of price. These pivots are stored and displayed on the chart with their appearance updating automatically when price interacts with them.
The system includes a unique tier-based visibility filter that maintains a clean chart by preventing duplicate or overlapping pivots. Recent daily pivots are cached and compared to session pivots and when two levels fall within a defined proximity, the redundant one is automatically hidden. This creates a clear hierarchy of daily and session levels, keeping the most relevant structure visible whilst removing noise.
All aspects of the daily pivot system are fully customizable, including the number of tracked pivots, color, style settings and how mitigated levels are handled. The caching and filtering logic ensures smooth performance and a visually organized workspace even as the data updates in real time.
Key Times
Allows up to five custom key time markers such as the Midnight Open, 6:00 AM or 10:00 AM.
Each marker can be fully customized with its own text, color, line style and thickness.
This makes it simple to visualize key reaction points that align with each traders timing model.
Higher Timeframe Candles
Displays higher timeframe candles such as 1H, 4H or Daily directly on the active chart to provide context without switching views.
Users can customize body, wick and border colors, along with adding optional trace lines for the open, close, high and low and can also show the countdown timers for remaining candle time.
Adjustable spacing, positioning and label visibility makes the display blend naturally with any trading setup.
This module helps traders connect multiple timeframes visually in a clean and intuitive way.
Watermark
Adds a customizable watermark with title, subtitle and symbol or timeframe information.
Every element can be adjusted for color, size, transparency, alignment and position.
The result is a polished, professional chart layout that adapts to the user's personal style.
Optimization and Design
ICT Essentials is built for performance, using cached arrays and lightweight calculations to maintain responsiveness on all timeframes.
Each feature can be toggled individually to suit the traders focus or system performance.
The script delivers a fluid, customizable and highly optimized trading experience designed to feel natural and effortless in day-to-day use.
Credits
This script takes reference and inspiration from several open-source indicators:
Equal Highs and Lows by jzstur
ICT HTF Candles (fadi) by fadizeidan
ICT Killzones + Pivots EP by tradeforopp
AG FX - Watermark by AGFXTRADING
All components have been refactored, optimized and unified into a single framework for a smoother and more efficient workflow.

Session First 5-Min High/LowHere's a professional description for your indicator:
Session First 5-Min High/Low Marker
This indicator automatically identifies and marks the high and low price levels established during the first 5 minutes of major trading sessions, helping traders identify key intraday support and resistance zones.
Key Features:
Tracks three major trading sessions in IST (Indian Standard Time):
Asian Session: 5:30 AM - 5:35 AM
London Session: 12:30 PM - 12:35 PM
New York Session: 5:30 PM - 5:35 PM
Draws horizontal lines at the highest and lowest prices reached during each session's opening 5-minute window
Color-coded for easy identification (Yellow for Asian, Blue for London, Red for New York)
Lines extend across the chart to help track price reactions throughout the day
Clean, minimal design with optional labels
Best Used For:
Identifying key intraday support and resistance levels
Session breakout trading strategies
Understanding institutional order flow at market opens
Works on 1-minute timeframe for precise tracking
Customizable Settings:
Toggle line extensions on/off
Adjust line width (1-5)
Change colors for each session
Show/hide session labels
Perfect for day traders and scalpers who trade around major session openings and want to identify high-probability support/resistance zones established during peak liquidity periods.
This description explains what the indicator does, its practical applications, and its key features in a way that's clear for TradingView users.RetryClaude can make mistakes. Please double-check responses.

US Opening 5-Minute Candle HighlighterUS Opening 5-Minute Candle Highlighter — True RVOL (Two-Tier + Label)
What it does (in plain English)
This indicator finds the first 5-minute bar of the US cash session (09:30–09:35 ET) and highlights it when the candle has the specific “strong open” look you want:
Opens near the low of its own range, and
Closes near the high of its own range, and
Has a decisive real body (not a wick-y doji), and
(Optionally) is a green candle, and
Meets a TRUE opening-bar RVOL filter (compares today’s 09:30–09:35 volume only to prior sessions’ 09:30–09:35 volumes).
You get two visual intensities based on opening RVOL:
Tier-1 (≥ threshold 1, default 1.0×) → light green highlight + lime arrow
Tier-2 (≥ threshold 2, default 1.5×) → darker green highlight + green arrow
An RVOL label (e.g., RVOL 1.84x) can be shown above or below the opening bar.
Designed for 5-minute charts. On other timeframes the “opening bar” will be the bar that starts at 09:30 on that timeframe (e.g., 15-minute 09:30–09:45). For best results keep the chart on 5m.
How the pattern is defined
For the opening 5-minute bar, we compute:
Range = high − low
Body = |close − open|
Then we measure where the open and close sit within the bar’s own range on a 0→1 scale:
0 means exactly at the low
1 means exactly at the high
Using two quantiles:
Open ≤ position in range (0–1) (default 0.20)
Example: 0.20 means “open must be in the lowest 20% of the bar’s range.”
Close ≥ position in range (0–1) (default 0.80)
Example: 0.80 means “close must be in the top 20% of the bar’s range.”
This keeps the logic range-normalized so it adapts across different tickers and vol regimes (you’re not using fixed cents or % of price).
Body ≥ fraction of range (0–1) (default 0.55)
Requires the real body to be at least that fraction of the total range.
0.55 = body fills ≥ 55% of the candle.
Purpose: filter out indecisive, wick-heavy bars.
Raise to 0.7–0.8 for only the fattest thrusts; lower to 0.3–0.4 to admit more bars.
Require green candle? (default ON)
If ON, close > open must be true. Turn OFF if you also want to catch strong red opens for shorts.
Minimum range (ticks)
Ignore tiny, illiquid opens: e.g., set to 2–5 ticks to suppress micro bars.
TRUE Opening-Bar RVOL (why it’s “true”)
Most “RVOL” compares against any recent bars, which isn’t fair at the open.
This indicator calculates only against prior opening bars:
At 09:30–09:35 ET, take today’s opening 5-minute volume.
Compare it to the average of the last N sessions’ opening 5-minute volumes.
RVOL = today_open_volume / average_prior_open_volumes.
So:
1.0× = equal to average prior opens.
1.5× = 150% of average prior opens.
2.0× = double the typical opening participation.
A minimum prior samples guard (default 10) ensures you don’t judge with too little history. Until enough samples exist, the RVOL gate won’t pass (you can disable RVOL temporarily if needed).
Visuals & tiers
Light green highlight + lime arrow → price filters pass and RVOL ≥ Tier-1 (default 1.0×)
Dark green highlight + green arrow → price filters pass and RVOL ≥ Tier-2 (default 1.5×)
Optional bar paint in matching green tones for extra visibility.
Optional RVOL label (e.g., RVOL 1.84x) above or below the opening bar.
You can show the label only when the candle qualifies, or on every open.
Inputs (step-by-step)
Price-action filters
Open ≤ position in range (0–1): default 0.20. Smaller = stricter (must open nearer the low).
Close ≥ position in range (0–1): default 0.80. Larger = stricter (must close nearer the high).
Body ≥ fraction of range (0–1): default 0.55. Raise to demand a “fatter” body.
Require green candle?: default ON. Turn OFF to also mark bearish thrusts.
Minimum range (ticks): default 0. Set to 2–5 for liquid mid/large caps.
Time settings
Timezone: default America/New_York. Leave as is for US equities.
Start hour / minute: defaults 09:30. The bar that starts at this time is evaluated.
TRUE Opening-Bar RVOL (two-tier)
Require TRUE opening-bar RVOL?: ON = must pass Tier-1 to highlight; OFF = price filters alone can highlight (still shows Tier-2 when hit).
RVOL lookback (prior opens count): default 20. How many prior openings to average.
Min prior opens required: default 10. Warm-up guard.
Tier-1 RVOL threshold (× avg): default 1.00× (light green).
Tier-2 RVOL threshold (× avg): default 1.50× (dark green).
Display
Also paint candle body?: OFF by default. Turn ON for instant visibility on a chart wall.
Arrow size: tiny/small/normal/large.
Light/Dark opacity: tune highlight strength.
Show RVOL label?: ON/OFF.
Show label only when candle qualifies?: ON by default; OFF to see RVOL every open.
Label position: Above candle or Below candle.
Label size: tiny/small/normal/large.
How to use (quick start)
Apply to a 5-minute chart.
Keep defaults: Open ≤ 0.20, Close ≥ 0.80, Body ≥ 0.55, Require green ON.
Turn RVOL required ON, with Tier-1 = 1.0×, Tier-2 = 1.5×, Lookback = 20, Min prior = 10.
Optional: enable Paint bar and set Arrow size = large for monitor-wall visibility.
Optional: show RVOL label below the bar to keep wicks clean.
Interpretation:
Dark green = A+ opening thrust with strong participation (≥ Tier-2).
Light green = Valid opening thrust with at least average participation (≥ Tier-1).
No highlight = one or more filters failed (quantiles, body, green, range, or RVOL if required).
Alerts
Two alert conditions are included:
Opening 5m Match — Tier-2 RVOL → fires when the opening candle passes price filters and RVOL ≥ Tier-2.
Opening 5m Match — Tier-1 RVOL → fires when the opening candle passes price filters and RVOL ≥ Tier-1 (but < Tier-2).
Recommended alert settings
Condition: choose the script + desired tier.
Options: Once Per Bar Close (you want the confirmed 09:30–09:35 bar).
Set your watchlist to symbols of interest (themes/sectors) and let the alerts pull you to the right charts.
Recommended starting values
Quantiles: Open ≤ 0.20, Close ≥ 0.80
Body fraction: 0.55
Require green: ON
RVOL: Required ON, Tier-1 = 1.0×, Tier-2 = 1.5×, Lookback 20, Min prior 10
Display: Paint bar ON, Arrow large, Label ON, Below candle
Tune tighter for A-plus selectivity:
Open ≤ 0.15, Close ≥ 0.85, Body ≥ 0.65, Tier-2 2.0×.
Notes, tips & limitations
5-minute timeframe is the intended use. On higher TFs, the 09:30 bar spans more than 5 minutes; geometry may not reflect the first 5 minutes alone.
RTH only: The opening detection looks at the clock (09:30 ET). Pre-market bars are ignored for the signal and for RVOL history.
Warm-up period: Until you have Min prior opens required samples, the RVOL gate won’t pass. You can temporarily toggle RVOL off.
DST & timezone: Leave timezone on America/New_York for US equities. If you trade non-US exchanges, set the appropriate TZ and opening time.
Illiquid tickers: Use Minimum range (ticks) and require RVOL to reduce noise.
No strategy orders: This is a visual/alert tool. Combine with your execution and risk plan.
Why this is useful on multi-monitor setups
Instant pattern recognition: the two-shade green makes A vs A+ opens pop at a glance.
Adaptive thresholds: quantiles & body are within-bar, so it works across $5 and $500 names.
Fair volume test: TRUE opening RVOL avoids comparing to pre-market or midday bars.
Optional labels: glanceable RVOL x-value helps triage the strongest themes quickly.
