Search in scripts for "sessions"

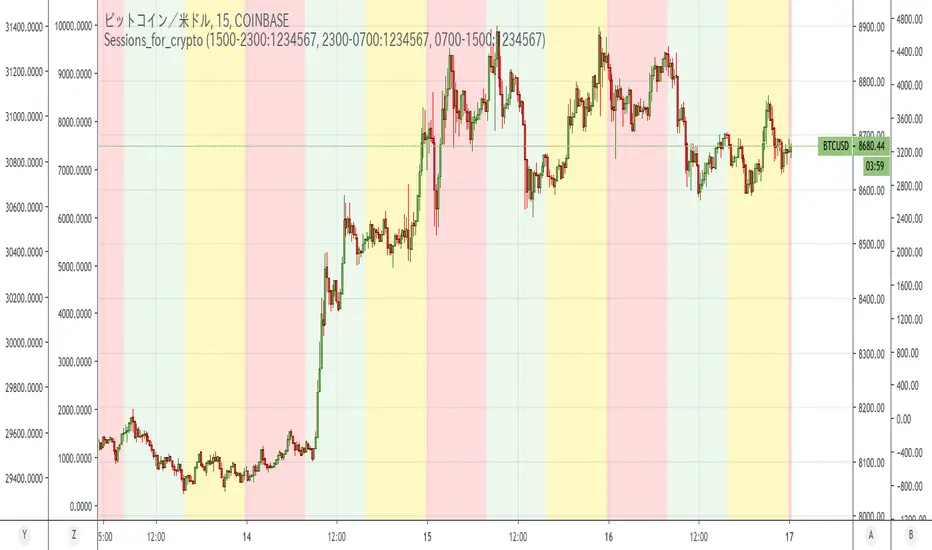
Sessions_for_cryptoCoinCollege's article found that between September 1, 2019 and January 15, 2020, Bitcoin price movements tended to be the most driven by US time.
Japan time was the least active. This is similar to forex.
In the article, it was defined as follows:
NY time: 00:00 to 8:00 (NYK時間)
Tokyo time: 8: 00-16: 00 (TKY時間)
London time: 16:00 to 00:00 (LDN時間)
This indicator colors the time zone according to its definition.
Reference: Consideration on the time zone and day of the week when the Bitcoin market is easy to move (September 2019-January 2020)
Original title: ビットコイン相場が動き易い時間帯と曜日についての考察(2019年9月〜2020年1月)
========================================================================
コインカレッジさんの記事で「米国時間が一番Bitcoin動くよね」という調査結果が出ていました。
なのですが、時間帯を色分けしてくれる丁度よいインジがなかったので作りました。
SessionsThis is an advanced level sessions indicator.
Not so much an indicator, more of an auto way of plotting levels rather than drawing levels by hand every day.
It maps out the London and New York Sessions.
It also maps out the closing time and price for future reference.
Daily high and low of the past few days are laid out.
Each setting can be turned on and off in the settings if you don't require that session info.
The time settings are setup according to NY time. It should work straight without any modifications.
If you are a price action trader using sessions, this indicator will help you track price movement between sessions and give you possible support and resistance levels based on the previous session close.
This indicator does require allot of sessions based trading knowledge but if you understand it, it can be of major use to you.
Best used on GBP and USD currency pairs
Best timeframes 5Min - 1Hour
Best trading style would be day trading

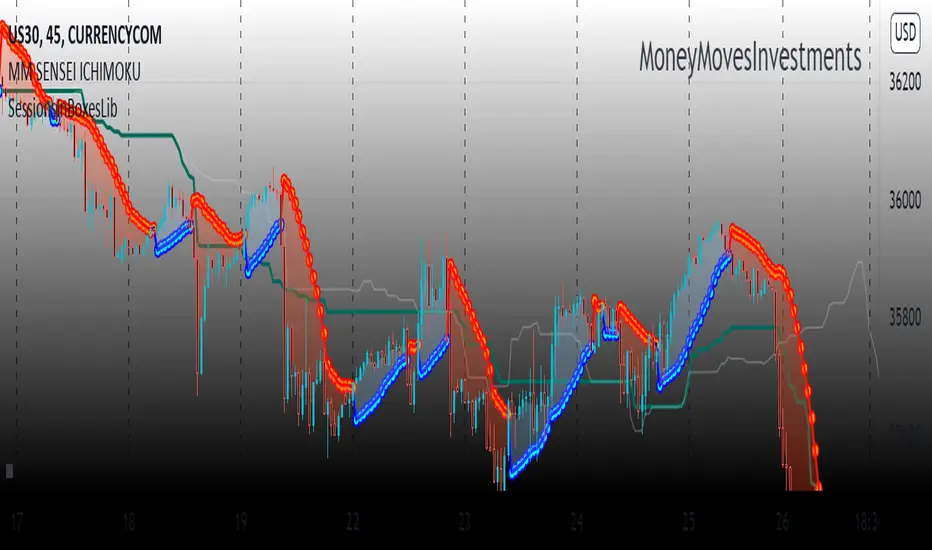
SessionsInBoxesLibLibrary "SessionsInBoxesLib"
Provides functions calculating the all-time high/low of values.
get_positions()
draw()
Sessions Highs/LowsThis indicator plots the High and Low of the three main trading sessions:
Asia (20:00–03:00) – green lines
London (03:00–08:00) – blue lines
New York (08:00–13:00) – red lines
Features:
Levels update in real time during each session.
When a new session starts, the previous lines are deleted – only the latest active sessions remain visible.
Default session times are set to Asia (20:00–03:00), London (03:00–08:00), and New York (08:00–13:00), but you can adjust them to your own custom hours in the settings.
Colors can also be customized.
Use cases:
Quickly visualize session ranges.
Track session highs/lows for breakouts, fakeouts, and reactions around liquidity zones.

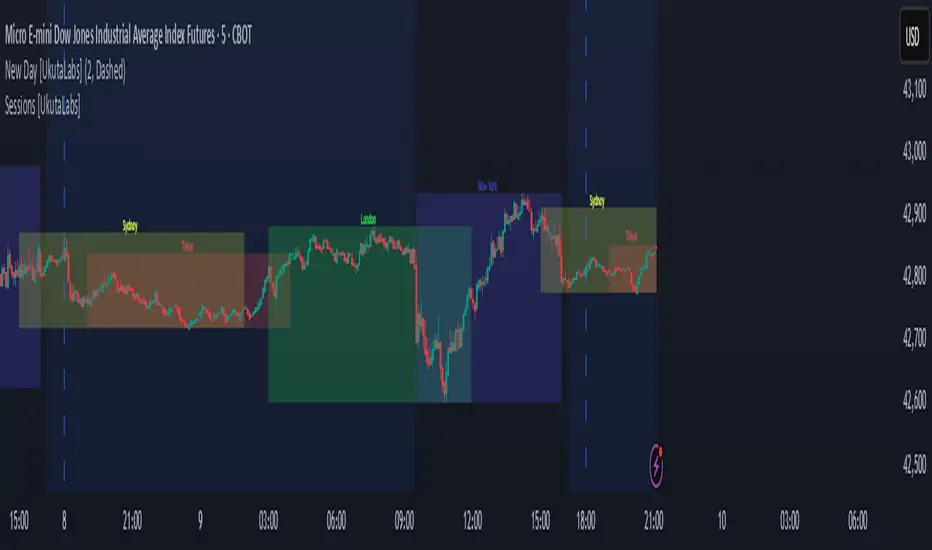
Sessions [UkutaLabs]█ OVERVIEW
Sessions is a trading toolkit that displays the different trading sessions on your chart during a trading day. By default, Sessions displays the four standard trading sessions; New York, Tokyo, London, and Sydney.
Each of the four sessions can be toggled, and the Sessions indicator is completely customizable, allowing users to define their own sessions to be generated by the script.
The aim of this script is to improve the trading experience of users by automatically displaying information about each default or custom session to the user.
█ USAGE
This script will automatically detect and label different market sessions. By default, the script will identify the four standard trading sessions, but each of these can be toggled off in the settings.
However, users are not limited to these four trading sessions and have the ability to define their own sessions to be identified by the script. When a session begins, the script will automatically start outlining the market data of that session, including the high and low of the period that is represented by the session.
If the market is within two or more sessions at the same time, then each session will be treated individually and will overlap with each other.
The sessions will be identified as a colored box surrounding the market data of the period that it represents, and a label will be displayed above the box to identify the session that it represents. The label, color and period of each session is completely customizable.
The user can also adjust all sessions at once to account for timezones in the settings.
█ SETTINGS
Session 1
• Session 1: Determines whether or not this session will be drawn by the script.
• A string field to determine the name of the session that will be displayed above the session range.
• Two time fields representing the start and finish of the session.
• A color field to determine the color of the range and label.
Session 2
• Session 2: Determines whether or not this session will be drawn by the script.
• A string field to determine the name of the session that will be displayed above the session range.
• Two time fields representing the start and finish of the session.
• A color field to determine the color of the range and label.
Session 3
• Session 3: Determines whether or not this session will be drawn by the script.
• A string field to determine the name of the session that will be displayed above the session range.
• Two time fields representing the start and finish of the session.
• A color field to determine the color of the range and label.
Session 4
• Session 4: Determines whether or not this session will be drawn by the script.
• A string field to determine the name of the session that will be displayed above the session range.
• Two time fields representing the start and finish of the session.
• A color field to determine the color of the range and label.
Time Zones
• UTC +/-: Determines the offset of each session. Enter - before the number to represent a negative offset.
Sessions [Plug&Play]This indicator automatically highlights the three major FX trading sessions—Asia, London, and New York—on your chart and, at the close of each session, draws right-extended horizontal rays at that session’s high and low. It’s designed to help you visually identify when price is trading within each session’s range and to quickly see where the highest and lowest prices occurred before the next major session begins.
Key Features:
Session Boxes
Draws a semi-transparent box around each session’s timeframe (Asia, London, New York) based on your local UTC offset.
Each box dynamically expands in real time: as new candles form during the session, the box’s top and bottom edges update to match the highest high and lowest low seen so far in that session.
When the session ends, the box remains on your chart, anchored to the exact candles that formed its boundaries.
High/Low Rays
As soon as a session closes (e.g., London session ends at 17:00 UTC+0 by default), two horizontal rays are drawn at that session’s final high and low.
These rays are “pinned” to the exact candles where the high/low occurred, so they stay in place when you scroll or zoom.
Each ray extends indefinitely to the right, providing a clear reference of the key supply/demand levels created during that session.
Session Labels
Optionally places a small “London,” “New York,” or “Asia” label at the top edge of each completed session’s box.
Labels are horizontally centered within the session’s box and use a contrasting, easy-to-read font color.
Customizable Appearance
Show/Hide Each Session: Toggle display of London, New York, and Asia sessions separately.
Time Ranges: By default, London is 08:00–17:00 (UTC), New York is 13:00–22:00 (UTC), and Asia is 00:00–07:00 (UTC). You can override each session’s start/end times using the “Time Range” picker.
Color & Opacity: Assign custom colors to each session. Choose a global “Dark,” “Medium,” or “Light” opacity preset to adjust box fill transparency and border shading.
Show/Hide Labels & Outlines: Turn the text labels and the box borders on or off independently.
UTC Offset Support
If your local broker feed or price data is not in UTC, simply adjust the “UTC Offset (+/–)” input. The indicator will recalculate session start/end times relative to your chosen offset.
How to Use:
Add the Indicator:
Open TradingView’s Pine Editor, paste in this script, and click “Add to Chart.”
By default, you’ll see three translucent boxes appear once each session begins (Asia, London, New York).
Watch in Real Time:
As soon as a session starts, its box will appear anchored to the first candle. The top and bottom of the box expand if new extremes occur.
When the session closes, the final box remains visible and two horizontal rays mark that session’s high and low.
Analyze Key Levels:
Use the high- and low-level rays to gauge session liquidity zones—areas where stop orders, breakouts, or reversals often occur.
For example, if London’s high is significantly above current price, it may act as resistance in the New York session.
Customize to Your Needs:
Toggle specific sessions on/off (e.g., if you only care about London and New York).
Change each session’s color to match your chart theme.
Adjust the “UTC Offset” so sessions align with your local time.
Disable labels or box borders if you prefer a cleaner look.
Inputs Overview:
Show London/New York/Asia Session (bool): Show or hide each session’s box and its high/low rays.
Time Range (session): Defines the start/end of each session in “HHMM–HHMM” (24h) format.
Colour (color): Custom color for each session’s box fill, border, and high/low rays.
Show Session Labels (bool): Toggle the “London,” “New York,” “Asia” text that appears at the top of each completed box.
Show Range Outline (bool): Toggle the box border (if off, only a translucent fill is drawn).
Opacity Preset (Dark/Medium/Light): Controls transparency of box fill and border.
UTC Offset (+/–) (int): Adjusts session times for different time zones (e.g., +1 for UTC+1).
Why It’s Useful:
Quickly Identify Session Activity: Visually distinguish when each major trading session is active, then compare price action across sessions.
Pinpoint High/Low Liquidity Levels: Drawn rays highlight where the market hit its extremes—critical zones for stop orders or breakout entries.
Multi-Timeframe Context: By seeing historical session boxes and rays, you can locate recurring supply/demand areas, overlap zones, or session re-tests.
Fully Automated Workflow: Once added to your chart, the script does all the work of tracking session boundaries and drawing high/low lines—no manual box or line drawing necessary.
Example Use Cases:
London Breakout Traders: See where London’s high/low formed, then wait for price to revisit those levels during the New York session.
Range Breakout Strategies: If price consolidates inside the London box, use the boxed extremes as immediate targets for breakout entries.
Intraday Liquidity Swings: During quieter hours, watch Asia’s high/low to identify potential support/resistance before London’s opening.
Overlap Zones: Compare London’s range with Asia’s range to find areas of confluence—high-probability reversal or continuation zones.

Sessions By petranThis indicator highlights the key trading sessions on the chart: Asian, Frankfurt, London, and New York. It helps traders visually track when each session begins and ends, making it easier to analyze price action, volume, and volatility during specific times of the day.
Key features:
Customizable session start and end times
Up to 4 major sessions highlighted
Best used on intraday timeframes (1-minute to 1-hour)
Clean, minimal design with adjustable colors and transparency
No repainting – reliable for both live trading and backtesting
Ideal for intraday traders and anyone who wants to better understand market dynamics during different trading sessions.

Sessions 13-Zones ValentijnJelteA simple indicator to display multiple sessions within sessions. For example, you can divide the New York session into different time slots of 3 hours, 1 hour, and 30 minutes, or whatever you need for your analysis.

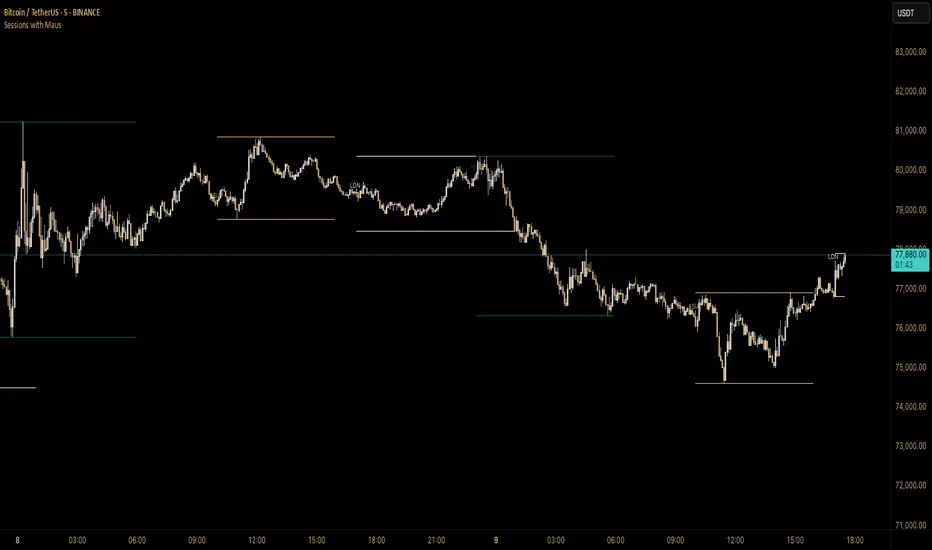
Sessions with Mausa session high/low tracker that draws flat, horizontal lines for Asia, London, and New York trading sessions. It updates those levels in real time during each session, locks them in once the session ends, and keeps them on the chart for context.
At a glance, you always know:
Where each session’s highs and lows were set
Which session produced them (ASIA, LDN, NY labels float cleanly above the highs)
When price is approaching or reacting to prior session levels
🔹 Use Cases:
• Key Levels – See where Asia, London, or NY set boundaries, and watch how price respects or rejects them
• Breakout Zones – Monitor when price breaks above/below session highs/lows
• Session Structure – Know instantly if a move happened during London or NY without squinting at the clock
• Backtesting – Keep historic session levels on the chart for reference — nothing gets deleted
• Confluence – Align these levels with support/resistance, fibs, or liquidity zones
Simple, visual, no distractions — just session structure at a glance.
Sessions by nolimitCustom Trading Sessions Indicator (6 Sessions)
This indicator allows you to display up to 6 customizable trading sessions on your chart with full control over timing, colors, and timezone settings.
Features:
- 6 independent trading sessions that can be enabled/disabled individually
- Flexible time range settings for each session
- Individual color selection for each session background
- Timezone selection (UTC-12 to UTC+12) that applies to all sessions
- Clean, organized settings grouped by session

Sessions and High/LowCan be used to mark highs and lows of any sessions you desire can do 4 sessions
Sessions+Days Marker (SigmaSita)An indicator that marks the sessions and days. You can adjust session start times. Sessions are Asian, London and New York.
Sessions[Lenny Kiruthu]The script below is designed to show up to 4 different trading sessions i.e. London, New York, Tokyo and Sydney sessions, it also displays the days each session is taking place in as well as two horizontal lines one for the previous days high and the other for the previous days low.
It also displays a table that shows the user the highest and lowest price for 4 different currency pairs the previous day as well as their current prices and below it a confirmation row that shows whether price is currently above, below or within yesterdays range. Note that it only states "High Broken" or "Low Broken" if the current close is above or below the lines.
What you can change
Your time zone for example GMT -4 or GMT +3
The session start and end time
The colors, border type and border width of the session ranges
Displaying the table
Ability to choose the 4 symbols to view on the table

Sessions [New_ProfitEfex]This script is use for displaying session in a very attractive an clarity way
You can give it a try for free

Sessions with timeframe filter🕒 Smart Timeframe Filtering
This session indicator includes an automatic filter that disables all session boxes when the chart timeframe is greater than the user-defined input. This helps keep higher-timeframe charts clean and focused by hiding intraday sessions when they’re no longer relevant — especially helpful for multi-timeframe traders.
🔍 Features:
📦 Draws up to 3 customizable session boxes with dynamic high/low tracking.
⏱️ Auto-disables on higher timeframes (Smart Timeframe Filter).
🌍 Fully customizable session times, box colors, and time zone (GMT-based).
⚡ Optimized for performance using lightweight, non-overlapping box logic.
👨🍳 UI is organized like a chef’s kitchen: clean, intuitive, and easy to navigate. Settings are grouped and filtered to avoid clutter.
✅ Best Use:
This indicator is most useful for intraday traders on 1m–15m charts.
It’s designed to keep your workspace clean on 30m+ charts or whatever threshold you define.

Sessions by SHARK [Kyiv Time]Why Forex Sessions Matter
First of all, it is very convenient for a trader to structure their working hours. The best times to open positions are during the London Kill Zone (KZ) and New York Kill Zone (KZ). Based on what happens within each session, you can build your future analysis while considering the overall context.
We must understand that there are specific times of the day that are more or less volatile. Knowing this will help you determine when you should be looking for trade setups and when you should avoid them.
Trading outside of the Kill Zones can lead to holding positions for too long because market liquidity decreases, which in turn leads to lower volatility.

Sessions ny vizScript Purpose
This indicator draws a colored background during the New York trading session. It's useful for traders who want to have a visual overview of when the American (NY) trading session is active.
Main Features
NY Session Visualization - draws a gray bar in the background of the chart during NY trading hours (15:00-19:00 CET)
Customization - allows users to:
Set custom session time range
Adjust background color and transparency
Limit display to only the last 24 hours
Input Parameters
sessionRange - session time range (default 15:00-19:00 CET)
sessionColour - background color (default gray with 90% transparency)
onlyLast24Hours - toggle for showing only the last 24 hours (default false)
Technical Details
Script is written in Pine Script version 5
Uses UNIX timestamp for time period calculations
Runs as an overlay indicator (overlay=true), meaning it displays directly on the price chart
Uses the bgcolor() function for background rendering
Contains logic to check if current time is within defined session
Usage
This indicator is useful for:
Monitoring active NY trading session hours
Planning trades during the most liquid hours of the US market
Visual orientation in the chart during different trading sessions

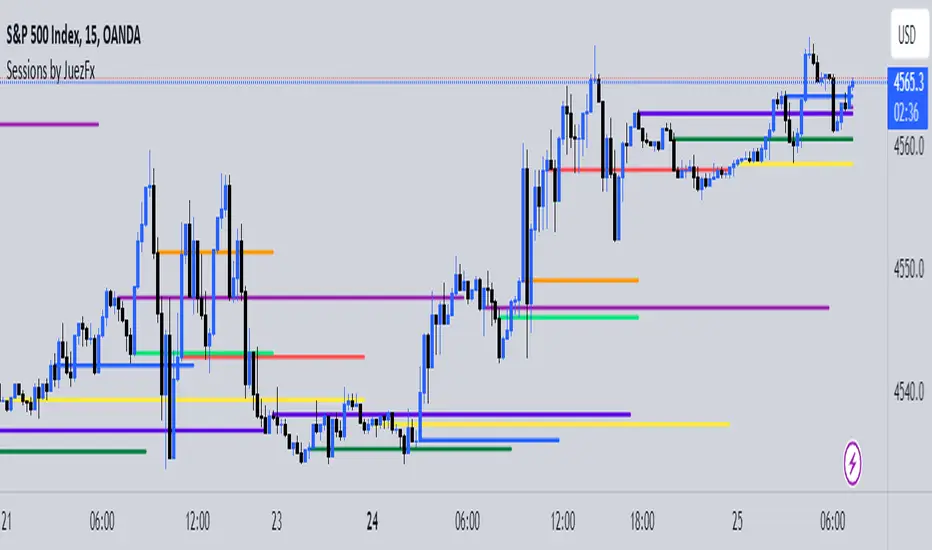
Sessions by JuezFxLines Plotted at the opening price of London, New York, New York Stock Exchange, and Asia. It could also plot lines of the closing price of the session.
The script is just plotting a line at those levels to give us a visual indicator of those specific levels as they could be very beneficial for your trading. Opening and closing of the session hold the most liquidity, attracting the market towards it.
I hope this script will help you in your trading and you can use those levels along with other confluences in order to identify key levels that the market could react from!
There are some similar scripts but this one have more lines to plot at could be identified by different color and line thickness!
Sessions Lines & BackgroundDisplay Asia, London & New York sessions as background colors or lines (for a cleaner chart).

Sessions by Aegean This script has the full 8 hours for the 3 major sessions and 1 hour for the Frankfurt, Germany session

Session Bar Color (US Time)This script is designed to change the color of bars on a trading chart based on different trading sessions in Eastern Time (ET). It is different from currently published scripts in that it specifically focuses on US time sessions and provides a customizable approach to defining and coloring each session.
To use this script, you can apply it to a chart by selecting it from the list of available indicators or overlays.
The script is meant for traders who are interested in visualizing different trading sessions on their charts. By coloring the bars based on session boundaries, it can help traders quickly identify session changes and potentially adjust their trading strategies accordingly. Mostly it's used to draw the high and low zones of each session.
The markets this script is suitable for are those that operate within the US time zones, as it specifically focuses on Eastern Time (ET) sessions. It can be used for various types of markets, including stocks, futures, and forex.
The conditions for each session are defined using the input. session function, which allows you to specify the start and end times for each session. The script includes four sessions: Asian, London, USA, and New York. By modifying the defval parameter for each session input, you can customize the session times to fit your specific trading preferences or time zone.
The script uses the time function to check if the current bar falls within a particular session. If the condition is met, it sets the color of the bar using the bar color function. Each session is assigned a different color: black for the Asian session, teal for the London session, a custom RGB color (dark red) for the USA session, and red for the New York session.
It's important to note that this script assumes the time zone of the trading platform is set to "Etc/GMT+4" to align with Eastern Time (ET). If your platform uses a different time zone, you may need to adjust the time function calls to match your desired time zone.
