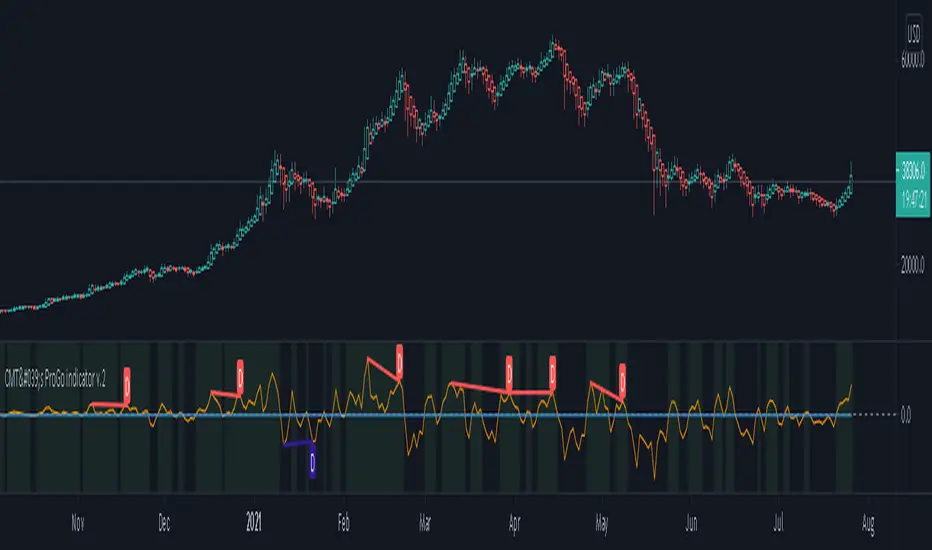
CMT's ProGo indicator v.2This was inspired by William's ProGo, which is an oscillator with a fast line based on today's open minus close compared to a slow line derived from yesterday's open minus close. These are tied to the 14 day SMA in both cases. William's hypothesis is that smart money makes its decisions based on what's happening now and dumb money makes their decisions slower. My hypothesis is that smart money reacts faster and in a more straightforward manner based on current price action while dumb money takes even longer than WIlliam's factored due to overthinking things. To reflect this, I've tied the pro line to the 1 SMA and the amateur line to the 21 SMA then changed the formula for the amateur line to open divided by close. That's a really cute story and all, but let's throw out all of the smart money/dumb money stuff and strap our boots to reality.
How to use:
1.) What we're looking at in the end is an examination of the relationship between price action and the 21 SMA. Since we're exploring rate of change and momentum, divergences should be relevant, right? And divergences are relevant in this indicator. These divergences are pretty good and tend to work in harmony with the trend, though can signal reversal points.
2.) This is not a real time oscillator. It involves three levels of derivation. Sometimes it'll provide leading signals and sometimes it'll show lagging signals because we're comparing the present against the past through a filter.
3.) I've noticed that this oscillator can be used to generate angled trend lines in some cases before they become evident through price action. This is interesting. What you'll do is slap some trend lines onto the oscillator, copy those then paste them onto the price action chart, copy them a few times to create a channel and see what's what. Horizontal support and resistance on the oscillator seems to translate into future price action S/R as well. THAT's interesting.
4.) On lower time frames, this indicator will do a pretty good job of letting you know whether you're in a bearish or bullish trend.
5.) Because of how the oscillator is formulated, it only recognizes Bitcoin as either bullish or ranging on higher time frames and will only ever register bearish on lower time frames. I don't think this will ever change, but if it does register BTC as bearish on higher time frames, I'd be real worried about Bitcoin.
6.) You'll notice that over time, volatility in the oscillator increases. Neat, huh? Yeah, it'll increase as market cap does. Take care and have fun with that.
v2.0 Improvements:
Divergences have been added.
Search in scripts for "smart"
Long/Short Volatility AlgoA modification of my leveraged ETF algorithm. Giving out for free because it's a sloppy algorithm, and I personally use a much more refined algorithm developed by someone much smarter than me.
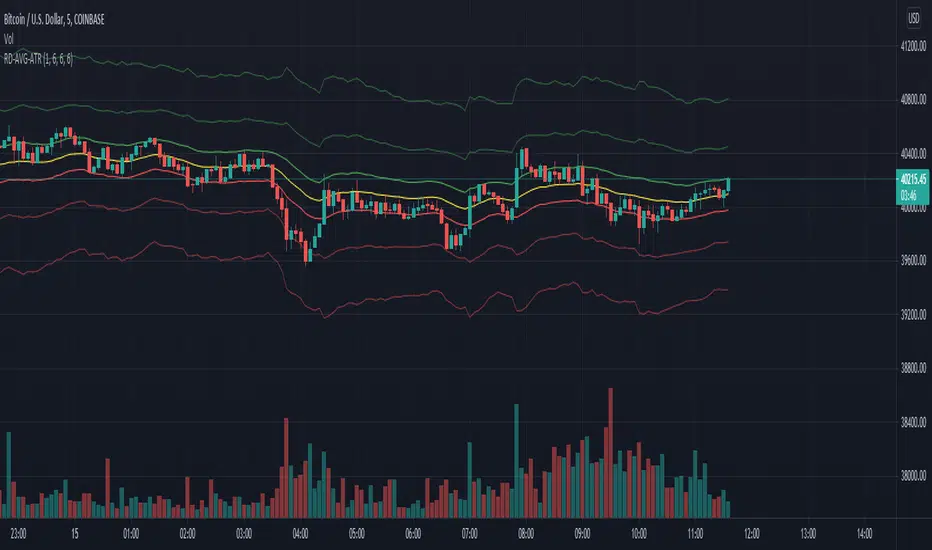
RexDog Average with ATRBam-- look what Rex did. A RexDog Average with ATR bands-- he's going insane. Simple but powerful.
This indicator includes the RexDog average but provides you with the ability to plot (and customize) both above and below ATR calculated bands.
With this indicator you can display all 3 or any combination of the bands: the RexDog Avg, Adding ATR Upper or the Subtracting ATR Below.
To remove a plot or customize color and line size go to the style options.
Before we get detailed with this version you can customize the default average factor of the RexDog Avg (default is 6). More tips on this below.
How This Works
Just as with the RexDog Average we take the 6 ATR data points (200, 100, 50, 24, 9, 5). We then create an average by dividing by 6. But wait there's more...
With this indicator you can customize independently the above and below bands via a float value for precision. 6 is the default (you can customize by increments at 0.25 or input value you like 1-20).
Now this works opposite how you might think but you'll get it once you start changing the numbers. For instance, editing the above band lowering the ATR factor will raise the band.
RexDog Avg Factor
With this release you are able to change the default average factor (6) to anything you want. You'll find though going too high or low from the default won't get the best results. The default increment change is 0.1 but you can enter any float value you like between 1-20.
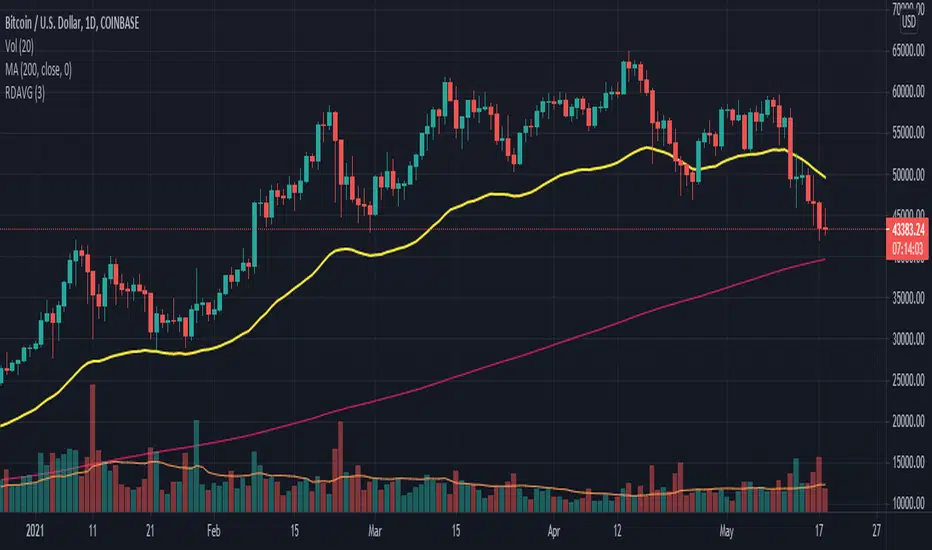
The Original RexDog Average Overview
Yes, simple—the RexDog Average is a bias moving average indicator. The purpose is to provide the overall momentum bias you should have when trading an instrument. It works across all markets and all timeframes.
Usage:
Price above the RexDog AVG = long momentum bias
Price below the RexDog AVG = short momentum bias
With the ATR addition most likely your usage will be similar to Bollinger Bands. While not the same as in deviations much of the same principles might apply, especially with customization.
*Note: we have banned the word “trend” in the RexDog Trading Method.
Additional Usage Advice:
If price rips through the average your momentum bias should probably change. 80% of the time when price moves through the RexDog Average it will come back and test the area around average within 1-2 bars. 20% of the time it does not. The momentum is so strong in that direction so look for a 50-70% tests of the bar that impulse through the RexDog Average.
If you are using the RexDog Trading Method by default if the price is above the average and you are short you are in a fade trade. The momentum trade would be long. Of course reverse if price is below.
On multiple time frames. Of course, one timeframe can be long bias and a lower timeframe can be short bias. Which one do you use? Both—if your in a short trade using lower timeframe and with the bias of the average your in a momentum trade—but on the higher timeframe your aware you are essential fading the overall momentum.
Background:
Rex and I searched high and low for one simple thing. A moving average (or combination of some) that we could use to form our momentum bias that worked for all timeframes and all markets we trade.
We tried and tested them all. Even went down the path of ribbons and various other types of hybrid EMA /MA derivatives. Nothing had a high enough accuracy or mathematically was reliable that we could say with a high probability that it was on the right side of the momentum.
We almost stopped and landed on using the true and tested 200 MA—but we found through extensive tests that using the 200MA or EMA you’re often late to the party. Look you don’t need to be the first one in the trade but having a heads up sure helps.
To quote one of the best financial movies of the modern era—Margin Call:
“There are three ways to make a living in this business: be first, be smarter, or cheat… it sure is a hell of a lot easier to be first”. The RexDog Average used properly enables you to be first or damn near close.
Under the Hood:
This is so simple most reading this will discount it. You might even scoff and berate Rex for wasting your time. But you would be wrong. The RexDog Average has been tested across all markets—FOREX, Crypto, Equities, Futures (even tick charts), and even the Penguin population in Antarctica.
The RexDog Average is an average of 6 simple moving averages: 200, 100, 50, 24, 9, 5.
Yes, that’s it.
RexDog AverageYes, simple—the RexDog Average is a bias moving average indicator. The purpose is to provide the overall momentum bias you should have when trading an instrument. It works across all markets and all timeframes.
Usage:
Price above the RexDog AVG = long momentum bias
Price below the RexDog AVG = short momentum bias
*Note: we have banned the word “trend” in the RexDog Trading Method.
Additional Usage Advice:
If price rips through the average your momentum bias should probably change. 80% of the time when price moves through the RexDog Average it will come back and test the area around average within 1-2 bars. 20% of the time it does not. The momentum is so strong in that direction so look for a 50-70% tests of the bar that impulse through the RexDog Average.
If you are using the RexDog Trading Method by default if the price is above the average and you are short you are in a fade trade. The momentum trade would be long. Of course reverse if price is below.
On multiple time frames. Of course, one timeframe can be long bias and a lower timeframe can be short bias. Which one do you use? Both—if your in a short trade using lower timeframe and with the bias of the average your in a momentum trade—but on the higher timeframe your aware you are essential fading the overall momentum.
Background:
Rex and I searched high and low for one simple thing. A moving average (or combination of some) that we could use to form our momentum bias that worked for all timeframes and all markets we trade.
We tried and tested them all. Even went down the path of ribbons and various other types of hybrid EMA/MA derivatives. Nothing had a high enough accuracy or mathematically was reliable that we could say with a high probability that it was on the right side of the momentum.
We almost stopped and landed on using the true and tested 200 MA—but we found through extensive tests that using the 200MA or EMA you’re often late to the party. Look you don’t need to be the first one in the trade but having a heads up sure helps.
To quote one of the best financial movies of the modern era—Margin Call:
“There are three ways to make a living in this business: be first, be smarter, or cheat… it sure is a hell of a lot easier to be first”. The RexDog Average used properly enables you to be first or damn near close.
Under the Hood:
This is so simple most reading this will discount it. You might even scoff and berate Rex for wasting your time. But you would be wrong. The RexDog Average has been tested across all markets—FOREX, Crypto, Equities, Futures (even tick charts), and even the Penguin population in Antarctica.
The RexDog Average is an average of 6 simple moving averages: 200, 100, 50, 24, 9, 5.
Yes, that’s it.
The RexDog Average Plus will be released soon with additional parameters and most likely upper and lower bounds. In addition, we are working on a hybrid RexDog Exponential Average.
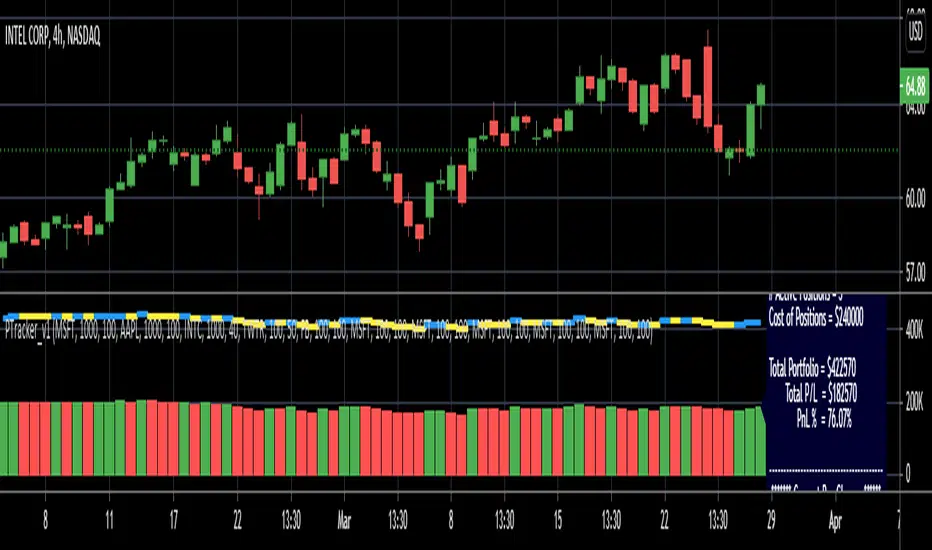
Simple Portfolio TrackerThis is just a simple portfolio tracker that i started to play around with - i'm sure there are smarter ways to do this, but i chose the simpler way :) -- please feel free to use this, or consider it as a starting point to your own indicator.
i will come back later and add some more stuff once i get time. for example, show the total value, recent change, P&L % ..etc
So the simple idea is to track a portfolio of few positions and watch how the total portfolio and the PnL changes over time as the price of the individual holdings move up and down. it can be added to any chart.
The code is currently set to track 5 positions - settings allow to enter if the positions is used or not, symbol, amount and cost price..
** note: more positions can be added by editing the code and copying and pasting the marked "position block" that contains the input statements and the calculations, then changing/replacing the position identifier (_1, _2, ..etc) in all variables with new number..
--- don't forget to add these extra positions you insert in the code to the formula lines that calculate the totals
i tried to make this as easy as possible in the code. the code includes a sample portfolio as default values just to help "demo" how this works
the input is made easy, thanks to the recent addition of the "inline" feature in the input() statement
i don't know if some traders will find this useful ?? or if more about how to use it is needed.. let me know in the comments.. as i mentioned, i was just playing with the idea over the weekend so didn't really put a lot of work into it.
Credits and thanks to @boji1 for inspiring this :)
VPA ANALYSIS VPA Analysis provide the indications for various conditions as per the Volume Spread Analysis concept. The various legends are provided below
LEGEND DETAILS
UT1 - Upthrust Bar: This will be widespread Bar on high Volume closing on the low. This normally happens after an up move. Here the smart money move the price to the High and then quickly brings to the Low trapping many retail trader who rushed into in order not to miss the bullish move. This is a bearish Signal
UT2 -Upthrust Bar Confirmation: A widespread Down Bar following a Upthrust Bar. This confirms the weakness of the Upthrust Bar. Expect the stock to move down
Confirms . This is a Bearish Signal
PUT - Pseudo Upthrust: An Upthrust Bar in bar action but the volume remains average. This still indicates weakness. Indicate Possible Bearishness
PUC -Pseudo Upthrust Confirmation: widespread Bar after a pseudo–Upthrust Bar confirms the weakness of the Pseudo Upthrust Bar
Confirms Bearishness
BC - Buying Climax: A very wide Spread bar on ultra-High Volume closing at the top. Such a Bar indicates the climatic move in an uptrend. This Bar traps many retailers as the uptrend ends and reverses quickly. Confirms Bearishness
TC - Trend Change: This Indicates a possible Trend Change in an uptrend. Indicates Weakness
SEC- Sell Condition: This bar indicates confluence of some bearish signals. Possible end of Uptrend and start of Downtrend soon. Bearish Signal
UT - Upthrust Condition: When multiple bearish signals occur, the legend is printed in two lines. The Legend “UT” indicates that an upthrust condition is present. Bearish Signal
ND - No demand in uptrend: This bar indicates that there is no demand. In an uptrend this indicates weakness. Bearish Signal
ND - No Demand: This bar indicates that there is no demand. This can occur in any part of the Trend. In all place other than in an uptrend this just indicates just weakness
ED - Effort to Move Down: Widespread Bar closing down on High volume or above average volume . The smart money is pushing the prices down. Bearish Signal
EDF - Effort to Move Down Failed: Widespread / above average spread Bar closing up on High volume or above average volume appearing after ‘Effort to move down” bar.
This indicates that the Effort to move the pries down has failed. Bullish signal
SV - Stopping Volume: A high volume medium to widespread Bar closing in the upper middle part in a down trend indicates that smart money is buying. This is an indication that the down trend is likely to end soon. Indicates strength
ST1 - Strength Returning 1: Strength seen returning after a down trend. High volume adds to strength. Indicates Strength
ST2 - Strength Returning 2: Strength seen returning after a down trend. High volume adds to strength.
BYC - Buy Condition: This bar indicates confluence of some bullish signals Possible end of downtrend and start of uptrend soon. Indicates Strength
EU - Effort to Move Up: Widespread Bar closing up on High volume or above average volume . The smart money is pushing the prices up. Bullish Signal
EUF - Effort to Move Up Failed: Widespread / above average spread Bar closing down on High volume or above average volume appearing after ‘Effort to move up” bar.
This indicates that the Effort to move the pries up has failed. Bearish Signal
LVT- Low Volume Test: A low volume bar dipping into previous supply area and closing in the upper part of the Bar. A successful test is a positive sign. Indicates Strength
ST(after a LVT ) - Strength after Successful Low Volume Test: An up Bar closing near High after a Test confirms strength. Bullish Signal
RUT - Reverse Upthrust Bar: This will be a widespread Bar on high Volume closing on the high is a Down Trend. Here the buyers have become active and move the prices from the low to High. The down Move is likely to end and up trend likely to start soon. indicates Strength
NS - No supply Bar: This bar indicates that there is no supply. This is a sign of strength especially in a down trend. Indicates strength
ST - Strength Returns: When multiple bullish signals occur, the legend is printed in two lines. The Legend “ST” indicates that an condition of strength other than the condition mentioned in the second line is present. Bullish Signals
BAR COLORS
Green- Bullish / Strength
Red - Bearish / weakness
Blue / White - Sentiment Changing from bullish to Bearish and Vice Versa

Pinescript v4 - The Holy Grail (Trailing Stop)After studying several other scripts, I believe I have found the Holy Grail! (Or perhaps I've just found a bug with Tradingview's Pinescript v4 language) Anyhow, I'm publishing this script in the hope that someone smarter than myself could shed some light on the fact that adding a trailing stop to any strategy seems to make it miraculously...no that's an understatement...incredulously, stupendously, mind-bendingly profitable. I'm talking about INSANE profit factors, higher than 200x, with drawdowns of <10%. Sounds too good to be true? Maybe it is...or you could hook it up to your LIVE broker, and pray it doesn't explode. This is an upgraded version of my original Pin Bar Strategy.
Recommended Chart Settings:
Asset Class: Forex
Time Frame: H1
Long Entry Conditions:
a) Exponential Moving Average Fan up trend
b) Presence of a Bullish Pin Bar
c) Pin Bar pierces the Exponential Moving Average Fan
Short Entry Conditions:
a) Exponential Moving Average down trend
b) Presence of a Bearish Pin Bar
c) Pin Bar pierces the Exponential Moving Average Fan
Exit Conditions:
a) Trailing stop is hit
b) Moving Averages cross-back (optional)
c) It's the weekend
Default Robot Settings:
Equity Risk (%): 3 //how much account balance to risk per trade
Stop Loss (x*ATR, Float): 0.5 //stoploss = x * ATR, you can change x
Stop Loss Trail Points (Pips): 1 //the magic sauce, not sure how this works
Stop Loss Trail Offset (Pips): 1 //the magic sauce, not sure how this works
Slow SMA (Period): 50 //slow moving average period
Medium EMA (Period): 18 //medium exponential moving average period
Fast EMA (Period): 6 //fast exponential moving average period
ATR (Period): 14 // average true range period
Cancel Entry After X Bars (Period): 3 //cancel the order after x bars not triggered, you can change x
Backtest Results (2019 to 2020, H1, Default Settings):
AUDUSD - 1604% profit, 239.6 profit factor, 4.9% drawdown (INSANE)
NZDUSD - 1688.7% profit, 100.3 profit factor, 2.5% drawdown
GBPUSD - 1168.8% profit, 98.7 profit factor, 0% drawdown
USDJPY - 900.7% profit, 93.7 profit factor, 4.9% drawdown
USDCAD - 819% profit, 31.7 profit factor, 8.1% drawdown
EURUSD - 685.6% profit, 26.8 profit factor, 5.9% drawdown
USDCHF - 1008% profit, 18.7 profit factor, 8.6% drawdown
GBPJPY - 1173.4% profit, 16.1 profit factor, 7.9% drawdown
EURAUD - 613.3% profit, 14.4 profit factor, 9.8% drawdown
AUDJPY - 1619% profit, 11.26 profit factor, 9.1% drawdown
EURJPY - 897.2% profit, 6 profit factor, 13.8% drawdown
EURGBP - 608.9% profit, 5.3 profit factor, 9.8% drawdown (NOT TOO SHABBY)
As you can clearly see above, this forex robot is projected by the Tradingview backtester to be INSANELY profitable for all common forex pairs. So what was the difference between this strategy and my previous strategies? Check my code and look for "trail_points" and "trail_offset"; you can even look them up in the PineScript v4 documentation. They specify a trailing stop as the exit condition, which automatically closes the trade if price reverses against you.
I however suspect that the backtester is not properly calculating intra-bar price movement, and is using a simplified model. With this simplfied approach, the trailing stop code becomes some sort of "holy grail" generator, making every trade entered profitable.
Risk Warning:
This is a forex trading strategy that involves high risk of equity loss, and backtest performance will not equal future results. You agree to use this script at your own risk.
Hint:
To get more realistic results, and *maybe* overcome the intrabar simulation error, change the settings to: "Stop Loss Trail Points (pips)": 100
I am not sure if this eradicates the bug, but the entries and exits look more proper, and the profit factors are more believable.

Trend M ver1this simple tool a helper for trader in order to put your target at the correct places:)
so script based on Trend M (open script in my page)
the script based on non security MTF that allow us to detect the M = mean average of resistance and support by MTF
best setting is either monthly or weekly
when you go on lower chart just put in the min the exact TF that you on. 60 min =60
2 hour 120
5 min =5
etc
when ever the trend is above the mean or M then it bullish =lime color. bellow the M is bearish =red color
the R1 and S level are % from the mean . so it can act for us either target or as stop loss
you can set the R1 or S1 as you like by % ratio . so 0.01 is 1%
0.1 is 10 % etc
all you need to find is the weekly or monthly range of the asset then put the % ratio that you wish up or down
you can use it with trend lines or other method .it just another tool to make you trade smarter

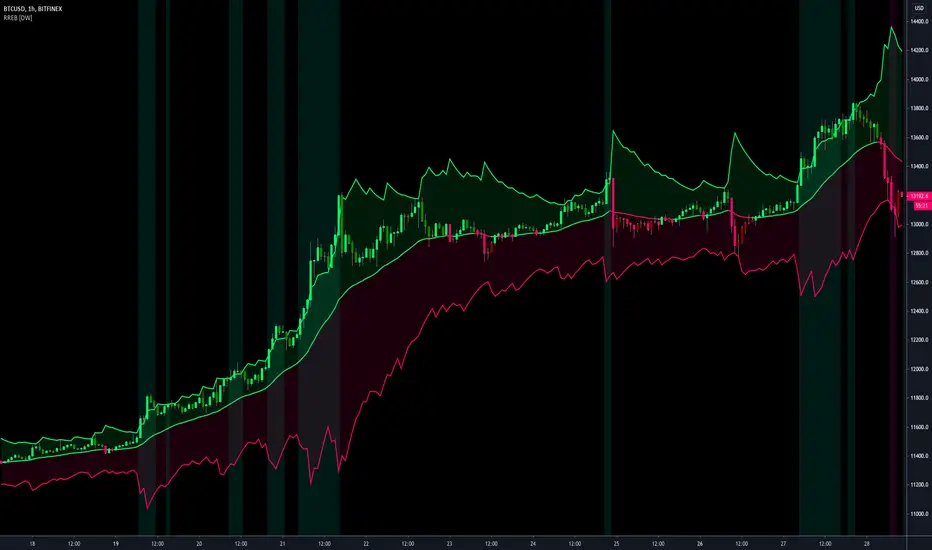
Resampling Reverse Engineering Bands [DW]This is an experimental study designed to reverse engineer price levels from centered oscillators at user defined sample rates.
This study aims to educate users on the process of oscillator reverse engineering, and to give users an alternative perspective on some of the most commonly used oscillators in the trading game.
Reverse engineering price levels from an oscillator is actually a rather simple, straightforward process.
Rather than plugging price values into a function to solve for oscillator values, we rearrange the function using some basic algebraic operations and plug in a specified oscillator value to solve for price values instead.
This process tells us what price value is needed in order for the oscillator to equal a certain value.
For example, if you wanted to know what price value would be considered “overbought” or “oversold” according to your oscillator, you can do that using this process.
In this study, the reverse engineering functions are used to calculate the price values of user defined high and low oscillator thresholds, and the price values for the oscillator center.
This allows you to visualize what prices will trigger thresholds as a sort of confidence interval, which is information that isn't inherently available when simply analyzing the oscillator directly.
This script is equipped with three reverse engineering functions to choose from for calculating the band values:
-> Reverse Relative Strength Index (RRSI)
-> Reverse Stochastic Oscillator (RStoch)
-> Reverse Commodity Channel Index (RCCI)
You can easily select the function you want to utilize from the "Band Calculation Type" dropdown tab.
These functions are specially designed to calculate at any sample rate (up to 1 bar per sample) utilizing the process of downsampling that I introduced in my Resampling Filter Pack.
The sample rate can be determined with any of these three methods:
-> BPS - Resamples based on the number of bars.
-> Interval - Resamples based on time in multiples of current charting timeframe.
-> PA - Resamples based on changes in price action by a specified size. The PA algorithm in this script is derived from my Range Filter algorithm.
The range for PA method can be sized in points, pips, ticks, % of price, ATR, average change, and absolute quantity.
Utilizing downsampled rates allows you to visualize the reverse engineered values of an oscillator calculated at larger sample scales.
This can be rather beneficial for trend analysis since lower sample rates completely remove certain levels of noise.
By default, the sample rate is set to 1 BPS, which is the same as bar-to-bar calculation. Feel free to experiment with the sample rate parameters and configure them how you like.
Custom bar colors are included as well. The color scheme is based on disparity between sources and the reverse engineered center level.
In addition, background highlights are included to indicate when price is outside the bands, thus indicating "overbought" and "oversold" conditions according to the thresholds you set.
I also included four external output variables for easy integration of signals with other scripts:
-> Trend Signals (Current Resolution Prices) - Outputs 1 for bullish and -1 for bearish based on disparity between current resolution source and the central level output.
-> Trend Signals (Resampled Prices) - Outputs 1 for bullish and -1 for bearish based on disparity between resampled source and the central level output.
-> Outside Band Signal (Current Resolution Prices) - Outputs 1 for overbought and -1 for oversold based on current resolution source being outside the bands. Returns 0 otherwise.
-> Outside Band Signal (Resampled Prices) - Outputs 1 for overbought and -1 for oversold based on resampled source being outside the bands. Returns 0 otherwise.
To use these signals with another script, simply select the corresponding external output you want to use from your script's source input dropdown tab.
Reverse engineering oscillators is a simple, yet powerful approach to incorporate into your momentum or trend analysis setup.
By incorporating projected price levels from oscillators into our analysis setups, we are able to gain valuable insights, make (potentially) smarter trading decisions, and visualize the oscillators we know and love in a totally different way.
I hope you all find this script useful and enjoyable!
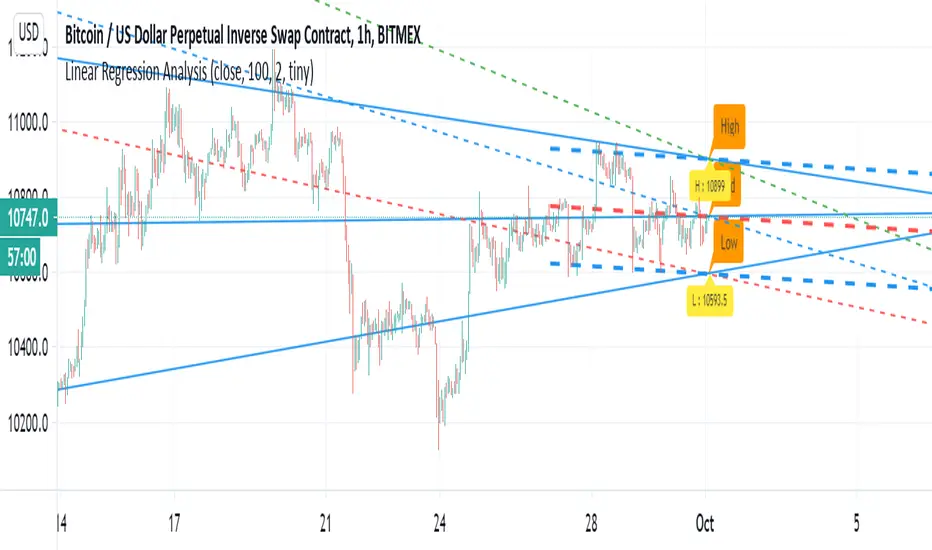
Linear Regression AnalysisJust another linear regression tool to play with :)
I have to say that linear regression is one of my favorite indictor so i just try to play to show
how its we can make it smarter:)
the dashed lines are represent linear regression clone with high low and mid level shown.
the blue thin line show longer trend projection
the trend is option that can use for shorter trend
Hyper Frame Fibo MA RibbonsIntroduction
Moving averages are an integral part of the TA world. There are different types of moving averages and each person uses them depending on their strategy and market conditions.
Meanwhile, the main variable in calculating the averages is their LENGTH. This value is optional, but not every value is applicable.
After much experience in the world of financial markets, I came to the conclusion that although the most popular length values are 20, 50, 100, and 200, the Fibonacci number come with surprising results .
Description
The following script calculates seven averages with the length of Fibonacci numbers (34, 55, 89, 144, 233, 377 and 610) with the formula of your choice (SMA, EMA, WMA, HMA) and shows that we named it FiboMa .
You can also have Bollinger Bands with the desired frame at the same time.
This is not the whole story...
You can see the same values from smaller or larger frames at the same time!
We named this feature Hyper Frame Vision .
It is possible to display values for FiboMa up to three hyper frames (with the main frame a total of 4 levels) and in the Bollinger Bands one hyper frame (with the main frame a total of 2 levels).
By default, the display of FiboMa hyper frame values is limited to the last 10 bars, which you can change to an arbitrary value by changing the source code.
The display of hyper frame values is not limited for Bollinger Band.
What is its use? What is it good for?
Support and Resistance
Using dynamic support / resistance is much smarter than static! This protects you from the risk of many fake breaks, and your profit and loss limits will be more flexible and more efficient.
The intersection of FiboMa ribbons are potential points of support / resistance.
We use colors to easily identify supports / resistances.
Any average lower than the price is assumed as support and displayed in green, and any average above the price is assumed as resistance so displayed in red.
So the color of the averages is dynamic.
The color of FiboMa is a range from red to green. Whatever colors get saturated , the lenght is longer and the more power it has as support / resistance.
Volatility
With this script, you also have the ability to monitor the amount of market volatility ! The combination of Bollinger Bands and FiboMa provides a clear view of the market volatility.
The decrease and compression of the FiboMa width is a sign of a decrease in volatility and vice versa.
Trend
I don't see the need for additional explanation, only whenever the price is higher than the middle band , the BB cloud is green , and whenever it is lower , is red .
The wider FiboMa means the stronger trend.
How to use
In the script settings you have the ability to enable or disable anything except.
---------------------------------------------
Similar scripts have been published before and we were inspired by them and tried to improve idea and code uniqe one.
I hope it will be useful .. Support us with your likes and comments .. We have anothers great script .. Just started.

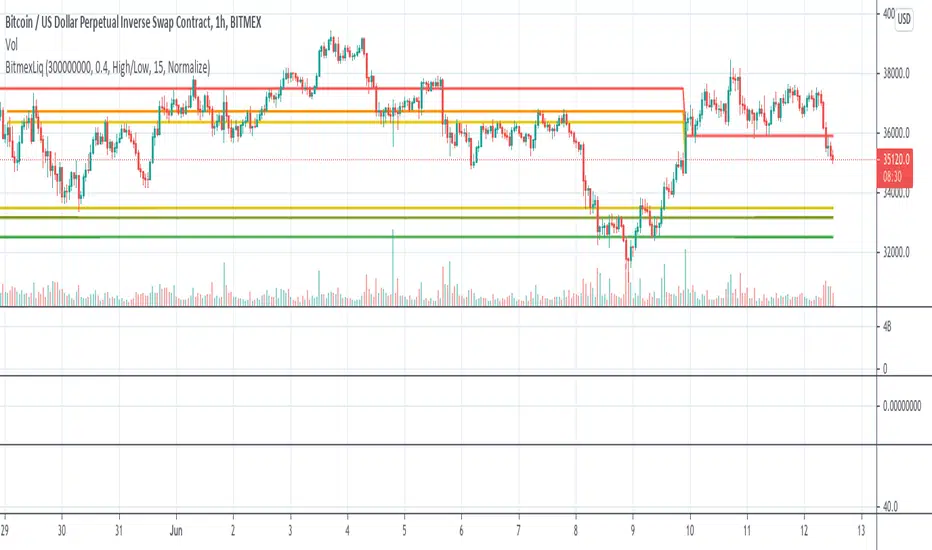
BitMEX Liquidation LevelsThis indicator plots BitMEX liquidation levels:
- 25x
- 50x
- 100x
The indicator works as following:
The underlying assumption (as with all liquidation calculations) obviously is that traders used fixed margin or go "all in" on their cross-margin account.
You then can configure a minimum trade volume and a minimum price change in percent for a candle to start computing liquidation levels from that candle
Additionally: configure the price base for the liqudation level: Candle high or low (default) works well, but you can also set "candle close" or "median high/low"
The indicator will then plot horizontal lines on the main chart showing price levels where many positions opened at the configured "start candle" will likely get liquidated.
It works for all BitMEX contracts and while it has been optimized for BitMEX, it will work on other exchanges with the same leverage levels (25x, 50x, 100x) and maintenance margin requirements too.
This indicator uses the Smart Volume indicator to compute the volume at the "start volume candle" setting where the liquidation level starts. This indicator can be found here: Smart Volume:
Price-Line Channel - A Friendly Support And Resistance IndicatorIntroduction
Lines are the most widely used figures in technical analysis, this is due to the linear trends that some securities posses (daily log SP500 for example), support and resistances are also responsible for the uses of lines, basically linear support and resistances are made with the assumption that the line connecting two local maximas or minimas will help the user detect a new local maxima or minima when the price will cross the line.
Technical indicators attempting to output lines have always been a concern in technical analysis, the mostly know certainly being the linear regression, however any linear models would fit in this category. In general those indicators always reevaluate their outputs values (repainting), others non repainting indicators returning lines are sometimes to impractical to set-up. This is what has encouraged me to make a simpler indicator based on the framework used in the recursive bands indicator that i published.
The proposed indicator aim to be extremely flexible and easy to use while returning linear support and resistances, an option that allow readjustment is also introduced, thus allowing for a "smarter" indicator.
The Indicator
The indicator return two extremities, the upper one aim to detect resistance points while the lower one aim to detect support points. The length setting control the steepness of the line, with higher values of length involving a lower slope, this make the indicator less reactive and interact with the price less often.
The name "price-line" comes from the fact that the channel is dependent on its own interaction with the price, therefore a breakout methodology can also be used, where price is up-trending when crossing with the upper extremity and down trending when crossing with the lower one.
Readjusted Option
The line steepness can be readjusted based on the market volatility, it make more sense for the line to be more steep when the market is more volatile, thus making it converge faster toward the price, this of course is done at the cost of some linearity. This is achieved by checking the "readjustment" option. The effects can be shown on BTCUSD, below the indicator without the readjusted option :
when the "readjustment" option is checked we have the following results :
The volatile down movement on BTCUSd make the upper extremity converge faster toward the price, this option can be great for volatile markets.
Conclusion
The recursive bands indicator prove to be an excellent framework that allow for the creation of lots of indicators, the proposed indicator is extremely efficient and provide an easy solution for returning linear support and resistances without much drawbacks, the readjusted option allow the indicator to adapt to the market volatility at the cost of linearity.
The performance of the indicator is relative to the motion of the price, however the indicator show signs of returning accurate support and resistances points. I hope the indicator find its use in the community.
Thanks for reading !
Note
Respect the house rules, always request permission before publishing open source code. This is an original work, requesting permission is the least you can do.

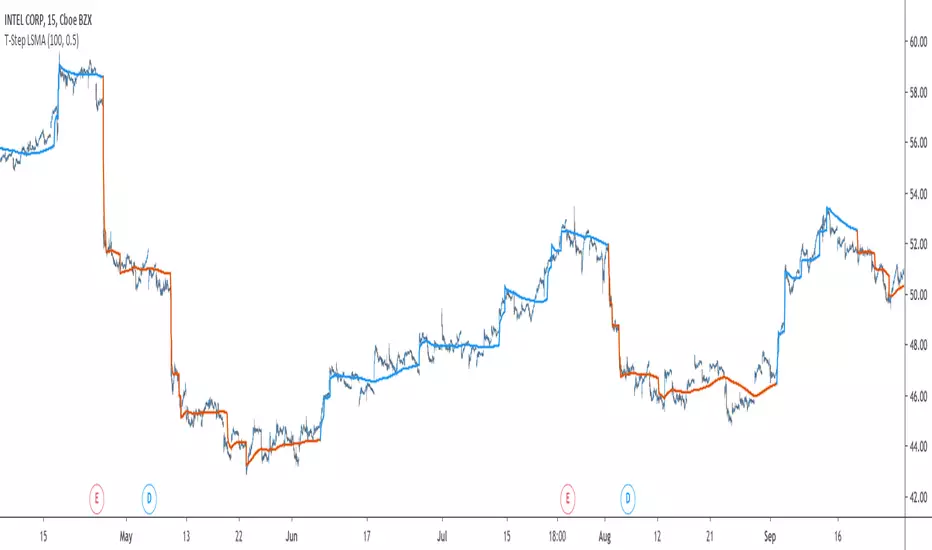
T-Step LSMAIntroduction
The trend step indicator family has produced much interest in the community, those indicators showed in certain cases robustness and reactivity. Their ease of use/interpretation is also a major advantage. Although those indicators have a relatively good fit with the input price, they can still be improved by introducing least-squares fitting on their calculations. This is why i propose a new indicator (T-Step LSMA) which aim to gather all the components of the trend-step indicator family (including the auto-line family).
The indicator will use as a threshold the mean absolute error between the input and the output (T-Channel) scaled with the efficiency ratio (Efficient Trend Step) while using least squares in order to provide a better fit with the price (Auto-Filter).
The Indicator
The interpretation of the indicator is easy, the indicator estimate an up-trending market when in blue, down-trending when in orange, the signal only depend on the trend-step part ( b in the code).
length control the period of the efficiency ratio as well as any components in the lsma calculation. The efficiency ratio allow to provide adaptivity, therefore the threshold will be lower when market is trending and higher when market is ranging.
Sc control the amount of feedback of the indicator, a value of 1 will use only the closing price as input, a value of 0.5 will use 50% of the closing price/indicator output as input, this allow to get smoother results.
It is possible to get the non-smooth version of the indicator by checking "No Smoothing".
This allow the indicator to filter more information.
Least Squares Smoothing - Benefits
One could ask why introducing least squares smoothing, there are several reasons to this choice, we have seen that trend-step indicators are boxy, they filter most of the variational information in the price, introducing least squares smoothing allow to gain back some of this variational information while providing a better fit with the price, the indicator is more noisy but also more practical in certain situations.
For example the indicator in its boxy form can't really be useful as input for other indicators, which is not the case with this version.
Relative strength index of period 14 using the proposed indicator as input.
Down-Sides
The indicator is dependent on the time frame used, larger time frames resulting in an indicator overfitting, sticking with lower time frames might be ideal. The indicator behavior might also change depending on the market in which it is applied.
Setting Up Alerts For The Indicator
Alerts conditions are already set, in order to create an alert based on the indicator follow these steps :
Go to the alert section (the alarm clock) -> create new alert -> select T-Step LSMA in condition -> Below select Up or Dn (Up for a up-trending alert and Dn for a down-trending alert)
In option select "once per bar close", change the message if you want a personalized message.
Conclusion
I don't think i'll post other indicators related to the trend-step framework for the time to comes, nonetheless the ones posted proven to have interesting results as well as many upsides. Although i don't think they would generate positive long-terms returns they could still be of use when using smarter volatility metrics as threshold. The proposed indicator conserve more information than its relatives and might find some use as input for other indicators.
Recommended Use Of The Code
Although i don't put restrictions on the code usage, i still recommend creative and pertinent changes to be made, graphical changes or any minor changes are not necessary, remember that such practice is disrespectful toward the author, you don't want to load up the tradingview servers for nothing right ?
Support Me
Making indicators sure is hard, it takes time and it can be quite lonely to, so i would love talking with you guys while making them :) There isn't better support than the one provided by your friends so drop me a message.
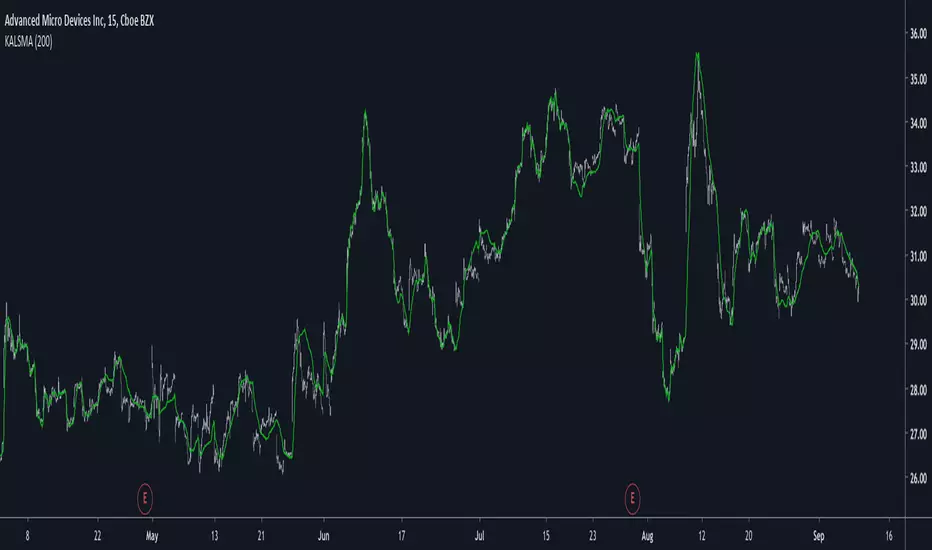
Kaufman Adaptive Least Squares Moving AverageIntroduction
It is possible to use a wide variety of filters for the estimation of a least squares moving average, one of the them being the Kaufman adaptive moving average (KAMA) which adapt to the market trend strength, by using KAMA in an lsma we therefore allow for an adaptive low lag filter which might provide a smarter way to remove noise while preserving reactivity.
The Indicator
The lsma aim to minimize the sum of the squared residuals, paired with KAMA we obtain a great adaptive solution for smoothing while conserving reactivity. Length control the period of the efficiency ratio used in KAMA, higher values of length allow for overall smoother results. The pre-filtering option allow for even smoother results by using KAMA as input instead of the raw price.
The proposed indicator without pre-filtering in green, a simple moving average in orange, and a lsma with all of them length = 200. The proposed filter allow for fast and precise crosses with the moving average while eliminating major whipsaws.
Same setup with the pre-filtering option, the result are overall smoother.
Conclusion
The provided code allow for the implementation of any filter instead of KAMA, try using your own filters. Thanks for reading :)
Kaufman Adaptive Moving AverageKaufman Adaptive Moving Average script.
This indicator was originally developed by Perry J. Kaufman (`Smarter Trading: Improving Performance in Changing Markets`, 1995).

Candle CountingI was talking with one of the biggest hedge fund traders in the world the other day. He goes to me, "Brian, why don't you come and work for us, since you're a better trader than anyone at our firm?" Well I said I would, but there's no one there with an iq as high as mine, so I'd have no one to talk to when I'm eatin my sammiches. Man I'm a savant mate, I'm a f***ing CANDLE COUNTER. I tell people all the time, know your market. And that's your tip of the day really, I mean nobody out there knows Yen better than me. I mean the other day I was 70,000 in the hole, but I didn't get out, I was balls deep making a cheese sammich on the George Forman. Now I mean you can try and do what I'm doing, but understand something, I am 100% smarter than you, and your machines. In the industry, they call me Mr. Yen, I touch the sun, and my d*ck, regularly.

Mitigation POI Master: OB + FVG ConfluenceOverview
The Mitigation POI Master is a Smart Money Concepts (SMC) tool designed to identify high-probability Points of Interest (POI). Unlike standard indicators that clutter your chart with every single block, this script focuses on the Confluence of two critical institutional footprints: Order Blocks (OB) and Fair Value Gaps (FVG).
Key Features
💎 Automated POI Detection: Finds overlapping areas between OBs and FVGs, marking them as premium Demand or Supply zones.
🧹 Smart Mitigation Engine: Real-time tracking of zone mitigation. Once a zone is touched or broken through (customizable), it is automatically removed to keep your chart clean.
⚡ Liquidity Sweep Filter: Includes an optional filter to only show Order Blocks that have successfully swept previous candle liquidity—a hallmark of true institutional intervention.
📊 Volume Confirmation: Integrated volume filter to ensure the zones are born from high-activity impulsive moves.
Settings
Timeframe Usage: This indicator performs best on higher timeframes (H1, H4, Daily) as institutional moves are more significant there. Using lower TFs (M1, M5) may generate too many low-quality zones.
Sensitivity (ATR Multiplier):
- For volatile assets/lower TFs (Crypto, Gold): Increase the Sensitivity input (e.g., 8-10) to filter out noise.
- For stable assets/higher TFs (Forex Majors, Stocks): Use the default Sensitivity (e.g., 4-6).
Mitigation Mode: The default "Breakthrough" mode is safer for high R:R setups. "Touch" mode offers earlier entries but higher risk.
How to Use
Identify the POI: Look for the ✦ DEMAND or ✦ SUPPLY labels.
Wait for the Return: Wait for price to retrace into the POI (Mitigation).
Execute: Use lower timeframe confirmation (like MSB or CHoCH) within these zones for high R:R entries.
Alerts: Set alerts to get notified the moment a new high-confluence POI is formed.

Multi-Layer Support Resistance & Auto TrendlineMulti-Layer Support Resistance & Auto Trendline (Multi-Timeframe Analysis)
Maximize your chart analysis with this advanced Support and Resistance (S/R) engine. This indicator automatically detects critical horizontal levels and diagonal trendlines across four different lookback periods, giving you a comprehensive view of market structure.
Why this indicator?
Universal Search Appeal: Ideal for traders looking for "Support and Resistance," "Auto Trendline," "Pivot Points," and "Gap Detection."
Multi-Layer Logic: Filters market noise by identifying levels from short-term scalping confirms to ultra-long-term historical walls.
Auto Trendlines: No more manual drawing. It automatically connects valid pivot highs and lows to visualize trend channels and breakouts.
Gap Analysis: Automatically marks "Windows" (Gaps) as high-priority zones, often acting as magnetic levels for future price action.
Cyberpunk Aesthetics: High visibility neon colors with customizable transparency to keep your chart professional yet intuitive.
How to trade: Focus on price action where multiple layers (e.g., a diagonal trendline and a long-term horizontal line) intersect. These "confluence zones" offer higher probability trade setups.
多層型サポート&レジスタンス+自動トレンドライン(マルチ分析エンジン)
「サポート・レジスタンス」「自動トレンドライン」「窓(ギャップ)検知」を一つに統合した、高度な相場分析ツールです。4つの期間(短期・中期・長期・超長期)から価格の壁と流れを自動的に抽出し、精度の高いトレード戦略をサポートします。
本インジケーターの強み:
高い検索親和性: 「サポレジ」「自動トレンドライン」「ピボット」「窓埋め」などの普遍的な要素を全て網羅しています。
4層の多角ロジック: ノイズの多い短期的な節目から、歴史的に意識される超長期の壁までを階層的に表示。
自動トレンドライン: 高値・安値の更新に合わせて斜めのラインを自動描画。トレンドの転換やブレイクアウトを瞬時に判断できます。
ギャップ(窓)検知: 窓が開いた重要価格帯を自動マーク。窓埋めや反発の根拠として利用できます。
洗練されたデザイン: 視認性の高いネオンカラーを採用しつつ、層ごとの透明度や太さを自由に調整可能。チャートの美しさと実用性を両立しました。
活用方法: 複数のライン(例:斜めのトレンドラインと長期水平線)が重なる「コンフルエンス(根拠の重なり)」に注目してください。そこが最も反発やブレイクが期待できる強力なエントリーポイントになります。

Gold Intelligence - Final Sniper v12 by Herman Sangivera(Papua)🚀 Gold Intelligence - Final Sniper v12 by Herman Sangivera ( Papua )
Overview
Gold Intelligence - Final Sniper v12 is a cutting-edge technical indicator specifically engineered for high-volatility instruments like XAU/USD (Gold). This indicator merges advanced Price Action candlestick recognition algorithms with institutional volume analysis and real-time market sentiment to deliver precision entry signals.
The primary goal of this tool is to filter out market "noise" and highlight only High Probability Setups that meet strict technical criteria.
🛡️ Key Features
Smart Pattern Recognition: Automatically identifies high-impact patterns: Pin Bars (psychological rejection) and Engulfing Candles (institutional dominance).
Probability Scoring: Every signal is assigned a percentage (%) score based on volume confirmation and price intensity. Signals only trigger when they exceed the minimum threshold (default 75%).
Real-Time Sentiment Dashboard: An exclusive on-chart panel that monitors the balance of Buy/Sell pressure instantly.
Dynamic Risk Management: Automatically projects Take Profit (TP) and Stop Loss (SL) boxes using Average True Range (ATR) calculations, ensuring your targets stay adaptive to current market volatility.
Institutional Volume Check: Validates entries by cross-referencing significant volume spikes (Smart Money footprints) to help you avoid market traps and fakeouts.
📖 How to Use (Trading Guide)
Identify the Signal: Wait for the "SNAPSHOT GOLD" label to appear on the chart.
🟢 Green Label: Buy Signal (Bullish).
🔴 Red Label: Sell Signal (Bearish).
Check Probability Score: It is highly recommended to only take signals with a score of >75%. A higher score indicates stronger technical confluence.
Execution & Targets:
Enter the trade at the close of the signal candle.
Target the Green transparent box for profit and use the Red box for risk management.
Dashboard Confirmation: Ensure the Sentiment percentage aligns with your trade direction (e.g., Sentiment > 60% Buy for Long positions).
⚙️ Input Parameters
Min Probability: The minimum accuracy threshold for a signal to be displayed.
TP & SL Multiplier: Customize your reward-to-risk ratio based on ATR multiples.
Alerts: Fully compatible with real-time notifications for Mobile, Email, or Webhooks.
⚠️ Disclaimer
This indicator is an analytical tool and does not guarantee profits. Gold trading involves significant risk. Always use proper money management and backtest on a demo account before trading live funds.

Multi-Timeframe Order BlocksDesigned to identify and visualize key supply and demand zones based on order block theory across multiple timeframes. The indicator detects order blocks by analyzing sequential candle patterns and price movement thresholds to highlight potential reversal or continuation zones where institutional buying or selling activity may have occurred.
The indicator works by scanning for clusters of consecutive bullish or bearish candles followed by a significant price move, which signals the formation of an order block. It then plots these zones as colored boxes on the chart—green for demand (bullish order blocks) and red for supply (bearish order blocks). The zones can be based on candle bodies or wicks, depending on user preference, and the indicator supports multi-timeframe analysis by allowing optional higher timeframe inputs.
How It Works:
Sequential Candle Detection: The indicator looks for a specified number of consecutive bullish or bearish candles (configurable by the user) to identify potential order blocks.
Price Movement Threshold: It checks if the price movement after the order block formation exceeds a user-defined percentage threshold, ensuring only significant zones are marked.
Zone Plotting: Once an order block is confirmed, the indicator draws a supply or demand zone as a box on the chart, using either candle bodies or wicks for zone boundaries.
Multi-Timeframe Support: Users can optionally specify higher timeframes to incorporate broader market context, enhancing the reliability of the zones.
Zone Management: The indicator limits the number of zones displayed to avoid clutter, automatically removing the oldest zones when the maximum count is exceeded.
How to Interpret:
Demand Zones (Green Boxes): These represent areas where buying pressure was strong enough to create a bullish order block. Price often finds support here, making these zones potential entry points for long trades or areas to watch for price bounces.
Supply Zones (Red Boxes): These indicate areas of strong selling pressure forming bearish order blocks. Price may face resistance in these zones, which can be used as potential exit points for longs or entry points for shorts.
Multi-Timeframe Confirmation: Zones identified on higher timeframes tend to be stronger and more reliable. Use the optional higher timeframe inputs to align your trades with broader market trends.
Use with Other Indicators: Combine order block zones with volume, momentum, or trend indicators to improve trade confirmation and risk management.
Zone Breaks: A decisive break and close beyond a supply or demand zone may signal a shift in market sentiment and potential trend continuation or reversal.
Disclaimer
This indicator is provided for educational and informational purposes only and does not constitute financial advice. Trading involves significant risk, and it is possible to lose more than your initial investment. Users should conduct their own research and consider their financial situation carefully before making any trading decisions. The developer and publisher of this indicator are not responsible for any trading losses or damages incurred. Always use proper risk management and consult with a licensed financial advisor if needed.

Volume Divergence Detector - COT EnhancedVolume Divergence Detector – COT Enhanced
This advanced indicator analyzes institutional vs retail money flow to uncover hidden market intent, focusing on Gold and Gold Futures.
Instead of relying on simple volume spikes, the script separates smart money (institutions, commercial hedgers, large speculators) from retail traders using a blend of:
Volume-based accumulation/distribution
Price momentum
RSI behavior
MACD divergence
Institutional-sized volume detection
Optional real CFTC Commitment of Traders (COT) data
The result is a dynamic money-flow model designed to expose who is truly controlling the market.
🔹 Institutional Flow Engine
Large-volume activity is tracked and converted into a smoothed institutional money line. Heavy volume is weighted more aggressively to highlight professional accumulation and distribution. When volume fades, flow naturally decays to avoid stale signals.
If enabled, weekly CFTC COT data is blended into the calculation (70% internal model, 30% real positioning), providing genuine futures-market confirmation for Gold.
Positive values indicate institutional buying.
Negative values indicate institutional selling.
🔹 Retail Flow Engine
Retail behavior is modeled using:
RSI momentum (retail follows trends)
MACD breakout behavior
Smaller volume spikes
Retail flow reacts faster and decays quicker, reflecting emotional trading and late entries. Extreme retail positioning often signals potential reversals.
🔹 Core Signals
The indicator automatically detects:
Institutional Takeover
When institutional flow crosses above retail.
Retail Takeover
When retail flow crosses above institutions (often a warning sign).
Bullish Setup
Institutions buying + retail selling.
Bearish Setup
Institutions selling + retail buying.
Extreme Divergence
Institutional and retail flows at opposite extremes. These zones often precede major reversals or powerful trend continuations.
Clear BUY / SELL labels appear directly on the chart, positioned dynamically using ATR to avoid candle overlap.
🔹 Visual Feedback
Background shading shows which side currently dominates
Extreme divergence adds special highlighting
Real-time labels display institutional and retail values
A built-in information table summarizes:
Institutional flow
Retail flow
Dominant side
Flow spread
Current signal
COT status
Everything updates live on the last bar.
🔹 Alerts Included
Custom alerts are provided for:
Institutional control
Retail control
Bullish setups
Bearish setups
Extreme divergence
Perfect for automation or hands-off monitoring.
⚠️ Important Notes
COT data works only on Gold Futures symbols.
Spot Gold uses volume-based estimation only.
Designed for directional bias and timing, not blind entries. Always confirm with structure and price action.
Created by xqweasdzxcv
A professional-grade money flow system built to follow smart capital instead of emotional traders.

PSAR Laboratory [DAFE]PSAR Laboratory : The Ultimate Adaptive Trailing Stop & Reversal Engine
23 Advanced Algorithms. Adaptive Acceleration. Smart Flip Logic. Parabolic SAR Reimagined.
█ PHILOSOPHY: WELCOME TO THE LABORATORY
The standard Parabolic SAR, created by the legendary J. Welles Wilder Jr., is a tool of beautiful simplicity. But in today's complex, algorithm-driven markets, its simplicity is its fatal flaw. Its fixed acceleration and rigid flip logic cause it to fail precisely when you need it most: it whipsaws in choppy conditions and gives back too much profit in strong trends.
The PSAR Laboratory was not created to be just another PSAR. It was engineered to be the definitive evolution of Wilder's original concept. This is not an indicator; it is a powerful, interactive research environment. It is a sandbox where you, the trader, can move beyond the static "one-size-fits-all" approach and forge a PSAR that is perfectly adapted to your specific market, timeframe, and trading style.
We have deconstructed the very DNA of the Parabolic SAR and rebuilt it from the ground up, infusing it with modern quantitative techniques. The result is an institutional-grade suite of 23 distinct, mathematically diverse algorithms that dynamically control every aspect of the PSAR's behavior.
█ WHAT MAKES THIS A "LABORATORY"? THE CORE INNOVATIONS
This tool stands in a class of its own. It is a collection of what could be 23 separate indicators, all seamlessly integrated into one powerful engine.
The 23 Algorithm Engine: This is the heart of the Laboratory. Instead of one rigid formula, you have a library of 23 unique mathematical engines at your command. These algorithms are not simple tweaks; they are complete re-imaginings of how the PSAR should behave, based on concepts from information theory, digital signal processing, fractal geometry, and institutional analysis.
Truly Adaptive Acceleration (AF): The standard PSAR's "gas pedal" (the AF) is dumb; it accelerates at a fixed rate. Our algorithms make it intelligent. The AF can now speed up in clean, trending environments to lock in profits, and automatically slow down in choppy, chaotic conditions to avoid whipsaws.
Advanced Flip Confirmation Logic: Say goodbye to noise-driven flips. You are no longer at the mercy of a single wick touching the SAR. The Laboratory provides multiple layers of flip confirmation, including requiring a bar close beyond the SAR, a volume spike to validate the reversal, or even a multi-bar confirmation .
Comprehensive Noise Filtering Core: In a revolutionary step, you can apply one of over 30 advanced signal processing filters directly to the SAR output itself. From ultra-low-lag filters like the Hull MA and DAFE Spectral Laguerre to adaptive filters like KAMA and FRAMA , you can surgically remove noise while preserving the responsiveness of the core signal.
Integrated Performance Engine: How do you know which of the 23 algorithms is best for your market? You test it. The built-in Performance Dashboard is a comprehensive backtesting and analytics engine that tracks every trade, providing real-time data on Win Rate, Profit Factor, Max Drawdown, and more. It allows you to scientifically validate your chosen configuration.
█ A GUIDED TOUR OF THE ALGORITHMS: 23 PATHS TO AN EDGE
b]These 23 algorithms are not simple settings; they are distinct mathematical philosophies for how a Parabolic SAR should adapt to the market. They are grouped into three primary categories: those that adapt the Acceleration Factor (AF) , those that enhance the Extreme Point (EP) detection, and those that redefine the Flip Logic .
CATEGORY A: ACCELERATION FACTOR (AF) ADAPTATION
These algorithms dynamically change the "gas pedal" of the PSAR.
1. Volatility-Scaled AF
Core Concept: Treats volatility as market friction. The PSAR should be more forgiving in high-volatility environments.
How It Works: It calculates a Volatility Ratio by comparing the short-term ATR to the long-term ATR. If current volatility is high (ratio > 1), it reduces the AF Step. If volatility is low (ratio < 1), it increases the AF Step to trail tighter.
Ideal Use Case: The best all-rounder. Excellent for any market, especially those with clear shifts between high and low volatility regimes (like indices and crypto).
2. Efficiency Ratio (ER) AF
Core Concept: The PSAR should accelerate aggressively in clean, efficient trends and slow down dramatically in choppy, inefficient markets.
How It Works: It uses Kaufman's Efficiency Ratio (ER), which measures the net directional movement versus the total price movement. A high ER (near 1.0) signifies a pure trend, triggering a high AF multiplier. A low ER (near 0.0) signifies chop, triggering a low AF multiplier.
Ideal Use Case: Markets that alternate between strong trends and sideways chop. It is exceptionally good at surviving ranging periods.
3. Shannon Entropy AF
Core Concept: Uses Information Theory to measure market disorder. The PSAR should be conservative in chaos and aggressive in order.
How It Works: It calculates the Shannon Entropy of recent price changes. High entropy means the market is unpredictable ("chaotic"), causing the AF to slow down. Low entropy means the market is organized and trending, causing the AF to speed up.
Ideal Use Case: Advanced traders looking for a mathematically pure way to distinguish between a tradable trend and random noise.
4. Fractal Dimension (FD) AF
Core Concept: Measures the "jaggedness" or complexity of the price path. A smooth path is a trend; a jagged, space-filling path is chop.
How It Works: It calculates the Fractal Dimension of the price series. An FD near 1.0 is a smooth line (high AF). An FD near 1.5 is a random walk (low AF).
Ideal Use Case: Visually identifying the moment a smooth trend begins to break down into chaotic, unpredictable movement.
5. ADX-Gated AF
Core Concept: Uses the classic ADX indicator to confirm the presence of a trend before allowing the PSAR to accelerate.
How It Works: If the ADX value is above a "Strong" threshold (e.g., 25), the AF accelerates normally. If the ADX is below a "Weak" threshold (e.g., 15), the AF is "frozen" and will not increase, preventing the SAR from tightening up in a non-trending market.
Ideal Use Case: For classic trend-following purists who trust the ADX as their primary regime filter.
6. Kalman AF Estimator
Core Concept: A sophisticated signal processing algorithm that predicts the "true" optimal AF by filtering out price "noise."
How It Works: It treats the PSAR's AF as a state to be estimated. It makes a prediction, then corrects it based on how far the actual price deviates. It's like a GPS constantly refining its position. The "Process Noise" input controls how fast it thinks the AF can change, while "Measurement Noise" controls how much it trusts the price data.
Ideal Use Case: Smooth, high-inertia markets like commodities or major forex pairs. It creates an incredibly smooth and responsive AF.
7. Volume-Momentum AF
Core Concept: A trend's acceleration is only valid if confirmed by both volume and price momentum.
How It Works: The AF will only increase if a new Extreme Point is made on above-average volume AND the Rate of Change (ROC) of the price is aligned with the trend's direction.
Ideal Use Case: Any market with reliable volume data (stocks, futures, crypto). It's excellent for filtering out low-conviction moves.
8. Garman-Klass (GK) AF
Core Concept: Uses a more advanced, statistically efficient measure of volatility (Garman-Klass, which uses OHLC data) to adapt the AF.
How It Works: It modulates the AF based on whether the current GK volatility is higher or lower than its historical average. Unlike the standard Volatility-Scaled algo, it tends to slow down more in high volatility and speed up less in low volatility, making it more conservative.
Ideal Use Case: Traders who want a volatility-adaptive model that is more focused on risk reduction during volatile periods.
9. RSI-Modulated AF
Core Concept: The RSI can identify points of potential trend exhaustion or strong momentum.
How It Works: If a trend is bullish but the RSI enters the "Overbought" zone, the AF slows down, anticipating a pullback. Conversely, if the RSI is in the strong momentum mid-range (40-60), the AF is boosted to trail more aggressively.
Ideal Use Case: Mean-reversion traders or those who want to automatically loosen their trail stop near potential exhaustion points.
10. Bollinger Squeeze AF
Core Concept: A Bollinger Band Squeeze signals a period of volatility compression, often preceding an explosive breakout.
How It Works: When the algorithm detects that the Bollinger Band Width is in a "Squeeze" (below a certain historical percentile), it boosts the AF in anticipation of a fast move, allowing the PSAR to catch the breakout quickly.
Ideal Use Case: Breakout traders. This algorithm primes the PSAR to be maximally responsive right at the moment a breakout is most likely.
11. Keltner Adaptive AF
Core Concept: Keltner Channels provide a robust measure of a trend's "normal" volatility channel.
How It Works: When price is trading strongly outside the Keltner Channel, it's considered a powerful trend, and the AF is boosted. When price falls back inside the channel, it's considered a consolidation or pullback, and the AF is slowed down.
Ideal Use Case: Trend followers who use channel breakouts as their primary confirmation.
12. Choppiness-Gated AF
Core Concept: Uses the Choppiness Index to quantify whether the market is trending or consolidating.
How It Works: If the Choppiness Index is below the "Trend" threshold (e.g., 38.2), the AF is boosted. If it's above the "Range" threshold (e.g., 61.8), the AF is significantly reduced.
Ideal Use Case: A more responsive alternative to the ADX-Gated algorithm for distinguishing between trending and ranging markets.
13. VIDYA-Style AF
Core Concept: Uses a Chande Momentum Oscillator (CMO) to create a variable-speed acceleration factor.
How It Works: The absolute value of the CMO is used to create a dynamic smoothing constant. Strong momentum (high absolute CMO) results in a faster, more responsive AF. Weak momentum results in a slower, smoother AF.
Ideal Use Case: Momentum traders who want their trailing stop's speed directly tied to the momentum of the price itself.
14. Hilbert Cycle AF
Core Concept: Uses Ehlers' Hilbert Transform to extract the dominant cycle period of the market and synchronizes the PSAR with it.
How It Works: It dynamically adjusts the AF based on the detected cycle period (shorter cycles = faster AF) and can also modulate it based on the current phase within that cycle (e.g., accelerate faster near cycle tops/bottoms).
Ideal Use Case: Markets with clear cyclical behavior, like commodities and some forex pairs.
CATEGORY B: EXTREME POINT (EP) ENHANCEMENT
These algorithms make the detection of new highs/lows more intelligent.
15. Volume-Weighted EP
Core Concept: A new high or low is more significant if it occurs on high volume.
How It Works: It can be configured to only accept a new EP if the volume on that bar is above average. It can also "weight" the EP by volume, pushing it further out on high-volume bars.
Ideal Use Case: Filtering out weak, low-conviction price probes in markets with reliable volume.
16. Wavelet Filtered EP
Core Concept: Uses wavelet decomposition (a signal processing technique) to separate the underlying trend from high-frequency noise.
How It Works: It calculates a smoothed, wavelet-filtered version of the price. A new EP is only registered if the actual high/low significantly exceeds this smoothed baseline, effectively ignoring minor noise spikes.
Ideal Use Case: Noisy markets where small, insignificant wicks can cause the AF to accelerate prematurely.
17. ATR-Validated EP
Core Concept: A new EP should represent a meaningful move, not just a one-tick poke.
How It Works: It requires a new high/low to exceed the previous EP by a minimum amount, defined as a multiple of the current ATR. This ensures only volatility-significant advances are counted.
Ideal Use Case: A simple, robust way to filter out "noise" EPs and slow down the AF's acceleration in choppy conditions.
18. Statistical EP Filter
Core Concept: A new EP is only valid if the price change that created it is statistically significant.
How It Works: It calculates the Z-Score of the bar's price change relative to recent history. A new EP is only accepted if its Z-Score exceeds a certain threshold (e.g., 1.5 sigma), meaning it was an unusually strong move.
Ideal Use Case: For quantitative traders who want to ensure their trailing stop only tightens in response to statistically meaningful price action.
CATEGORY C: FLIP LOGIC & CONFIRMATION
These algorithms change the very rules of when and why the PSAR reverses.
19. Dual-PSAR Gate
Core Concept: Uses two PSARs—one fast and one slow—to confirm a reversal.
How It Works: A flip signal for the main PSAR is only considered valid if both the fast (sensitive) PSAR and the slow (structural) PSAR have flipped. This acts as a powerful trend filter.
Ideal Use Case: An excellent method for reducing whipsaws. It forces the PSAR to wait for both short-term and longer-term momentum to align before signaling a reversal.
20. MTF Coherence PSAR
Core Concept: Do not flip against the higher timeframe macro trend.
How It Works: It pulls PSAR data from two higher timeframes. A flip is only allowed if the new direction does not contradict the trend on at least one (or both) of those higher timeframes. It also boosts the AF when all timeframes are aligned.
Ideal Use Case: The ultimate tool for multi-timeframe traders who want to ensure their entries and exits are in sync with the bigger picture.
21. Momentum-Gated Flip
Core Concept: A reversal is only valid if it is supported by a significant surge of momentum.
How It Works: A price cross of the SAR is not enough. The script also requires the Rate of Change (ROC) to exceed a certain threshold for a set number of bars, confirming that there is real force behind the reversal.
Ideal Use Case: Filtering out weak, drifting reversals and only taking signals that are initiated with explosive power.
22. Close-Only PSAR
Core Concept: Wicks are noise; the bar's close is the final decision.
How It Works: This algorithm modifies the flip logic to ignore wicks. A flip only occurs if one or more bars close beyond the SAR line.
Ideal Use Case: One of the most effective and simple ways to reduce false signals from volatile wicks. A fantastic default choice for any trader.
23. Ultimate PSAR Consensus
Core Concept: The highest conviction signal comes from the agreement of multiple, diverse mathematical models.
How It Works: This is the capstone algorithm. It runs a "vote" between a selection of the top-performing algorithms (e.g., Volatility-Scaled, Efficiency Ratio, Dual-PSAR). A flip is only signaled if a majority consensus is reached. It can even weight the votes based on each algorithm's recent performance.
Ideal Use Case: For traders who want the absolute highest level of confirmation and are willing to accept fewer, but more robust, signals.
█ PART II: THE NOISE FILTERING CORE - The Shield
This is a revolutionary feature that allows you to apply a second layer of signal processing directly to the SAR line itself, surgically removing noise before the flip logic is even considered.
FILTER CATEGORIES
Basic Filters (SMA, EMA, WMA, RMA): The classic moving averages. They provide basic smoothing but introduce significant lag. Best used for educational purposes.
Low-Lag Filters (DEMA, TEMA, Hull MA, ZLEMA): A family of filters designed to reduce the lag inherent in basic moving averages. The Hull MA is a standout, offering a superb balance of smoothness and responsiveness.
Adaptive Filters (KAMA, VIDYA, FRAMA): These are "smart" filters. They automatically adjust their smoothing level based on market conditions. They will be very smooth in choppy markets and become highly responsive in trending markets.
Advanced DSP & DAFE Filters: This is the pinnacle of signal processing.
Ehlers Filters (SuperSmoother, 2-Pole, 3-Pole): Based on the work of John Ehlers, these use digital signal processing techniques to remove high-frequency noise with minimal lag.
Gaussian & ALMA: These use a bell-curve weighting, giving the most importance to recent data in a smooth, non-linear fashion.
DAFE Spectral Laguerre: A proprietary, non-linear filter that uses a feedback loop and adapts its "gamma" based on volatility, providing exceptional tracking in all market conditions.
How to Choose a Filter
Start with "None": First, find an algorithm you like with no filtering to understand its raw behavior.
Introduce Low Lag: If you are getting too many whipsaws from noise, apply a short-length Hull MA (e.g., 5-8). This is often the best solution.
Go Adaptive: If your market has very distinct trend/chop regimes, try an Adaptive KAMA .
Maximum Purity: For the smoothest possible output with excellent responsiveness, use the DAFE Spectral Laguerre or Ehlers SuperSmoother .
█ THE VISUAL EXPERIENCE: DATA AS ART
The PSAR Laboratory is not just functional; it is beautiful. The visualization engine is designed to provide you with an intuitive, at-a-glance understanding of the market's state.
Algorithm-Specific Theming: Each of the 23 algorithms comes with its own unique, professionally designed color palette. This not only provides visual variety but allows you to instantly recognize which engine is active.
Dynamic Glow Effects: For many algorithms, the PSAR dots will emit a soft "glow." The brightness and color of this glow are not random; they are tied to a key metric of the active algorithm (e.g., trend strength, volatility, consensus), providing a subtle, visual cue about the health of the trend.
Adaptive Volatility Bands: Certain algorithms will display dynamic bands around the PSAR. These are not standard deviation bands; their width is controlled by the specific logic of the active algorithm, showing you a visual representation of the market's expected range or energy level.
Secondary Reference Lines: For algorithms like the Dual-PSAR or MTF Coherence, a secondary line will be plotted on the chart, giving you a clear visual of the underlying data (e.g., the slow PSAR, the HTF trend) that is driving the decision-making process.
█ THE MASTER DASHBOARD: YOUR MISSION CONTROL
The comprehensive dashboard is your unified command center for analysis and performance tracking.
Engine Status: See the currently selected Algorithm, the active Noise Filter, the Trend direction, and a real-time progress bar of the current Acceleration Factor (AF).
Algorithm-Specific Metrics: This is the most powerful section. It displays the key real-time data from the currently active algorithm. If you're using "Shannon Entropy," you'll see the Entropy score. If you're using "ADX-Gated," you'll see the ADX value. This gives you a direct, quantitative look under the hood.
Performance Readout: When enabled, this section provides a full breakdown of your backtesting results, including Win Rate, Profit Factor, Net P&L, Max Drawdown, and your current trade status.
█ DEVELOPMENT PHILOSOPHY
The PSAR Laboratory was born from a deep respect for Wilder's original work and a relentless desire to push it into the 21st century. We believe that in modern markets, static tools are obsolete. The future of trading lies in adaptation. This indicator is for the serious trader, the tinkerer, the scientist—the individual who is not content with a black box, but who seeks to understand, test, and refine their edge with surgical precision. It is a tool for forging, not just following.
The PSAR Laboratory is designed to be the ultimate tool for that evolution, allowing you to discover and codify the rules that truly fit you.
█ DISCLAIMER AND BEST PRACTICES
THIS IS A TOOL, NOT A STRATEGY: This indicator provides a sophisticated trailing stop and reversal signal. It must be integrated into a complete trading plan that includes risk management, position sizing, and your own contextual analysis.
TEST, DON'T GUESS: The power of this tool is its adaptability. Use the Performance Dashboard to rigorously test different algorithms and settings on your chosen asset and timeframe. Find what works, and build your strategy around that data.
START SIMPLE: Begin with the "Volatility-Scaled AF" algorithm, as it is a powerful and intuitive all-rounder. Once you are comfortable, begin experimenting with other engines.
RISK MANAGEMENT IS PARAMOUNT: All trading involves substantial risk. The backtesting results are hypothetical and do not account for slippage or psychological factors. Never risk more capital than you are prepared to lose.
"I don't think traders can follow rules for very long unless they reflect their own trading style. Eventually, a breaking point is reached and the trader has to quit or change, or find a new set of rules he can follow. This seems to be part of the process of evolution and growth of a trader."
— Ed Seykota, Market Wizard
Taking you to school. - Dskyz, Trade with Volume. Trade with Density. Trade with DAFE
