RF True Structure Engine PROD. V1RF True Structure Engine V1 is a fractal–based market structure indicator that identifies the current active swing leg and bias in real time. It automatically tracks Strong/Weak Highs and Lows, marks MSS (Market Structure Shifts) and BOS (Breaks of Structure) using candle-close confirmation, and plots clean right-side structure levels with an optional midline for quick leg context.
It also includes an optional HTF structure overlay and a compact multi-timeframe bias table (up to 5 timeframes) so you can instantly see whether higher/lower timeframes are bullish or bearish.
Built for clarity and consistency — structure first, noise filtered out.
Search in scripts for "smart"

Volume Intelligence LITE [Abusuhil]📊 Volume Intelligence LITE - Professional Scalping Tool
🎯 English Description
Professional Volume Analysis Indicator for Smart Traders
Volume Intelligence LITE is a comprehensive, real-time volume analysis tool designed specifically for scalpers and day traders who need instant volume insights. This professional-grade indicator combines multiple volume metrics, pressure analysis, and intelligent signal generation in a clean, fully customizable interface.
✨ Key Features
📊 Advanced Volume Analysis
Real-time volume monitoring with moving average comparison
Dynamic volume ratio calculation (Current vs Average)
Instant percentage change tracking
Multi-level spike detection system (Weak, Medium, Strong, Extreme)
Customizable spike thresholds for different market conditions
💹 Buy/Sell Pressure System
Real-time buy vs sell pressure percentage calculation
Market dominance indicator (Buyers/Sellers/Neutral)
Weighted Delta analysis for precise pressure measurement
Multi-timeframe pressure lookback (up to 20 bars)
Historical pressure pattern recognition
📈 Integrated Technical Indicators
VWMA (Volume Weighted Moving Average) - Identifies price position relative to volume-weighted levels
OBV (On Balance Volume) - Trend detection with built-in divergence alerts (Bullish/Bearish)
MFI (Money Flow Index) - Smart money flow direction and strength analysis
🤖 Intelligence & Scoring System
Entry Power Score - Combines volume ratio with price movement magnitude
Trend & Volume Alignment - Identifies strong trending markets with volume support
Comprehensive Volume Score - Multi-factor analysis incorporating all metrics
Confidence Level - Percentage-based signal strength indicator (0-100%)
Final Signal - Clear Bullish/Bearish/Neutral market assessment
🎨 Full Customization Options
Bilingual Interface - Complete English & Arabic support
Modular Display - Show/Hide any section independently (8 sections)
Flexible Positioning - 9 table position options (corners, sides, center)
Size Control - Three size options (Tiny, Small, Normal)
Color Themes - Customizable background and text colors
No Chart Clutter - Clean overlay design without background interference
🔧 Detailed Settings
Volume Configuration
Volume MA Length: 5-50 bars (default: 20)
Weak Spike Threshold: 1.5x average
Medium Spike Threshold: 2.0x average
Strong Spike Threshold: 2.5x average
Extreme Spike Threshold: 3.0x average
Technical Indicators
VWMA Length: 5-100 bars (default: 20)
OBV Smoothing: 5-50 bars (default: 14)
MFI Length: 5-50 bars (default: 14)
Pressure Analysis
Lookback Period: 5-20 bars (default: 10)
Automatic pressure calculation for last N bars
Display Controls
Show/Hide Volume Section
Show/Hide Spike Detection Section
Show/Hide Pressure Analysis Section
Show/Hide VWMA Section
Show/Hide OBV Section
Show/Hide MFI Section
Show/Hide Intelligence Section
Show/Hide Final Signal
📱 Ideal For
✅ Scalpers - Quick volume confirmations for rapid trading decisions
✅ Day Traders - Intraday volume pattern analysis and trend confirmation
✅ Swing Traders - Volume-based entry/exit point identification
✅ Smart Money Followers - Institutional volume detection and tracking
✅ Breakout Traders - Volume spike confirmation for breakout validation
✅ All Timeframes - Works on 1m to Daily charts
🚀 How to Use
Setup
Add indicator to your chart
Select your preferred language (English/Arabic)
Customize table position and size
Toggle sections based on your trading style
Adjust volume thresholds for your market
Trading Workflow
Monitor Volume Ratio - Look for spikes above 1.5x
Check Pressure - Confirm buy/sell dominance
Verify Technical Alignment - VWMA, OBV, MFI confirmation
Review Intelligence Score - Volume Score and Confidence Level
Execute on Final Signal - 🟢 Bullish or 🔴 Bearish confirmation
📊 Signal Interpretation Guide
Volume Score System
+30 to +100 🟢 Strong Bullish Volume (High buy pressure, strong uptrend)
-30 to +30 ⚪ Neutral Zone (Wait for confirmation, range-bound)
-100 to -30 🔴 Strong Bearish Volume (High sell pressure, strong downtrend)
Confidence Levels
60%+ 🔥 High Confidence (Strong signal, optimal entry conditions)
30-60% ⚡ Medium Confidence (Moderate signal, use additional confirmation)
Below 30% ⚪ Low Confidence (Weak signal, wait for better setup)
Spike Detection
🔥 Extreme Spike (3.0x+) - Major institutional activity, potential reversal
💪 Strong Spike (2.5-3.0x) - Significant volume, trend acceleration
⚡ Medium Spike (2.0-2.5x) - Above average activity, watch closely
⚠ Weak Spike (1.5-2.0x) - Mild increase, early signal
💡 Trading Tips & Best Practices
For Best Results:
Use on liquid markets (major forex pairs, popular stocks, top cryptocurrencies)
Combine with price action analysis for maximum accuracy
Higher confidence levels (>60%) indicate stronger, more reliable signals
Watch for pressure shifts from sellers to buyers (or vice versa) for reversal signals
Extreme volume spikes often precede major price movements
OBV divergences are powerful reversal indicators
Risk Management:
Never rely on volume alone - always use proper stop losses
Higher confidence doesn't mean guaranteed profit
Volume analysis works best in trending markets
Adjust thresholds based on asset volatility
🌐 Language Support
Full Bilingual Interface
Complete English interface
كامل باللغة العربية (Complete Arabic interface)
Easy toggle in settings
All labels, metrics, and signals translated
⚠️ Important Disclaimer
This indicator is provided for educational and informational purposes only. It is not financial advice. Trading involves substantial risk of loss. Always:
Practice proper risk management
Never risk more than you can afford to lose
Test on demo accounts before live trading
Understand that past performance doesn't guarantee future results
🔄 Updates & Support
Regular updates and improvements. For questions, suggestions, or support, please comment below!
🎯 الوصف بالعربية
مؤشر تحليل الفوليوم الاحترافي للمتداولين الأذكياء
مؤشر Volume Intelligence LITE هو أداة شاملة لتحليل الفوليوم في الوقت الفعلي، مصمم خصيصاً للمضاربين والمتداولين اليوميين الذين يحتاجون إلى رؤى فورية للفوليوم. هذا المؤشر الاحترافي يجمع بين مقاييس الفوليوم المتعددة، تحليل الضغط، وتوليد الإشارات الذكية في واجهة نظيفة وقابلة للتخصيص بالكامل.
✨ المميزات الرئيسية
📊 تحليل متقدم للفوليوم
مراقبة الفوليوم في الوقت الفعلي مع مقارنة المتوسط المتحرك
حساب نسبة الفوليوم الديناميكية (الحالي مقابل المتوسط)
تتبع النسبة المئوية للتغيير الفوري
نظام كشف الانفجارات متعدد المستويات (ضعيف، متوسط، قوي، شديد)
عتبات انفجار قابلة للتخصيص لظروف السوق المختلفة
💹 نظام ضغط الشراء والبيع
حساب نسبة ضغط الشراء مقابل البيع في الوقت الفعلي
مؤشر سيطرة السوق (المشترون/البائعون/محايد)
تحليل الدلتا المرجح لقياس الضغط الدقيق
مراجعة ضغط متعدد الأطر الزمنية (حتى 20 شمعة)
التعرف على أنماط الضغط التاريخية
📈 مؤشرات تقنية متكاملة
VWMA (المتوسط المتحرك المرجح بالحجم) - يحدد موقع السعر بالنسبة للمستويات المرجحة بالحجم
OBV (حجم التوازن) - كشف الاتجاه مع تنبيهات التباعد المدمجة (صعودي/هبوطي)
MFI (مؤشر تدفق الأموال) - تحليل اتجاه وقوة تدفق الأموال الذكية
🤖 نظام الذكاء والتقييم
درجة قوة الدخول - يجمع بين نسبة الفوليوم وحجم حركة السعر
توافق الاتجاه والفوليوم - يحدد الأسواق ذات الاتجاه القوي مع دعم الفوليوم
درجة الفوليوم الشاملة - تحليل متعدد العوامل يتضمن جميع المقاييس
مستوى الثقة - مؤشر قوة الإشارة بالنسبة المئوية (0-100٪)
الإشارة النهائية - تقييم واضح للسوق (صعودي/هبوطي/محايد)
🎨 خيارات تخصيص كاملة
واجهة ثنائية اللغة - دعم كامل للإنجليزية والعربية
عرض معياري - إظهار/إخفاء أي قسم بشكل مستقل (8 أقسام)
موضع مرن - 9 خيارات لموقع الجدول (الزوايا، الجوانب، الوسط)
التحكم في الحجم - ثلاثة خيارات للحجم (صغير جداً، صغير، عادي)
سمات الألوان - خلفية ونصوص قابلة للتخصيص
لا فوضى في الرسم البياني - تصميم نظيف بدون تداخل في الخلفية
🔧 إعدادات تفصيلية
تكوين الفوليوم
طول المتوسط المتحرك للفوليوم: 5-50 شمعة (افتراضي: 20)
عتبة الانفجار الضعيف: 1.5 ضعف المتوسط
عتبة الانفجار المتوسط: 2.0 ضعف المتوسط
عتبة الانفجار القوي: 2.5 ضعف المتوسط
عتبة الانفجار الشديد: 3.0 ضعف المتوسط
المؤشرات التقنية
طول VWMA: 5-100 شمعة (افتراضي: 20)
تنعيم OBV: 5-50 شمعة (افتراضي: 14)
طول MFI: 5-50 شمعة (افتراضي: 14)
تحليل الضغط
فترة المراجعة: 5-20 شمعة (افتراضي: 10)
حساب تلقائي للضغط لآخر N شمعة
عناصر التحكم في العرض
إظهار/إخفاء قسم الفوليوم
إظهار/إخفاء قسم كشف الانفجار
إظهار/إخفاء قسم تحليل الضغط
إظهار/إخفاء قسم VWMA
إظهار/إخفاء قسم OBV
إظهار/إخفاء قسم MFI
إظهار/إخفاء قسم الذكاء
إظهار/إخفاء الإشارة النهائية
📱 مثالي لـ
✅ المضاربون - تأكيدات فوليوم سريعة لقرارات التداول السريع
✅ المتداولون اليوميون - تحليل أنماط الفوليوم اليومية وتأكيد الاتجاه
✅ المتداولون المتأرجحون - تحديد نقاط الدخول/الخروج المبنية على الفوليوم
✅ متتبعو الأموال الذكية - كشف وتتبع الفوليوم المؤسسي
✅ متداولو الاختراق - تأكيد انفجارات الفوليوم للتحقق من الاختراق
✅ جميع الأطر الزمنية - يعمل من 1 دقيقة إلى الرسوم البيانية اليومية
🚀 كيفية الاستخدام
الإعداد
أضف المؤشر إلى الرسم البياني الخاص بك
اختر لغتك المفضلة (إنجليزي/عربي)
خصص موقع وحجم الجدول
قم بتبديل الأقسام بناءً على أسلوب التداول الخاص بك
اضبط عتبات الفوليوم لسوقك
سير عمل التداول
راقب نسبة الفوليوم - ابحث عن الانفجارات فوق 1.5 ضعف
تحقق من الضغط - أكد سيطرة الشراء/البيع
تحقق من التوافق التقني - تأكيد VWMA، OBV، MFI
راجع درجة الذكاء - درجة الفوليوم ومستوى الثقة
نفذ على الإشارة النهائية - تأكيد 🟢 صعودي أو 🔴 هبوطي
📊 دليل تفسير الإشارات
نظام درجة الفوليوم
+30 إلى +100 🟢 فوليوم صعودي قوي (ضغط شراء عالي، اتجاه صاعد قوي)
-30 إلى +30 ⚪ منطقة محايدة (انتظر التأكيد، محدود النطاق)
-100 إلى -30 🔴 فوليوم هبوطي قوي (ضغط بيع عالي، اتجاه هابط قوي)
مستويات الثقة
60٪+ 🔥 ثقة عالية (إشارة قوية، ظروف دخول مثالية)
30-60٪ ⚡ ثقة متوسطة (إشارة معتدلة، استخدم تأكيداً إضافياً)
أقل من 30٪ ⚪ ثقة منخفضة (إشارة ضعيفة، انتظر إعداداً أفضل)
كشف الانفجار
🔥 انفجار شديد (3.0 ضعف +) - نشاط مؤسسي كبير، انعكاس محتمل
💪 انفجار قوي (2.5-3.0 ضعف) - فوليوم كبير، تسارع الاتجاه
⚡ انفجار متوسط (2.0-2.5 ضعف) - نشاط فوق المتوسط، راقب عن كثب
⚠ انفجار ضعيف (1.5-2.0 ضعف) - زيادة خفيفة، إشارة مبكرة
💡 نصائح التداول وأفضل الممارسات
للحصول على أفضل النتائج:
استخدمه في الأسواق السائلة (أزواج الفوركس الرئيسية، الأسهم الشعبية، العملات المشفرة الأعلى)
ادمجه مع تحليل حركة السعر لأقصى دقة
مستويات الثقة الأعلى (> 60٪) تشير إلى إشارات أقوى وأكثر موثوقية
راقب تحولات الضغط من البائعين إلى المشترين (أو العكس) لإشارات الانعكاس
انفجارات الفوليوم الشديدة غالباً ما تسبق حركات السعر الكبيرة
تباعدات OBV هي مؤشرات انعكاس قوية
إدارة المخاطر:
لا تعتمد على الفوليوم وحده أبداً - استخدم دائماً وقف الخسائر المناسبة
الثقة الأعلى لا تعني ربحاً مضموناً
تحليل الفوليوم يعمل بشكل أفضل في الأسواق ذات الاتجاه
اضبط العتبات بناءً على تقلب الأصل
🌐 دعم اللغات
واجهة ثنائية اللغة كاملة
واجهة إنجليزية كاملة
واجهة عربية كاملة
تبديل سهل في الإعدادات
جميع التسميات والمقاييس والإشارات مترجمة
⚠️ إخلاء مسؤولية هام
يتم توفير هذا المؤشر لأغراض تعليمية وإعلامية فقط. إنه ليس نصيحة مالية. ينطوي التداول على مخاطر كبيرة للخسارة. دائماً:
مارس إدارة المخاطر المناسبة
لا تخاطر بأكثر مما يمكنك تحمل خسارته
اختبر على حسابات تجريبية قبل التداول المباشر
افهم أن الأداء السابق لا يضمن النتائج المستقبلية
🔄 التحديثات والدعم
تحديثات وتحسينات منتظمة. للأسئلة أو الاقتراحات أو الدعم، يرجى التعليق أدناه!
Developed by Abusuhil | تطوير عبدالرحمن أبوسهيل
Tags: #Volume #Scalping #DayTrading #VolumeAnalysis #OrderFlow #SmartMoney #TradingIndicator #PineScript #الفوليوم #المضاربة #التداول_اليومي #تحليل_الفوليوم

MACD Forecast Colorful [DiFlip]MACD Forecast Colorful
The Future of Predictive MACD — is one of the most advanced and customizable MACD indicators ever published on TradingView. Built on the classic MACD foundation, this upgraded version integrates statistical forecasting through linear regression to anticipate future movements — not just react to the past.
With a total of 22 fully configurable long and short entry conditions, visual enhancements, and full automation support, this indicator is designed for serious traders seeking an analytical edge.
⯁ Real-Time MACD Forecasting
For the first time, a public MACD script combines the classic structure of MACD with predictive analytics powered by linear regression. Instead of simply responding to current values, this tool projects the MACD line, signal line, and histogram n bars into the future, allowing you to trade with foresight rather than hindsight.
⯁ Fully Customizable
This indicator is built for flexibility. It includes 22 entry conditions, all of which are fully configurable. Each condition can be turned on/off, chained using AND/OR logic, and adapted to your trading model.
Whether you're building a rules-based quant system, automating alerts, or refining discretionary signals, MACD Forecast Colorful gives you full control over how signals are generated, displayed, and triggered.
⯁ With MACD Forecast Colorful, you can:
• Detect MACD crossovers before they happen.
• Anticipate trend reversals with greater precision.
• React earlier than traditional indicators.
• Gain a powerful edge in both discretionary and automated strategies.
• This isn’t just smarter MACD — it’s predictive momentum intelligence.
⯁ Scientifically Powered by Linear Regression
MACD Forecast Colorful is the first public MACD indicator to apply least-squares predictive modeling to MACD behavior — effectively introducing machine learning logic into a time-tested tool.
It uses statistical regression to analyze historical behavior of the MACD and project future trajectories. The result is a forward-shifted MACD forecast that can detect upcoming crossovers and divergences before they appear on the chart.
⯁ Linear Regression: Technical Foundation
Linear regression is a statistical method that models the relationship between a dependent variable (y) and one or more independent variables (x). The basic formula for simple linear regression is:
y = β₀ + β₁x + ε
Where:
y = predicted variable (e.g., future MACD value)
x = independent variable (e.g., bar index)
β₀ = intercept
β₁ = slope
ε = random error (residual)
The regression model calculates β₀ and β₁ using the least squares method, minimizing the sum of squared prediction errors to produce the best-fit line through historical values. This line is then extended forward, generating a forecast based on recent price momentum.
⯁ Least Squares Estimation
The regression coefficients are computed with the following formulas:
β₁ = Σ((xᵢ - x̄)(yᵢ - ȳ)) / Σ((xᵢ - x̄)²)
β₀ = ȳ - β₁x̄
Where:
Σ denotes summation; x̄ and ȳ are the means of x and y; and i ranges from 1 to n (number of observations). These equations produce the best linear unbiased estimator under the Gauss–Markov assumptions — constant variance (homoscedasticity) and a linear relationship between variables.
⯁ Regression in Machine Learning
Linear regression is a foundational model in supervised learning. Its ability to provide precise, explainable, and fast forecasts makes it critical in AI systems and quantitative analysis.
Applying linear regression to MACD forecasting is the equivalent of injecting artificial intelligence into one of the most widely used momentum tools in trading.
⯁ Visual Interpretation
Picture the MACD values over time like this:
Time →
MACD →
A regression line is fitted to recent MACD values, then projected forward n periods. The result is a predictive trajectory that can cross over the real MACD or signal line — offering an early-warning system for trend shifts and momentum changes.
The indicator plots both current MACD and forecasted MACD, allowing you to visually compare short-term future behavior against historical movement.
⯁ Scientific Concepts Used
Linear Regression: models the relationship between variables using a straight line.
Least Squares Method: minimizes squared prediction errors for best-fit.
Time-Series Forecasting: projects future data based on past patterns.
Supervised Learning: predictive modeling using labeled inputs.
Statistical Smoothing: filters noise to highlight trends.
⯁ Why This Indicator Is Revolutionary
First open-source MACD with real-time predictive modeling.
Scientifically grounded with linear regression logic.
Automatable through TradingView alerts and bots.
Smart signal generation using forecasted crossovers.
Highly customizable with 22 buy/sell conditions.
Enhanced visuals with background (bgcolor) and area fill (fill) support.
This isn’t just an update — it’s the next evolution of MACD forecasting.
⯁ Example of simple linear regression with one independent variable
This example demonstrates how a basic linear regression works when there is only one independent variable influencing the dependent variable. This type of model is used to identify a direct relationship between two variables.
⯁ In linear regression, observations (red) are considered the result of random deviations (green) from an underlying relationship (blue) between a dependent variable (y) and an independent variable (x)
This concept illustrates that sampled data points rarely align perfectly with the true trend line. Instead, each observed point represents the combination of the true underlying relationship and a random error component.
⯁ Visualizing heteroscedasticity in a scatterplot with 100 random fitted values using Matlab
Heteroscedasticity occurs when the variance of the errors is not constant across the range of fitted values. This visualization highlights how the spread of data can change unpredictably, which is an important factor in evaluating the validity of regression models.
⯁ The datasets in Anscombe’s quartet were designed to have nearly the same linear regression line (as well as nearly identical means, standard deviations, and correlations) but look very different when plotted
This classic example shows that summary statistics alone can be misleading. Even with identical numerical metrics, the datasets display completely different patterns, emphasizing the importance of visual inspection when interpreting a model.
⯁ Result of fitting a set of data points with a quadratic function
This example illustrates how a second-degree polynomial model can better fit certain datasets that do not follow a linear trend. The resulting curve reflects the true shape of the data more accurately than a straight line.
⯁ What is the MACD?
The Moving Average Convergence Divergence (MACD) is a technical analysis indicator developed by Gerald Appel. It measures the relationship between two moving averages of a security’s price to identify changes in momentum, direction, and strength of a trend. The MACD is composed of three components: the MACD line, the signal line, and the histogram.
⯁ How to use the MACD?
The MACD is calculated by subtracting the 26-period Exponential Moving Average (EMA) from the 12-period EMA. A 9-period EMA of the MACD line, called the signal line, is then plotted on top of the MACD line. The MACD histogram represents the difference between the MACD line and the signal line.
Here are the primary signals generated by the MACD:
• Bullish Crossover: When the MACD line crosses above the signal line, indicating a potential buy signal.
• Bearish Crossover: When the MACD line crosses below the signal line, indicating a potential sell signal.
• Divergence: When the price of the security diverges from the MACD, suggesting a potential reversal.
• Overbought/Oversold Conditions: Indicated by the MACD line moving far away from the signal line, though this is less common than in oscillators like the RSI.
⯁ How to use MACD forecast?
The MACD Forecast is built on the same foundation as the classic MACD, but with predictive capabilities.
Step 1 — Spot Predicted Crossovers:
Watch for forecasted bullish or bearish crossovers. These signals anticipate when the MACD line will cross the signal line in the future, letting you prepare trades before the move.
Step 2 — Confirm with Histogram Projection:
Use the projected histogram to validate momentum direction. A rising histogram signals strengthening bullish momentum, while a falling projection points to weakening or bearish conditions.
Step 3 — Combine with Multi-Timeframe Analysis:
Use forecasts across multiple timeframes to confirm signal strength (e.g., a 1h forecast aligned with a 4h forecast).
Step 4 — Set Entry Conditions & Automation:
Customize your buy/sell rules with the 20 forecast-based conditions and enable automation for bots or alerts.
Step 5 — Trade Ahead of the Market:
By preparing for future momentum shifts instead of reacting to the past, you’ll always stay one step ahead of lagging traders.
📈 BUY
🍟 Signal Validity: The signal will remain valid for X bars.
🍟 Signal Sequence: Configurable as AND or OR.
🍟 MACD > Signal Smoothing
🍟 MACD < Signal Smoothing
🍟 Histogram > 0
🍟 Histogram < 0
🍟 Histogram Positive
🍟 Histogram Negative
🍟 MACD > 0
🍟 MACD < 0
🍟 Signal > 0
🍟 Signal < 0
🍟 MACD > Histogram
🍟 MACD < Histogram
🍟 Signal > Histogram
🍟 Signal < Histogram
🍟 MACD (Crossover) Signal
🍟 MACD (Crossunder) Signal
🍟 MACD (Crossover) 0
🍟 MACD (Crossunder) 0
🍟 Signal (Crossover) 0
🍟 Signal (Crossunder) 0
🔮 MACD (Crossover) Signal Forecast
🔮 MACD (Crossunder) Signal Forecast
📉 SELL
🍟 Signal Validity: The signal will remain valid for X bars.
🍟 Signal Sequence: Configurable as AND or OR.
🍟 MACD > Signal Smoothing
🍟 MACD < Signal Smoothing
🍟 Histogram > 0
🍟 Histogram < 0
🍟 Histogram Positive
🍟 Histogram Negative
🍟 MACD > 0
🍟 MACD < 0
🍟 Signal > 0
🍟 Signal < 0
🍟 MACD > Histogram
🍟 MACD < Histogram
🍟 Signal > Histogram
🍟 Signal < Histogram
🍟 MACD (Crossover) Signal
🍟 MACD (Crossunder) Signal
🍟 MACD (Crossover) 0
🍟 MACD (Crossunder) 0
🍟 Signal (Crossover) 0
🍟 Signal (Crossunder) 0
🔮 MACD (Crossover) Signal Forecast
🔮 MACD (Crossunder) Signal Forecast
🤖 Automation
All BUY and SELL conditions can be automated using TradingView alerts. Every configurable condition can trigger alerts suitable for fully automated or semi-automated strategies.
⯁ Unique Features
Linear Regression: (Forecast)
Signal Validity: The signal will remain valid for X bars
Signal Sequence: Configurable as AND/OR
Table of Conditions: BUY/SELL
Conditions Label: BUY/SELL
Plot Labels in the graph above: BUY/SELL
Automate & Monitor Signals/Alerts: BUY/SELL
Background Colors: "bgcolor"
Background Colors: "fill"
Linear Regression (Forecast)
Signal Validity: The signal will remain valid for X bars
Signal Sequence: Configurable as AND/OR
Table of Conditions: BUY/SELL
Conditions Label: BUY/SELL
Plot Labels in the graph above: BUY/SELL
Automate & Monitor Signals/Alerts: BUY/SELL
Background Colors: "bgcolor"
Background Colors: "fill"

ABCD Harmonic Patterns Detection-Professional"It is based on standard ZigZag algorithms, but stands out with its ABCD harmonic detection, Entry, Stop, Target levels and alarm feature."
Title: Advanced ABCD Harmonic Patterns (AB=CD, Classic, Extending)
Description: This indicator is a specialized tool designed to detect and visualize three specific types of ABCD harmonic patterns: AB=CD, Classic ABCD, and Extending ABCD. Unlike generic harmonic scanners, this tool focuses strictly on ABCD structures with custom-tuned logic for higher precision and actionable trade setups.
Key Features:
Specialized Detection Logic:
Accurately identifies AB=CD, Classic ABCD, and Extending ABCD patterns.
Uses advanced custom formulas and strict ratio checks to ensure high-quality pattern detection, filtering out invalid setups.
Automated Trade Levels:
Automatically plots Entry, Target 1, Target 2, and Stop Loss levels for every detected pattern.
Calculates levels dynamically based on the specific pattern type and harmonic ratios to provide precise trade guidance.
Smart Visualization:
Clean Charts: Trade levels (Entry, T1, T2, Stop) are displayed only for the latest pattern to prevent chart clutter. You can see the transaction levels when you hover the cursor over the label in past formations.
Visual Clarity: Uses solid, thick lines with clear labels positioned to the right of the price action.
Overlap Prevention: Smartly offsets labels if multiple patterns complete on the same bar, ensuring all text is readable.
Alerts:
Includes built-in alerts that notify you instantly when a new pattern is formed, allowing you to catch opportunities in real-time.
How to Use:
Add the indicator to your chart.
Adjust ZigZag settings if needed to capture different market cycles.
Use the automated Entry, Target, and Stop levels to guide your trading decisions.
Set up alerts to be notified of new opportunities instantly.
"Standart ZigZag algoritmalarına dayalıdır ancak ABCD harmonik tespiti, Entry, Stop, Target seviyelerini belirtmesi ve alarm özelliği ön plana çıkmaktadır."

All-in-One (PHT)All-in-One (PHT) — Modular Multi-Tool Market Analyzer (Pine Script v6)
All-in-One (PHT) is a complete, modular market-analysis toolkit designed for traders who want clean, reliable, and professional-grade charting - in a single indicator.
Built using Pine Script® v6 and structured with reusable PHT-Libraries (EMA Band, Bollinger Band, Fractal, Session), this indicator delivers clarity, precision, and consistent performance across all markets and timeframes.
Unlike traditional indicators that mix logic and visuals, AIO (PHT) uses a fully modular architecture. All calculations come from dedicated libraries, and this main script focuses purely on visual output and clean plotting.
This ensures:
Stable plot references
Zero repainting in all included modules
High performance even with complex overlays
Easy extensibility for future upgrades
🔥 Included Modules
1. EMA Band (PHT Library)
A triple-EMA band designed for trend clarity and structure.
Provides:
EMA of High
EMA of Close
EMA of Low
Band fill visualization
Ideal for identifying trend strength, momentum pockets, and mean-reversion zones.
2. Bollinger Band Suite
A complete Bollinger framework with:
SMA / EMA / WMA midline options
Dual standard-deviation envelopes
Multi-zone band fills (upper, middle, lower)
User-controlled visibility for each layer
Perfect for volatility detection, squeeze identification, and precision envelope trading.
3. Fractal Engine (High/Low Pivots)
Fast, reliable fractal detection using user-defined left/right periods.
Features:
Pivot Highs & Pivot Lows
Multiple marker sizes (Tiny → Large)
Zero-lag plotting with proper offset handling
Useful for swing structure, breakout confirmation, and automated level marking.
4. Market Session Tracker
A powerful session-mapping module that visually highlights market sessions with:
Dynamic session boxes
High & Low markers
Persistent historical sessions
Auto-managed labels, lines, and live updates
Timezone-aware session boundaries (supports IANA zones)
Designed for identifying daily ranges, session liquidity, volatility pockets, and market timing.
🧠 Why This Indicator Is Different
Most “all-in-one” tools mix plotting, logic, and calculations in a single heavy script, causing lag, reference instability, and repainting issues.
All-in-One (PHT) solves this by using a Pine v6 library architecture:
Each component is computed in its own library
The main script handles only visuals
No hidden code, no repainting tricks
Maximum clarity and maintainability
This design mirrors professional software architecture:
clear separation of logic, visuals, and user interface.
🎯 Ideal For
Trend traders
Scalpers & intraday traders
Swing and positional traders
Volatility analysts
Structure-based price action traders
Anyone who wants multiple high-quality tools in one clean indicator
Whether you analyze markets manually or build algorithmic systems, AIO (PHT) provides a solid foundation.
⚙️ Features at a Glance
Fully modular Pine v6 design
Complete EMA band engine
Advanced Bollinger band system (multi-deviation, multi-fill)
Configurable fractal high/low markers
Smart session boxing with history
Clean visuals and transparent settings
No repainting
Fully customizable colors & visibility
Optimized for performance
💡 How to Use
Choose the modules you want to display (EMA, BB, Fractals, Sessions).
Adjust lengths, deviations, or fractal periods as per your trading style.
Use session boxes to understand volatility timing.
Combine bands + fractals for advanced structure-based decisions.
The indicator is designed to overlay on price for maximum clarity.
🚀 Future Upgrades
The PHT framework supports smooth future expansion. Planned modules include:
ATR/volatility engines
Trend switches
Supertrend/Donchian plugins
Volume profile extensions
Updates will remain backward compatible across all modules.
⭐ Summary
All-in-One (PHT) is not just another overlay — it’s a complete multi-tool trading framework built using professional engineering practices in Pine Script v6.
If you want cleaner charts, smarter signals, and a high-performance modular system, this indicator gives you everything in one reliable package.

ATR Based TMA Bands [NeuraAlgo]ATR-Based TMA Bands
ATR-Based TMA Bands is a volatility-adaptive channel system built around a smoothed Triangular Moving Average (TMA).
It identifies trend direction, momentum shifts, and reversal opportunities using a combination of TMA structure and ATR-driven channel expansion.
Perfect for traders who want a clean, intelligent, and adaptive market framework.
Made by NeuraAlgo.
🔷 How It Works
1. 🔹 TMA Midline (Core Trend)
The indicator builds a smooth and stable midline using:
📐 Triangular Moving Average
🔄 Additional EMA smoothing
This creates a low-noise trend curve that reacts cleanly to real momentum changes.
2. 📈 Volatility-Adjusted Bands
The channels are built from:
📊 Standard Deviation × Expansion Multiplier
📏 Three ATR-based outer layers
These bands:
Expand in high volatility
Contract in stable markets
Reveal pullbacks, breakout zones, and exhaustion points
3. 🔁 Trend Tilt Algorithm
Slope is measured using an ATR-normalized tilt formula:
atrBase = ta.atr(smoothLen)
tilt = (midline - midline ) / (0.1 * atrBase)
This classifies the trend into:
Bullish
Bearish
Neutral
The bar colors and midline adjust automatically to match market direction.
4. 🔄 Reversal Detection (Turn Signals)
The indicator flags directional flips:
Turn Up → bearish → bullish shift
Turn Down → bullish → bearish shift
These are early reversal alerts ideal for swing traders.
5. 🎯 Flip Buy / Flip Sell Signals
Deep volatility extensions create high-probability re-entry zones:
Flip Buy → price rebounds from oversold ATR zone
Flip Sell → price rejects from overbought ATR zone
Great for:
Mean-reversion entries
Trend re-tests
Pullback trades
Exhaustion signals
📌 How to Use This Indicator
✔ Trend Trading
Follow trend using tilt-colored candles
Use midline as dynamic trend filter
Use channels for breakout/pullback entries
✔ Reversal Trading
Watch for Turn Up / Turn Down labels
Flip signals show where the market is over-stretched
✔ Risk Management
ATR channels automatically adjust to volatility
Helps with smarter SL/TP placement
⭐ Best For
Trend traders
Swing traders
Reversal hunters
Volatility lovers
Anyone wanting a smart, clean technical framework
💡 Core Features
TMA-smoothed trend detection
Multi-layer ATR expansion channels
Intelligent trend tilt algorithm
Turn Up / Turn Down reversal markers
Flip Buy / Flip Sell exhaustion signals
Adaptive bar coloring
Clean and professional visual design

Algorithm Predator - ProAlgorithm Predator - Pro: Advanced Multi-Agent Reinforcement Learning Trading System
Algorithm Predator - Pro combines four specialized market microstructure agents with a state-of-the-art reinforcement learning framework . Unlike traditional indicator mashups, this system implements genuine machine learning to automatically discover which detection strategies work best in current market conditions and adapts continuously without manual intervention.
Core Innovation: Rather than forcing traders to interpret conflicting signals, this system uses 15 different multi-armed bandit algorithms and a full reinforcement learning stack (Q-Learning, TD(λ) with eligibility traces, and Policy Gradient with REINFORCE) to learn optimal agent selection policies. The result is a self-improving system that gets smarter with every trade.
Target Users: Swing traders, day traders, and algorithmic traders seeking systematic signal generation with mathematical rigor. Suitable for stocks, forex, crypto, and futures on liquid instruments (>100k daily volume).
Why These Components Are Combined
The Fundamental Problem
No single indicator works consistently across all market regimes. What works in trending markets fails in ranging conditions. Traditional solutions force traders to manually switch indicators (slow, error-prone) or interpret all signals simultaneously (cognitive overload).
This system solves the problem through automated meta-learning: Deploy multiple specialized agents designed for specific market microstructure conditions, then use reinforcement learning to discover which agent (or combination) performs best in real-time.
Why These Specific Four Agents?
The four agents provide orthogonal failure mode coverage —each agent's weakness is another's strength:
Spoofing Detector - Optimal in consolidation/manipulation; fails in trending markets (hedged by Exhaustion Detector)
Exhaustion Detector - Optimal at trend climax; fails in range-bound markets (hedged by Liquidity Void)
Liquidity Void - Optimal pre-breakout compression; fails in established trends (hedged by Mean Reversion)
Mean Reversion - Optimal in low volatility; fails in strong trends (hedged by Spoofing Detector)
This creates complete market state coverage where at least one agent should perform well in any condition. The bandit system identifies which one without human intervention.
Why Reinforcement Learning vs. Simple Voting?
Traditional consensus systems have fatal flaws: equal weighting assumes all agents are equally reliable (false), static thresholds don't adapt, and no learning means past mistakes repeat indefinitely.
Reinforcement learning solves this through the exploration-exploitation tradeoff: Continuously test underused agents (exploration) while primarily relying on proven winners (exploitation). Over time, the system builds a probability distribution over agent quality reflecting actual market performance.
Mathematical Foundation: Multi-armed bandit problem from probability theory, where each agent is an "arm" with unknown reward distribution. The goal is to maximize cumulative reward while efficiently learning each arm's true quality.
The Four Trading Agents: Technical Explanation
Agent 1: 🎭 Spoofing Detector (Institutional Manipulation Detection)
Theoretical Basis: Market microstructure theory on order flow toxicity and information asymmetry. Based on research by Easley, López de Prado, and O'Hara on high-frequency trading manipulation.
What It Detects:
1. Iceberg Orders (Hidden Liquidity Absorption)
Method: Monitors volume spikes (>2.5× 20-period average) with minimal price movement (<0.3× ATR)
Formula: score += (close > open ? -2.5 : 2.5) when volume > vol_avg × 2.5 AND abs(close - open) / ATR < 0.3
Interpretation: Large volume without price movement indicates institutional absorption (buying) or distribution (selling) using hidden orders
Signal Logic: Contrarian—fade false breakouts caused by institutional manipulation
2. Spoofing Patterns (Fake Liquidity via Layering)
Method: Analyzes candlestick wick-to-body ratios during volume spikes
Formula: if upper_wick > body × 2 AND volume_spike: score += 2.0
Mechanism: Spoofing creates large wicks (orders pulled before execution) with volume evidence
Signal Logic: Wick direction indicates trapped participants; trade against the failed move
3. Post-Manipulation Reversals
Method: Tracks volume decay after manipulation events
Formula: if volume > vol_avg × 3 AND volume / volume < 0.3: score += (close > open ? -1.5 : 1.5)
Interpretation: Sharp volume drop after manipulation indicates exhaustion of manipulative orders
Why It Works: Institutional manipulation creates detectable microstructure anomalies. While retail traders see "mysterious reversals," this agent quantifies the order flow patterns causing them.
Parameter: i_spoof (sensitivity 0.5-2.0) - Controls detection threshold
Best Markets: Consolidations before breakouts, London/NY overlap windows, stocks with institutional ownership >70%
Agent 2: ⚡ Exhaustion Detector (Momentum Failure Analysis)
Theoretical Basis: Technical analysis divergence theory combined with VPIN reversals from market microstructure literature.
What It Detects:
1. Price-RSI Divergence (Momentum Deceleration)
Method: Compares 5-bar price ROC against RSI change
Formula: if price_roc > 5% AND rsi_current < rsi : score += 1.8
Mathematics: Second derivative detecting inflection points
Signal Logic: When price makes higher highs but momentum makes lower highs, expect mean reversion
2. Volume Exhaustion (Buying/Selling Climax)
Method: Identifies strong price moves (>5% ROC) with declining volume (<-20% volume ROC)
Formula: if price_roc > 5 AND vol_roc < -20: score += 2.5
Interpretation: Price extension without volume support indicates retail chasing while institutions exit
3. Momentum Deceleration (Acceleration Analysis)
Method: Compares recent 3-bar momentum to prior 3-bar momentum
Formula: deceleration = abs(mom1) < abs(mom2) × 0.5 where momentum significant (> ATR)
Signal Logic: When rate of price change decelerates significantly, anticipate directional shift
Why It Works: Momentum is lagging, but momentum divergence is leading. By comparing momentum's rate of change to price, this agent detects "weakening conviction" before reversals become obvious.
Parameter: i_momentum (sensitivity 0.5-2.0)
Best Markets: Strong trends reaching climax, parabolic moves, instruments with high retail participation
Agent 3: 💧 Liquidity Void Detector (Breakout Anticipation)
Theoretical Basis: Market liquidity theory and order book dynamics. Based on research into "liquidity holes" and volatility compression preceding expansion.
What It Detects:
1. Bollinger Band Squeeze (Volatility Compression)
Method: Monitors Bollinger Band width relative to 50-period average
Formula: bb_width = (upper_band - lower_band) / middle_band; triggers when < 0.6× average
Mathematical Foundation: Regression to the mean—low volatility precedes high volatility
Signal Logic: When volatility compresses AND cumulative delta shows directional bias, anticipate breakout
2. Volume Profile Gaps (Thin Liquidity Zones)
Method: Identifies sharp volume transitions indicating few limit orders
Formula: if volume < vol_avg × 0.5 AND volume < vol_avg × 0.5 AND volume > vol_avg × 1.5
Interpretation: Sudden volume drop after spike indicates price moved through order book to low-opposition area
Signal Logic: Price accelerates through low-liquidity zones
3. Stop Hunts (Liquidity Grabs Before Reversals)
Method: Detects new 20-bar highs/lows with immediate reversal and rejection wick
Formula: if new_high AND close < high - (high - low) × 0.6: score += 3.0
Mechanism: Market makers push price to trigger stop-loss clusters, then reverse
Signal Logic: Enter reversal after stop-hunt completes
Why It Works: Order book theory shows price moves fastest through zones with minimal liquidity. By identifying these zones before major moves, this agent provides early entry for high-reward breakouts.
Parameter: i_liquidity (sensitivity 0.5-2.0)
Best Markets: Range-bound pre-breakout setups, volatility compression zones, instruments prone to gap moves
Agent 4: 📊 Mean Reversion (Statistical Arbitrage Engine)
Theoretical Basis: Statistical arbitrage theory, Ornstein-Uhlenbeck mean-reverting processes, and pairs trading methodology applied to single instruments.
What It Detects:
1. Z-Score Extremes (Standard Deviation Analysis)
Method: Calculates price distance from 20-period and 50-period SMAs in standard deviation units
Formula: zscore_20 = (close - SMA20) / StdDev(50)
Statistical Interpretation: Z-score >2.0 means price is 2 standard deviations above mean (97.5th percentile)
Trigger Logic: if abs(zscore_20) > 2.0: score += zscore_20 > 0 ? -1.5 : 1.5 (fade extremes)
2. Ornstein-Uhlenbeck Process (Mean-Reverting Stochastic Model)
Method: Models price as mean-reverting stochastic process: dx = θ(μ - x)dt + σdW
Implementation: Calculates spread = close - SMA20, then z-score of spread vs. spread distribution
Formula: ou_signal = (spread - spread_mean) / spread_std
Interpretation: Measures "tension" pulling price back to equilibrium
3. Correlation Breakdown (Regime Change Detection)
Method: Compares 50-period price-volume correlation to 10-period correlation
Formula: corr_breakdown = abs(typical_corr - recent_corr) > 0.5
Enhancement: if corr_breakdown AND abs(zscore_20) > 1.0: score += zscore_20 > 0 ? -1.2 : 1.2
Why It Works: Mean reversion is the oldest quantitative strategy (1970s pairs trading at Morgan Stanley). While simple, it remains effective because markets exhibit periodic equilibrium-seeking behavior. This agent applies rigorous statistical testing to identify when mean reversion probability is highest.
Parameter: i_statarb (sensitivity 0.5-2.0)
Best Markets: Range-bound instruments, low-volatility periods (VIX <15), algo-dominated markets (forex majors, index futures)
Multi-Armed Bandit System: 15 Algorithms Explained
What Is a Multi-Armed Bandit Problem?
Origin: Named after slot machines ("one-armed bandits"). Imagine facing multiple slot machines, each with unknown payout rates. How do you maximize winnings?
Formal Definition: K arms (agents), each with unknown reward distribution with mean μᵢ. Goal: Maximize cumulative reward over T trials. Challenge: Balance exploration (trying uncertain arms to learn quality) vs. exploitation (using known-best arm for immediate reward).
Trading Application: Each agent is an "arm." After each trade, receive reward (P&L). Must decide which agent to trust for next signal.
Algorithm Categories
Bayesian Approaches (probabilistic, optimal for stationary environments):
Thompson Sampling
Bootstrapped Thompson Sampling
Discounted Thompson Sampling
Frequentist Approaches (confidence intervals, deterministic):
UCB1
UCB1-Tuned
KL-UCB
SW-UCB (Sliding Window)
D-UCB (Discounted)
Adversarial Approaches (robust to non-stationary environments):
EXP3-IX
Hedge
FPL-Gumbel
Reinforcement Learning Approaches (leverage learned state-action values):
Q-Values (from Q-Learning)
Policy Network (from Policy Gradient)
Simple Baseline:
Epsilon-Greedy
Softmax
Key Algorithm Details
Thompson Sampling (DEFAULT - RECOMMENDED)
Theoretical Foundation: Bayesian decision theory with conjugate priors. Published by Thompson (1933), rediscovered for bandits by Chapelle & Li (2011).
How It Works:
Model each agent's reward distribution as Beta(α, β) where α = wins, β = losses
Each step, sample from each agent's beta distribution: θᵢ ~ Beta(αᵢ, βᵢ)
Select agent with highest sample: argmaxᵢ θᵢ
Update winner's distribution after observing outcome
Mathematical Properties:
Optimality: Achieves logarithmic regret O(K log T) (proven optimal)
Bayesian: Maintains probability distribution over true arm means
Automatic Balance: High uncertainty → more exploration; high certainty → exploitation
⚠️ CRITICAL APPROXIMATION: This is a pseudo-random approximation of true Thompson Sampling. True implementation requires random number generation from beta distributions, which Pine Script doesn't provide. This version uses Box-Muller transform with market data (price/volume decimal digits) as entropy source. While not mathematically pure, it maintains core exploration-exploitation balance and learns agent preferences effectively.
When To Use: Best all-around choice. Handles non-stationary markets reasonably well, balances exploration naturally, highly sample-efficient.
UCB1 (Upper Confidence Bound)
Formula: UCB_i = reward_mean_i + sqrt(2 × ln(total_pulls) / pulls_i)
Interpretation: First term (exploitation) + second term (exploration bonus for less-tested arms)
Mathematical Properties:
Deterministic : Always selects same arm given same state
Regret Bound: O(K log T) — same optimality as Thompson Sampling
Interpretable: Can visualize confidence intervals
When To Use: Prefer deterministic behavior, want to visualize uncertainty, stable markets
EXP3-IX (Exponential Weights - Adversarial)
Theoretical Foundation: Adversarial bandit algorithm. Assumes environment may be actively hostile (worst-case analysis).
How It Works:
Maintain exponential weights: w_i = exp(η × cumulative_reward_i)
Select agent with probability proportional to weights: p_i = (1-γ)w_i/Σw_j + γ/K
After outcome, update with importance weighting: estimated_reward = observed_reward / p_i
Mathematical Properties:
Adversarial Regret: O(sqrt(TK log K)) even if environment is adversarial
No Assumptions: Doesn't assume stationary or stochastic reward distributions
Robust: Works even when optimal arm changes continuously
When To Use: Extreme non-stationarity, don't trust reward distribution assumptions, want robustness over efficiency
KL-UCB (Kullback-Leibler Upper Confidence Bound)
Theoretical Foundation: Uses KL-divergence instead of Hoeffding bounds. Tighter confidence intervals.
Formula (conceptual): Find largest q such that: n × KL(p||q) ≤ ln(t) + 3×ln(ln(t))
Mathematical Properties:
Tighter Bounds: KL-divergence adapts to reward distribution shape
Asymptotically Optimal: Better constant factors than UCB1
Computationally Intensive: Requires iterative binary search (15 iterations)
When To Use: Maximum sample efficiency needed, willing to pay computational cost, long-term trading (>500 bars)
Q-Values & Policy Network (RL-Based Selection)
Unique Feature: Instead of treating agents as black boxes with scalar rewards, these algorithms leverage the full RL state representation .
Q-Values Selection:
Uses learned Q-values: Q(state, agent_i) from Q-Learning
Selects agent via softmax over Q-values for current market state
Advantage: Selects based on state-conditional quality (which agent works best in THIS market state)
Policy Network Selection:
Uses neural network policy: π(agent | state, θ) from Policy Gradient
Direct policy over agents given market features
Advantage: Can learn non-linear relationships between market features and agent quality
When To Use: After 200+ RL updates (Q-Values) or 500+ updates (Policy Network) when models converged
Machine Learning & Reinforcement Learning Stack
Why Both Bandits AND Reinforcement Learning?
Critical Distinction:
Bandits treat agents as contextless black boxes: "Agent 2 has 60% win rate"
Reinforcement Learning adds state context: "Agent 2 has 60% win rate WHEN trend_score > 2 and RSI < 40"
Power of Combination: Bandits provide fast initial learning with minimal assumptions. RL provides state-dependent policies for superior long-term performance.
Component 1: Q-Learning (Value-Based RL)
Algorithm: Temporal Difference Learning with Bellman equation.
State Space: 54 discrete states formed from:
trend_state = {0: bearish, 1: neutral, 2: bullish} (3 values)
volatility_state = {0: low, 1: normal, 2: high} (3 values)
RSI_state = {0: oversold, 1: neutral, 2: overbought} (3 values)
volume_state = {0: low, 1: high} (2 values)
Total states: 3 × 3 × 3 × 2 = 54 states
Action Space: 5 actions (No trade, Agent 1, Agent 2, Agent 3, Agent 4)
Total state-action pairs: 54 × 5 = 270 Q-values
Bellman Equation:
Q(s,a) ← Q(s,a) + α ×
Parameters:
α (learning rate): 0.01-0.50, default 0.10 - Controls step size for updates
γ (discount factor): 0.80-0.99, default 0.95 - Values future rewards
ε (exploration): 0.01-0.30, default 0.10 - Probability of random action
Update Mechanism:
Position opens with state s, action a (selected agent)
Every bar position is open: Calculate floating P&L → scale to reward
Perform online TD update
When position closes: Perform terminal update with final reward
Gradient Clipping: TD errors clipped to ; Q-values clipped to for stability.
Why It Works: Q-Learning learns "quality" of each agent in each market state through trial and error. Over time, builds complete state-action value function enabling optimal state-dependent agent selection.
Component 2: TD(λ) Learning (Temporal Difference with Eligibility Traces)
Enhancement Over Basic Q-Learning: Credit assignment across multiple time steps.
The Problem TD(λ) Solves:
Position opens at t=0
Market moves favorably at t=3
Position closes at t=8
Question: Which earlier decisions contributed to success?
Basic Q-Learning: Only updates Q(s₈, a₈) ← reward
TD(λ): Updates ALL visited state-action pairs with decayed credit
Eligibility Trace Formula:
e(s,a) ← γ × λ × e(s,a) for all s,a (decay all traces)
e(s_current, a_current) ← 1 (reset current trace)
Q(s,a) ← Q(s,a) + α × TD_error × e(s,a) (update all with trace weight)
Lambda Parameter (λ): 0.5-0.99, default 0.90
λ=0: Pure 1-step TD (only immediate next state)
λ=1: Full Monte Carlo (entire episode)
λ=0.9: Balance (recommended)
Why Superior: Dramatically faster learning for multi-step tasks. Q-Learning requires many episodes to propagate rewards backwards; TD(λ) does it in one.
Component 3: Policy Gradient (REINFORCE with Baseline)
Paradigm Shift: Instead of learning value function Q(s,a), directly learn policy π(a|s).
Policy Network Architecture:
Input: 12 market features
Hidden: None (linear policy)
Output: 5 actions (softmax distribution)
Total parameters: 12 features × 5 actions + 5 biases = 65 parameters
Feature Set (12 Features):
Price Z-score (close - SMA20) / ATR
Volume ratio (volume / vol_avg - 1)
RSI deviation (RSI - 50) / 50
Bollinger width ratio
Trend score / 4 (normalized)
VWAP deviation
5-bar price ROC
5-bar volume ROC
Range/ATR ratio - 1
Price-volume correlation (20-period)
Volatility ratio (ATR / ATR_avg - 1)
EMA50 deviation
REINFORCE Update Rule:
θ ← θ + α × ∇log π(a|s) × advantage
where advantage = reward - baseline (variance reduction)
Why Baseline? Raw rewards have high variance. Subtracting baseline (running average) centers rewards around zero, reducing gradient variance by 50-70%.
Learning Rate: 0.001-0.100, default 0.010 (much lower than Q-Learning because policy gradients have high variance)
Why Policy Gradient?
Handles 12 continuous features directly (Q-Learning requires discretization)
Naturally maintains exploration through probability distribution
Can converge to stochastic optimal policy
Component 4: Ensemble Meta-Learner (Stacking)
Architecture: Level-1 meta-learner combines Level-0 base learners (Q-Learning, TD(λ), Policy Gradient).
Three Meta-Learning Algorithms:
1. Simple Average (Baseline)
Final_prediction = (Q_prediction + TD_prediction + Policy_prediction) / 3
2. Weighted Vote (Reward-Based)
weight_i ← 0.95 × weight_i + 0.05 × (reward_i + 1)
3. Adaptive Weighting (Gradient-Based) — RECOMMENDED
Loss Function: L = (y_true - ŷ_ensemble)²
Gradient: ∂L/∂weight_i = -2 × (y_true - ŷ_ensemble) × agent_contribution_i
Updates weights via gradient descent with clipping and normalization
Why It Works: Unlike simple averaging, meta-learner discovers which base learner is most reliable in current regime. If Policy Gradient excels in trending markets while Q-Learning excels in ranging, meta-learner learns these patterns and weights accordingly.
Feature Importance Tracking
Purpose: Identify which of 12 features contribute most to successful predictions.
Update Rule: importance_i ← 0.95 × importance_i + 0.05 × |feature_i × reward|
Use Cases:
Feature selection: Drop low-importance features
Market regime detection: Importance shifts reveal regime changes
Agent tuning: If VWAP deviation has high importance, consider boosting agents using VWAP
RL Position Tracking System
Critical Innovation: Proper reinforcement learning requires tracking which decisions led to outcomes.
State Tracking (When Signal Validates):
active_rl_state ← current_market_state (0-53)
active_rl_action ← selected_agent (1-4)
active_rl_entry ← entry_price
active_rl_direction ← 1 (long) or -1 (short)
active_rl_bar ← current_bar_index
Online Updates (Every Bar Position Open):
floating_pnl = (close - entry) / entry × direction
reward = floating_pnl × 10 (scale to meaningful range)
reward = clip(reward, -5.0, 5.0)
Update Q-Learning, TD(λ), and Policy Gradient
Terminal Update (Position Close):
Final Q-Learning update (no next Q-value, terminal state)
Update meta-learner with final result
Update agent memory
Clear position tracking
Exit Conditions:
Time-based: ≥3 bars held (minimum hold period)
Stop-loss: 1.5% adverse move
Take-profit: 2.0% favorable move
Market Microstructure Filters
Why Microstructure Matters
Traditional technical analysis assumes fair, efficient markets. Reality: Markets have friction, manipulation, and information asymmetry. Microstructure filters detect when market structure indicates adverse conditions.
Filter 1: VPIN (Volume-Synchronized Probability of Informed Trading)
Theoretical Foundation: Easley, López de Prado, & O'Hara (2012). "Flow Toxicity and Liquidity in a High-Frequency World."
What It Measures: Probability that current order flow is "toxic" (informed traders with private information).
Calculation:
Classify volume as buy or sell (close > close = buy volume)
Calculate imbalance over 20 bars: VPIN = |Σ buy_volume - Σ sell_volume| / Σ total_volume
Compare to moving average: toxic = VPIN > VPIN_MA(20) × sensitivity
Interpretation:
VPIN < 0.3: Normal flow (uninformed retail)
VPIN 0.3-0.4: Elevated (smart money active)
VPIN > 0.4: Toxic flow (informed institutions dominant)
Filter Logic:
Block LONG when: VPIN toxic AND price rising (don't buy into institutional distribution)
Block SHORT when: VPIN toxic AND price falling (don't sell into institutional accumulation)
Adaptive Threshold: If VPIN toxic frequently, relax threshold; if rarely toxic, tighten threshold. Bounded .
Filter 2: Toxicity (Kyle's Lambda Approximation)
Theoretical Foundation: Kyle (1985). "Continuous Auctions and Insider Trading."
What It Measures: Price impact per unit volume — market depth and informed trading.
Calculation:
price_impact = (close - close ) / sqrt(Σ volume over 10 bars)
impact_zscore = (price_impact - impact_mean) / impact_std
toxicity = abs(impact_zscore)
Interpretation:
Low toxicity (<1.0): Deep liquid market, large orders absorbed easily
High toxicity (>2.0): Thin market or informed trading
Filter Logic: Block ALL SIGNALS when toxicity > threshold. Most dangerous when price breaks from VWAP with high toxicity.
Filter 3: Regime Filter (Counter-Trend Protection)
Purpose: Prevent counter-trend trades during strong trends.
Trend Scoring:
trend_score = 0
trend_score += close > EMA8 ? +1 : -1
trend_score += EMA8 > EMA21 ? +1 : -1
trend_score += EMA21 > EMA50 ? +1 : -1
trend_score += close > EMA200 ? +1 : -1
Range:
Regime Classification:
Strong Bull: trend_score ≥ +3 → Block all SHORT signals
Strong Bear: trend_score ≤ -3 → Block all LONG signals
Neutral: -2 ≤ trend_score ≤ +2 → Allow both directions
Filter 4: Liquidity Boost (Signal Enhancer)
Unique: Unlike other filters (which block), this amplifies signals during low liquidity.
Logic: if volume < vol_avg × 0.7: agent_scores × 1.2
Why It Works: Low liquidity often precedes explosive moves (breakouts). By increasing agent sensitivity during compression, system catches pre-breakout signals earlier.
Technical Implementation & Approximations
⚠️ Critical Approximations Required by Pine Script
1. Thompson Sampling: Pseudo-Random Beta Distribution
Academic Standard: True random sampling from beta distributions using cryptographic RNG
This Implementation: Box-Muller transform for normal distribution using market data (price/volume decimal digits) as entropy source, then scale to beta distribution mean/variance
Impact: Not cryptographically random, may have subtle biases in specific price ranges, but maintains correct mean and approximate variance. Sufficient for bandit agent selection.
2. VPIN: Simplified Volume Classification
Academic Standard: Lee-Ready algorithm or exchange-provided aggressor flags with tick-by-tick data
This Implementation: Bar-based classification: if close > close : buy_volume += volume
Impact: 10-15% precision loss. Works well in directional markets, misclassifies in choppy conditions. Still captures order flow imbalance signal.
3. Policy Gradient: Simplified Per-Action Updates
Academic Standard: Full softmax gradient updating all actions (selected action UP, others DOWN proportionally)
This Implementation: Only updates selected action's weights
Impact: Valid approximation for small action spaces (5 actions). Slower convergence than full softmax but still learns optimal policy.
4. Kyle's Lambda: Simplified Price Impact
Academic Standard: Regression over multiple time scales with signed order flow
This Implementation: price_impact = Δprice_10 / sqrt(Σvolume_10); z_score calculation
Impact: 15-20% precision loss. No proper signed order flow. Still detects informed trading signals at extremes (>2σ).
5. Other Simplifications:
Hawkes Process: Fixed exponential decay (0.9) not MLE-optimized
Entropy: Ratio approximation not true Shannon entropy H(X) = -Σ p(x)·log₂(p(x))
Feature Engineering: 12 features vs. potential 100+ with polynomial interactions
RL Hybrid Updates: Both online and terminal (non-standard but empirically effective)
Overall Precision Loss Estimate: 10-15% compared to academic implementations with institutional data feeds.
Practical Trade-off: For retail trading with OHLCV data, these approximations provide 90%+ of the edge while maintaining full transparency, zero latency, no external dependencies, and runs on any TradingView plan.
How to Use: Practical Guide
Initial Setup (5 Minutes)
Select Trading Mode: Start with "Balanced" for most users
Enable ML/RL System: Toggle to TRUE, select "Full Stack" ML Mode
Bandit Configuration: Algorithm: "Thompson Sampling", Mode: "Switch" or "Blend"
Microstructure Filters: Enable all four filters, enable "Adaptive Microstructure Thresholds"
Visual Settings: Enable dashboard (Top Right), enable all chart visuals
Learning Phase (First 50-100 Signals)
What To Monitor:
Agent Performance Table: Watch win rates develop (target >55%)
Bandit Weights: Should diverge from uniform (0.25 each) after 20-30 signals
RL Core Metrics: "RL Updates" should increase when position open
Filter Status: "Blocked" count indicates filter activity
Optimization Tips:
Too few signals: Lower min_confidence to 0.25, increase agent sensitivities to 1.1-1.2
Too many signals: Raise min_confidence to 0.35-0.40, decrease agent sensitivities to 0.8-0.9
One agent dominates (>70%): Consider "Lock Agent" feature
Signal Interpretation
Dashboard Signal Status:
⚪ WAITING FOR SIGNAL: No agent signaling
⏳ ANALYZING...: Agent signaling but not confirmed
🟡 CONFIRMING 2/3: Building confirmation (2 of 3 bars)
🟢 LONG ACTIVE : Validated long entry
🔴 SHORT ACTIVE : Validated short entry
Kill Zone Boxes: Entry price (triangle marker), Take Profit (Entry + 2.5× ATR), Stop Loss (Entry - 1.5× ATR). Risk:Reward = 1:1.67
Risk Management
Position Sizing:
Risk per trade = 1-2% of capital
Position size = (Capital × Risk%) / (Entry - StopLoss)
Stop-Loss Placement:
Initial: Entry ± 1.5× ATR (shown in kill zone)
Trailing: After 1:1 R:R achieved, move stop to breakeven
Take-Profit Strategy:
TP1 (2.5× ATR): Take 50% off
TP2 (Runner): Trail stop at 1× ATR or use opposite signal as exit
Memory Persistence
Why Save Memory: Every chart reload resets the system. Saving learned parameters preserves weeks of learning.
When To Save: After 200+ signals when agent weights stabilize
What To Save: From Memory Export panel, copy all alpha/beta/weight values and adaptive thresholds
How To Restore: Enable "Restore From Saved State", input all values into corresponding fields
What Makes This Original
Innovation 1: Genuine Multi-Armed Bandit Framework
This implements 15 mathematically rigorous bandit algorithms from academic literature (Thompson Sampling from Chapelle & Li 2011, UCB family from Auer et al. 2002, EXP3 from Auer et al. 2002, KL-UCB from Garivier & Cappé 2011). Each algorithm maintains proper state, updates according to proven theory, and converges to optimal behavior. This is real learning, not superficial parameter changes.
Innovation 2: Full Reinforcement Learning Stack
Beyond bandits learning which agent works best globally, RL learns which agent works best in each market state. After 500+ positions, system builds 54-state × 5-action value function (270 learned parameters) capturing context-dependent agent quality.
Innovation 3: Market Microstructure Integration
Combines retail technical analysis with institutional-grade microstructure metrics: VPIN from Easley, López de Prado, O'Hara (2012), Kyle's Lambda from Kyle (1985), Hawkes Processes from Hawkes (1971). These detect informed trading, manipulation, and liquidity dynamics invisible to technical analysis.
Innovation 4: Adaptive Threshold System
Dynamic quantile-based thresholds: Maintains histogram of each agent's score distribution (24 bins, exponentially decayed), calculates 80th percentile threshold from histogram. Agent triggers only when score exceeds its own learned quantile. Proper non-parametric density estimation automatically adapts to instrument volatility, agent behavior shifts, and market regime changes.
Innovation 5: Episodic Memory with Transfer Learning
Dual-layer architecture: Short-term memory (last 20 trades, fast adaptation) + Long-term memory (condensed episodes, historical patterns). Transfer mechanism consolidates knowledge when STM reaches threshold. Mimics hippocampus → neocortex consolidation in human memory.
Limitations & Disclaimers
General Limitations
No Predictive Guarantee: Pattern recognition ≠ prediction. Past performance ≠ future results.
Learning Period Required: Minimum 50-100 bars for reliable statistics. Initial performance may be suboptimal.
Overfitting Risk: System learns patterns in historical data. May not generalize to unprecedented conditions.
Approximation Limitations: See technical implementation section (10-15% precision loss vs. academic standards)
Single-Instrument Limitation: No multi-asset correlation, sector context, or VIX integration.
Forward-Looking Bias Disclaimer
CRITICAL TRANSPARENCY: The RL system uses an 8-bar forward-looking window for reward calculation.
What This Means: System learns from rewards incorporating future price information (bars 101-108 relative to entry at bar 100).
Why Acceptable:
✅ Signals do NOT look ahead: Entry decisions use only data ≤ entry bar
✅ Learning only: Forward data used for optimization, not signal generation
✅ Real-time mirrors backtest: In live trading, system learns identically
⚠️ Implication: Dashboard "Agent Win%" reflects this 8-bar evaluation. Real-time performance may differ slightly if positions held longer, slippage/fees not captured, or market microstructure changes.
Risk Warnings
No Guarantee of Profit: All trading involves risk of loss
System Failures: Bugs possible despite extensive testing
Market Conditions: Optimized for liquid markets (>100k daily volume). Performance degrades in illiquid instruments, major news events, flash crashes
Broker-Specific Issues: Execution slippage, commission/fees, overnight financing costs
Appropriate Use
This Indicator Is:
✅ Entry trigger system
✅ Risk management framework (stop/target)
✅ Adaptive agent selection engine
✅ Learning system that improves over time
This Indicator Is NOT:
❌ Complete trading strategy (requires position sizing, portfolio management)
❌ Replacement for fundamental analysis
❌ Guaranteed profit generator
❌ Suitable for complete beginners without training
Recommended Complementary Analysis: Market context (support/resistance), volume profile, fundamental catalysts, correlation with related instruments, broader market regime
Recommended Settings by Instrument
Stocks (Large Cap, >$1B):
Mode: Balanced | ML/RL: Enabled, Full Stack | Bandit: Thompson Sampling, Switch
Agent Sensitivity: Spoofing 1.0-1.2, Exhaustion 0.9-1.1, Liquidity 0.8-1.0, StatArb 1.1-1.3
Microstructure: All enabled, VPIN 1.2, Toxicity 1.5 | Timeframe: 15min-1H
Forex Majors (EURUSD, GBPUSD):
Mode: Balanced to Conservative | ML/RL: Enabled, Full Stack | Bandit: Thompson Sampling, Blend
Agent Sensitivity: Spoofing 0.8-1.0, Exhaustion 0.9-1.1, Liquidity 0.7-0.9, StatArb 1.2-1.5
Microstructure: All enabled, VPIN 1.0-1.1, Toxicity 1.3-1.5 | Timeframe: 5min-30min
Crypto (BTC, ETH):
Mode: Aggressive to Balanced | ML/RL: Enabled, Full Stack | Bandit: Thompson Sampling OR EXP3-IX
Agent Sensitivity: Spoofing 1.2-1.5, Exhaustion 1.1-1.3, Liquidity 1.2-1.5, StatArb 0.7-0.9
Microstructure: All enabled, VPIN 1.4-1.6, Toxicity 1.8-2.2 | Timeframe: 15min-4H
Futures (ES, NQ, CL):
Mode: Balanced | ML/RL: Enabled, Full Stack | Bandit: UCB1 or Thompson Sampling
Agent Sensitivity: All 1.0-1.2 (balanced)
Microstructure: All enabled, VPIN 1.1-1.3, Toxicity 1.4-1.6 | Timeframe: 5min-30min
Conclusion
Algorithm Predator - Pro synthesizes academic research from market microstructure theory, reinforcement learning, and multi-armed bandit algorithms. Unlike typical indicator mashups, this system implements 15 mathematically rigorous bandit algorithms, deploys a complete RL stack (Q-Learning, TD(λ), Policy Gradient), integrates institutional microstructure metrics (VPIN, Kyle's Lambda), adapts continuously through dual-layer memory and meta-learning, and provides full transparency on approximations and limitations.
The system is designed for serious algorithmic traders who understand that no indicator is perfect, but through proper machine learning, we can build systems that improve over time and adapt to changing markets without manual intervention.
Use responsibly. Risk disclosure applies. Past performance ≠ future results.
Taking you to school. — Dskyz, Trade with insight. Trade with anticipation.

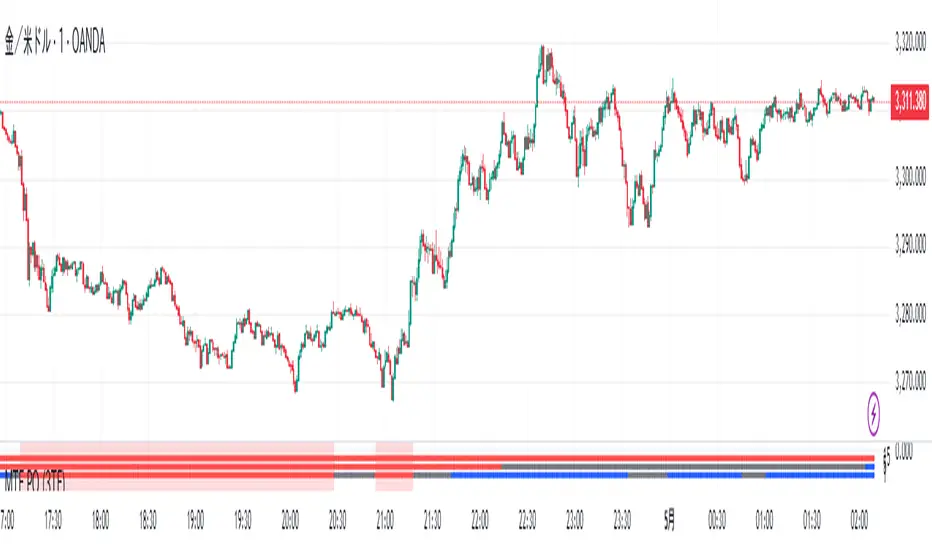
The Ultimate Price Action & SMC Toolkit: Delta Zones, MTF IndicaThis is an All-in-One Pine Script indicator that seamlessly combines three advanced trading concepts:
Delta Zones (Wick Pressure): Uses Standard Deviation to identify extreme buying/selling pressure within the candlestick wicks, signaling potential stop hunts or liquidity absorption. These are plotted as critical Buy/Sell Boxes.
Multi-Timeframe (MTF) Indicators: Confirms signals using popular indicators (RSI, CCI, Stochastic) calculated from a separate, user-selected Timeframe or the current chart timeframe. This adds a crucial layer of context and momentum confirmation.
Smart Money Concepts (SMC): Automatically detects and plots Orderblocks (OBs) and Breaker Blocks based on confirmed Market Structure Breaks (MSB). This helps locate high-probability Supply and Demand zones.
Key Features:
Integrated plotting for combined indicator signals.
Flexible MTF selection for all standard oscillators.
Automatic Swing High/Low detection for SMC analysis.
Comprehensive Alert system for Delta Pressure, Orderblocks, and Breaker Zones.
Option 2: Focusing on SMC and Flow (Concise)
Title: "SMC Delta Flow: Advanced Orderblock, Breaker, and Wick Reversal Zones with MTF Filter."
Description:
An essential tool for sophisticated SMC traders. This indicator provides high-precision zones:
Smart Money Blocks: Plots Orderblocks and Breaker Blocks following Market Structure Shifts (MSS). Includes a "Chop Control" feature to invalidate re-used or weak Breakers.
Delta Reversal Zones: Pinpoints candles showing extreme high-deviation wick pressure. Use these zones to confirm reversals and identify precise entry points where liquidity was captured.
MTF Confirmation: Incorporates configurable Multi-Timeframe (MTF) RSI, CCI, and Stochastic indicators to act as a momentum filter or confirmation tool.
Add this indicator to unify your analysis of Liquidity, Market Structure, and Momentum on a single chart!
SMC, SmartMoneyConcepts, Orderblock, BreakerBlock, MTF, MultiTimeframe, Delta, Wick, Liquidity, PriceAction, RSI, Stochastic, CCI

Renko Emulator Strategy # 🚀 Renko Emulator Strategy for Normal Candlestick Charts
Transform your trading with this advanced Renko-based strategy that works seamlessly on normal candlestick charts!
## ✨ What Makes This Special?
### 🎯 Smart Signal System
- **One Signal at a Time**: No confusing duplicate signals
- **Position State Tracking**: Always know your current position
- **Automatic Target Detection**: T1, T2, T3 calculated automatically
- **10 Comprehensive Alerts**: Never miss an opportunity
### 🔧 Technical Excellence
- **Renko Logic**: Filters market noise using brick formations
- **ATR-Based Sizing**: Adapts to market volatility
- **Multi-Indicator Confirmation**: EMA, RSI, MACD, Supertrend
- **Volume Validation**: Only high-probability setups
## 📊 How It Works
### Entry Signals
🟢 **LONG (BUY)**
- Reversal: Red bricks → First green brick
- Trend: 3+ consecutive green bricks
- With full technical confirmation
🔴 **SHORT (SELL)**
- Reversal: Green bricks → First red brick
- Trend: 3+ consecutive red bricks
- With full technical confirmation
### Position Management
📍 **Stop Loss**: Last opposite brick ± buffer
🎯 **Target 1**: 2× Brick size → Book 50%
🎯 **Target 2**: 3× Brick size → Book 30%
🎯 **Target 3**: 4× Brick size → Book 20%
### Exit Rules
⚠️ Opposite brick formation
⚠️ RSI extremes (>80 or <20)
⚠️ Manual exit as needed
## 🎨 Visual Features
### On Your Chart
- 📊 Renko brick overlays
- 🟢 Green triangles = BUY signals
- 🔴 Red triangles = SELL signals
- ⚪ Target hit markers (T1, T2, T3)
- 📈 Trend indicators overlay
- 🎨 Position background color
### Info Panel
Real-time dashboard showing:
- Current brick size & color
- Position status (LONG/SHORT/NONE)
- Consecutive brick count
- RSI level
- Trend direction
- Market conditions
## 🔔 Complete Alert System
**10 Alerts Available:**
✅ Long & Short Entry
✅ All 6 Target Hits (T1, T2, T3 each)
✅ Long & Short Exit
**Alert Messages Include:**
- Entry price & direction
- Profit booking instructions
- Risk management tips
- Next action guidance
## 💰 Best Instruments
### Highly Effective On:
- **Indian Markets**: Nifty 50, Bank Nifty
- **Stocks**: HDFC, Reliance, TCS, Infosys
- **Forex**: EUR/USD, GBP/USD, USD/JPY
- **Crypto**: BTC, ETH, major altcoins
- **Commodities**: Gold, Silver, Crude Oil
### Recommended Timeframes:
- **Day Trading**: 5-min, 15-min
- **Swing Trading**: 1-hour, 4-hour
- **Position Trading**: Daily
## ⚙️ Customizable Settings
### Brick Configuration
- ATR-based (automatic) or Fixed points
- Adjustable ATR period & multiplier
- Visual brick display on/off
### Indicator Parameters
- EMA length (default: 20)
- RSI period (default: 14)
- MACD settings (12, 26, 9)
- Supertrend (10, 3)
- Volume filter toggle
### Display Options
- Show/hide entry signals
- Show/hide target levels
- Show/hide info table
- Brick overlay transparency
## 📈 Usage Strategy
### For Beginners:
1. Add to chart with default settings
2. Wait for clear BUY/SELL arrows
3. Follow position management rules
4. Use recommended stop losses
5. Book profits at targets
### For Advanced Traders:
1. Optimize brick size per instrument
2. Fine-tune indicator parameters
3. Combine with your strategy
4. Backtest thoroughly
5. Scale position sizes
## ⚠️ Risk Management
### Built-in Protection:
- Maximum 2% risk per trade
- Clear stop loss levels
- Defined profit targets
- Position size calculator
- Daily loss limits
### Best Practices:
✅ Test on demo first
✅ Use proper position sizing
✅ Follow stop losses strictly
✅ Don't over-trade
✅ Maintain trading journal
## 🎓 What You Get
### Immediate Benefits:
- Clear entry/exit signals
- No analysis paralysis
- Reduced emotional trading
- Systematic approach
- Professional risk management
### Learning Opportunities:
- Understand Renko concepts
- Master position management
- Learn risk control
- Develop discipline
- Build consistent strategy
## 🐛 Troubleshooting
### No Signals?
- Check indicator settings
- Verify brick size not too large
- Ensure volume filter appropriate
- Try different timeframe
### Too Many Signals?
- Increase brick size
- Use higher timeframe
- Enable stricter filters
- Check signal filtering active
## 📊 Performance Notes
### Works Best In:
✅ Trending markets
✅ Clear directional moves
✅ Good liquidity
✅ Normal volatility
### Avoid Trading:
❌ Major news events
❌ Low volume periods
❌ Extreme volatility
❌ Choppy/sideways markets
## 🔄 Updates & Support
**Current Version**: 2.0
**Recent Updates:**
- ✅ Fixed duplicate signals
- ✅ Added position tracking
- ✅ Enhanced alert system
- ✅ Improved visual feedback
- ✅ Better target detection
**Future Plans:**
- Additional customization
- More alert options
- Advanced features
- Performance improvements
## 📜 Important Disclaimer
⚠️ **Please Read Carefully:**
This indicator is for **educational purposes only**. Trading involves substantial risk of loss. Past performance does not guarantee future results.
**You Must:**
- Use proper risk management
- Test strategies before live trading
- Never risk more than you can afford to lose
- Consult financial advisor if needed
- Understand your trading instrument
**The creator assumes no responsibility for trading losses incurred using this indicator.**
## 🙏 Credits
- Renko Concept: Traditional Japanese charting
- ATR Calculation: J. Welles Wilder
- Community Feedback: Beta testers & users
---
## 💬 Feedback Welcome!
If you find this helpful:
- ⭐ Like the indicator
- 💬 Share your feedback
- 🐛 Report bugs
- 💡 Suggest improvements
- 🔄 Share with traders
## 📞 Getting Started
1. **Add to Chart**: Click "Add to Chart"
2. **Configure Settings**: Adjust as needed
3. **Set Alerts**: Enable notifications
4. **Test First**: Use demo account
5. **Go Live**: Start small, scale up
---
**Happy Trading! 📈🚀**
**Trade Smart. Trade Safe. Trade Profitable.**
---
*Remember: Discipline + Risk Management + Good Strategy = Success*
*No indicator is perfect. Use as part of complete trading plan.*
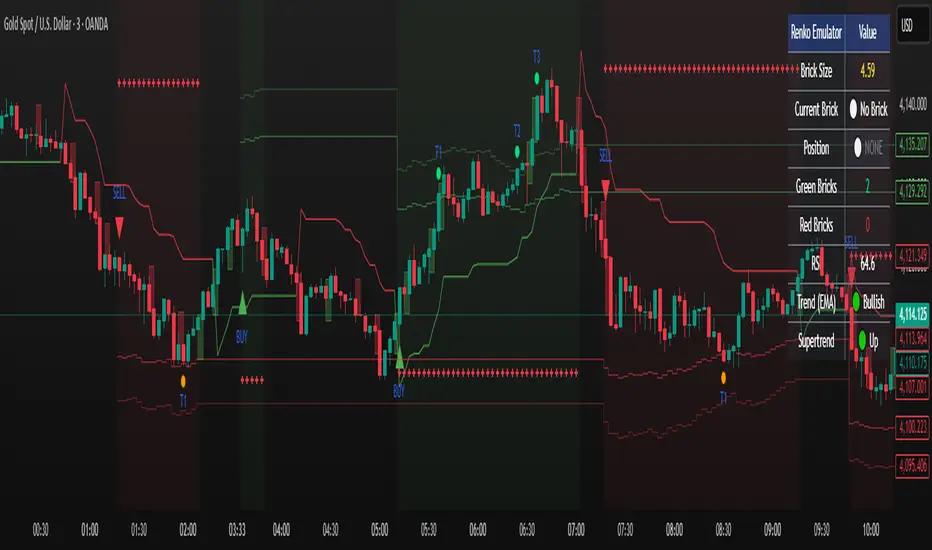
Cumulative Hybrid Delta# 📊 CUMULATIVE HYBRID DELTA
## The Most Advanced Volume Delta Indicator for Crypto & Forex Traders
---
## WHAT IS IT?
**Cumulative Hybrid Delta** reveals **who is in control of the market** — buyers or sellers — in real-time. By analyzing volume imbalances and their accumulation over time, this indicator detects market pressure before price moves, giving you the edge you need.
**Stop guessing the market's direction. Start seeing it.**
---
## WHAT IT SHOWS
### 🟢 Buying Pressure
Green signals indicate accumulated buyer dominance. Watch for rising green accumulation in downtrends for reversal opportunities.
### 🔴 Selling Pressure
Red signals show accumulated seller control. Perfect for catching trend exhaustion and potential corrections.
### 💛 Cumulative Delta Line (Yellow)
The heart of the indicator. This line accumulates all delta pressure over your selected period. Rising = bullish momentum building. Falling = bearish pressure intensifying.
### 📊 Delta Bars
Individual bar pressure shown as histogram. Each bar tells you the exact buy/sell imbalance for that candle. Track momentum strength in real-time.
### 🕯️ Wick Analysis
Upper wicks show rejected resistance (seller pressure). Lower wicks reveal bounces from support (buyer pressure). Critical for spotting reversals before they happen.
### ⚡ Extreme Zones (Red & Green Lines)
Auto-calculated overbought and oversold levels. When delta enters these zones, market reversal becomes highly probable. Perfect for taking profits or entering counter-trades.
---
## WHY TRADERS LOVE IT
✅ **5 Hybrid Algorithms** - Switch between different delta calculation methods (Price Position, Wick-Corrected, Close-Open Ratio, Classic, or Full Hybrid)
✅ **Adaptive Technology** - Works perfectly on ANY timeframe and market condition (calm days, volatile days, crypto rallies, forex ranges)
✅ **Spot & Futures Ready** - Whether you trade Bitcoin spot on Binance or micro contracts, this indicator adapts seamlessly
✅ **Real-Time Alerts** - 5 automated alerts catch key turning points so you never miss a setup
✅ **Professional Dashboard** - Live metrics table shows bar delta, cumulative delta, wicks, zone status, and trend at a glance
✅ **Bilingual** - English and Russian interface. Switch languages in settings instantly
✅ **No Repainting** - Calculated from pure OHLCV data. Reliable backtesting. No fake signals
---
## KEY SETTINGS EXPLAINED
### 🧠 DELTA ALGORITHM (Core Feature)
- **Hybrid** (Recommended) - Combines price position (70%) + wick analysis (30%) for maximum accuracy
- **Price Position** - Pure price location in the range (simple & effective)
- **Wick Corrected** - Focuses on rejected pressure (great for reversals)
- **Close-Open** - Traditional bar momentum
- **Classic** - Standard fixed ratio method
### 📊 AGGREGATION TYPE
- **Sum** (Default) - Total delta over period (best for signals)
- **SMA** - Smoothed average (cleaner chart)
- **EMA** - Exponential weighted (faster response)
- **Cumulative** - Pure running total (academic analysis)
### 🤖 ADAPTIVE MODES
- **ATR-Based** (Recommended) - Adjusts to volatility using Average True Range
- **Volatility-Based** - Uses standard deviation for adaptation
- **Range-Based** - Adjusts to candle size
**Why adaptive?** Because a signal on a calm day is different from a signal on an explosive rally. The indicator learns your market and adapts automatically.
### ⚡ CUSTOMIZATION
- Change all colors to match your chart theme
- Adjust zone sensitivity (manual or auto)
- Choose number format (K, M, B notation or full numbers)
- Display in USD or volume units
- Pick table position (9 locations available)
- Set font size (tiny to huge)
---
## WHAT YOU GET AT A GLANCE
**The Live Metrics Table Shows:**
- Current bar delta (buy vs sell pressure RIGHT NOW)
- Cumulative delta (accumulated pressure over time)
- Delta % (strength of pressure as a percentage)
- Upper wick (rejected resistance)
- Lower wick (bounces from support)
- Adaptive coefficient (volatility multiplier)
- Zone status (OVERBOUGHT / NORMAL / OVERSOLD)
- Trend direction (RISING / FALLING / FLAT)
**All updated in real-time. All on one clean dashboard.**
---
## THE 5 TRADING SIGNALS
1. **Zero Cross Alert** - Cumulative delta crosses zero = momentum shift detected
2. **Overbought Alert** - Enters red zone = buyers exhausted, sell signal
3. **Oversold Alert** - Enters green zone = sellers exhausted, buy signal
4. **Bullish Delta** - Bar delta turns positive = buying starts
5. **Bearish Delta** - Bar delta turns negative = selling starts
**Each alert can trigger notifications on your phone. Never miss a setup again.**
---
## WHO SHOULD USE THIS?
✅ **Crypto Traders** - Bitcoin, Ethereum, Altcoins (spot and futures)
✅ **Forex Traders** - EUR/USD, GBP/USD, and all pairs
✅ **Scalpers** - 1m-5m timeframes with instant alerts
✅ **Day Traders** - 15m-1h for quick reversals and continuations
✅ **Swing Traders** - 4h-1d for major trend changes
✅ **Position Traders** - Weekly/monthly for macro reversals
**Works on all timeframes. All markets. All strategies.**
---
## WHAT MAKES IT DIFFERENT?
While 99% of volume indicators just show raw volume, **Cumulative Hybrid Delta** does something revolutionary:
- It separates BUYING volume from SELLING volume with precision
- It accumulates this pressure to show market intention
- It adapts to your specific market and timeframe
- It alerts you to extremes before they reverse
- It works on crypto, forex, stocks, futures — everything
**This is what institutional traders pay thousands for. Now it's free.**
---
## QUICK START
1. Add to chart (search "Cumulative Hybrid Delta" on TradingView)
2. Open settings
3. Choose your algorithm (recommend starting with "Hybrid")
4. Set your timeframe
5. Watch the magic happen
**First signal comes within minutes. First reversal catch comes today.**
---
## PROVEN ON
✅ Bitcoin (1m, 5m, 15m, 1h, 4h, 1d)
✅ Altcoins (Ethereum, Solana, XRP, and 100+ pairs)
✅ Forex (EURUSD, GBPUSD, GOLD, CRYPTO pairs)
✅ All exchanges (Binance, OKX, Bybit, Coinbase, Kraken)
✅ All market conditions (bullish, bearish, ranging, volatile)
---
## START TRADING SMARTER TODAY
Stop trading blind. Stop guessing market direction.
**Cumulative Hybrid Delta** shows you exactly where the power is. Whether buyers or sellers are winning. When reversals are coming. When to enter. When to take profit.
**Download now. Change your trading forever.**
---
## FEATURES SNAPSHOT
| Feature | Details |
|---------|---------|
| **Algorithms** | 5 professional delta calculation methods |
| **Timeframes** | 1m to 1M (all supported) |
| **Markets** | Crypto, Forex, Stocks, Futures, Commodities |
| **Alerts** | 5 automated trading signals |
| **Adaptation** | 3 automatic market-condition adjustments |
| **Languages** | English & Russian |
| **Customization** | 50+ adjustable settings |
| **Dashboard** | 9-metric live table with zone status |
| **Colors** | Fully customizable to match any chart |
| **Performance** | Zero repainting, pure OHLCV calculation |
---
---
## READY TO DOMINATE?
**Your edge is waiting.**
This indicator gives professional-grade volume analysis at zero cost. Institutional traders charge thousands for this insight. You get it free.
**Download Cumulative Hybrid Delta now and see what professional traders see.**
---
*Cumulative Hybrid Delta - Where Smart Money Meets Retail Traders*
**Available exclusively on TradingView. Free. Forever. No subscription. No hidden costs.**

Orderblocks & BreakersThis indicator identifies potential orderblocks and breakers based on recent swing highs and lows. It is built to offer a structured, customizable, and noise-controlled view of how price interacts with supply and demand levels.
The script applies pivot-based swing detection to identify swing highs and lows.
Bullish Orderblocks: The script Identifies and stores the last down candle before a swing high is breached and confirms and plots the orderblock with a market structure break (close above the swing high).
Bearish Orderblocks: The script Identifies and stores the last up candle before a swing low is breached and confirms and plots the orderblock with a market structure break (close below the swing low).
When price later closes through an existing orderblock, it is reclassified as a Breaker and recolored accordingly. (all colors can be changed in the settings)
What Makes It Different
Unlike most orderblock tools that simply mark every swing-based block, this version introduces:
1. Chop Control – automatically hides breakers that price repeatedly closes through (2 closes after the orderblock becomes a breaker), keeping only relevant zones visible.
2. Recent Block Filtering – limits how many of the recent orderblocks or breakers are displayed, preventing chart clutter.
3. Dynamic Updating – orderblocks automatically convert to breakers when price closes beyond them, with clear color changes.
These features make it easier to study cleaner price structure without manually managing old or invalid zones. The optional Chop Control filter can reduce overlapping or repeatedly invalidated zones to keep the chart clearer.
Customizable Parameters
- Swing detection length (shorter means more aggressive pivot detection, longer means less aggressive so less highs/lows detected)
- Number of recent blocks to display
- Visibility toggles for orderblocks or breakers
- Color and transparency controls for each type
Alerts
Alerts can be set to trigger when price tests any defined zone.
Purpose
This indicator is designed as a price structure visualization and study tool.
It may assist in understanding how price interacts with previously active regions, but it does not produce signals or trade recommendations.

ZZ TRADERS📌 ZZ Traders ALGO – Smart Trading Companion for Every Timeframe
Introducing "ZZ Traders ALGO" – a precision-built, multi-timeframe algorithm designed for GOLD traders who value accuracy, efficiency, and real-time insights.
🔹 Universal Timeframe Compatibility:
Works seamlessly across all timeframes – from scalping the 1-minute chart to analyzing long-term trends on the daily and weekly levels.
🔹 Optimized for XAU/USD (Gold):
Specially tuned to capture the unique volatility and price behavior of gold. Get smarter entries and exits with confidence.
🔹 Algorithmic Insights:
Built on advanced price action and custom logic to detect potential reversals, trend strength, and key market zones.
🔹 Simple Yet Powerful:
Clean visuals, minimal noise – just the signals that matter. Designed for both beginner and experienced traders.
🔹 Ideal for Scalping, Intraday & Swing Trading:
Whether you're in and out quickly or holding positions, ZZ Traders ALGO adapts to your style.
📈 Developed by Professional Traders, for Traders – because precision matters.
📩 For inquiries or access, contact me on WhatsApp: +92 300 8339822

ZZ Traders ALGO📌 ZZ Traders ALGO – Smart Trading Companion for Every Timeframe
Introducing "ZZ Traders ALGO" – a precision-built, multi-timeframe algorithm designed for GOLD traders who value accuracy, efficiency, and real-time insights.
🔹 Universal Timeframe Compatibility:
Works seamlessly across all timeframes – from scalping the 1-minute chart to analyzing long-term trends on the daily and weekly levels.
🔹 Optimized for XAU/USD (Gold):
Specially tuned to capture the unique volatility and price behavior of gold. Get smarter entries and exits with confidence.
🔹 Algorithmic Insights:
Built on advanced price action and custom logic to detect potential reversals, trend strength, and key market zones.
🔹 Simple Yet Powerful:
Clean visuals, minimal noise – just the signals that matter. Designed for both beginner and experienced traders.
🔹 Ideal for Scalping, Intraday & Swing Trading:
Whether you're in and out quickly or holding positions, ZZ Traders ALGO adapts to your style.
📈 Developed by Professional Traders, for Traders – because precision matters.
📩 For inquiries or access, contact me on WhatsApp: +92 300 8339822
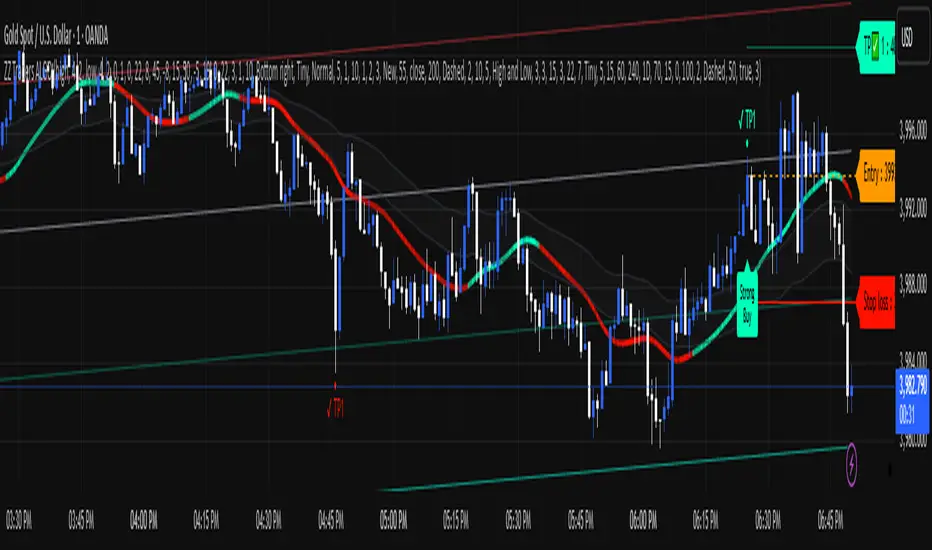
MWABUFX with EMA 238 LogicBMM V2 Scalping
BMM V2 Scalping
The upgraded BMM Version 2 Scalping tool is built for traders who demand speed, precision, and clarity in fast-moving markets.
Optimized for lower timeframes (1m, 3m, 5m, and 15m), this version combines:
Real-Time Scalping Signals – Instant buy/sell alerts with minimal lag.
Multi-Timeframe Confirmation – Aligns your entries with higher timeframe trends for higher probability trades.
Dynamic Take Profit & Stop Loss Levels – Auto-plotted R:R zones to plan exits without guesswork.
Smart Noise Filtering – Reduces false signals in choppy price action.
Session-Based Scalping Mode – Focus on London, New York, or Asian sessions for better market rhythm.
Whether you’re catching 10 pips on forex or quick points on indices, BMM V2 Scalping is designed to help you enter fast, manage risk smartly, and exit with confidence.
📌 For educational use only. Not financial advice.

Info Panel (RSI, ADX, Volume,EMA, Delta)📊 Info Panel PRO — All-in-One Trader Dashboard
Simplify market analysis at a glance.
This powerful indicator displays key market metrics in a compact, customizable table directly overlaid on your chart — ideal for day trading, scalping, and swing trading strategies.
🔍 What’s Included:
✅ RSI (Relative Strength Index) — Measures overbought/oversold conditions.
✅ ADX (Average Directional Index) — Gauges trend strength (>25 = strong trend).
✅ Price vs 200 EMA on 4H timeframe — Strategic support/resistance level for multi-timeframe context.
✅ Current Bar Volume — Color-coded to reflect bullish/bearish sentiment.
✅ Volume Delta — Net buying/selling pressure on your chosen timeframe (default: 1 minute).
✅ CVD (Cumulative Volume Delta) — Daily running total of delta, resets each new trading day.
⚙️ Fully Customizable Settings:
Adjustable lengths for RSI, ADX, and EMA.
Select delta calculation timeframe — lower = more granular (e.g., “1” for 1-minute precision).
Table position: top/bottom left/right corners.
Color themes: Customize bullish, bearish, and neutral colors to match your style.
💡 Who Is This For?
Scalpers & Day Traders needing real-time market context without clutter.
Swing & Position Traders monitoring higher-timeframe structure and momentum.
Order Flow & Volume Analysts tracking buyer/seller imbalance via delta and CVD.
Beginners learning to read markets through consolidated, intuitive indicators.
🎯 Key Benefits:
✅ Clean, minimalist UI — stays out of your way while delivering critical data.
✅ Auto-formatting for large numbers (K, M, B) — easy readability.
✅ Visual cues (arrows, color coding) for instant decision-making.
✅ Works across all markets: Forex, Stocks, Crypto, Futures.
📌 How to Use:
Add the indicator to your chart.
Tweak settings to fit your trading style.
Monitor real-time updates — all essential metrics visible in one place.
Combine with other strategies (price action, S/R, VWAP) for signal confirmation.
📌 Pro Tip: For maximum edge, pair Info Panel PRO with liquidity zones, VWAP, or Market Profile tools.
📈 Trade smarter — let the market speak to you in clear, actionable terms.
Author:
Version: 1.0
Language: Pine Script v5
Overlay: Yes (draws directly on price chart)
😄
“If this indicator were a person, they’d be called ‘The One Who Knows Everything… But Never Gives Unsolicited Advice.’
…Unlike your ‘friend’ who yells ‘BUY!’ five minutes before the market crashes.”
“A good trader isn’t the one who predicts the market.
It’s the one who has everything on their chart — coffee optional.
…Want the next indicator? Comment ‘YES’ below — and I’ll build you ‘Smart Alert PRO’ or ‘Volume Sniper’ next.”
P.S. If this script saves even ONE trade — hit 👍.
If it saves TWO — comment “THANK YOU” 🙏
If it saves THREE — expect “Volume Heatmap PRO” next week 😉🔥

Yelober - Market Internal direction+ Key levelsYelober – Market Internals + Key Levels is a focused intraday trading tool that helps you spot high-probability price direction by anchoring decisions to structure that matters: yesterday’s RTH High/Low, today’s pre-market High/Low, and a fast Value Area/POC from the prior session. Paired with a compact market internals dashboard (NYSE/NASDAQ UVOL vs. DVOL ratios, VOLD slopes, TICK/TICKQ momentum, and optional VIX trend), it gives you a real-time read on breadth so you can choose which direction to trade, when to enter (breaks, retests, or fades at PMH/PML/VAH/VAL/POC), and how to plan exits as internals confirm or deteriorate. On top of these intraday decision benefits, it also allows traders—in a very subtle but powerful way—to keep an eye on the VIX and immediately recognize significant spikes or sharp decreases that should be factored in before entering a trade, or used as a quick signal to modify an existing position. In short: clear levels for the chart, live internals for the context, and a smarter, rules-based path to execution.
# Yelober – Market Internals + Key Levels
*A TradingView indicator for session key levels + real‑time market internals (NYSE/NASDAQ TICK, UVOL/DVOL/VOLD, and VIX).*
**Script name in Pine:** `Yelober - Market Internal direction+ Key levels` (Pine v6)
---
## 1) What this indicator does
**Purpose:** Help intraday traders quickly find high‑probability reaction zones and read market internals momentum without switching charts. It overlays yesterday/today’s **automatic price levels** on your active chart and shows a **market breadth table** that summarizes NYSE/NASDAQ buying pressure and TICK direction, with an optional VIX trend read.
### Key features at a glance
* **Automatic Price Levels (overlay on chart)**
* Yesterday’s High/Low of Day (**yHoD**, **yLoD**)
* Extended Hours High/Low (**yEHH**, **yEHL**) across yesterday AH + today pre‑market
* Today’s Pre‑Market High/Low (**PMH**, **PML**)
* Yesterday’s **Value Area High/Low** (**VAH/VAL**) and **Point of Control (POC)** computed from a volume profile of yesterday’s **regular session**
* Smart de‑duplication:
* Shows **only the higher** of (yEHH vs PMH) and **only the lower** of (yEHL vs PML) to avoid redundant bands
* **Market Breadth Table (on‑chart table)**
* **NYSE ratio** = UVOL/DVOL (signed) with **VOLD slope** from session open
* **NASDAQ ratio** = UVOLQ/DVOLQ (signed) with **VOLDQ slope** from session open
* **TICK** and **TICKQ**: live cumulative ratio and short‑term slope
* **VIX** (optional): current value + slope over a configurable lookback/timeframe
* Color‑coded trends with sensible thresholds and optional normalization
---
## 2) How to use it (trader workflow)
1. **Mark your reaction zones**
* Watch **yHoD/yLoD**, **PMH/PML**, and **VAH/VAL/POC** for first touches, break/retest, and failure tests.
* Expect increased responsiveness when multiple levels cluster (e.g., PMH ≈ VAH ≈ daily pivot).
2. **Read the breadth panel for context**
* **NYSE/NASDAQ ratio** (>1 = more up‑volume than down‑volume; <−1 = down‑dominant). Strong green across both favors long setups; red favors short setups.
* **VOLD slopes** (NYSE & NASDAQ): positive and accelerating → broadening participation; negative → persistent pressure.
* **TICK/TICKQ**: cumulative ratio and **slope arrows** (↗ / ↘ / →). Use the slope to gauge **near‑term thrust or fade**.
* **VIX slope**: rising VIX (red) often coincides with risk‑off; falling VIX (green) with risk‑on.
3. **Confluence = higher confidence**
* Example: Price reclaims **PMH** while **NYSE/NASDAQ ratios** print green and **TICK slopes** point ↗ — consider break‑and‑go; if VIX slope is ↘, that adds risk‑on confidence.
* Example: Price rejects **VAH** while **VOLD slopes** roll negative and VIX ↗ — consider fade/reversal.
4. **Risk management**
* Place stops just beyond key levels tested; if breadth flips, tighten or exit.
> **Timeframes:** Works best on 1–15m charts for intraday. Value Area is computed from **yesterday’s RTH**; choose a smaller calculation timeframe (e.g., 5–15m) for stable profiles.
---
## 3) Inputs & settings (what each option controls)
### Global Style
* **Enable all automatic price levels**: master toggle for yHoD/yLoD, yEHH/yEHL, PMH/PML, VAH/VAL/POC.
* **Line style/width**: applies to all drawn levels.
* **Label size/style** and **label color linking**: use the same color as the line or override with a global label color.
* **Maximum bars lookback**: how far the script scans to build yesterday metrics (performance‑sensitive).
### Value Area / Volume Profile
* **Enable Value Area calculations** *(on by default)*: computes yesterday’s **POC**, **VAH**, **VAL** from a simplified intraday volume profile built from yesterday’s **regular session bars**.
* **Max Volume Profile Points** *(default 50)*: lower values = faster; higher = more precise.
* **Value Area Calculation Timeframe** *(default 15)*: the security timeframe used when collecting yesterday’s highs/lows/volumes.
### Individual Level Toggles & Colors
* **yHoD / yLoD** (yesterday high/low)
* **yEHH / yEHL** (yesterday AH + today pre‑market extremes)
* **PMH / PML** (today pre‑market extremes)
* **VAH / VAL / POC** (yesterday RTH value area + point of control)
### Market Breadth Panel
* **Show NYSE / NASDAQ / VIX**: choose which series to display in the table.
* **Table Position / Size / Background Color**: UI placement and legibility.
* **Slope Averaging Periods** *(default 5)*: number of recent TICK/TICKQ ratio points used in slope calculation.
* **Candles for Rate** *(default 10)* & **Normalize Rate**: VIX slope calculation as % change between `now` and `n` candles ago; normalize divides by `n`.
* **VIX Timeframe**: optionally compute VIX on a higher TF (e.g., 15, 30, 60) for a smoother regime read.
* **Volume Normalization** (NYSE & NASDAQ): display VOLD slopes scaled to `tens/thousands/millions/10th millions` for readable magnitudes; color thresholds adapt to your choice.
---
## 4) Data sources & definitions
* **UVOL/VOLD (NYSE)** and **UVOLQ/DVOLQ/VOLDQ (NASDAQ)** via `request.security()`
* **Ratio** = `UVOL/DVOL` (signed; negative when down‑volume dominates)
* **VOLD slope** ≈ `(VOLD_now − VOLD_open) / bars_since_open`, then normalized per your setting
* **TICK/TICKQ**: cumulative sum of prints this session with **positives vs negatives ratio**, plus a simple linear regression **slope** of the last `N` ratio values
* **VIX**: value and slope across a user‑selected timeframe and lookback
* **Sessions (EST/EDT)**
* **Regular:** 09:30–16:00
* **Pre‑Market:** 04:00–09:30
* **After Hours:** 16:00–20:00
* **Extended‑hours extremes** combine **yesterday AH** + **today PM**
> **Note:** All session checks are done with TradingView’s `time(…,"America/New_York")` context. If your broker’s RTH differs (e.g., futures), adjust expectations accordingly.
---
## 5) How the algorithms work (plain English)
### A) Key Levels
* **Yesterday’s RTH High/Low**: scans yesterday’s bars within 09:30–16:00 and records the extremes + bar indices.
* **Extended Hours**: scans yesterday AH and today PM to get **yEHH/yEHL**. Script shows **either yEHH or PMH** (whichever is **higher**) and **either yEHL or PML** (whichever is **lower**) to avoid duplicate bands stacked together.
* **Value Area & POC (RTH only)**
* Build a coarse volume profile with `Max Volume Profile Points` buckets across the price range formed by yesterday’s RTH bars.
* Distribute each bar’s volume uniformly across the buckets it spans (fast approximation to keep Pine within execution limits).
* **POC** = bucket with max volume. **VA** expands from POC outward until **70%** of cumulative volume is enclosed → yields **VAH/VAL**.
### B) Market Breadth Table
* **NYSE/NASDAQ Ratio**: signed UVOL/DVOL with basic coloring.
* **VOLD Slopes**: from session open to current, normalized to human‑readable units; colors flip green/red based on thresholds that map to your normalization setting (e.g., ±2M for NYSE, ±3.5×10M for NASDAQ).
* **TICK/TICKQ Slope**: linear regression over the last `N` ratio points → **↗ / → / ↘** with the rounded slope value.
* **VIX Slope**: % change between now and `n` candles ago (optionally divided by `n`). Red when rising beyond threshold; green when falling.
---
## 6) Recommended presets
* **Stocks (liquid, intraday)**
* Value Area **ON**, `Max Volume Points` = **40–60**, **Timeframe** = **5–15**
* Breadth: show **NYSE & NASDAQ & VIX**, `Slope periods` = **5–8**, `Candles for rate` = **10–20**, **Normalize VIX** = **ON**
* **Index futures / very high‑volume symbols**
* If you see Pine timeouts, set `Max Volume Points` = **20–40** or temporarily **disable Value Area**.
* Keep breadth panel **ON** (it’s light). Consider **VIX timeframe = 15/30** for regime clarity.
---
## 7) Tips, edge cases & performance
* **Performance:** The volume profile is capped (`maxBarsToProcess ≤ 500` and bucketed) to keep it responsive. If you experience slowdowns, reduce `Max Volume Points`, `Maximum bars lookback`, or disable Value Area.
* **Redundant lines:** The script **intentionally suppresses** PMH/PML when yEHH/yEHL are more extreme, and vice‑versa.
* **Label visibility:** Use `Label style = none` if you only want clean lines and read values from the right‑end labels.
* **Futures/RTH differences:** Value Area is from **yesterday’s RTH** only; for 24h instruments the RTH period may not reflect overnight structure.
* **Session transitions:** PMH/PML tracking stops as soon as RTH starts; values persist as static levels for the session.
---
## 8) Known limitations
* Uses public TradingView symbols: `UVOL`, `VOLD`, `UVOLQ`, `DVOLQ`, `VOLDQ`, `TICK`, `TICKQ`, `VIX`. If your data plan or region limits any symbol, the corresponding table rows may show `na`.
* The VA/POC approximation assumes uniform distribution of each bar’s volume across its high–low. That’s fast but not a tick‑level profile.
* Works best on US equities with standard NY session; alternative sessions may need code changes.
---
## 9) Troubleshooting
* **“Script is too slow / timed out”** → Lower `Max Volume Points`, lower `Maximum bars lookback`, or toggle **OFF** `Enable Value Area calculations` for that instrument.
* **Missing breadth values** → Ensure the symbols above load on your account; try reloading chart or switching timeframes once.
* **Overlapping labels** → Set `Label style = none` or reduce label size.
---
## 10) Version / license / contribution
* **Version:** Initial public release (Pine v6).
* **Author:** © yelober
* **License:** Free for community use and enhancement. Please keep author credit.
* **Contributing:** Open PRs/ideas: presets, alert conditions, multi‑day VA composites, optional mid‑value (`(VAH+VAL)/2`), session filter for futures, and alertable state machine for breadth regime transitions.
---
## 11) Quick start (TL;DR)
1. Add the indicator and **keep default settings**.
2. Trade **reactions** at yHoD/yLoD/PMH/PML/VAH/VAL/POC.
3. Use the **breadth table**: look for **green ratios + ↗ slopes** (risk‑on) or **red ratios + ↘ slopes** (risk‑off). Check **VIX** slope for confirmation.
4. Manage risk around levels; when breadth flips against you, tighten or exit.
---
### Changelog (public)
* **v1.0:** First community release with automatic RTH levels, VA/POC approximation, breadth dashboard (NYSE/NASDAQ/TICK/TICKQ/VIX) with normalization and adaptive color thresholds.

Watermark [TakingProphets] Watermark
A fully customizable watermark & chart info panel to keep your charts branded, organized, and informative — without clutter.
Special thanks to for inspiring the original concept that led to this expanded version.
📌 Overview
Perfect for:
Traders who stream, record, or share charts
Keeping essential info (symbol, TF, date, price) visible
Intraday traders who want day-of-week labels without messy vertical lines
✨ Key Features
1. Personal Watermark
Custom text, colors, size, opacity
Position anywhere: Top, Middle, Bottom × Left, Center, Right
Alignment options: left, center, right
Optional border with adjustable color or hide completely
2. Chart Info Panel
Show any combination of:
Custom text
Symbol
Timeframe (auto-formatted)
Date (MM-DD-YYYY)
Last price
Day of the week
Position independently from watermark
Adjustable background opacity
3. Day-of-Week Labels
Labels Sunday → Saturday at session start or midday
Works on intraday ≤ 15m timeframes
Option to hide weekends
Place labels Top or Bottom
⚙️ How to Use
Enable Watermark → Personal Watermark Settings → Toggle Show Watermark, enter your text, style it.
Set Up Info Panel → Chart Information Panel → Select details, choose position, adjust style.
Add Day Labels → Day of Week Labels Settings → Turn on for intraday charts.
💡 Tips
Lower background opacity for a subtle look.
Use bright colors for streaming so your brand stands out.
Hide unused features to keep charts clean & fast.
🙏 Acknowledgments
This script’s concept was inspired by toodegrees.
Developed by TakingProphets — tools for traders who value clarity, precision, and style.
⚠️ Disclaimer:
This script is for informational purposes only. It is not financial advice. Always trade responsibly and manage your risk.

Impulse Alert - Demand (Buy) [Fixed]🔵 Impulse Alert – Demand (Buy)
This indicator is designed to detect high-probability Demand Zones based on impulsive bullish price action, helping traders get alerted only when it matters most.
🧠 Core Logic:
Scans the chart for 2 consecutive bullish impulsive candles with significant range (body size)
Also captures single large bullish impulse candles that often mark institutional buying
Marks the origin of the move as a potential Demand Zone
Sends alerts when such bullish setups form, allowing you to monitor charts passively
⚙️ Features:
✅ Alerts on impulsive move formations
✅ Detects both 2-candle and single-candle impulses
✅ Custom zone detection logic based on pip size and momentum
✅ Cleaner & smarter: removes distractions and avoids false signals
📌 Best Used For:
Smart Money / Supply & Demand traders
Identifying potential institutional buy zones
Executing trades with HTF confluence
Traders who want to get alerted without screen-watching
🔁 Suggested Strategy:
Set HTF directional bias (H1, H4, D1)
Use this indicator on LTF (1M–15M) for impulsive bullish entries
Wait for price to return to the marked zone for low-risk entries
💡 Pro Tip: Combine with your Supply Zone (Sell) indicator to track both sides of market structure and increase R:R
👤 Created by: Rohit Jadhav | YT/Insta/X - @GrowthByTrading
📬 Want updates, enhancements, or personal versions? Leave feedback or reach out through profile!
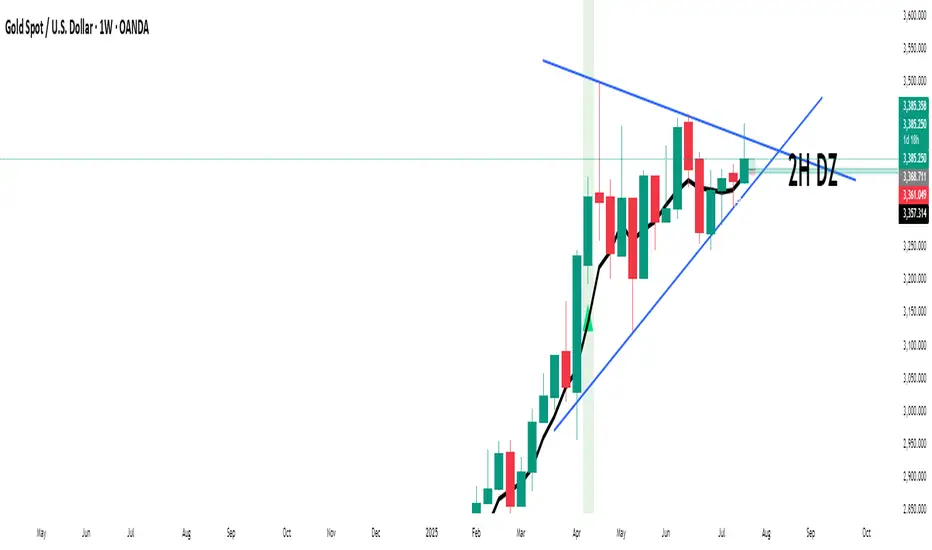
Logistic Regression ICT FVG🚀 OVERVIEW
Welcome to the Logistic Regression Fair Value Gap (FVG) System — a next-gen trading tool that blends precision gap detection with machine learning intelligence.
Unlike traditional FVG indicators, this one evolves with each bar of price action, scoring and filtering gaps based on real market behavior.
🔧 CORE FEATURES
✨ Smart Gap Detection
Automatically identifies bullish and bearish Fair Value Gaps using volatility-aware candle logic.
📊 Probability-Based Filtering
Uses logistic regression to assign each gap a confidence score (0 to 1), showing only high-probability setups.
🔁 Real-Time Retest Tracking
Continuously watches how price interacts with each gap to determine if it deserves respect.
📈 Multi-Factor Assessment
Evaluates RSI, MACD, and body size at gap formation to build a full context snapshot.
🧠 Self-Learning Engine
The logistic regression model updates on each bar using gradient descent, refining its predictions over time.
📢 Built-In Alerts
Get instant alerts when a gap forms, gets retested, or breaks.
🎨 Custom Display Options
Control the color of bullish/bearish zones, and toggle on/off probability labels for cleaner charts.
🚩 WHAT MAKES IT DIFFERENT
This isn’t just another box-drawing indicator.
While others mark every imbalance, this system thinks before it draws — using statistical modeling to filter out noise and prioritize high-impact zones.
By learning from how price behaves around gaps (not just how they form), it helps you trade only what matters — not what clutters.
⚙️ HOW IT WORKS
1️⃣ Detection
FVGs are identified using ATR-based thresholds and sharp wick imbalances.
2️⃣ Behavior Monitoring
Every gap is tracked — and if respected enough times, it becomes part of the elite training set.
3️⃣ Context Capture
Each new FVG logs RSI, MACD, and body size to provide a feature-rich context for prediction.
4️⃣ Prediction (Logistic Regression)
The model predicts how likely the gap is to be respected and assigns it a probability score.
5️⃣ Classification & Alerts
Gaps above the threshold are plotted with score labels, and alerts trigger for entry/respect/break.
⚙️ CONFIGURATION PANEL
🔧 System Inputs
• Max Retests – How many times a gap must be respected to train the model
• Prediction Threshold – Minimum score to show a gap on the chart
• Learning Rate – Controls how fast the model adapts (default: 0.009)
• Max FVG Lifetime – Expiration duration for unused gaps
• Show Historic Gaps – Show/hide expired or invalidated gaps
🎨 Visual Options
• Bullish/Bearish Colors – Set gap colors to fit your chart style
• Confidence Labels – Show probability scores next to FVGs
• Alert Toggles – Enable alerts for:
– New FVG detected
– FVG respected (entry)
– FVG invalidated (break)
💡 WHY LOGISTIC REGRESSION?
Traditional FVG tools rely on candle shapes.
This system relies on probability — by training on RSI, MACD, and price behavior, it predicts whether a gap will act as a true liquidity zone.
Logistic regression lets the system continuously adapt using new data, making it more accurate the longer it runs.
That means smarter signals, fewer false positives, and a clearer view of where real opportunities lie.

All SMAs Bullish/Bearish Screener (Enhanced)All SMAs Bullish/Bearish Screener Enhanced: Uncover High-Conviction Trend Alignments with Confidence
Description:
Are you ready to elevate your trading from mere guesswork to precise, data-driven decisions? The "All SMAs Bullish/Bearish Screener Enhanced" is not just another indicator; it's a sophisticated, yet user-friendly, trend-following powerhouse designed to cut through market noise and pinpoint high-probability trading opportunities. Built on the foundational strength of comprehensive Moving Average confluence and fortified with critical confirmation signals from Momentum, Volume, and Relative Strength, this script empowers you to identify truly robust trends and manage your trades with unparalleled clarity.
The Power of Multi-Factor Confluence: Beyond Simple Averages
In the unpredictable world of financial markets, true strength or weakness is rarely an isolated event. It's the harmonious alignment of multiple technical factors that signals a high-conviction move. While our original "All SMAs Bullish/Bearish Screener" intelligently identified stocks where price was consistently above or below a full spectrum of Simple Moving Averages (5, 10, 20, 50, 100, 200), this Enhanced version takes it a crucial step further.
We've integrated a powerful three-pronged confirmation system to filter out weaker signals and highlight only the most compelling setups:
Momentum (Rate of Change - ROC): A strong trend isn't just about price direction; it's about the speed and intensity of that movement. Positive momentum confirms that buyers are still aggressively pushing price higher (for bullish signals), while negative momentum validates selling pressure (for bearish signals).
Volume: No trend is truly trustworthy without the backing of smart money. Above-average volume accompanying an "All SMAs" alignment signifies strong institutional participation and conviction behind the move. It separates genuine trend starts from speculative whims.
Relative Strength Index (RSI): This versatile oscillator ensures the trend isn't just "there," but that it's developing healthily. We use RSI to confirm a bullish bias (above 50) or a bearish bias (below 50), adding another layer of confidence to the direction.
When the price aligns above ALL six critical SMAs, and is simultaneously confirmed by robust positive momentum, healthy volume, and a bullish RSI bias, you have an exceptionally strong "STRONGLY BULLISH" signal. This confluence often precedes sustained upward moves, signaling prime accumulation phases. Conversely, a "STRONGLY BEARISH" signal, where price is below ALL SMAs with negative momentum, confirming volume, and a bearish RSI bias, indicates powerful distribution and potential for significant downside.
How to Use This Enhanced Screener:
Add to Chart: Go to TradingView's Pine Editor, paste the script, and click "Add to Chart."
Customize Parameters: Fine-tune the lengths of your SMAs, RSI, Momentum, and Volume averages via the indicator's settings. Experiment to find what best suits your trading style and the assets you trade.
Choose Your Timeframe Wisely:
Daily (1D) and 4-Hour (240 min) are highly recommended. These timeframes cut through intraday noise and provide more reliable, actionable signals for swing and position trading.
Shorter timeframes (e.g., 15min, 60min) can be used by advanced day traders for very short-term entries, but be aware of increased volatility and noise.
Visual Confirmation:
Green/Red Triangles: Appear on your chart, indicating confirmed bullish or bearish signals.
Background Color: The chart background will subtly turn lime green for "STRONGLY BULLISH" and red for "STRONGLY BEARISH" conditions.
On-Chart Status Table: A clear table displays the current signal status ("STRONGLY BULLISH/BEARISH," or "SMAs Mixed") for immediate feedback.
Set Up Alerts (Your Primary Screener Tool): This is the game-changer! Create custom alerts on TradingView based on the "Confirmed Bullish Trade" and "Confirmed Bearish Trade" conditions. Receive instant notifications (email, pop-up, mobile) for any stock in your watchlist that meets these stringent criteria. This allows you to scan the entire market effortlessly and act decisively.
Strategic Stop-Loss Placement: The Trader's Lifeline
Even the most robust signals can fail. Protecting your capital is paramount. For this trend-following strategy, your stop-loss should be placed where the underlying trend structure is broken.
For a "STRONGLY BULLISH" Trade: Place your stop-loss just below the most recent significant swing low (higher low). This is the last point where buyers stepped in to support the price. If price breaks below this, your bullish thesis is invalidated.
For a "STRONGLY BEARISH" Trade: Place your stop-loss just above the most recent significant swing high (lower high). If price breaks above this, your bearish thesis is invalidated.
Alternatively, consider placing your stop-loss just below the 20-period SMA (for bullish trades) or above the 20-period SMA (for bearish trades). A significant close beyond this intermediate-term average often indicates a critical shift in momentum. Always ensure your chosen stop-loss adheres to your pre-defined risk per trade (e.g., 1-2% of capital).
Disciplined Profit Booking: Maximizing Gains
Just as important as knowing when you're wrong is knowing when to take profits.
Trailing Stop-Loss: As your trade moves into profit, trail your stop-loss upwards (for longs) or downwards (for shorts). You can trail it using:
Previous Swing Lows/Highs: Move your stop to just below each new higher low (for longs) or just above each new lower high (for shorts).
A Moving Average (e.g., 10-period or 20-period SMA): If price closes below your chosen trailing SMA, exit. This allows you to ride the trend while protecting accumulated profits.
Target Levels: Identify potential resistance levels (for longs) or support levels (for shorts) using pivot points, previous highs/lows, or Fibonacci extensions. Consider taking partial profits at these levels and letting the rest run with a trailing stop.
Loss of Confluence: If the "STRONGLY BULLISH/BEARISH" condition ceases to be met (e.g., RSI crosses below 50, or volume drops significantly), this can be a signal to reduce or exit your position, even if your stop-loss hasn't been hit.
The "All SMAs Bullish/Bearish Screener Enhanced" is your comprehensive partner in navigating the markets. By combining robust trend identification with critical confirmation signals and disciplined risk management, you're equipped to make smarter, more confident trading decisions. Add it to your favorites and unlock a new level of precision in your trading journey!
#PineScript #TradingView #SMA #MovingAverage #TrendFollowing #StockScreener #TechnicalAnalysis #Bullish #Bearish #QQQ #Momentum #Volume #RSI #SPY #TradingStrategy #Enhanced #Signals #Analysis #DayTrading #SwingTrading

Color Vario Moving Average RibbonColor Vario Moving Average Ribbon – Smart Trend & Momentum Tool for Traders
The Color Vario Moving Average Ribbon is a powerful and customizable indicator that combines trend analysis, momentum detection, and volume confirmation — all in one clean and intuitive design.
🔍 Key Features:
✅ Dynamic Moving Averages (Up to 4)
• Choose from SMA, EMA, WMA, VWMA, or SMMA.
• Each MA line changes color based on price position (above = bullish, below = bearish).
• Great for spotting trend direction and momentum shifts at a glance.
📏 Distance from MAs (Table Display)
• Real-time display of how far price is from each MA (in % and points).
• Helps you assess extension, pullback depth, or reversion potential quickly.
📈 ADR% (Average Daily Range)
• Calculates average volatility using high-low ranges.
• Useful for setting realistic targets, stops, and risk assessments.
🔊 RVol (Relative Volume)
• Compares current volume to the average of recent days.
• Highlights whether volume is above or below normal (green = strong, red = weak).
• Perfect for volume confirmation during entries or breakouts.
⚡ Yellow Dot Signal (Momentum Spike)
• Appears when:
• Price moves more than a custom % from the previous candle.
• Volume is higher than your defined minimum.
• A visual cue for strong price + volume moves, helping you catch momentum trades early.
🎨 UI Customization
• Light/Dark mode compatibility.
• Adjust table size and position for your layout preference.
⸻
🚀 Who Should Use This?
This indicator is ideal for:
• Swing Traders looking for clean trend signals
• Intraday Traders who rely on momentum and volume
• Positional Traders tracking price behavior around key MAs
⸻
📌 Final Words
The Color Vario MA Ribbon is more than just a ribbon — it’s a compact trend, momentum, and volume dashboard built for traders who need clarity and precision.
Whether you’re looking for cleaner entries, stronger confirmations, or smarter exits, this tool adds serious edge to your trading chart.
💬 Don’t forget to give your feedback in the comments!
Buy/Sell Ei - Premium Edition (Fixed Momentum)**📈 Buy/Sell Ei Indicator - Smart Trading System with Price Pattern Detection 📉**
**🔍 What is it?**
The **Buy/Sell Ei** indicator is a professional tool designed to identify **buy and sell signals** based on a combination of **candlestick patterns** and **moving averages**. With high accuracy, it pinpoints optimal entry and exit points in **both bullish and bearish trends**, making it suitable for forex pairs, stocks, and cryptocurrencies.
---
### **🌟 Key Features:**
✅ **Advanced Candlestick Pattern Detection**
✅ **Momentum Filter (Customizable consecutive candle count)**
✅ **Live Trade Mode (Instant signals for active trading)**
✅ **Dual MA Support (Fast & Slow MA with multiple types: SMA, EMA, WMA, VWMA)**
✅ **Date Filter (Focus on specific trading periods)**
✅ **Win/Loss Tracking (Performance analytics with success rate)**
---
### **🚀 Why Choose Buy/Sell Ei?**
✔ **Precision:** Reduces false signals with strict pattern rules.
✔ **Flexibility:** Works in both live trading and backtesting modes.
✔ **User-Friendly:** Clear labels and alerts for easy decision-making.
✔ **Adaptive:** Compatible with all timeframes (M1 to Monthly).
---
### **🛠 How It Works:**
1. **Trend Confirmation:** Uses MAs to filter trades in the trend’s direction.
2. **Pattern Recognition:** Detects "Ready to Buy/Sell" and confirmed signals.
3. **Momentum Check:** Optional filter for consecutive bullish/bearish candles.
4. **Live Alerts:** Labels appear instantly in Live Trade Mode.
---
### **📊 Ideal For:**
- **Day Traders** (Scalping & Intraday)
- **Swing Traders** (Medium-term setups)
- **Technical Analysts** (Backtesting strategies)
**🔧 Designed by Sahar Chadri | Optimized for TradingView**
**🎯 Trade Smarter, Not Harder!**

MTF PO (3TF)Title: SmartMA Multi-Timeframe Signal Strategy
Description (English):
This indicator provides buy/sell signals based on a multi-timeframe adaptive moving average. It allows traders to align short-term entries with higher time-frame trends. The script integrates a trend-following logic that reacts to price crossovers and adaptive MA slope, helping traders reduce noise and improve entry precision.
概要(日本語)
このインジケーターは、複数時間足の適応型移動平均線(SmartMA)を用いて売買シグナルを生成します。下位足でのエントリーが、上位足のトレンドと一致するよう設計されており、ノイズの除去とトレード精度の向上に貢献します。価格のクロスとMAの傾きを用いたトレンドフォロー型ロジックを搭載しています。
特徴
上位時間足の移動平均(SmartMA)と価格のクロスを検出
傾きフィルターによるトレンド整合性チェック
上位足に合わせて下位足のシグナルを制限
チャート上にシンプルなBuy/Sellラベルを表示
EMA, SMA, RMAなどのカスタム選択が可能
使用方法
チャートにインジケーターを追加し、上位足(例:1時間)と現在の時間足(例:5分)を設定
トレンド方向に沿ったタイミングでエントリーを検討
複数フィルターを用いることで、レンジ相場での誤認識を回避可能
注意事項
本インジケーターは補助的な分析ツールです。過去のパフォーマンスが将来を保証するものではありません。
スクリプトは再描画しない設計ですが、時間足の切り替え等で見た目が変わる可能性があります。
戦略構築には他のリスク管理指標との併用を推奨します。