Trend Signals with TP & SL [UAlgo] StrategyThe "Trend Signals with TP & SL Strategy" is a trading strategy designed to capture trend continuation signals while incorporating sophisticated risk management techniques. This strategy is tailored for traders who wish to capitalize on trending market conditions with precise entry and exit points, automatically calculating Take Profit (TP) and Stop Loss (SL) levels based on either Average True Range (ATR) or percentage values. The strategy aims to enhance trade management by preventing multiple simultaneous positions and dynamically adapting to changing market conditions.
This strategy is highly configurable, allowing traders to adjust sensitivity, the ATR calculation method, and the cloud moving average length. Additionally, the strategy can display buy and sell signals directly on the chart, along with visual representation of entry points, stop losses, and take profits. It also features a cloud-based trend analysis using a MACD-driven color fill that indicates the strength and direction of the trend.
🔶 Key Features
Configurable Trend Continuation Signals:
Source Selection: The strategy uses the midpoint of the high-low range as the default source, but it is adjustable.
Sensitivity: The sensitivity of the trend signals can be adjusted using a multiplier, ranging from 0.5 to 5.
ATR Calculation: The strategy allows users to choose between two ATR calculation methods for better adaptability to different market conditions.
Cloud Moving Average: Traders can adjust the cloud moving average length, which is used in conjunction with MACD to provide a visual trend indication.
Take Profit & Stop Loss Management:
ATR-Based or Percent-Based: The strategy offers flexibility in setting TP and SL levels, allowing traders to choose between ATR-based multipliers or fixed percentage values.
Dynamic Adjustment: TP and SL levels are dynamically adjusted according to the selected method, ensuring trades are managed based on real-time market conditions.
Prevention of Multiple Positions:
Single Position Control: To reduce risk and enhance strategy reliability, the strategy includes an option to prevent multiple positions from being opened simultaneously.
Visual Trade Indicators:
Buy/Sell Signals: Clearly displays buy and sell signals on the chart for easy interpretation.
Entry, SL, and TP Lines: Draws lines for entry price, stop loss, and take profit directly on the chart, helping traders to monitor trades visually.
Trend Cloud: A color-filled cloud based on MACD and the cloud moving average provides a visual cue of the trend’s direction and strength.
Performance Summary Table:
In-Chart Statistics: A table in the top right of the chart displays key performance metrics, including total trades, wins, losses, and win rate percentage, offering a quick overview of the strategy’s effectiveness.
🔶 Interpreting the Indicator
Trend Signals: The strategy identifies trend continuation signals based on price action relative to an ATR-based threshold. A buy signal is generated when the price crosses above a key level, indicating an uptrend. Conversely, a sell signal occurs when the price crosses below a level, signaling a downtrend.
Cloud Visualization: The cloud, derived from MACD and moving averages, changes color to reflect the current trend. A positive cloud in aqua suggests an uptrend, while a red cloud indicates a downtrend. The transparency of the cloud offers further nuance, with more solid colors denoting stronger trends.
Entry and Exit Management: Once a trend signal is generated, the strategy automatically sets TP and SL levels based on your chosen method (ATR or percentage). The stop loss and take profit lines will appear on the chart, showing where the strategy will exit the trade. If the price reaches either the SL or TP, the trade is closed, and the respective line is deleted from the chart.
Performance Metrics: The strategy’s performance is tracked in real-time with an in-chart table. This table provides essential information about the number of trades executed, the win/loss ratio, and the overall win rate. This information helps traders assess the strategy's effectiveness and make necessary adjustments.
This strategy is designed for those who seek to engage with trending markets, offering robust tools for entry, exit, and overall trade management. By understanding and leveraging these features, traders can potentially improve their trading outcomes and risk management.
🔷 Related Script
🔶 Disclaimer
Use with Caution: This indicator is provided for educational and informational purposes only and should not be considered as financial advice. Users should exercise caution and perform their own analysis before making trading decisions based on the indicator's signals.
Not Financial Advice: The information provided by this indicator does not constitute financial advice, and the creator (UAlgo) shall not be held responsible for any trading losses incurred as a result of using this indicator.
Backtesting Recommended: Traders are encouraged to backtest the indicator thoroughly on historical data before using it in live trading to assess its performance and suitability for their trading strategies.
Risk Management: Trading involves inherent risks, and users should implement proper risk management strategies, including but not limited to stop-loss orders and position sizing, to mitigate potential losses.
No Guarantees: The accuracy and reliability of the indicator's signals cannot be guaranteed, as they are based on historical price data and past performance may not be indicative of future results.
Search in scripts for "stop loss"

Risk Management Calculator with Fees and Take Profit [CHE]Risk Management Calculator with Fees and Take Profit
Welcome to the Risk Management Calculator with Fees and Take Profit script! This powerful tool is designed to help traders manage their risk effectively, calculate leverage, and set take profit targets. The script is inspired by and builds upon the ideas from the following TradingView script: ().
This script is inspired by and builds upon the ideas from the following TradingView script:
Features
1. Portfolio Size Input: Enter the size of your portfolio to accurately calculate your risk and leverage.
2. Max Loss Percent Input: Specify the maximum percentage of your portfolio that you are willing to risk on a single trade.
3. Max Leverage Input: Set the maximum leverage you are comfortable using.
4. Trading Fee Input: Include trading fees in your calculations to get a more realistic view of your potential losses and gains.
5. ATR Settings: Configure the ATR period and multiplier to calculate your stop loss and take profit levels.
6. RSI Settings: Adjust the RSI period for trend analysis.
How to Use
Portfolio Size
- Description: This is the total value of your trading account.
- Input: `portfolioSize`
- Default Value: 100
- Minimum Value: 0.001
Max Loss Percent
- Description: The maximum percentage of your portfolio you are willing to lose on a single trade.
- Input: `maxLossPercent`
- Default Value: 3%
- Range: 0.1% to 100%
Max Leverage
- Description: The maximum leverage you wish to use.
- Input: `maxLeverage`
- Default Value: 125
- Range: 1 to 125
Trading Fee
- Description: The fee percentage you pay per trade.
- Input: `feeRate`
- Default Value: 1%
- Range: 0% to 10%
ATR Settings
- ATR Period: Number of bars used to calculate the Average True Range.
- Input: `atrPeriod`
- Default Value: 5
- ATR Multiplier: Multiplier for ATR to set stop loss levels.
- Input: `atrMultiplier`
- Default Value: 2.0
Take Profit Multiplier
- Description: Multiplier for ATR to set take profit levels.
- Input: `takeProfitMultiplier`
- Default Value: 2.0
RSI Settings
- RSI Period: Period for the RSI calculation.
- Input: `rsiPeriod`
- Default Value: 14
Dashboard
The script includes a customizable dashboard that displays the following information:
- Portfolio Size
- Maximum Loss Amount
- Entry Price
- Stop Loss Price
- Stop Loss Percentage
- Calculated Leverage
- Order Value
- Order Quantity
- Trend Direction
- Adjusted Maximum Loss Percentage
- Take Profit Price
Dashboard Settings
- Location: Choose the position of the dashboard on the chart.
- Options: 'Top Right', 'Bottom Right', 'Top Left', 'Bottom Left'
- Size: Adjust the size of the dashboard text.
- Options: 'Tiny', 'Small', 'Normal', 'Large'
- Text/Frame Color: Set the color for the text and frame of the dashboard.
Underlying Principles and Assumptions
Leverage Calculation
The leverage calculation is fundamental to risk management in trading. It ensures that the risk per trade does not exceed a specified percentage of the portfolio. This calculation takes into account the potential loss from the entry price to the stop loss level, adjusted for trading fees. By dividing the maximum acceptable loss by the total potential loss (including fees), we derive a leverage that limits the exposure per trade. This approach helps traders avoid over-leveraging, which can lead to significant losses.
ATR and Stop Loss
The Average True Range (ATR) is used to set stop loss levels because it measures market volatility. A higher ATR indicates more volatility, which means wider stop losses are needed to avoid being prematurely stopped out by normal market fluctuations. By using an ATR multiplier, the stop loss is dynamically adjusted based on current market conditions, providing a more robust risk management strategy.
Take Profit Calculation
The take profit level is calculated as a multiple of the ATR, ensuring that it is set at a realistic level relative to market volatility. This method aims to capture significant price movements while avoiding the noise of smaller fluctuations. Setting take profit targets this way helps in locking in profits when the market moves favorably.
RSI for Trend Confirmation
The Relative Strength Index (RSI) is used to confirm the trend direction. An RSI above 50 typically indicates a bullish trend, while an RSI below 50 indicates a bearish trend. By aligning trades with the prevailing trend, the script increases the probability of successful trades. This trend confirmation helps in making informed decisions about leverage and position sizing.
Risk Color Coding
The script uses color coding to visually indicate the risk level and trend direction. Green indicates a favorable condition for long trades, red for short trades, and gray for neutral conditions. This intuitive color coding aids in quickly assessing the market conditions and making timely trading decisions.
Conclusion
This script aims to provide a comprehensive risk management tool for traders. By integrating portfolio size, leverage, fees, ATR, and RSI, it helps in making informed trading decisions. We hope you find this tool useful in your trading journey.
Happy Trading!

Position Size Calculator for ContractDescription:
Position Size Calculator is a versatile Pine Script tool designed to help traders manage their risk and position sizing effectively. This script calculates essential trading metrics and visualizes them directly on your chart, helping you make informed trading decisions.
Features:
- Account Size & Risk Management:
- Account Size: Input your total account balance to calculate position sizes.
- Maximum Risk: Define how much of your account you are willing to risk per trade in dollars.
- Pip Value: Set the value of a single pip for one contract, which is crucial for calculating risk
and position size.
Trade Setup Visualization:
- Entry Price: Specify the price at which you plan to enter the trade.
- Stop Loss: Define your stop loss level to manage your risk.
- Take Profit: Set your target profit level for the trade.
- Visualize the Entry, Stop Loss, and Take Profit levels on your chart with customizable line
colors and text sizes.
- View the distance in pips between the Entry, Stop Loss, and Take Profit levels.
Position Size Calculation:
- Calculates the number of contracts to open based on your risk tolerance and the pip value.
- Displays the maximum number of contracts you can open given your risk parameters.
Customizable Table Display:
- Table Position: Choose the position of the summary table on the chart (Top-Left, Top-Right,
Bottom-Left, Bottom-Right, etc.).
- Table Text Size: Adjust the text size for the summary table.
- Table Background Color: Set the background color for the summary table.
- Table Border Color: Customize the border color of the summary table.
How to Use:
1- Input your Account Size: Enter your current account balance.
2- Set Maximum Risk and Pip Value: Define how much you're willing to risk per trade and the
pip value for your contract.
3- Define Trade Levels: Input your desired Entry Price, Stop Loss, and Take Profit levels.
4- Customize Visuals: Adjust the line styles and table settings to fit your preferences.
5- View Calculations: The script will display the distance in pips and the calculated position
size directly on your chart.
Example Usage:
Example to calculate the value of 1 pips with 1 contract:
Inputs:
Account Size: Your total trading account balance.
Maximum Risk: Risk amount per trade in dollars.
Pip Value: Value of one pip for a single contract.
Entry Price: The price at which you plan to enter the trade.
Stop Loss: The level at which you will exit the trade to cut losses.
Take Profit: The target price to lock in profits.
Line Text Size: Size of the text for the Entry, Stop Loss, and Take Profit lines.
Line Extend: Option to extend the lines for visual clarity.
Table Position: Position of the summary table on the chart.
Table Text Size: Size of the text in the summary table.
Table Background Color: Background color of the summary table.
Table Border Color: Border color of the summary table.
Visuals:
Entry Price, Stop Loss, and Take Profit levels are clearly marked on the chart.
Summary Table with important trade metrics displayed.

IsAlgo - Support & Resistance Strategy► Overview:
The Support & Resistance Strategy is designed to identify critical support and resistance levels and execute trades when the price crosses these levels. Utilizing a combination of a moving average, ATR indicator, and the highest and lowest prices, this strategy aims to accurately pinpoint entry and exit points for trades based on market movements.
► Description:
The Support & Resistance Strategy leverages the ATR (Average True Range) and a moving average to identify key support and resistance levels. The strategy calculates these levels by measuring the distance between the current market price and the moving average. This distance is continuously compared with each new candle to provide an estimate of the support and resistance levels.
The ATR is utilized to determine the width of these levels, ensuring they adjust to market volatility. To validate these levels, the strategy counts how often a candle’s low or high touches the estimated support or resistance and then bounces back. A higher frequency of such touches indicates a stronger, more reliable level.
Once the levels are confirmed, the strategy waits for a candle to close above the resistance level or below the support level. A candle closing above the resistance triggers a long entry, while a candle closing below the support triggers a short entry.
The strategy incorporates multiple stop-loss options to manage risk effectively. These options include setting stop-loss levels based on fixed pips, ATR calculations, or the highest/lowest prices of previous candles. Up to three take-profit levels can be set using fixed pips, ATR, or risk-to-reward ratios. A trailing stop feature adjusts the stop loss as the trade moves into profit, and a break-even feature moves the stop loss to the entry price once a certain profit level is reached.
Additionally, the strategy can close trades if the price crosses the opposite support or resistance level or if a candle moves significantly against the trade direction.
↑ Long Entry Example:
↓ Short Entry Example:
► Features & Settings:
⚙︎ Levels: Configure the length, width, and ATR period for support and resistance levels.
⚙︎ Moving Average: Use an Exponential Moving Average (EMA) to confirm trend direction. This can be enabled or disabled.
⚙︎ Entry Candle: Define the minimum and maximum body size and the body-to-candle size ratio for entry candles.
⚙︎ Trading Session: Specify the trading hours during which the strategy operates.
⚙︎ Trading Days: Select which days of the week the strategy is active.
⚙︎ Backtesting: Set a backtesting period with start and end dates. This feature can be deactivated.
⚙︎ Trades: Customize trade direction (long, short, or both), position sizing (fixed or percentage-based), maximum open trades, and daily trade limits.
⚙︎ Trades Exit: Choose from various exit methods, including profit/loss limits, trade duration, or crossing the opposite support/resistance level.
⚙︎ Stop Loss: Set stop-loss levels using fixed pips, ATR-based calculations, or the highest/lowest price within a specified number of previous candles.
⚙︎ Break Even: Adjust the stop loss to break-even once certain profit conditions are met.
⚙︎ Trailing Stop: Automatically adjust the stop loss as the trade moves into profit.
⚙︎ Take Profit: Define up to three take-profit levels using fixed pips, ATR, or risk-to-reward ratios based on the stop loss.
⚙︎ Alerts: Receive alerts for significant actions such as trade openings and closings, with support for dynamic values.
⚙︎ Dashboard: A visual display on the chart providing detailed information about ongoing and past trades.
► Backtesting Details:
Timeframe: 1-hour US30 chart
Initial Balance: $10,000
Order Size: 5 Units
Commission: $0.5 per contract
Slippage: 5 ticks
Stop Loss: Based on the opposite support/resistance level or break-even adjustments

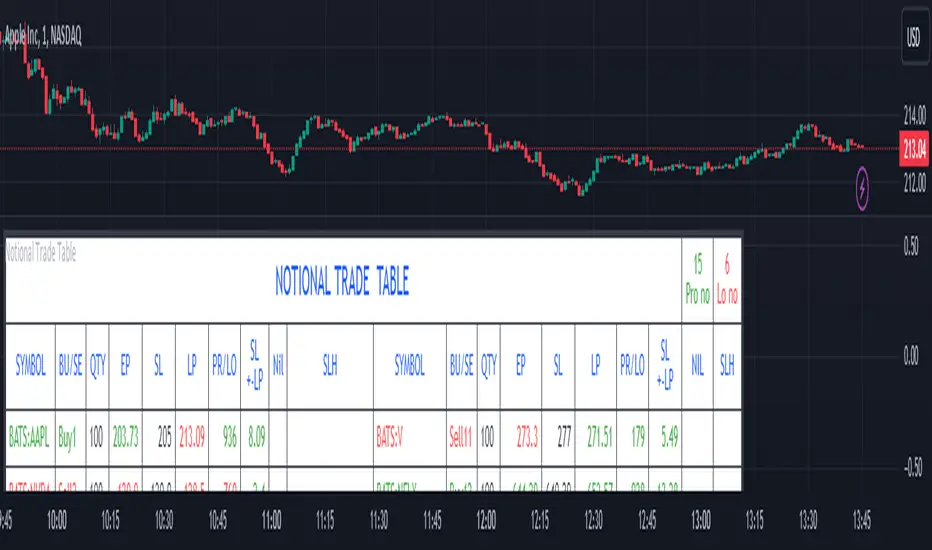
Notional Trade Table
Notional Trade Table indicator displays notional trade values for given Buy and Sell of given input of Symbol, Quantity, Entry Price and Stop Loss .
Sections of Input Menu Table are supported with Tool Tip icons.
Input Symbols:
(Refer Input Menu)
User can choose maximum 20 Symbols.
Input Side Choice (BUY/SELL):
(Refer Input Menu)
After choosing Symbol, User has to choose the BUY or SELL option for each Symbol against the corresponding Sybol number. If NIL is selected “Nil is selected ” message is displayed prompting the user to select BUY or SELL sides.
For example in the above Input Menu:
Sym1 is BATS:AAPL. Corresponding Side 1 is Sell1.
Sym2 is BATS:NVDA Corresponding Side 2 Sell 2.
Sym12 is BATS:NFLX. Corresponding Side 12 is Buy12 and so on.
Input Quantity:
(Refer Input Menu)
Next enter Corresponding Quantity of BUY or SELL in relevant Quantity Input Box. Quantity cannot be Zero. Defval is 1.
For Sym1 input in Qty 1 box,for Sym2 input in Qty 2 box and so on.
Input Entry Price:
(Refer Input Menu)
After entering Quantity Input Entry Price for Corresponding Symbol.
Input for Sym1 Entry Price in EP1 box
Input for Sym2 Entry Price in EP2 box
and so on.
Input Stop Loss:
(Refer Input Menu)
Next Enter corresponding Stop Loss for each Symbol.
SL1 input box denotes Sym1 Stop Loss.
SL2 input box denotes Sym2 Stop Loss.
SL3 input box denotes Sym3 Stop Loss and so on.
Stop Loss for Chosen BUY side should be below corresponding Entry Price/Last Price. Otherwise a message is displayed “SL Hit”. User has to enter valid data.
Stop Loss for Chosen SELL side should be above corresponding Entry Price/Last Price. Otherwise a message is displayed “SL Hit”. User has to enter valid data.
Notional Trade Table:
(Refer the Table on Chart)
From the input menu filled by User script captures the Symbol, BUY/SELL options, Quantity,
Entry Price and Stop Loss details under the corresponding heads in the Notional Trade Table.
The script captures the live Last traded Price under the head LP and calculates and displays corresponding Profit or Loss under PR/LO column in the table.
SL+- LP is the difference between Last traded Price (LP) and Stop Loss Price. Positive figure under this head reflects Stop Loss cushion available .
Nil header column reflects message “NIL selected” prompting the User to select BUY or SELL sides.
SLH header displays “SL Hit” on Stop Loss Hit or wrong input of Stop Loss inconsistent with BUY or SELL sides of Trade. On “SL Hit” message all values in corresponding Symbol becomes Zero. User has to re-enter the details fresh .
On the top left side corner of the table there are 2 cells with Prono and Lono.They denote the number of trades which are in Profit (Prono) and which are in Loss(Lono).
It is preferable to choose Symbols from a single country exchange commensurate with the Time zone. Otherwise if Exchange and Chart time Zone differs there is risk of data loss in the table.
DISCLAIMER: For educational and entertainment purpose only .Nothing in this content should be interpreted as financial advice or a recommendation to buy or sell any sort of security/ies or investment/s.
Wolf DCA CalculatorThe Wolf DCA Calculator is a powerful and flexible indicator tailored for traders employing the Dollar Cost Averaging (DCA) strategy. This tool is invaluable for planning and visualizing multiple entry points for both long and short positions. It also provides a comprehensive analysis of potential profit and loss based on user-defined parameters, including leverage.
Features
Entry Price: Define the initial entry price for your trade.
Total Lot Size: Specify the total number of lots you intend to trade.
Percentage Difference: Set the fixed percentage difference between each DCA point.
Long Position: Toggle to switch between long and short positions.
Stop Loss Price: Set the price level at which you plan to exit the trade to minimize losses.
Take Profit Price: Set the price level at which you plan to exit the trade to secure profits.
Leverage: Apply leverage to your trade, which multiplies the potential profit and loss.
Number of DCA Points: Specify the number of DCA points to strategically plan your entries.
How to Use
1. Add the Indicator to Your Chart:
Search for "Wolf DCA Calculator" in the TradingView public library and add it to your chart.
2. Configure Inputs:
Entry Price: Set your initial trade entry price.
Total Lot Size: Enter the total number of lots you plan to trade.
Percentage Difference: Adjust this to set the interval between each DCA point.
Long Position: Use this toggle to choose between a long or short position.
Stop Loss Price: Input the price level at which you plan to exit the trade to minimize losses.
Take Profit Price: Input the price level at which you plan to exit the trade to secure profits.
Leverage: Set the leverage you are using for the trade.
Number of DCA Points: Specify the number of DCA points to plan your entries.
3. Analyze the Chart:
The indicator plots the DCA points on the chart using a stepline style for clear visualization.
It calculates the average entry point and displays the potential profit and loss based on the specified leverage.
Labels are added for each DCA point, showing the entry price and the lots allocated.
Horizontal lines mark the Stop Loss and Take Profit levels, with corresponding labels showing potential loss and profit.
Benefits
Visual Planning: Easily visualize multiple entry points and understand how they affect your average entry price.
Risk Management: Clearly see your Stop Loss and Take Profit levels and their impact on your trade.
Customizable: Adapt the indicator to your specific strategy with a wide range of customizable parameters.

Nifty 50 5mint Strategy
The script defines a specific trading session based on user inputs. This session is specified by a time range (e.g., "1000-1510") and selected days of the week (e.g., Monday to Friday). This session definition is crucial for trading only during specific times.
Lookback and Breakout Conditions:
The script uses a lookback period and the highest high and lowest low values to determine potential breakout points. The lookback period is user-defined (default is 10 periods).
The script also uses Bollinger Bands (BB) to identify potential breakout conditions. Users can enable or disable BB crossover conditions. BB consists of an upper and lower band, with the basis.
Additionally, the script uses Dema (Double Exponential Moving Average) and VWAP (Volume Weighted Average Price) . Users can enable or disable this condition.
Buy and Sell Conditions:
Buy conditions are met when the close price exceeds the highest high within the specified lookback period, Bollinger Bands conditions are satisfied, Dema-VWAP conditions are met, and the script is within the defined trading session.
Sell conditions are met when the close price falls below the lowest low within the lookback period, Bollinger Bands conditions are satisfied, Dema-VWAP conditions are met, and the script is within the defined trading session.
When either condition is met, it triggers a "long" or "short" position entry.
Trailing Stop Loss (TSL):
Users can choose between fixed points ( SL by points ) or trailing stop (Profit Trail).
For fixed points, users specify the number of points for the stop loss. A fixed stop loss is set at a certain distance from the entry price if a position is opened.
For Profit Trail, users can enable or disable this feature. If enabled, the script uses a "trail factor" (lookback period) to determine when to adjust the stop loss.
If the price moves in the direction of the trade and reaches a certain level (determined by the trail factor), the stop loss is adjusted, trailing behind the price to lock in profits.
If the close price falls below a certain level (lowest low within the trail factor(lookback)), and a position is open, the "long" position is closed (strategy.close("long")).
If the close price exceeds a certain level (highest high within the specified trail factor(lookback)), and a position is open, the "short" position is closed (strategy.close("short")).
Positions are also closed if they are open outside of the defined trading session.
Background Color:
The script changes the background color of the chart to indicate buy (green) and sell (red) signals, making it visually clear when the strategy conditions are met.
In summary, this script implements a breakout trading strategy with various customizable conditions, including Bollinger Bands, Dema-VWAP crossovers, and session-specific rules. It also includes options for setting stop losses and trailing stop losses to manage risk and lock in profits. The "trail factor" helps adjust trailing stops dynamically based on recent price movements. Positions are closed under certain conditions to manage risk and ensure compliance with the defined trading session.
CE=Buy, CE_SL=stoploss_buy, tCsl=Trailing Stop_buy.
PE=sell, PE_SL= stoploss_sell, tpsl=Trailing Stop_sell.
Remember that trading involves inherent risks, and past performance is not indicative of future results. Exercise caution, manage risk diligently, and consider the advice of financial experts when using this script or any trading strategy.

ATR GOD Strategy by TradeSmart (PineConnector-compatible)This is a highly-customizable trading strategy made by TradeSmart, focusing mainly on ATR-based indicators and filters. The strategy is mainly intended for trading forex , and has been optimized using the Deep Backtest feature on the 2018.01.01 - 2023.06.01 interval on the EUR/USD (FXCM) 15M chart, with a Slippage value of 3, and a Commission set to 0.00004 USD per contract. The strategy is also made compatible with PineConnector , to provide an easy option to automate the strategy using a connection to MetaTrader. See tooltips for details on how to set up the bot, and check out our website for a detailed guide with images on how to automate the strategy.
The strategy was implemented using the following logic:
Entry strategy:
A total of 4 Supertrend values can be used to determine the entry logic. There is option to set up all 4 Supertrend parameters individually, as well as their potential to be used as an entry signal/or a trend filter. Long/Short entry signals will be determined based on the selected potential Supertrend entry signals, and filtered based on them being in an uptrend/downtrend (also available for setup). Please use the provided tooltips for each setup to see every detail.
Exit strategy:
4 different types of Stop Losses are available: ATR-based/Candle Low/High Based/Percentage Based/Pip Based. Additionally, Force exiting can also be applied, where there is option to set up 4 custom sessions, and exits will happen after the session has closed.
Parameters of every indicator used in the strategy can be tuned in the strategy settings as follows:
Plot settings:
Plot Signals: true by default, Show all Long and Short signals on the signal candle
Plot SL/TP lines: false by default, Checking this option will result in the TP and SL lines to be plotted on the chart.
Supertrend 1-4:
All the parameters of the Supertrends can be set up here, as well as their individual role in the entry logic.
Exit Strategy:
ATR Based Stop Loss: true by default
ATR Length (of the SL): 100 by default
ATR Smoothing (of the SL): RMA/SMMA by default
Candle Low/High Based Stop Loss: false by default, recent lowest or highest point (depending on long/short position) will be used to calculate stop loss value. Set 'Base Risk Multiplier' to 1 if you would like to use the calculated value as is. Setting it to a different value will count as an additional multiplier.
Candle Lookback (of the SL): 50 by default
Percentage Based Stop Loss: false by default, Set the stop loss to current price - % of current price (long) or price + % of current price (short).
Percentage (of the SL): 0.3 by default
Pip Based Stop Loss: Set the stop loss to current price - x pips (long) or price + x pips (short). Set 'Base Risk Multiplier' to 1 if you would like to use the calculated value as is. Setting it to a different value will count as an additional multiplier.
Pip (of the SL): 10 by default
Base Risk Multiplier: 4.5 by default, the stop loss will be placed at this risk level (meaning in case of ATR SL that the ATR value will be multiplied by this factor and the SL will be placed that value away from the entry level)
Risk to Reward Ratio: 1.5 by default, the take profit level will be placed such as this Risk/Reward ratio is met
Force Exiting:
4 total Force exit on custom session close options: none applied by default. If enabled, trades will close automatically after the set session is closed (on next candle's open).
Base Setups:
Allow Long Entries: true by default
Allow Short Entries: true by default
Order Size: 10 by default
Order Type: Capital Percentage by default, allows adjustment on how the position size is calculated: Cash: only the set cash amount will be used for each trade Contract(s): the adjusted number of contracts will be used for each trade Capital Percentage: a % of the current available capital will be used for each trade
ATR Limiter:
Use ATR Limiter: true by default, Only enter into any position (long/short) if ATR value is higher than the Low Boundary and lower than the High Boundary.
ATR Limiter Length: 50 by default
ATR Limiter Smoothing: RMA/SMMA by default
High Boundary: 1000 by default
Low Boundary: 0.0003 by default
MA based calculation: ATR value under MA by default, If not Unspecified, an MA is calculated with the ATR value as source. Only enter into position (long/short) if ATR value is higher/lower than the MA.
MA Type: RMA/SMMA by default
MA Length: 400 by default
Waddah Attar Filter:
Explosion/Deadzone relation: Not specified by default, Explosion over Deadzone: trades will only happen if the explosion line is over the deadzone line; Explosion under Deadzone: trades will only happen if the explosion line is under the deadzone line; Not specified: the opening of trades will not be based on the relation between the explosion and deadzone lines.
Limit trades based on trends: Not specified by default, Strong Trends: only enter long if the WA bar is colored green (there is an uptrend and the current bar is higher then the previous); only enter short if the WA bar is colored red (there is a downtrend and the current bar is higher then the previous); Soft Trends: only enter long if the WA bar is colored lime (there is an uptrend and the current bar is lower then the previous); only enter short if the WA bar is colored orange (there is a downtrend and the current bar is lower then the previous); All Trends: only enter long if the WA bar is colored green or lime (there is an uptrend); only enter short if the WA bar is colored red or orange (there is a downtrend); Not specified: the color of the WA bar (trend) is not relevant when considering entries.
WA bar value: Not specified by default, Over Explosion and Deadzone: only enter trades when the WA bar value is over the Explosion and Deadzone lines; Not specified: the relation between the explosion/deadzone lines to the value of the WA bar will not be used to filter opening trades.
Sensitivity: 150 by default
Fast MA Type: SMA by default
Fast MA Length: 10 by default
Slow MA Type: SMA
Slow MA Length: 20 by default
Channel MA Type: EMA by default
BB Channel Length: 20 by default
BB Stdev Multiplier: 2 by default
Trend Filter:
Use long trend filter 1: false by default, Only enter long if price is above Long MA.
Show long trend filter 1: false by default, Plot the selected MA on the chart.
TF1 - MA Type: EMA by default
TF1 - MA Length: 120 by default
TF1 - MA Source: close by default
Use short trend filter 1: false by default, Only enter long if price is above Long MA.
Show short trend filter 1: false by default, Plot the selected MA on the chart.
TF2 - MA Type: EMA by default
TF2 - MA Length: 120 by default
TF2 - MA Source: close by default
Volume Filter:
Only enter trades where volume is higher then the volume-based MA: true by default, a set type of MA will be calculated with the volume as source, and set length
MA Type: RMA/SMMA by default
MA Length: 200 by default
Date Range Limiter:
Limit Between Dates: false by default
Start Date: Jan 01 2023 00:00:00 by default
End Date: Jun 24 2023 00:00:00 by default
Session Limiter:
Show session plots: false by default, show market sessions on chart: Sidney (red), Tokyo (orange), London (yellow), New York (green)
Use session limiter: false by default, if enabled, trades will only happen in the ticked sessions below.
Sidney session: false by default, session between: 15:00 - 00:00 (EST)
Tokyo session: false by default, session between: 19:00 - 04:00 (EST)
London session: false by default, session between: 03:00 - 11:00 (EST)
New York session: false by default, session between: 08:00 - 17:00 (EST)
Trading Time:
Limit Trading Time: true by default, tick this together with the options below to enable limiting based on day and time
Valid Trading Days Global: 123567 by default, if the Limit Trading Time is on, trades will only happen on days that are present in this field. If any of the not global Valid Trading Days is used, this field will be neglected. Values represent days: Sunday (1), Monday (2), ..., Friday (6), Saturday(7) To trade on all days use: 123457
(1) Valid Trading Days: false, 123456 by default, values represent days: Sunday (1), Monday (2), ..., Friday (6), Saturday(7) The script will trade on days that are present in this field. Please make sure that this field and also (1) Valid Trading Hours Between is checked
(1) Valid Trading Hours Between: false, 1800-2000 by default, hours between which the trades can happen. The time is always in the exchange's timezone
All other options are also disabled by default
PineConnector Automation:
Use PineConnector Automation: false by default, In order for the connection to MetaTrader to work, you will need do perform prerequisite steps, you can follow our full guide at our website, or refer to the official PineConnector Documentation. To set up PineConnector Automation on the TradingView side, you will need to do the following:
1. Fill out the License ID field with your PineConnector License ID;
2. Fill out the Risk (trading volume) with the desired volume to be traded in each trade (the meaning of this value depends on the EA settings in Metatrader. Follow the detailed guide for additional information);
3. After filling out the fields, you need to enable the 'Use PineConnector Automation' option (check the box in the strategy settings);
4. Check if the chart has updated and you can see the appropriate order comments on your chart;
5. Create an alert with the strategy selected as Condition, and the Message as {{strategy.order.comment}} (should be there by default);
6. Enable the Webhook URL in the Notifications section, set it as the official PineConnector webhook address and enjoy your connection with MetaTrader.
License ID: 60123456789 by default
Risk (trading volume): 1 by default
NOTE! Fine-tuning/re-optimization is highly recommended when using other asset/timeframe combinations.

Premium Volatility Breakout Strategy [wbburgin]This the premium version of my Volatility Breakout strategy, which improves significantly on the original strategy (publicly available on my profile). Improvements are below. A note about any of my premium scripts: I will continue updating and improving the original (public) versions.
This strategy is not built for any specific asset or timeframe, and has been backtested on crypto, equities, and forex from 1min - 1day. However, I recommend using it on more volatile assets because it is a breakout strategy.
********** My Background
I am an investor, trader, and entrepreneur with 10 years of cryptocurrency and equity trading experience and founder of two fintech startups. I am a graduate of a prestigious university in the United States and carry broad and inclusive interests in mathematical finance, computer science, machine learning / artificial intelligence, as well as other fields.
**********
Improvements over the original Volatility Breakout strategy include:
Faster Trend Detection → The Premium Volatility Breakout strategy will catch trends faster by using adaptive volatility-weighted bands instead of standard-width volatility-weighted bands. This can improve win size and has performed well in my backtesting.
ADX Filter → False breakouts dampen the overall results of the original script, as well as the % profitable,so an ADX filter has been programmed into the script (toggle on/off in settings). This filter will only enter long and short trades when the ADX is above a certain threshold. This is by default toggled off because in most instances it will not be necessary, but in certain environments may be useful.
MA Configuration → Different types of moving averages and weights are now configurable in the settings. These can change the responsiveness of the strategy.
External Trend Filter → I use this strategy as a filter for some of my low-timeframe algorithms. I have added an external trend filter (a plot only displayed in the data window) that will return “1” when the trend is long and “-1” when the trend is short (displayed on-chart with red and green trend curves).
Customizable Alert Messages In-Strategy → In the settings, there will be text boxes where you can create your own alerts. All you will need to do is create an alert in the alert panel on TradingView and leave the message box blank - if you fill out the alert boxes in the settings, these will automatically populate into your alerts. There are in total four different customizable alerts messages: Entry and Exit alerts for both Long and Short sides. If you disable stop loss and/or take profit, these alerts will also be disabled. Similarly, if you disable shorts, all short alerts will be disabled.
About stop losses: This strategy does not come with a stop loss because the moving average acts as a stop loss / trade exit for both long and short entries.
**********
Display
You can turn off highlighting or barcolor in the settings. Additionally, future updates may include a color scheme for users using a light-themed window.
**********
Configuring Alerts
In TradingView desktop, go to the ‘Alerts’ tab on the right panel. Click the “+” button to create a new alert. Select this strategy for the condition and one of the two options that includes alert() function calls. Name the alert what you wish and clear the default message, because your text in the settings will replace this message.
Now that the alert is configured, you can go to the settings of the strategy and fill in your chosen text for the specific alert condition. You will need to check “Long and Short” in the “Trade Direction” setting in order for any Short Alerts to become active.
**********
Disclaimer
Copyright by wbburgin.
The information contained in my Scripts/Indicators/Algorithms does not constitute financial advice or a solicitation to buy or sell any securities of any type. I will not accept liability for any loss or damage, including without limitation any loss of profit, which may arise directly or indirectly from the use of or reliance on such information.
All investments involve risk, and the past performance of a security, industry, sector, market, financial product, trading strategy, backtest, or individual's trading does not guarantee future results or returns. Investors are fully responsible for any investment decisions they make. Such decisions should be based solely on an evaluation of their financial circumstances, investment objectives, risk tolerance, and liquidity needs.

Bounce Manager TrendlinesThe trendline script is made for manual input of trendlines using point clicks on the chart. The script will then see if price respects these lines by the parameters you input in settings panel. On a respectable bounce it will print buy/sell arrows. The script also has functionality to send alerts, this is helpful if you want to automate trendlines . I created this script and many others under the bounce manager toolkit to expand on the signalling capabilities of popular drawing tools as I find using just a crossover to be lacking especialy for full automation.
components:
- Line respect: When price moves past this the script will no longer look for entry until a new trend has been established. The line can also be used as a stop loss.
- Confirmation: When price touches the line during a trend it
will wait to cross over this line to confirm a reaction from the line.
- Consolidation filter: A trend filtering system, this is a distance from
the line price has to break to confirm trend direction.
- Stop loss: This can be set to a percentage distance from the low after
bounce. Or it can be set to the line respect line
- Take profit: This can be a fixed take profit target or a risk to reward
based take profit. With risk to reward it will multiply the stop loss
distance by the input and use that to create target (green cross)
- ATR based or % based: there are 2 versions of the script, one for strict
percentage based logic and another one based on ATR values
If you are having problems figuring out which settings to use I recommend you check the Bounce Manager ATR script for reference as this script plots the components:
Zignaly automation settings:
zignaly integration, you can use the settings panel to decide your risk management. Option to use a fixed take profit % or an automatic risk to reward calculation based on the stop loss. Stop loss can get calculated using the max violation setting as a stop loss (this will put stop loss below line respect level) or when not checked it will use 0.01% below the low of the signal candle as stop loss. Just add your zignaly private key in the settings and use any alert function call as alert. Make sure to use zignaly.com as your webhook url.
If 5 trendlines are not enough use the 20 line input version, this script is for the clean strong trendline trader.
Part of the Honest Algo indicator suite

Bounce Manager 20 TrendlinesThe trendline script is made for manual input of trendlines using point clicks on the chart. The script will then see if price respects these lines by the parameters you input in settings panel. On a respectable bounce it will print buy/sell arrows. The script also has functionality to send alerts, this is helpful if you want to automate trendlines. I created this script and many others under the bounce manager toolkit to expand on the signalling capabilities of popular drawing tools as I find using just a crossover to be lacking especialy for full automation.
components:
- Line respect: When price moves past this the script will no longer look for entry until a new trend has been established. The line can also be used as a stop loss.
- Confirmation: When price touches the line during a trend it
will wait to cross over this line to confirm a reaction from the line.
- Consolidation filter: A trend filtering system, this is a distance from
the line price has to break to confirm trend direction.
- Stop loss: This can be set to a percentage distance from the low after
bounce. Or it can be set to the line respect line
- Take profit: This can be a fixed take profit target or a risk to reward
based take profit. With risk to reward it will multiply the stop loss
distance by the input and use that to create target (green cross)
- ATR based or % based: there are 2 versions of the script, one for strict
percentage based logic and another one based on ATR values
If you are having problems figuring out which settings to use I recommend you check the Bounce Manager ATR script for reference as this script plots the components:
Zignaly automation settings:
zignaly integration, you can use the settings panel to decide your risk management. Option to use a fixed take profit % or an automatic risk to reward calculation based on the stop loss. Stop loss can get calculated using the max violation setting as a stop loss (this will put stop loss below line respect level) or when not checked it will use 0.01% below the low of the signal candle as stop loss. Just add your zignaly private key in the settings and use any alert function call as alert. Make sure to use zignaly.com as your webhook url.
The trendlines you see in preview are based on a long term pitchfork on BTCUSDT 10H chart
If 20 trendlines are too much I will be releasing a 5 line input version, this script is more to be used to automate pitchforks, gann boxes etc.
Part of the Honest Algo indicator suite

Ultimate MACD Strategy [PrismBot] [Lite]Included in this Ultimate MACD Lite Strategy:
✔️ Tweak a multitude of specific settings (MA lengths, R:R, SL distance etc)
✔️ Enable advanced setup filters
✔️ Use money management and risk calculations
✔️ Draw trade info directly to chart (eg. SL size in percent, win rate etc)
✔️ Use various filters (eg. time filter, date filter, MA slope angle etc)
✔️ Manage risk per position when auto-trading forex through AutoView
✔️ Choose from various alert conditions!
✔️ Sync to any bot or algorithmic trading system
Some details about this strategy:
LONG SIGNAL
When the MACD is below the zero line of the histogram, close is above the 200EMA, and the MACD line crosses above the signal line, longs are taken
SHORT SIGNAL
When the MACD is above the zero line of the histogram, close is below the 200EMA, and the MACD line crosses below the signal line, shorts are taken
A couple of options are given for how to calculator stop losses.
The Take profit is calculated by the risk of the stop loss. So a 1.5 take profit target is 1.5 times the stop loss added to the entry price.
There is also an option to filter out trades by the histogram deviation. This prevents crossovers that are too close to the histogram from being taken.
Please note I used the code for the PPO instead of the traditional MACD to make calculating these percentage deviations more consistent across multiple asset types.
You can easily enable and disable strategies using the checkbox.
This strategy incorporates a risk to reward system where the user can select between ATR and Percent based stop losses and take profit targets. This means that the user has much better control over money management when utilizing this strategy and it doesn't require you to babysit the strategy to ensure it's entering and existing strategies in an ideal place.
You can also enter custom messages for alerts for use with bots (set alerts to "alert() function calls only")

Portfolio Backtester Engine█ OVERVIEW
Portfolio Backtester Engine (PBTE). This tool will allow you to backtest strategies across multiple securities at once. Allowing you to easier understand if your strategy is robust. If you are familiar with the PineCoders backtesting engine , then you will find this indicator pleasant to work with as it is an adaptation based on that work. Much of the functionality has been kept the same, or enhanced, with some minor adjustments I made on the account of creating a more subjectively intuitive tool.
█ HISTORY
The original purpose of the backtesting engine (`BTE`) was to bridge the gap between strategies and studies . Previously, strategies did not contain the ability to send alerts, but were necessary for backtesting. Studies on the other hand were necessary for sending alerts, but could not provide backtesting results . Often, traders would have to manage two separate Pine scripts to take advantage of each feature, this was less than ideal.
The `BTE` published by PineCoders offered a solution to this issue by generating backtesting results under the context of a study(). This allowed traders to backtest their strategy and simultaneously generate alerts for automated trading, thus eliminating the need for a separate strategy() script (though, even converting the engine to a strategy was made simple by the PineCoders!).
Fast forward a couple years and PineScript evolved beyond these issues and alerts were introduced into strategies. The BTE was not quite as necessary anymore, but is still extremely useful as it contains extra features and data not found under the strategy() context. Below is an excerpt of features contained by the BTE:
"""
More than `40` built-in strategies,
Customizable components,
Coupling with your own external indicator,
Simple conversion from Study to Strategy modes,
Post-Exit analysis to search for alternate trade outcomes,
Use of the Data Window to show detailed bar by bar trade information and global statistics, including some not provided by TV backtesting,
Plotting of reminders and generation of alerts on in-trade events.
"""
Before I go any further, I want to be clear that the BTE is STILL a good tool and it is STILL very useful. The Portfolio Backtesting Engine I am introducing is only a tangental advancement and not to be confused as a replacement, this tool would not have been possible without the `BTE`.
█ THE PROBLEM
Most strategies built in Pine are limited by one thing. Data. Backtesting should be a rigorous process and researchers should examine the performance of their strategy across all market regimes; that includes, bullish and bearish markets, ranging markets, low volatility and high volatility. Depending on your TV subscription The Pine Engine is limited to 5k-20k historical bars available for backtesting, which can often leave the strategy results wanting. As a general rule of thumb, strategies should be tested across a quantity of historical bars which will allow for at least 100 trades. In many cases, the lack of historical bars available for backtesting and frequency of the strategy signals produces less than 100 trades, rendering your strategy results inconclusive.
█ THE SOLUTION
In order to be confident that we have a robust strategy we must test it across all market regimes and we must have over 100 trades. To do this effectively, researchers can use the Portfolio Backtesting Engine (PBTE).
By testing a strategy across a carefully selected portfolio of securities, researchers can now gather 5k-20k historical bars per security! Currently, the PTBE allows up to 5 securities, which amounts to 25k-100k historical bars.
█ HOW TO USE
1 — Add the indicator to your chart.
• Confirm inputs. These will be the most important initial values which you can change later by clicking the gear icon ⚙ and opening up the settings of the indicator.
2 — Select a portfolio.
• You will want to spend some time carefully selecting a portfolio of securities.
• Each security should be uncorrelated.
• The entire portfolio should contain a mix of different market regimes.
You should understand that strategies generally take advantage of one particular type of market regime. (trending, ranging, low/high volatility)
For example, the default RSI strategy is typically advantageous during ranging markets, whereas a typical moving average crossover strategy is advantageous in trending markets.
If you were to use the standard RSI strategy during a trending market, you might be selling when you should be buying.
Similarily, if you use an SMA crossover during a ranging market, you will find that the MA's may produce many false signals.
Even if you build a strategy that is designed to be used only in a trending market, it is still best to select a portfolio of all market regimes
as you will be able to test how your strategy will perform when the market does something unexpected.
3 — Test a built-in strategy or add your own.
• Navigate to gear icon ⚙ (settings) of strategy.
• Choose your options.
• Select a Main Entry Strat and Alternate Entry Strat .
• If you want to add your own strategy, you will need to modify the source code and follow the built-in example.
• You will only need to generate (buy 1 / sell -1/ neutral 0) signals.
• Select a Filter , by default these are all off.
• Select an Entry Stop - This will be your stop loss placed at the trade entry.
• Select Pyamiding - This will allow you to stack positions. By default this is off.
• Select Hard Exits - You can also think of these as Take Profits.
• Let the strategy run and take note of the display tables results.
• Portfolio - Shows each security.
• The strategy runs on each asset in your portfolio.
• The initial capital is equally distributed across each security.
So if you have 5 securities and a starting capital of 100,000$ then each security will run the strategy starting with 20,000$
The total row will aggregate the results on a bar by bar basis showing the total results of your initial capital.
• Net Profit (NP) - Shows profitability.
• Number of Trades (#T) - Shows # of trades taken during backtesting period.
• Typically will want to see this number greater than 100 on the "Total" row.
• Average Trade Length (ATL) - Shows average # of days in a trade.
• Maximum Drawdown (MD ) - Max peak-to-valley equity drawdown during backtesting period.
• This number defines the minimum amount of capital required to trade the system.
• Typically, this shouldn’t be lower than 34% and we will want to allow for at least 50% beyond this number.
• Maximum Loss (ML) - Shows largest loss experienced on a per-trade basis.
• Normally, don’t want to exceed more than 1-2 % of equity.
• Maximum Drawdown Duration (MDD) - The longest duration of a drawdown in equity prior to a new equity peak.
• This number is important to help us psychologically understand how long we can expect to wait for a new peak in account equity.
• Maximum Consecutive Losses (MCL) - The max consecutive losses endured throughout the backtesting period.
• Another important metric for trader psychology, this will help you understand how many losses you should be prepared to handle.
• Profit to Maximum Drawdown (P:MD) - A ratio for the average profit to the maximum drawdown.
• The higher the ratio is, the better. Large profits and small losses contribute to a good PMD.
• This metric allows us to examine the profit with respect to risk.
• Profit Loss Ratio (P:L) - Average profit over the average loss.
• Typically this number should be higher in trend following systems.
• Mean reversion systems show lower values, but compensate with a better win %.
• Percent Winners (% W) - The percentage of winning trades.
• Trend systems will usually have lower win percentages, since statistically the market is only trending roughly 30% of the time.
• Mean reversion systems typically should have a high % W.
• Time Percentage (Time %) - The amount of time that the system has an open position.
• The more time you are in the market, the more you are exposed to market risk, not to mention you could be using that money for something else right?
• Return on Investment (ROI) - Your Net Profit over your initial investment, represented as a percentage.
• You want this number to be positive and high.
• Open Profit (OP) - If the strategy has any open positions, the floating value will be represented here.
• Trading Days (TD) - An important metric showing how many days the strategy was active.
• This is good to know and will be valuable in understanding how long you will need to run this strategy in order to achieve results.
█ FEATURES
These are additional features that extend the original `BTE` features.
- Portfolio backtesting.
- Color coded performance results.
- Circuit Breakers that will stop trading.
- Position reversals on exit. (Simulating the function of always in the market. Similar to strategy.entry functionality)
- Whipsaw Filter
- Moving Average Filter
- Minimum Change Filter
- % Gain Equity Exit
- Popular strategies, (MACD, MA cross, supertrend)
Below are features that were excluded from the original `BTE`
- 2 stage in-trade stops with kick-in rules (This was a subjective decision to remove. I found it to be complex and thwarted my use of the `BTE` for some time.)
- Simple conversion from Study to Strategy modes. (Not possible with multiple securities)
- Coupling with your own external indicator (Not really practical to use with multiple securities, but could be used if signals were generated based on some indicator which was not based on the current chart)
- Use of the Data Window to show detailed bar by bar trade information and global statistics.
- Post Exit Analysis.
- Plotting of reminders and generation of alerts on in-trade events.
- Alerts (These may be added in the future by request when I find the time.)
█ THANKS
The whole PineCoders team for all their shared knowledge and original publication of the BTE and Richard Weismann for his ideas on building robust strategies.
═════════════════════════════════════════════════════════════════════════

T3-CCI Strategy [SystemAlpha]This is a strategy based on FX Sniper's T3-CCI indicator. Instead of using just the normal buy and sell signal, we added an option to use trend filters, trailing stop loss and take profit targets.
In this strategy you have a choice of:
Trend Filters:
- Average Directional Index ( ADX ) – buy when price is trend is up and sell when trend is down.
- Moving Average (MA) – buy when price close above the defined moving average and sell when price close below moving average
- Parabolic SAR – buy when SAR is above price is above price and sell when SAR is below price.
- All - Use ADX , MA and SAR as filters
For MA Filter , you can use the “TF MA Type” and "TF MA Period" parameter to select Simple or Exponential Moving Average and length.
Stop Loss:
- Average True Range (ATR) – ATR % stop as trailing stop loss.
- Parabolic SAR ( SAR ) – Parabolic SAR adapted as trailing stop loss.
For ATR , you can use the “ATR Trailing Stop Multiplier” parameter to set an initial offset for trailing stop loss.
Take Profit Target:
- Average True Range (ATR) – ATR % stop as trailing stop loss.
- Standard % – Percent as target profit
For ATR , you can use the “ATR Take Profit Multiplier” parameter to set an initial offset for trailing stop loss.
Additional feature include:
- Show Bar Colors
STRATEGY ONLY:
- Set back test date range
- Set trade direction - Long, Short or Both
- Use timed exit - Select method and bars
- Method 1: Exit after specified number of bars.
- Method 2: Exit after specified number of bars, ONLY if position is currently profitable.
- Method 3: Exit after specified number of bars, ONLY if position is currently losing.
TradingView Links:
Alerts:
T3-CCI Indicator:
Advance ADX:
How to use:
1. Apply the script by browsing through Indicators --> Invite-Only scripts and select the indicator
2. Once loaded, click the gear (settings) button to select/adjust the parameters based on your preference.
3. Wait for the next BUY or SELL signal to enter the trade!
Disclaimer:
The indicator and signals generated do not constitute investment advice; are provided solely for informational purposes and therefore is not an offer to buy or sell a security; are not warranted to be correct, complete or accurate; and are subject to change without notice.

T3-CCI Alerts [SystemAlpha]This is an alert companion of the T3-CCI Strategy based on FX Sniper's T3-CCI indicator. Instead of using just the normal buy and sell signal, we added an option to use trend filters, trailing stop loss and take profit targets.
The TTM scalper indicator of John Carter’s Scalper Buys and Sells was originally created by HPotter and is a close approximation of the one described in his book Mastering the Trade.
In this study you have a choice of:
Trend Filters:
- Average Directional Index ( ADX ) – buy when price is trend is up and sell when trend is down.
- Moving Average (MA) – buy when price close above the defined moving average and sell when price close below moving average
- Parabolic SAR – buy when SAR is above price is above price and sell when SAR is below price.
- All - Use ADX , MA and SAR as filters
For MA Filter , you can use the “TF MA Type” and "TF MA Period" parameter to select Simple or Exponential Moving Average and length.
Stop Loss:
- Average True Range (ATR) – ATR % stop as trailing stop loss.
- Parabolic SAR ( SAR ) – Parabolic SAR adapted as trailing stop loss.
For ATR , you can use the “ATR Trailing Stop Multiplier” parameter to set an initial offset for trailing stop loss.
Take Profit Target:
- Average True Range (ATR) – ATR % stop as trailing stop loss.
- Standard % – Percent as target profit
For ATR , you can use the “ATR Take Profit Multiplier” parameter to set an initial offset for trailing stop loss.
Additional feature include:
- Show Bar Colors
Alerts:
When creating alerts use “Once Per Bar Close” parameter for Long and Short and “Once Per Bar” for Close, Trailing Stop, and Take Profit.
TradingView Links:
Strategy:
T3-CCI Indicator:
Advance ADX:
How to use:
1. Apply the script by browsing through Indicators --> Invite-Only scripts and select the indicator
2. Once loaded, click the gear (settings) button to select/adjust the parameters based on your preference.
3. Wait for the next BUY or SELL signal to enter the trade!
Disclaimer:
The indicator and signals generated do not constitute investment advice; are provided solely for informational purposes and therefore is not an offer to buy or sell a security; are not warranted to be correct, complete or accurate; and are subject to change without notice.

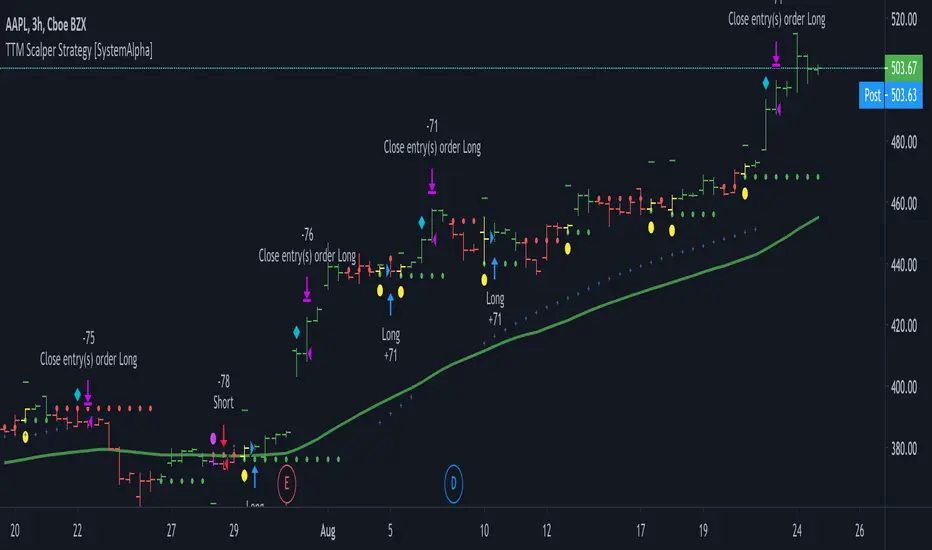
TTM Scalper Strategy [SystemAlpha]This is a strategy based on TTM scalper indicator. Instead of using just the normal buy and sell signal, we added an option to use trend filters, trailing stop loss and take profit targets.
The TTM scalper indicator of John Carter’s Scalper Buys and Sells was originally created by HPotter and is as a close approximation of the one described in his book Mastering the Trade.
In this study you have a choice of:
Trend Filters:
- Average Directional Index ( ADX ) – buy when price is trend is up and sell when trend is down.
- Moving Average (MA) – buy when price close above the defined moving average and sell when price close below moving average
- Parabolic SAR – buy when SAR is above price is above price and sell when SAR is below price.
- All - Use ADX , MA and SAR as filters
For MA Filter , you can use the “TF MA Type” and "TF MA Period" parameter to select Simple or Exponential Moving Average and length.
Stop Loss:
- Average True Range (ATR) – ATR % stop as trailing stop loss.
- Parabolic SAR ( SAR ) – Parabolic SAR adapted as trailing stop loss.
For ATR , you can use the “ATR Trailing Stop Multiplier” parameter to set an initial offset for trailing stop loss.
Take Profit Target:
- Average True Range (ATR) – ATR % stop as trailing stop loss.
- Standard % – Percent as target profit
For ATR , you can use the “ATR Take Profit Multiplier” parameter to set an initial offset for trailing stop loss.
Additional feature include:
- Show Bar Colors
STRATEGY ONLY:
- Set back test date range
- Set trade direction - Long, Short or Both
- Use timed exit - Select method and bars
- Method 1: Exit after specified number of bars.
- Method 2: Exit after specified number of bars, ONLY if position is currently profitable.
- Method 3: Exit after specified number of bars, ONLY if position is currently losing.
TradingView Links:
Alerts:
How to use:
1. Apply the script by browsing through Indicators --> Invite-Only scripts and select the indicator
2. Once loaded, click the gear (settings) button to select/adjust the parameters based on your preference.
3. Wait for the next BUY or SELL signal to enter the trade!
Disclaimer:
The indicator and signals generated do not constitute investment advice; are provided solely for informational purposes and therefore is not an offer to buy or sell a security; are not warranted to be correct, complete or accurate; and are subject to change without notice.
TTM Scalper Alerts [SystemAlpha]This is an alert companion of the TTM Scalper Strategy based on TTM scalper indicator. Instead of using just the normal buy and sell signal, we added an option to use trend filters, trailing stop loss and take profit targets.
The TTM scalper indicator of John Carter’s Scalper Buys and Sells was originally created by HPotter and is a close approximation of the one described in his book Mastering the Trade.
In this study you have a choice of:
Trend Filters:
- Average Directional Index ( ADX ) – buy when price is trend is up and sell when trend is down.
- Moving Average (MA) – buy when price close above the defined moving average and sell when price close below moving average
- Parabolic SAR – buy when SAR is above price is above price and sell when SAR is below price.
- All - Use ADX , MA and SAR as filters
For MA Filter , you can use the “TF MA Type” and "TF MA Period" parameter to select Simple or Exponential Moving Average and length.
Stop Loss:
- Average True Range (ATR) – ATR % stop as trailing stop loss.
- Parabolic SAR ( SAR ) – Parabolic SAR adapted as trailing stop loss.
For ATR , you can use the “ATR Trailing Stop Multiplier” parameter to set an initial offset for trailing stop loss.
Take Profit Target:
- Average True Range (ATR) – ATR % stop as trailing stop loss.
- Standard % – Percent as target profit
For ATR , you can use the “ATR Take Profit Multiplier” parameter to set an initial offset for trailing stop loss.
Additional feature include:
- Show Bar Colors
Alerts:
When creating alerts use “Once Per Bar Close” parameter for Long and Short and “Once Per Bar” for Close, Trailing Stop, and Take Profit.
TradingView Links:
Strategy:
Reference:
HPotter TTM scalper indicator Strategy
How to use:
1. Apply the script by browsing through Indicators --> Invite-Only scripts and select the indicator
2. Once loaded, click the gear (settings) button to select/adjust the parameters based on your preference.
3. Wait for the next BUY or SELL signal to enter the trade!
Disclaimer:
The indicator and signals generated do not constitute investment advice; are provided solely for informational purposes and therefore is not an offer to buy or sell a security; are not warranted to be correct, complete or accurate; and are subject to change without notice.

MACD++ Strategy [SystemAlpha]This is a strategy based on MACD Oscillator. Instead of using just the normal crossovers, we use trend filters, trailing stop loss and take profit targets. This strategy was developed for crypto, forex and stocks on daily timeframe but feel free to experiment on 15 minutes or higher using heikin ashi or normal candles
In this strategy you have a choice of:
Trend Filters:
- Average Directional Index ( ADX ) – buy when price is trend is up and sell when trend is down.
- Moving Average (MA) – buy when price close above the defined moving average and sell when price close below moving average
- Parabolic SAR – buy when SAR is above price is above price and sell when SAR is below price.
- All - Use ADX , MA and SAR as filters
For MA Filter , you can use the “TF MA Type” and "TF MA Period" parameter to select Simple or Exponential Moving Average and length.
Stop Loss:
- Average True Range (ATR) – ATR % stop as trailing stop loss.
- Parabolic SAR ( SAR ) – Parabolic SAR adapted as trailing stop loss.
For ATR , you can use the “ATR Trailing Stop Multiplier” parameter to set an initial offset for trailing stop loss.
Take Profit Target:
- Average True Range (ATR) – ATR % stop as trailing stop loss.
- Standard % – Percent as target profit
For ATR , you can use the “ATR Take Profit Multiplier” parameter to set an initial offset for trailing stop loss.
Additional feature include:
- Regular and Hidden Divergence display and alerts
STRATEGY ONLY:
- Set back test date range
- Set trade direction - Long, Short or Both
- Use timed exit - Select method and bars
- Method 1: Exit after specified number of bars.
- Method 2: Exit after specified number of bars, ONLY if position is currently profitable.
- Method 3: Exit after specified number of bars, ONLY if position is currently losing.
TradingView Links:
Alerts:
MACD:
How to use:
1. Apply the script by browsing through Indicators --> Invite-Only scripts and select the indicator
2. Once loaded, click the gear (settings) button to select/adjust the parameters based on your preference.
3. Wait for the next BUY or SELL signal to enter the trade!
Disclaimer:
The indicator and signals generated do not constitute investment advice; are provided solely for informational purposes and therefore is not an offer to buy or sell a security; are not warranted to be correct, complete or accurate; and are subject to change without notice.

MACD+ Strategy [SystemAlpha]This is a strategy based on MACD Oscillator . Instead of using just the normal crossovers, we use trend filters, trailing stop loss and take profit targets. This strategy was developed for crypto, forex and stocks on daily timeframe but feel free to experiment on 15 minutes or higher using heikin ashi or normal candles
In this strategy you have a choice of:
Trend Filters:
- Average Directional Index ( ADX ) – buy when price is trend is up and sell when trend is down.
- Moving Average (MA) – buy when price close above the defined moving average and sell when price close below moving average
- Parabolic SAR – buy when SAR is above price is above price and sell when SAR is below price.
- All - Use ADX , MA and SAR as filters
For MA Filter , you can use the “TF MA Type” and "TF MA Period" parameter to select Simple or Exponential Moving Average and length.
Stop Loss:
- Average True Range (ATR) – ATR % stop as trailing stop loss.
- Parabolic SAR ( SAR ) – Parabolic SAR adapted as trailing stop loss.
For ATR , you can use the “ATR Trailing Stop Multiplier” parameter to set an initial offset for trailing stop loss.
Take Profit Target:
- Average True Range (ATR) – ATR % stop as trailing stop loss.
- Standard % – Percent as target profit
For ATR , you can use the “ATR Take Profit Multiplier” parameter to set an initial offset for trailing stop loss.
Additional feature include:
- Regular and Hidden Divergence display and alerts
STRATEGY ONLY:
- Set back test date range
- Set trade direction - Long, Short or Both
- Use timed exit - Select method and bars
- Method 1: Exit after specified number of bars.
- Method 2: Exit after specified number of bars, ONLY if position is currently profitable.
- Method 3: Exit after specified number of bars, ONLY if position is currently losing.
TradingView Links:
Alerts:
MACD:
How to use:
1. Apply the script by browsing through Indicators --> Invite-Only scripts and select the indicator
2. Once loaded, click the gear (settings) button to select/adjust the parameters based on your preference.
3. Wait for the next BUY or SELL signal to enter the trade!
Disclaimer:
The indicator and signals generated do not constitute investment advice; are provided solely for informational purposes and therefore is not an offer to buy or sell a security; are not warranted to be correct, complete or accurate; and are subject to change without notice.

MACD+ Alerts [SystemAlpha]This is the alert companion of the MACD+ Strategy . Instead of using just the normal crossovers, we use trend filters, trailing stop loss and take profit targets. This strategy was developed for crypto, forex and stocks on daily timeframe but feel free to experiment on 15 minutes or higher using heikin ashi or normal candles.
In this alert you have a choice of:
Trend Filters:
- Average Directional Index ( ADX ) – buy when price is trend is up and sell when trend is down.
- Moving Average (MA) – buy when price close above the defined moving average and sell when price close below moving average
- Parabolic SAR – buy when SAR is above price is above price and sell when SAR is below price.
- All - Use ADX , MA and SAR as filters
For MA Filter , you can use the “TF MA Type” and "TF MA Period" parameter to select Simple or Exponential Moving Average and length.
Stop Loss:
- Average True Range (ATR) – ATR % stop as trailing stop loss.
- Parabolic SAR ( SAR ) – Parabolic SAR adapted as trailing stop loss.
For ATR , you can use the “ATR Trailing Stop Multiplier” parameter to set an initial offset for trailing stop loss.
Take Profit Target:
- Average True Range (ATR) – ATR % stop as trailing stop loss.
- Standard % – Percent as target profit
For ATR , you can use the “ATR Take Profit Multiplier” parameter to set an initial offset for trailing stop loss.
Additional feature include:
- Regular and Hidden Divergence display and alerts
Alerts:
When creating alerts use “Once Per Bar Close” parameter for Long and Short and “Once Per Bar” for Close, Trailing Stop, Take Profit and Divergence.
TradingView Links:
Strategy:
MACD:
How to use:
1. Apply the script by browsing through Indicators --> Invite-Only scripts and select the indicator
2. Once loaded, click the gear (settings) button to select/adjust the parameters based on your preference.
3. Wait for the next BUY or SELL signal to enter the trade!
Disclaimer:
The indicator and signals generated do not constitute investment advice; are provided solely for informational purposes and therefore is not an offer to buy or sell a security; are not warranted to be correct, complete or accurate; and are subject to change without notice.

WaveTrend+ Strategy [SystemAlpha]This is a WaveTrend strategy based on WaveTrend Oscillator. In addition to using the normal crossovers, we use trend filters, trailing stop loss and take profit targets. WT+ Strategy was developed for crypto, forex and stocks for 15 minutes to daily timeframe. The main goal was to catch long term trends and ride them.
In this strategy you have a choice of:
Trend Filters:
- Average Directional Index (ADX) – buy when price is trend is up and sell when trend is down.
- Moving Average (MA) – buy when price close above the defined moving average and sell when price close below moving average
- Parabolic SAR – buy when SAR is above price is above price and sell when SAR is below price.
- All - Use ADX, MA and SAR as filters
For MA Filter , you can use the “TF MA Type” and "TF MA Period" parameter to select Simple or Exponential Moving Average and length.
Stop Loss:
- Average True Range (ATR) – ATR % stop as trailing stop loss.
- Parabolic SAR (SAR) – Parabolic SAR adapted as trailing stop loss.
For ATR , you can use the “ATR Trailing Stop Multiplier” parameter to set an initial offset for trailing stop loss.
Take Profit Target:
- Average True Range (ATR) – ATR % stop as trailing stop loss.
- Standard % – Percent as target profit
For ATR , you can use the “ATR Take Profit Multiplier” parameter to set an initial offset for trailing stop loss.
Additional feature include:
- Regular and Hidden Divergence display and alerts
- Filter Overbought and Oversold
- Use WT Cross for Exit
STRATEGY ONLY:
- Set backtest dates
- Set Trade direction - Long, Short or Both
- Use timed exit - Select method and bars
- Method 1: Exit after specified number of bars.
- Method 2: Exit after specified number of bars, ONLY if position is currently profitable.
- Method 3: Exit after specified number of bars, ONLY if position is currently losing.
TradingView Links:
WT+ Oscillator Companion:
WT+ Alerts:
How to use:
1. Apply the script by browsing through Indicators --> Invite-Only scripts and select the indicator
2. Once loaded, click the gear (settings) button to select/adjust the parameters based on your preference.
3. Wait for the next BUY or SELL signal to enter the trade!
Disclaimer:
The indicator and signals generated do not constitute investment advice; are provided solely for informational purposes and therefore is not an offer to buy or sell a security; are not warranted to be correct, complete or accurate; and are subject to change without notice.

WaveTrend+ Alerts [SystemAlpha]This is the alert companion of the WaveTrend+ Strategy . Instead of using just the normal crossovers, we use trend filters, trailing stop loss and take profit targets. WT+ Strategy was developed for crypto, forex and stocks for 15 minutes to daily timeframe. The main goal was to catch long term trends and ride them.
In this alert you have a choice of:
Trend Filters:
- Average Directional Index (ADX) – buy when price is trend is up and sell when trend is down.
- Moving Average (MA) – buy when price close above the defined moving average and sell when price close below moving average
- Parabolic SAR – buy when SAR is above price is above price and sell when SAR is below price.
- All - Use ADX, MA and SAR as filters
For MA Filter , you can use the “TF MA Type” and "TF MA Period" parameter to select Simple or Exponential Moving Average and length.
Stop Loss:
- Average True Range (ATR) – ATR % stop as trailing stop loss.
- Parabolic SAR (SAR) – Parabolic SAR adapted as trailing stop loss.
For ATR , you can use the “ATR Trailing Stop Multiplier” parameter to set an initial offset for trailing stop loss.
Take Profit Target:
- Average True Range (ATR) – ATR % stop as trailing stop loss.
- Standard % – Percent as target profit
For ATR , you can use the “ATR Take Profit Multiplier” parameter to set an initial offset for trailing stop loss.
Additional feature include:
- Regular and Hidden Divergence display and alerts
- Filter Overbought and Oversold
- Use WT Cross for Exit
TradingView Links:
WT+ Oscillator:
How to use:
1. Apply the script by browsing through Indicators --> Invite-Only scripts and select the indicator
2. Once loaded, click the gear (settings) button to select/adjust the parameters based on your preference.
3. Wait for the next BUY or SELL signal to enter the trade!
Disclaimer:
The indicator and signals generated do not constitute investment advice; are provided solely for informational purposes and therefore is not an offer to buy or sell a security; are not warranted to be correct, complete or accurate; and are subject to change without notice.

Algorithm Builder - Multiple Trends+ (Plug & Play)Hello traders
I. SCRIPTS ACCESS AND TRIALS
1. For the trial request access, they have to be done through my website .
2. My website URL is in this script signature at the very bottom (you'll have to scroll down a bit and going past the long description) and in my profile status available here : Daveatt
Due to the new scripts publishing house rules, I won't mention the URL here directly. As I value my partnership with TradingView very much, I prefer showing you the way for finding them :)
3. You may also contact me directly for more information
II. Algorithm Builder - Multiple Trends
2.1 Forewords
The Multiple Trends+ is the update of the Multiple Trends and includes a built-in Trade Manager and PnL/Risk-Reward Panel
This indicator is available only to our PREMIUM users. Our PREMIUM indicators offer more trading analysis capabilities and opportunities.
A few words of caution: the Algorithm Builders - Multiple Trends are more advanced and as such, would require slightly more time to be mastered.
They're not that much difficult, but we understand that designing a trading system with 2 trends might be slightly more complicated - however, there is nothing to be scared of :).
The time spent to learn how to use our PREMIUM tools might be rewarded handsomely.
2.2 Concept
The Algorithm Builder - Multiple Trends is made to detect the convergence of many unrelated indicators and give a BUY or SELL signal whenever all the selected sub-indicators are converging in the same direction.
This is an upgrade of the PRO package giving access to the Algorithm Builder - Single Trend - designed to show 1 unique entry per trend - whereas the Multiple Trends offers re-entries in the same direction of the trend if the indicator detects good convergences to accumulate more positions.
III. Plug & Play
Hope you're ready to be impressed. Because, what I'm about to introduce, is my best-seller feature - and available across many of my indicators.
In TradingView, there is a feature called "Indicator on Indicator" meaning you can use an external indicator as a data source for another indicator.
I'm using that feature to connect any external indicator to our Algorithm Builder Multiple Trends+ Plug & Play (hence the plug and play name).
Let's assume we have an RSI divergence indicator - which is not part of the Algorithm Builder - but noticed that the convergence of an RSI divergence and a MACD gives strong signals.
I mentioned an RSI divergence, but you may connect any oscillator (MACD, On balance volume, stochastic RSI, True Strenght index, and many more..) or non-oscillator (divergence, trendline break, higher highs/lower lows, candlesticks pattern, price action, harmonic patterns, ...) indicators.
THE SKY IS (or more likely your imagination) is the limit :)
Fear no more. The Plug&Play technology allows you to connect it and use it in the convergence/confluence calculations.
Hence, whenever the MACD and RSI divergence will be in the same direction every time you'll get a convergence.
PS: Whereas it's only the first time only because this is a Single trend edition.
To connect your external indicator to ours, we're using a native TradingView feature, which is not available for all users.
It depends on your TradingView subscription plan ( More info here )
If you intend to use our Algorithm Plug&Play indicator, and/or our Backtest Plug&Play suites, then you must upgrade your TradingView account to enjoy those features.
We value our relationship with our customers seriously, and that's why we're warning upfront you that a compatible TradingView account type is required - at least PRO+ or PREMIUM to add more than 1 Plug&Play indicator per account.
We go in-depth on our website why the Plug&Play is an untapped opportunity for many traders out there - URL available on my profile status and signature
IV. Multiple Trends versus Single Trend
4.1 Multiple Trends benefits
A friend asked us recently Why using the Multiple Trends if we can use the Single Trend in a smaller timeframe, and get more entries that way?
We thought this was an excellent question, but the answer is obvious.
Using a Single Trend on a smaller timeframe to solely getting more entries will reduce the security of the given trades.
We designed the Algorithm Builders to take a trade in an identified trend but reducing the timeframe too much will mostly increase your risk - and might lead to capital loss.
By the way, this is a universal rule valid also for a big majority of indicators.
We're absolutely not saying that the Single Trend won't work on small timeframes because actually it really does. But, if you find out a great configuration for your Single Trend, and want to get more signals without increasing your risk - then the Multiple Trends would be a very viable option.
4.2 Main signal versus secondary signals
For the main and secondary trends, the color green symbolizes any identified "BUY" trend. And the color red symbolizes any identified "SELL" trend.
-The MAIN trend symbol is unique and symbolized by a triangle.
- The SECONDARY (could also be called re-entries) trends are multiple and symbolized by a diamond.
In the Algorithm Builder indicator settings, they're identified with the Additional keyword.
4.3 How the convergences are calculated
Extremely important: The diamonds (or re-entries) are displayed, as long as a triangle (or main/primary signal) is displayed.
For a trend change (buy to sell or sell to buy), the system waits for ALL selected re-entries sub-indicators , to give a convergence/confluence in the opposite direction.
For example, let's assume a BUY/green convergence based on 3 indicators. One or Two of them going turning red, won't be enough for a trend change.
But, if all of them turn red, then we'll see a red triangle - signaling the beginning of a new downtrend.
4.4 Why multiple entries?
Here are a few use cases :
1. The main use case why we made those Multiple Trends indicators: A trader got invalidated or stopped out on a trade, but wants a system to let hin/her jump back in with a minimum of security. (security depending on the configuration of the Algorithm Builder as a whole).
This is very frustrating to get in a trade, being stopped out, and finally, see the trade going in the expected direction.
Even more frustrating to jump back in at the end of a trend, and get stopped out again - we all agree on this.
2. You want to add more positions on your main trade as your Algo Builder identified a solid trend - this is a nice way to possibly maximize your gains.
Once again, we don't/won't guarantee any performance result (not because we don't believe in our tools, but for legal reason), all depends on the time spent reading our documentation and playing with the Algo Builder - as explained on our Tutorials.
More info available on our website. URL available in this script signature and on my profile status.
V. Why the Algorithm Builder Multiple Trends+ may help you
I worked with many traders during my career, and their feedback about trading is often pretty similar.
They all tried a lot of complicated indicators, losing their capital, and finally getting back to the basics (even to the basic indicators if I might say)
The art is finding a good combination of indicators and setting strict money/risk management rules.
Easy in concept, but more than 90+% of traders lose money on the markets... which teach us that trading is not only about drawing trendlines, or using cool indicators but finding ways to ease our psychology while trading.
5.1 The Algorithm Builder trading framework
The sub-indicators (full list on our website) weren't chosen randomly. They're based on a trading method we've developed over the last 6 years - while working with traders and other trading quants.
The Algo Builders are made to detect a convergence - and as such, will give a signal once a trend has been identified.
They're not made to detect reversal but have been designed to give a signal when all sub-indicators are either ALL bullish (green) or ALL bearish (red).
We provide a framework based on indicators we selected because they:
1. make sense to be used altogether
2. work on asset classes like INDEX, CRYPTO, STOCK OPTIONS, FOREX, COMMODITIES
3. it may expand your knowledge about what detecting a convergence with pre-selected indicator really means
5.2 Supports and Resistances
The indicator displays the main algorithmic supports and resistances according to our trading method.
I think they're relevant for all asset classes, but you're absolutely free to use any different supports/resistances logic if you want to.
I'm not against it because I know that pivots, Fibonacci levels, etc. may work very well also.
5.3 Choose your favorite risk management algorithm
1/ Pre-defined Algo S/R method using:
- a supertrend of the stop-loss
- the nearest algorithmic resistances for the take profit levels.
2/ Define your own Stop-loss and Take-profits level in real-time
Stop-Loss Management
For what's following, let's assume that 2 is the stop-loss value you inserted in the indicator, and the Algorithm Builder gives a BUY signal.
This is NOT a recommendation at all, only an example to explain how this feature works.
- %Trailing: The Stop-Loss starts 2% away from the entry price - and will move up (because we're on a BUY trade as per our example) every time your trade will gain 2% profit
- Percentage: The Stop-Loss stays static 2% away from the entry price. There is no trailing here
- TP Trailing: This is a very awesome feature. The stop-loss is set 2% away when the trades start.
When the TP1 is hit, the stop-loss will be moved to the Entry price (also called breakeven).
When the TP2 is hit, the SL is moved to the previous TP1 position
- Fixed: Set the Stop-Loss at a fixed position (value should be in currency/units)
Take Profits Management
You can manage up to 2 take profit levels defined as a percentage or price value.
The expected input is in percentage value (for instance, setting the % target of TP1 to 2% will set the TP1 level 2% away from the entry price
5.4 Built-in Trade Manager
This is very likely the most loved utility script that we shared on TradingView.
It's included in your Algorithm Builder - Single Trend+, and will certainly help you immensely to analyze your charts and your trades.
We made sure that all the graphical elements on the chart will be updated in real-time whenever our user change anything on the indicator configuration.
You'll also be able to change the Trade Manager labels positions as you wish :)
5.5 Built-in Risk-to-Reward Panel
The good stuff doesn't stop here.
You'll notice that this sometimes green (when in a LONG), sometimes red (when in a SHORT) panel at the right of your chart.
It displays for the selected trading algorithmic (see 2.3.2 above), a ton of useful real-time analytics.
- Entry Price: the price when the Algorithm Builder will give a signal.
- The Trade PnL in percentage.
- Entry Stop Loss: Distance (in currency/units) between the selected stop-loss algorithm (percent, trailing, TP trailing, etc.) and the entry price.
- Entry TP1: Distance (in currency/units) between the entry price and the first take profit
- Entry TP2: Distance (in currency/units) between the entry price and the second take profit
- Risk/Reward TP1: Using the Stop-loss distance at entry, and Take Profit 1 at entry to compute the risk-to-reward ratio.
- Risk/Reward TP2: Using the Stop-loss distance at entry, and Take Profit 2 at entry to compute the risk-to-reward ratio.
For more details, please check the guides section of my website. Links are in my signature and profile status.
5.6 Built-in PnL real-time calculations
YES!!!! you read it correctly
The panel displays the risk-to-reward ratios but also the PnL (Profit and Loss in percentage value) of the current and last trade
5.7 Hard Exits
Our trading method is known for the hard exits, also called invalidation.
The Single Trend+ includes a hard exit based on a MACD - settings are flexible and you may update them.
Having a stop-loss protecting your trade is a best practice - Protecting your stop-loss also from getting hit is incredible.
We prefer invalidate a few positions, even if sometimes we don't want to. Rather than the market hard exiting on us, and leaving with our hard-working money.
5.8 Alerts
Alerts are enabled for:
- BUY/SELL MAIN triangles signals
- BUY/SELL SECONDARY diamond signals
- Trade Manager alerts (Stop Loss, Take Profit 1, Take Profit 2)
- Hard Exits
VI. Pain points that we're trying to solve with our Algorithm Builders
Issue #1 There are many informations / indicators / strategies / backtests / noise. Finding the right ones is not a simple task.
Solution #1 A reliable system that removes the external noise is much needed in trading to stay "in the game".
Issue #2 Trading could be quite stressful - The majority doesn't lose in trading because technical analysis is hard, but because managing our psychology is one of the hardest things a human can do.
Solution #2 Some ways to reduce the "trading stress" could be: getting better quality signals and trading like a "machine". Forgetting about Twitter and trusting the system you designed.
Issue #3 Trading without strict rules and only based on what we feel, or what we think the market should do is the fastest way to kiss our money goodbye.
Only 1 indicator generally is not enough. Traders generally use a combination of several indicators but they're monitoring them individually.
It's normal then to feel exhausted at the end of the day ^^ (to say the least)... and exhaustion leads to mistakes which leads to..... (I'm sure you got it) ... capital loss.
Solution #3 As a trader, I needed a trading framework and a method. I offer our trading method but they're plenty others out there. We cannot claim obviously it's the best ever ....but let's say we're using those exact same
scripts ourselves for our trading. And this what we've been recommending our clients to trade with for the past years. Also, having a tool detecting the convergence of several indicators and giving 1 unique signal
for BUY/SELL position will save you a lot of time/energy, and perhaps might help you out getting better trading performance.
VII. Resolving a complex puzzle and having fun in the process
Trading has to stay a passion and not (only be) a source of intense stress.
The most successful traders I know are "trading geeks" - literally always looking for optimizing, searching for the best possible entries, setups, indicators, tools, etc.
For them, it's not even about the money anymore, but only about beating their previous performance.
Why are they doing this? Because it's fun
Might appears as a bold statement, but I guarantee that looking for setups is fun.
One of our users even told us, that it's like playing with "Legos" and we couldn't possibly agree more.
VIII. Designing a system that "makes sense"
Another bold statement now. Brace yourselves ladies and gentlemen
The Algorithm Builders allow to design trading systems quickly. What could takes days/weeks/months to find out... might be now within your reach in less than a few hours.
With a bit of practice, less than an hour might be enough per asset/timeframe to find a system that makes sense to you and adapted to your trading capital and psychology.
Assuming our users read our guides and are fully committed to learning a new way of trading - then we do guarantee you'll be able to design kick-ass trading systems that make sense.
"Making sense" doesn't mean at all it's guaranteed to win, it means you're the one defining the convergence of indicators, using your Algorithm Builder, and observe that most of the time - whenever there is a BUY signal, the candlesticks are going upwards - whenever there is a SELL signal, it's going downwards.
This is a necessary step to make real progress from a trading analyst perspective - and hopefully could lead to profits.
VIII. Algorithm Builder versus the main trader enemy(=psychology)
This indicator has the goal to help solving one of the MAIN issues encountered by traders.
Most of traders realize, they can't perform with only 1 indicator (or 1 price pattern or 1 price action) and need a combination of multiple indicators before getting in a trade.
Far from being a magic pill, if it could at least reduce the stress you have while trading, then we'll consider we made a great job - it's a technical "useless noise remover", and needs to be followed strictly.
Such trust in a trading system can only be built by testing your Algorithm Builder configuration on either:
1. a demo account
2. or a live account with small bids. And then, increasing progressively the bids if your capital increases progressively.
Though, you should still use your common sense. (for instance: if we get a BUY signal right on a big timeframe resistance we're hitting for the first time).
I'm aware this is a new way of trading but for many, and while we cannot foresee the future, neither predict performance, we believe it might save you a lot of time to find good signals.
My maximum level of happiness will be reached the day when our users will contact me and showing me setups being mine.
I'm sure that even I can learn from my users and, we can all learn from each other Algorithm Builder configuration
IX. What is a wrong or bad configuration?
Simply put. If you see that most of your signals react such as described below:
1. a buy triangle/diamond predicts, most of the time an upwards move
2. a sell triangle/diamond predicts, most of the time a downwards move
3. you estimated yourself the stop-loss needed to give enough room for your trades.
4. take profits based on algorithmic support and resistances or your own take profit method.
So what's a good Algorithm Builder configuration? A configuration you're happy with and makes sense.
A better Algorithm Builder setup is one used in demo or a live account w/ small bids for a few weeks, and you're consistent in your trading performance.
If you have any doubt or question, please hit me up directly or ask in the comments section of this script.
I'll never claim I have the best trading methodology or the best indicators. You only will be the judge, and I'll appreciate all the questions and feedback you're sending my way.
They help me a ton to develop indicators based on all the requests I received.
Kind regards,
Dave