Algorithm Builder - Single Trend+ (MTF)Hello traders
I. SCRIPTS ACCESS AND TRIALS
1. For the trial request access, they have to be done through my website .
2. My website URL is in this script signature at the very bottom (you'll have to scroll down a bit and going past the long description) and in my profile status available here : Daveatt
Due to the new scripts publishing house rules, I won't mention the URL here directly. As I value my partnership with TradingView very much, I prefer showing you the way for finding them :)
3. You may also contact me directly for more information
II. Algorithm Builder - Single Trend+ (MTF)
2.1 Concept
MTF means Multi Timeframes - we all agree that saying MTF is nicer and easier than multi-timeframe.
That script is an upgrade of the Single Trend:
The Algorithm Builder - Single Trend+ (Multiple Timeframes/MTF) is made to detect the convergence of many unrelated indicators, and give a BUY or SELL signal whenever all the selected sub-indicators - each may be using a different timeframe - are converging in the same direction.
Now sit tight because what's going to be announced will be awesome. Are you ready for it?... :)
The MTF version allows to detect the convergence for indicators in different timeframes. Each indicator has its own timeframe - expanding, even more, your trading analysis capabilities.
In other words, you could, for instance, detects the convergence of an H1 MACD with an H2 Supertrend, and why not also adding an m30 Moving Averages cross in the mix.
The Single Trend+ MTF gives one single entry per identified trend - unlike the Multiple Trends editions (also available on my scripts page) which may give more than 1 entry per trend.
The traders select the sub-indicators they want, and see in real-time the BUY and SELL triangles being updated.
2.2 Why the Algorithm Builder Single Trend may help you
I worked with many traders during my career, and their feedback about trading is often pretty similar.
They all tried a lot of complicated indicators, losing their capital, and finally getting back to the basics (even to the basic indicators if I might say)
The art is finding a good combination of indicators and setting strict money/risk management rules.
Easy in concept, but more than 90+% of traders lose money on the markets... which teach us that trading is not only about drawing trendlines, or using cool indicators but finding ways to ease our psychology while trading.
2.3 The Algorithm Builder trading framework
The sub-indicators (full list on our website) weren't chosen randomly. They're based on a trading method we've developed over the last 6 years - while working with traders and other trading quants.
The Algo Builders are made to detect a convergence - and as such, will give a signal once a trend has been identified.
They're not made to detect reversal but have been designed to give a signal when all sub-indicators are either ALL bullish (green) or ALL bearish (red).
We provide a framework based on indicators we selected because they:
1. make sense to be used altogether
2. work on asset classes like INDEX, CRYPTO, STOCK OPTIONS, FOREX, COMMODITIES
3. it may expand your knowledge about what detecting a convergence with pre-selected indicator really means
2.3.1 Supports and Resistances
The indicator displays the main algorithmic supports and resistances according to our trading method.
I think they're relevant for all asset classes, but you're absolutely free to use any different supports/resistances logic if you want to.
I'm not against it because I know that pivots, Fibonacci levels, etc. may work very well also.
2.3.2 Choose your favorite risk management algorithm
1/ Pre-defined Algo S/R method using:
- a supertrend of the stop-loss
- the nearest algorithmic resistances for the take profit levels.
2/ Define your own Stop-loss and Take-profits level in real-time
Stop-Loss Management
For what's following, let's assume that 2 is the stop-loss value you inserted in the indicator, and the Algorithm Builder gives a BUY signal.
This is NOT a recommendation at all, only an example to explain how this feature works.
- %Trailing: The Stop-Loss starts 2% away from the entry price - and will move up (because we're on a BUY trade as per our example) every time your trade will gain 2% profit
- Percentage: The Stop-Loss stays static 2% away from the entry price. There is no trailing here
- TP Trailing: This is a very awesome feature. The stop-loss is set 2% away when the trades start.
When the TP1 is hit, the stop-loss will be moved to the Entry price (also called breakeven).
When the TP2 is hit, the SL is moved to the previous TP1 position
- Fixed: Set the Stop-Loss at a fixed position (value should be in currency/units)
Take Profits Management
You can manage up to 2 take profit levels defined as a percentage or price value.
The expected input is in percentage value (for instance, setting the % target of TP1 to 2% will set the TP1 level 2% away from the entry price
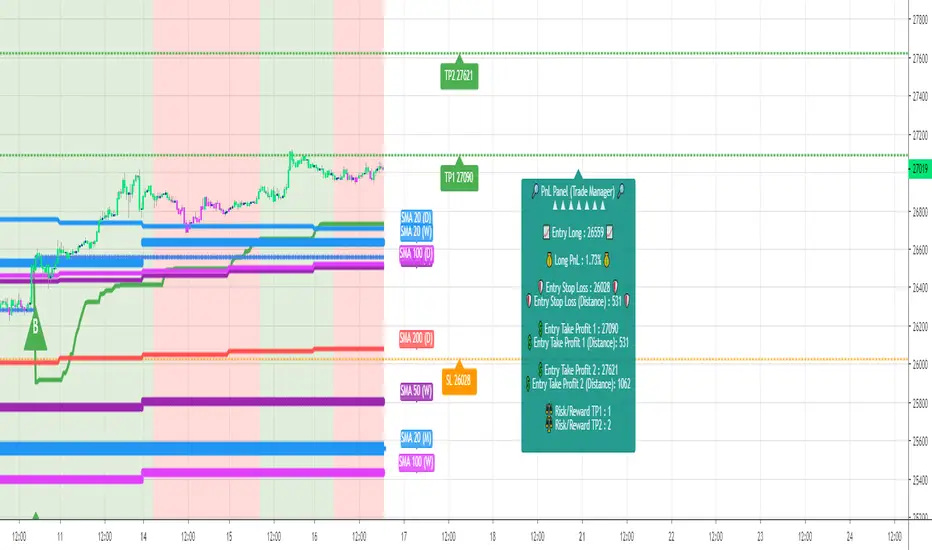
2.3.3 Built-in Trade Manager
This is very likely the most loved utility script that we shared on TradingView.
It's included in your Algorithm Builder - Single Trend+, and will certainly help you immensely to analyze your charts and your trades.
We made sure that all the graphical elements on the chart will be updated in real-time whenever our user change anything on the indicator configuration.
You'll also be able to change the Trade Manager labels positions as you wish :)
2.3.4 Built-in Risk-to-Reward Panel
The good stuff doesn't stop here.
You'll notice that this sometimes green (when in a LONG), sometimes red (when in a SHORT) panel at the right of your chart.
It displays for the selected trading algorithmic (see 2.3.2 above), a ton of useful real-time analytics.
- Entry Price: the price when the Algorithm Builder will give a signal.
- The Trade PnL in percentage.
- Entry Stop Loss: Distance (in currency/units) between the selected stop-loss algorithm (percent, trailing, TP trailing, etc.) and the entry price.
- Entry TP1: Distance (in currency/units) between the entry price and the first take profit
- Entry TP2: Distance (in currency/units) between the entry price and the second take profit
- Risk/Reward TP1: Using the Stop-loss distance at entry, and Take Profit 1 at entry to compute the risk-to-reward ratio.
- Risk/Reward TP2: Using the Stop-loss distance at entry, and Take Profit 2 at entry to compute the risk-to-reward ratio.
For more details, please check the guides section of my website. Links are in my signature and profile status.
2.3.5 Hard Exits
Our trading method is known for the hard exits, also called invalidation.
The Single Trend+ includes a hard exit based on a MACD - settings are flexible and you may update them.
Having a stop-loss protecting your trade is a best practice - Protecting your stop-loss also from getting hit is incredible.
We prefer invalidate a few positions, even if sometimes we don't want to. Rather than the market hard exiting on us, and leaving with our hard-working money.
2.3.6 Alerts
Alerts are enabled for:
- BUY/SELL triangles signals
- Trade Manager (SL, TP1, TP2)
- Hard Exits
III. Pain points that we're trying to solve with our Algorithm Builders
Issue #1 There are many informations / indicators / strategies / backtests / noise. Finding the right ones is not a simple task.
Solution #1 A reliable system that removes the external noise is much needed in trading to stay "in the game".
Issue #2 Trading could be quite stressful - The majority doesn't lose in trading because technical analysis is hard, but because managing our psychology is one of the hardest things a human can do.
Solution #2 Some ways to reduce the "trading stress" could be: getting better quality signals and trading like a "machine". Forgetting about Twitter and trusting the system you designed.
Issue #3 Trading without strict rules and only based on what we feel, or what we think the market should do is the fastest way to kiss our money goodbye.
Only 1 indicator generally is not enough. Traders generally use a combination of several indicators but they're monitoring them individually.
It's normal then to feel exhausted at the end of the day ^^ (to say the least)... and exhaustion leads to mistakes which leads to..... (I'm sure you got it) ... capital loss.
Solution #3 As a trader, I needed a trading framework and a method. I offer our trading method but they're plenty others out there. We cannot claim obviously it's the best ever ....but let's say we're using those exact same
scripts ourselves for our trading. And this what we've been recommending our clients to trade with for the past years. Also, having a tool detecting the convergence of several indicators and giving 1 unique signal
for BUY/SELL position will save you a lot of time/energy, and perhaps might help you out getting better trading performance.
III. Resolving a complex puzzle and having fun in the process
Trading has to stay a passion and not (only be) a source of intense stress.
The most successful traders I know are "trading geeks" - literally always looking for optimizing, searching for the best possible entries, setups, indicators, tools, etc.
For them, it's not even about the money anymore, but only about beating their previous performance.
Why are they doing this? Because it's fun
Might appears as a bold statement, but I guarantee that looking for setups is fun.
One of our users even told us, that it's like playing with "Legos" and we couldn't possibly agree more.
IV. Designing a system that "makes sense"
Another bold statement now. Brace yourselves ladies and gentlemen
The Algorithm Builders allow to design trading systems quickly. What could takes days/weeks/months to find out... might be now within your reach in less than a few hours.
With a bit of practice, less than an hour might be enough per asset/timeframe to find a system that makes sense to you and adapted to your trading capital and psychology.
Assuming our users read our guides and are fully committed to learning a new way of trading - then we do guarantee you'll be able to design kick-ass trading systems that make sense.
"Making sense" doesn't mean at all it's guaranteed to win, it means you're the one defining the convergence of indicators, using your Algorithm Builder, and observe that most of the time - whenever there is a BUY signal, the candlesticks are going upwards - whenever there is a SELL signal, it's going downwards.
This is a necessary step to make real progress from a trading analyst perspective - and hopefully could lead to profits.
V. Algorithm Builder versus the main trader enemy(=psychology)
This indicator has the goal to help solving one of the MAIN issues encountered by traders.
Most of traders realize, they can't perform with only 1 indicator (or 1 price pattern or 1 price action) and need a combination of multiple indicators before getting in a trade.
Far from being a magic pill, if it could at least reduce the stress you have while trading, then we'll consider we made a great job - it's a technical "useless noise remover", and needs to be followed strictly.
Such trust in a trading system can only be built by testing your Algorithm Builder configuration on either:
1. a demo account
2. or a live account with small bids. And then, increasing progressively the bids if your capital increases progressively.
Though, you should still use your common sense. (for instance: if we get a BUY signal right on a big timeframe resistance we're hitting for the first time).
I'm aware this is a new way of trading but for many, and while we cannot foresee the future, neither predict performance, we believe it might save you a lot of time to find good signals.
My maximum level of happiness will be reached the day when our users will contact me and showing me setups being mine.
I'm sure that even I can learn from my users and, we can all learn from each other Algorithm Builder configuration
VI. What is a wrong or bad configuration?
Simply put. If you see that most of your signals react such as described below:
1. a buy triangle predicts, most of the time an upwards move
2. a sell triangle predicts, most of the time a downwards move
3. you estimated yourself the stop-loss needed to give enough room for your trades.
4. take profits based on algorithmic support and resistances or your own take profit method.
So what's a good Algorithm Builder configuration? A configuration you're happy with and makes sense.
A better Algorithm Builder setup is one used in demo or a live account w/ small bids for a few weeks, and you're consistent in your trading performance.
If you have any doubt or question, please hit me up directly or ask in the comments section of this script.
I'll never claim I have the best trading methodology or the best indicators. You only will be the judge, and I'll appreciate all the questions and feedback you're sending my way.
They help me a ton to develop indicators based on all the requests I received.
Kind regards,
Dave
Search in scripts for "stop loss"

Algorithm Builder - Single Trend+Hello traders
I. SCRIPTS ACCESS AND TRIALS
1. For the trial request access, they have to be done through my website .
2. My website URL is in this script signature at the very bottom (you'll have to scroll down a bit and going past the long description) and in my profile status available here : Daveatt
Due to the new scripts publishing house rules, I won't mention the URL here directly. As I value my partnership with TradingView very much, I prefer showing you the way for finding them :)
3. You may also contact me directly for more information
II. Algorithm Builder - Single Trend+
2.1 Concept
That script is an upgrade of the Single Trend:
The Algorithm Builder - Single Trend+ was made to detect the convergence (also called confluence) of many unrelated indicators, giving a BUY or SELL signal whenever all the selected sub-indicators are converging in the same direction.
The Single Trend gives one single entry per identified trend - unlike the Multiple Trends editions (also available on my scripts page) which may give more than 1 entry per trend.
The traders select the sub-indicators they want, and see in real-time the BUY and SELL triangles being updated.
2.2 Why the Algorithm Builder Single Trend may help you
I worked with many traders during my career, and their feedback about trading is often pretty similar.
They all tried a lot of complicated indicators, losing their capital, and finally getting back to the basics (even to the basic indicators if I might say)
The art is finding a good combination of indicators and setting strict money/risk management rules.
Easy in concept, but more than 90+% of traders lose money on the markets... which teach us that trading is not only about drawing trendlines, or using cool indicators but finding ways to ease our psychology while trading.
2.3 The Algorithm Builder trading framework
The sub-indicators (full list on our website) weren't chosen randomly. They're based on a trading method we've developed over the last 6 years - while working with traders and other trading quants.
The Algo Builders are made to detect a convergence - and as such, will give a signal once a trend has been identified.
They're not made to detect reversal but have been designed to give a signal when all sub-indicators are either ALL bullish (green) or ALL bearish (red).
We provide a framework based on indicators we selected because they:
1. make sense to be used altogether
2. work on asset classes like INDEX, CRYPTO, STOCK OPTIONS, FOREX, COMMODITIES
3. it may expand your knowledge about what detecting a convergence with pre-selected indicator really means
2.3.1 Supports and Resistances
The indicator displays the main algorithmic supports and resistances according to our trading method.
I think they're relevant for all asset classes, but you're absolutely free to use any different supports/resistances logic if you want to.
I'm not against it because I know that pivots, Fibonacci levels, etc. may work very well also.
2.3.2 Choose your favorite risk management algorithm
1/ Pre-defined Algo S/R method using:
- a supertrend of the stop-loss
- the nearest algorithmic resistances for the take profit levels.
2/ Define your own Stop-loss and Take-profits level in real-time
Stop-Loss Management
For what's following, let's assume that 2 is the stop-loss value you inserted in the indicator, and the Algorithm Builder gives a BUY signal.
This is NOT a recommendation at all, only an example to explain how this feature works.
- %Trailing: The Stop-Loss starts 2% away from the entry price - and will move up (because we're on a BUY trade as per our example) every time your trade will gain 2% profit
- Percentage: The Stop-Loss stays static 2% away from the entry price. There is no trailing here
- TP Trailing: This is a very awesome feature. The stop-loss is set 2% away when the trades start.
When the TP1 is hit, the stop-loss will be moved to the Entry price (also called breakeven).
When the TP2 is hit, the SL is moved to the previous TP1 position
- Fixed: Set the Stop-Loss at a fixed position (value should be in currency/units)
Take Profits Management
You can manage up to 2 take profit levels defined as a percentage or price value.
The expected input is in percentage value (for instance, setting the % target of TP1 to 2% will set the TP1 level 2% away from the entry price
2.3.3 Built-in Trade Manager
This is very likely the most loved utility script that we shared on TradingView.
It's included in your Algorithm Builder - Single Trend+, and will certainly help you immensely to analyze your charts and your trades.
We made sure that all the graphical elements on the chart will be updated in real-time whenever our user change anything on the indicator configuration.
You'll also be able to change the Trade Manager labels positions as you wish :)
2.3.5 Built-in Risk-to-Reward Panel
The good stuff doesn't stop here.
You'll notice that this sometimes green (when in a LONG), sometimes red (when in a SHORT) panel at the right of your chart.
It displays for the selected trading algorithmic (see 2.3.2 above), a ton of useful real-time analytics.
- Entry Price: the price when the Algorithm Builder will give a signal.
- The Trade PnL in percentage.
- Entry Stop Loss: Distance (in currency/units) between the selected stop-loss algorithm (percent, trailing, TP trailing, etc.) and the entry price.
- Entry TP1: Distance (in currency/units) between the entry price and the first take profit
- Entry TP2: Distance (in currency/units) between the entry price and the second take profit
- Risk/Reward TP1: Using the Stop-loss distance at entry, and Take Profit 1 at entry to compute the risk-to-reward ratio.
- Risk/Reward TP2: Using the Stop-loss distance at entry, and Take Profit 2 at entry to compute the risk-to-reward ratio.
For more details, please check the guides section of my website. Links are in my signature and profile status.
2.3.6 Hard Exits
Our trading method is known for the hard exits, also called invalidation.
The Single Trend+ includes a hard exit based on a MACD - settings are flexible and you may update them.
Having a stop-loss protecting your trade is a best practice - Protecting your stop-loss also from getting hit is incredible.
We prefer invalidate a few positions, even if sometimes we don't want to. Rather than the market hard exiting on us, and leaving with our hard-working money.
2.3.7 Alerts
Alerts are enabled for:
- BUY/SELL triangles signals
- Trade Manager (SL, TP1, TP2)
- Hard Exits
III. Pain points that we're trying to solve with our Algorithm Builders
Issue #1 There are many informations / indicators / strategies / backtests / noise. Finding the right ones is not a simple task.
Solution #1 A reliable system that removes the external noise is much needed in trading to stay "in the game".
Issue #2 Trading could be quite stressful - The majority doesn't lose in trading because technical analysis is hard, but because managing our psychology is one of the hardest things a human can do.
Solution #2 Some ways to reduce the "trading stress" could be: getting better quality signals and trading like a "machine". Forgetting about Twitter and trusting the system you designed.
Issue #3 Trading without strict rules and only based on what we feel, or what we think the market should do is the fastest way to kiss our money goodbye.
Only 1 indicator generally is not enough. Traders generally use a combination of several indicators but they're monitoring them individually.
It's normal then to feel exhausted at the end of the day ^^ (to say the least)... and exhaustion leads to mistakes which leads to..... (I'm sure you got it) ... capital loss.
Solution #3 As a trader, I needed a trading framework and a method. I offer our trading method but they're plenty others out there. We cannot claim obviously it's the best ever ....but let's say we're using those exact same
scripts ourselves for our trading. And this what we've been recommending our clients to trade with for the past years. Also, having a tool detecting the convergence of several indicators and giving 1 unique signal
for BUY/SELL position will save you a lot of time/energy, and perhaps might help you out getting better trading performance.
IV. Resolving a complex puzzle and having fun in the process
Trading has to stay a passion and not (only be) a source of intense stress.
The most successful traders I know are "trading geeks" - literally always looking for optimizing, searching for the best possible entries, setups, indicators, tools, etc.
For them, it's not even about the money anymore, but only about beating their previous performance.
Why are they doing this? Because it's fun
Might appears as a bold statement, but I guarantee that looking for setups is fun.
One of our users even told us, that it's like playing with "Legos" and we couldn't possibly agree more.
V. Designing a system that "makes sense"
Another bold statement now. Brace yourselves ladies and gentlemen
The Algorithm Builders allow to design trading systems quickly. What could takes days/weeks/months to find out... might be now within your reach in less than a few hours.
With a bit of practice, less than an hour might be enough per asset/timeframe to find a system that makes sense to you and adapted to your trading capital and psychology.
Assuming our users read our guides and are fully committed to learning a new way of trading - then we do guarantee you'll be able to design kick-ass trading systems that make sense.
"Making sense" doesn't mean at all it's guaranteed to win, it means you're the one defining the convergence of indicators, using your Algorithm Builder, and observe that most of the time - whenever there is a BUY signal, the candlesticks are going upwards - whenever there is a SELL signal, it's going downwards.
This is a necessary step to make real progress from a trading analyst perspective - and hopefully could lead to profits.
VI. Algorithm Builder versus the main trader enemy(=psychology)
This indicator has the goal to help solving one of the MAIN issues encountered by traders.
Most of traders realize, they can't perform with only 1 indicator (or 1 price pattern or 1 price action) and need a combination of multiple indicators before getting in a trade.
Far from being a magic pill, if it could at least reduce the stress you have while trading, then we'll consider we made a great job - it's a technical "useless noise remover", and needs to be followed strictly.
Such trust in a trading system can only be built by testing your Algorithm Builder configuration on either:
1. a demo account
2. or a live account with small bids. And then, increasing progressively the bids if your capital increases progressively.
Though, you should still use your common sense. (for instance: if we get a BUY signal right on a big timeframe resistance we're hitting for the first time).
I'm aware this is a new way of trading but for many, and while we cannot foresee the future, neither predict performance, we believe it might save you a lot of time to find good signals.
My maximum level of happiness will be reached the day when our users will contact me and showing me setups being mine.
I'm sure that even I can learn from my users and, we can all learn from each other Algorithm Builder configuration
VII. What is a wrong or bad configuration?
Simply put. If you see that most of your signals react such as described below:
1. a buy triangle predicts, most of the time an upwards move
2. a sell triangle predicts, most of the time a downwards move
3. you estimated yourself the stop-loss needed to give enough room for your trades.
4. take profits based on algorithmic support and resistances or your own take profit method.
So what's a good Algorithm Builder configuration? A configuration you're happy with and makes sense.
A better Algorithm Builder setup is one used in demo or a live account w/ small bids for a few weeks, and you're consistent in your trading performance.
If you have any doubt or question, please hit me up directly or ask in the comments section of this script.
I'll never claim I have the best trading methodology or the best indicators. You only will be the judge, and I'll appreciate all the questions and feedback you're sending my way.
They help me a ton to develop indicators based on all the requests I received.
Kind regards,
Dave
Algorithm Predator - ML-liteAlgorithm Predator - ML-lite
This indicator combines four specialized trading agents with an adaptive multi-armed bandit selection system to identify high-probability trade setups. It is designed for swing and intraday traders who want systematic signal generation based on institutional order flow patterns , momentum exhaustion , liquidity dynamics , and statistical mean reversion .
Core Architecture
Why These Components Are Combined:
The script addresses a fundamental challenge in algorithmic trading: no single detection method works consistently across all market conditions. By deploying four independent agents and using reinforcement learning algorithms to select or blend their outputs, the system adapts to changing market regimes without manual intervention.
The Four Trading Agents
1. Spoofing Detector Agent 🎭
Detects iceberg orders through persistent volume at similar price levels over 5 bars
Identifies spoofing patterns via asymmetric wick analysis (wicks exceeding 60% of bar range with volume >1.8× average)
Monitors order clustering using simplified Hawkes process intensity tracking (exponential decay model)
Signal Logic: Contrarian—fades false breakouts caused by institutional manipulation
Best Markets: Consolidations, institutional trading windows, low-liquidity hours
2. Exhaustion Detector Agent ⚡
Calculates RSI divergence between price movement and momentum indicator over 5-bar window
Detects VWAP exhaustion (price at 2σ bands with declining volume)
Uses VPIN reversals (volume-based toxic flow dissipation) to identify momentum failure
Signal Logic: Counter-trend—enters when momentum extreme shows weakness
Best Markets: Trending markets reaching climax points, over-extended moves
3. Liquidity Void Detector Agent 💧
Measures Bollinger Band squeeze (width <60% of 50-period average)
Identifies stop hunts via 20-bar high/low penetration with immediate reversal and volume spike
Detects hidden liquidity absorption (volume >2× average with range <0.3× ATR)
Signal Logic: Breakout anticipation—enters after liquidity grab but before main move
Best Markets: Range-bound pre-breakout, volatility compression zones
4. Mean Reversion Agent 📊
Calculates price z-scores relative to 50-period SMA and standard deviation (triggers at ±2σ)
Implements Ornstein-Uhlenbeck process scoring (mean-reverting stochastic model)
Uses entropy analysis to detect algorithmic trading patterns (low entropy <0.25 = high predictability)
Signal Logic: Statistical reversion—enters when price deviates significantly from statistical equilibrium
Best Markets: Range-bound, low-volatility, algorithmically-dominated instruments
Adaptive Selection: Multi-Armed Bandit System
The script implements four reinforcement learning algorithms to dynamically select or blend agents based on performance:
Thompson Sampling (Default - Recommended):
Uses Bayesian inference with beta distributions (tracks alpha/beta parameters per agent)
Balances exploration (trying underused agents) vs. exploitation (using proven winners)
Each agent's win/loss history informs its selection probability
Lite Approximation: Uses pseudo-random sampling from price/volume noise instead of true random number generation
UCB1 (Upper Confidence Bound):
Calculates confidence intervals using: average_reward + sqrt(2 × ln(total_pulls) / agent_pulls)
Deterministic algorithm favoring agents with high uncertainty (potential upside)
More conservative than Thompson Sampling
Epsilon-Greedy:
Exploits best-performing agent (1-ε)% of the time
Explores randomly ε% of the time (default 10%, configurable 1-50%)
Simple, transparent, easily tuned via epsilon parameter
Gradient Bandit:
Uses softmax probability distribution over agent preference weights
Updates weights via gradient ascent based on rewards
Best for Blend mode where all agents contribute
Selection Modes:
Switch Mode: Uses only the selected agent's signal (clean, decisive)
Blend Mode: Combines all agents using exponentially weighted confidence scores controlled by temperature parameter (smooth, diversified)
Lock Agent Feature:
Optional manual override to force one specific agent
Useful after identifying which agent dominates your specific instrument
Only applies in Switch mode
Four choices: Spoofing Detector, Exhaustion Detector, Liquidity Void, Mean Reversion
Memory System
Dual-Layer Architecture:
Short-Term Memory: Stores last 20 trade outcomes per agent (configurable 10-50)
Long-Term Memory: Stores episode averages when short-term reaches transfer threshold (configurable 5-20 bars)
Memory Boost Mechanism: Recent performance modulates agent scores by up to ±20%
Episode Transfer: When an agent accumulates sufficient results, averages are condensed into long-term storage
Persistence: Manual restoration of learned parameters via input fields (alpha, beta, weights, microstructure thresholds)
How Memory Works:
Agent generates signal → outcome tracked after 8 bars (performance horizon)
Result stored in short-term memory (win = 1.0, loss = 0.0)
Short-term average influences agent's future scores (positive feedback loop)
After threshold met (default 10 results), episode averaged into long-term storage
Long-term patterns (weighted 30%) + short-term patterns (weighted 70%) = total memory boost
Market Microstructure Analysis
These advanced metrics quantify institutional order flow dynamics:
Order Flow Toxicity (Simplified VPIN):
Measures buy/sell volume imbalance over 20 bars: |buy_vol - sell_vol| / (buy_vol + sell_vol)
Detects informed trading activity (institutional players with non-public information)
Values >0.4 indicate "toxic flow" (informed traders active)
Lite Approximation: Uses simple open/close heuristic instead of tick-by-tick trade classification
Price Impact Analysis (Simplified Kyle's Lambda):
Measures market impact efficiency: |price_change_10| / sqrt(volume_sum_10)
Low values = large orders with minimal price impact ( stealth accumulation )
High values = retail-dominated moves with high slippage
Lite Approximation: Uses simplified denominator instead of regression-based signed order flow
Market Randomness (Entropy Analysis):
Counts unique price changes over 20 bars / 20
Measures market predictability
High entropy (>0.6) = human-driven, chaotic price action
Low entropy (<0.25) = algorithmic trading dominance (predictable patterns)
Lite Approximation: Simple ratio instead of true Shannon entropy H(X) = -Σ p(x)·log₂(p(x))
Order Clustering (Simplified Hawkes Process):
Tracks self-exciting event intensity (coordinated order activity)
Decays at 0.9× per bar, spikes +1.0 when volume >1.5× average
High intensity (>0.7) indicates clustering (potential spoofing/accumulation)
Lite Approximation: Simple exponential decay instead of full λ(t) = μ + Σ α·exp(-β(t-tᵢ)) with MLE
Signal Generation Process
Multi-Stage Validation:
Stage 1: Agent Scoring
Each agent calculates internal score based on its detection criteria
Scores must exceed agent-specific threshold (adjusted by sensitivity multiplier)
Agent outputs: Signal direction (+1/-1/0) and Confidence level (0.0-1.0)
Stage 2: Memory Boost
Agent scores multiplied by memory boost factor (0.8-1.2 based on recent performance)
Successful agents get amplified, failing agents get dampened
Stage 3: Bandit Selection/Blending
If Adaptive Mode ON:
Switch: Bandit selects single best agent, uses only its signal
Blend: All agents combined using softmax-weighted confidence scores
If Adaptive Mode OFF:
Traditional consensus voting with confidence-squared weighting
Signal fires when consensus exceeds threshold (default 70%)
Stage 4: Confirmation Filter
Raw signal must repeat for consecutive bars (default 3, configurable 2-4)
Minimum confidence threshold: 0.25 (25%) enforced regardless of mode
Trend alignment check: Long signals require trend_score ≥ -2, Short signals require trend_score ≤ 2
Stage 5: Cooldown Enforcement
Minimum bars between signals (default 10, configurable 5-15)
Prevents over-trading during choppy conditions
Stage 6: Performance Tracking
After 8 bars (performance horizon), signal outcome evaluated
Win = price moved in signal direction, Loss = price moved against
Results fed back into memory and bandit statistics
Trading Modes (Presets)
Pre-configured parameter sets:
Conservative: 85% consensus, 4 confirmations, 15-bar cooldown
Expected: 60-70% win rate, 3-8 signals/week
Best for: Swing trading, capital preservation, beginners
Balanced: 70% consensus, 3 confirmations, 10-bar cooldown
Expected: 55-65% win rate, 8-15 signals/week
Best for: Day trading, most traders, general use
Aggressive: 60% consensus, 2 confirmations, 5-bar cooldown
Expected: 50-58% win rate, 15-30 signals/week
Best for: Scalping, high-frequency trading, active management
Elite: 75% consensus, 3 confirmations, 12-bar cooldown
Expected: 58-68% win rate, 5-12 signals/week
Best for: Selective trading, high-conviction setups
Adaptive: 65% consensus, 2 confirmations, 8-bar cooldown
Expected: Varies based on learning
Best for: Experienced users leveraging bandit system
How to Use
1. Initial Setup (5 Minutes):
Select Trading Mode matching your style (start with Balanced)
Enable Adaptive Learning (recommended for automatic agent selection)
Choose Thompson Sampling algorithm (best all-around performance)
Keep Microstructure Metrics enabled for liquid instruments (>100k daily volume)
2. Agent Tuning (Optional):
Adjust Agent Sensitivity multipliers (0.5-2.0):
<0.8 = Highly selective (fewer signals, higher quality)
0.9-1.2 = Balanced (recommended starting point)
1.3 = Aggressive (more signals, lower individual quality)
Monitor dashboard for 20-30 signals to identify dominant agent
If one agent consistently outperforms, consider using Lock Agent feature
3. Bandit Configuration (Advanced):
Blend Temperature (0.1-2.0):
0.3 = Sharp decisions (best agent dominates)
0.5 = Balanced (default)
1.0+ = Smooth (equal weighting, democratic)
Memory Decay (0.8-0.99):
0.90 = Fast adaptation (volatile markets)
0.95 = Balanced (most instruments)
0.97+ = Long memory (stable trends)
4. Signal Interpretation:
Green triangle (▲): Long signal confirmed
Red triangle (▼): Short signal confirmed
Dashboard shows:
Active agent (highlighted row with ► marker)
Win rate per agent (green >60%, yellow 40-60%, red <40%)
Confidence bars (█████ = maximum confidence)
Memory size (short-term buffer count)
Colored zones display:
Entry level (current close)
Stop-loss (1.5× ATR)
Take-profit 1 (2.0× ATR)
Take-profit 2 (3.5× ATR)
5. Risk Management:
Never risk >1-2% per signal (use ATR-based stops)
Signals are entry triggers, not complete strategies
Combine with your own market context analysis
Consider fundamental catalysts and news events
Use "Confirming" status to prepare entries (not to enter early)
6. Memory Persistence (Optional):
After 50-100 trades, check Memory Export Panel
Record displayed alpha/beta/weight values for each agent
Record VPIN and Kyle threshold values
Enable "Restore From Memory" and input saved values to continue learning
Useful when switching timeframes or restarting indicator
Visual Components
On-Chart Elements:
Spectral Layers: EMA8 ± 0.5 ATR bands (dynamic support/resistance, colored by trend)
Energy Radiance: Multi-layer glow boxes at signal points (intensity scales with confidence, configurable 1-5 layers)
Probability Cones: Projected price paths with uncertainty wedges (15-bar projection, width = confidence × ATR)
Connection Lines: Links sequential signals (solid = same direction continuation, dotted = reversal)
Kill Zones: Risk/reward boxes showing entry, stop-loss, and dual take-profit targets
Signal Markers: Triangle up/down at validated entry points
Dashboard (Configurable Position & Size):
Regime Indicator: 4-level trend classification (Strong Bull/Bear, Weak Bull/Bear)
Mode Status: Shows active system (Adaptive Blend, Locked Agent, or Consensus)
Agent Performance Table: Real-time win%, confidence, and memory stats
Order Flow Metrics: Toxicity and impact indicators (when microstructure enabled)
Signal Status: Current state (Long/Short/Confirming/Waiting) with confirmation progress
Memory Panel (Configurable Position & Size):
Live Parameter Export: Alpha, beta, and weight values per agent
Adaptive Thresholds: Current VPIN sensitivity and Kyle threshold
Save Reminder: Visual indicator if parameters should be recorded
What Makes This Original
This script's originality lies in three key innovations:
1. Genuine Meta-Learning Framework:
Unlike traditional indicator mashups that simply display multiple signals, this implements authentic reinforcement learning (multi-armed bandits) to learn which detection method works best in current conditions. The Thompson Sampling implementation with beta distribution tracking (alpha for successes, beta for failures) is statistically rigorous and adapts continuously. This is not post-hoc optimization—it's real-time learning.
2. Episodic Memory Architecture with Transfer Learning:
The dual-layer memory system mimics human learning patterns:
Short-term memory captures recent performance (recency bias)
Long-term memory preserves historical patterns (experience)
Automatic transfer mechanism consolidates knowledge
Memory boost creates positive feedback loops (successful strategies become stronger)
This architecture allows the system to adapt without retraining , unlike static ML models that require batch updates.
3. Institutional Microstructure Integration:
Combines retail-focused technical analysis (RSI, Bollinger Bands, VWAP) with institutional-grade microstructure metrics (VPIN, Kyle's Lambda, Hawkes processes) typically found in academic finance literature and professional trading systems, not standard retail platforms. While simplified for Pine Script constraints, these metrics provide insight into informed vs. uninformed trading , a dimension entirely absent from traditional technical analysis.
Mashup Justification:
The four agents are combined specifically for risk diversification across failure modes:
Spoofing Detector: Prevents false breakout losses from manipulation
Exhaustion Detector: Prevents chasing extended trends into reversals
Liquidity Void: Exploits volatility compression (different regime than trending)
Mean Reversion: Provides mathematical anchoring when patterns fail
The bandit system ensures the optimal tool is automatically selected for each market situation, rather than requiring manual interpretation of conflicting signals.
Why "ML-lite"? Simplifications and Approximations
This is the "lite" version due to necessary simplifications for Pine Script execution:
1. Simplified VPIN Calculation:
Academic Implementation: True VPIN uses volume bucketing (fixed-volume bars) and tick-by-tick buy/sell classification via Lee-Ready algorithm or exchange-provided trade direction flags
This Implementation: 20-bar rolling window with simple open/close heuristic (close > open = buy volume)
Impact: May misclassify volume during ranging/choppy markets; works best in directional moves
2. Pseudo-Random Sampling:
Academic Implementation: Thompson Sampling requires true random number generation from beta distributions using inverse transform sampling or acceptance-rejection methods
This Implementation: Deterministic pseudo-randomness derived from price and volume decimal digits: (close × 100 - floor(close × 100)) + (volume % 100) / 100
Impact: Not cryptographically random; may have subtle biases in specific price ranges; provides sufficient variation for agent selection
3. Hawkes Process Approximation:
Academic Implementation: Full Hawkes process uses maximum likelihood estimation with exponential kernels: λ(t) = μ + Σ α·exp(-β(t-tᵢ)) fitted via iterative optimization
This Implementation: Simple exponential decay (0.9 multiplier) with binary event triggers (volume spike = event)
Impact: Captures self-exciting property but lacks parameter optimization; fixed decay rate may not suit all instruments
4. Kyle's Lambda Simplification:
Academic Implementation: Estimated via regression of price impact on signed order flow over multiple time intervals: Δp = λ × Δv + ε
This Implementation: Simplified ratio: price_change / sqrt(volume_sum) without proper signed order flow or regression
Impact: Provides directional indicator of impact but not true market depth measurement; no statistical confidence intervals
5. Entropy Calculation:
Academic Implementation: True Shannon entropy requires probability distribution: H(X) = -Σ p(x)·log₂(p(x)) where p(x) is probability of each price change magnitude
This Implementation: Simple ratio of unique price changes to total observations (variety measure)
Impact: Measures diversity but not true information entropy with probability weighting; less sensitive to distribution shape
6. Memory System Constraints:
Full ML Implementation: Neural networks with backpropagation, experience replay buffers (storing state-action-reward tuples), gradient descent optimization, and eligibility traces
This Implementation: Fixed-size array queues with simple averaging; no gradient-based learning, no state representation beyond raw scores
Impact: Cannot learn complex non-linear patterns; limited to linear performance tracking
7. Limited Feature Engineering:
Advanced Implementation: Dozens of engineered features, polynomial interactions (x², x³), dimensionality reduction (PCA, autoencoders), feature selection algorithms
This Implementation: Raw agent scores and basic market metrics (RSI, ATR, volume ratio); minimal transformation
Impact: May miss subtle cross-feature interactions; relies on agent-level intelligence rather than feature combinations
8. Single-Instrument Data:
Full Implementation: Multi-asset correlation analysis (sector ETFs, currency pairs, volatility indices like VIX), lead-lag relationships, risk-on/risk-off regimes
This Implementation: Only OHLCV data from displayed instrument
Impact: Cannot incorporate broader market context; vulnerable to correlated moves across assets
9. Fixed Performance Horizon:
Full Implementation: Adaptive horizon based on trade duration, volatility regime, or profit target achievement
This Implementation: Fixed 8-bar evaluation window
Impact: May evaluate too early in slow markets or too late in fast markets; one-size-fits-all approach
Performance Impact Summary:
These simplifications make the script:
✅ Faster: Executes in milliseconds vs. seconds (or minutes) for full academic implementations
✅ More Accessible: Runs on any TradingView plan without external data feeds, APIs, or compute servers
✅ More Transparent: All calculations visible in Pine Script (no black-box compiled models)
✅ Lower Resource Usage: <500 bars lookback, minimal memory footprint
⚠️ Less Precise: Approximations may reduce statistical edge by 5-15% vs. academic implementations
⚠️ Limited Scope: Cannot capture tick-level dynamics, multi-order-book interactions, or cross-asset flows
⚠️ Fixed Parameters: Some thresholds hardcoded rather than dynamically optimized
When to Upgrade to Full Implementation:
Consider professional Python/C++ versions with institutional data feeds if:
Trading with >$100K capital where precision differences materially impact returns
Operating in microsecond-competitive environments (HFT, market making)
Requiring regulatory-grade audit trails and reproducibility
Backtesting with tick-level precision for strategy validation
Need true real-time adaptation with neural network-based learning
For retail swing/day trading and position management, these approximations provide sufficient signal quality while maintaining usability, transparency, and accessibility. The core logic—multi-agent detection with adaptive selection—remains intact.
Technical Notes
All calculations use standard Pine Script built-in functions ( ta.ema, ta.atr, ta.rsi, ta.bb, ta.sma, ta.stdev, ta.vwap )
VPIN and Kyle's Lambda use simplified formulas optimized for OHLCV data (see "Lite" section above)
Thompson Sampling uses pseudo-random noise from price/volume decimal digits for beta distribution sampling
No repainting: All calculations use confirmed bar data (no forward-looking)
Maximum lookback: 500 bars (set via max_bars_back parameter)
Performance evaluation: 8-bar forward-looking window for reward calculation (clearly disclosed)
Confidence threshold: Minimum 0.25 (25%) enforced on all signals
Memory arrays: Dynamic sizing with FIFO queue management
Limitations and Disclaimers
Not Predictive: This indicator identifies patterns in historical data. It cannot predict future price movements with certainty.
Requires Human Judgment: Signals are entry triggers, not complete trading strategies. Must be confirmed with your own analysis, risk management rules, and market context.
Learning Period Required: The adaptive system requires 50-100 bars minimum to build statistically meaningful performance data for bandit algorithms.
Overfitting Risk: Restoring memory parameters from one market regime to a drastically different regime (e.g., low volatility to high volatility) may cause poor initial performance until system re-adapts.
Approximation Limitations: Simplified calculations (see "Lite" section) may underperform academic implementations by 5-15% in highly efficient markets.
No Guarantee of Profit: Past performance, whether backtested or live-traded, does not guarantee future performance. All trading involves risk of loss.
Forward-Looking Bias: Performance evaluation uses 8-bar forward window—this creates slight look-ahead for learning (though not for signals). Real-time performance may differ from indicator's internal statistics.
Single-Instrument Limitation: Does not account for correlations with related assets or broader market regime changes.
Recommended Settings
Timeframe: 15-minute to 4-hour charts (sufficient volatility for ATR-based stops; adequate bar volume for learning)
Assets: Liquid instruments with >100k daily volume (forex majors, large-cap stocks, BTC/ETH, major indices)
Not Recommended: Illiquid small-caps, penny stocks, low-volume altcoins (microstructure metrics unreliable)
Complementary Tools: Volume profile, order book depth, market breadth indicators, fundamental catalysts
Position Sizing: Risk no more than 1-2% of capital per signal using ATR-based stop-loss
Signal Filtering: Consider external confluence (support/resistance, trendlines, round numbers, session opens)
Start With: Balanced mode, Thompson Sampling, Blend mode, default agent sensitivities (1.0)
After 30+ Signals: Review agent win rates, consider increasing sensitivity of top performers or locking to dominant agent
Alert Configuration
The script includes built-in alert conditions:
Long Signal: Fires when validated long entry confirmed
Short Signal: Fires when validated short entry confirmed
Alerts fire once per bar (after confirmation requirements met)
Set alert to "Once Per Bar Close" for reliability
Taking you to school. — Dskyz, Trade with insight. Trade with anticipation.

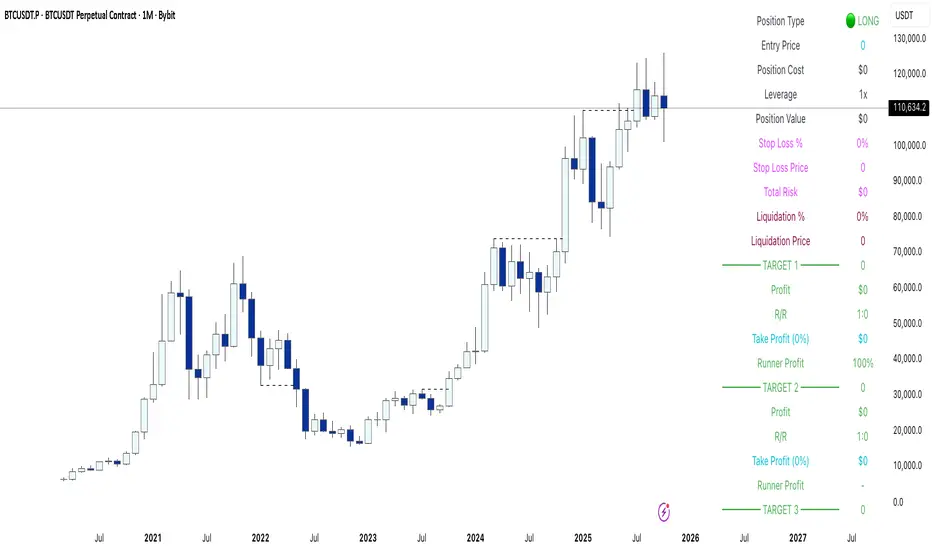
Risk & Position DashboardRisk & Position Dashboard
Overview
The Risk & Position Dashboard is a comprehensive trading tool designed to help traders calculate optimal position sizes, manage risk, and visualize potential profit/loss scenarios before entering trades. This indicator provides real-time calculations for position sizing based on account size, risk percentage, and stop-loss levels, while displaying multiple take-profit targets with customizable risk-reward ratios.
Key Features
Position Sizing & Risk Management:
Automatic position size calculation based on account size and risk percentage
Support for leveraged trading with maximum leverage limits
Fractional shares support for brokers that allow partial share trading
Real-time fee calculation including entry, stop-loss, and take-profit fees
Break-even price calculation including trading fees
Multi-Target Profit Management:
Support for up to 3 take-profit levels with individual portion allocations
Customizable risk-reward ratios for each take-profit target
Visual profit/loss zones displayed as colored boxes on the chart
Individual profit calculations for each take-profit level
Visual Dashboard:
Clean, customizable table display showing all key metrics
Configurable label positioning and styling options
Real-time tracking of whether stop-loss or take-profit levels have been reached
Color-coded visual zones for easy identification of risk and reward areas
Advanced Configuration:
Comprehensive input validation and error handling
Support for different chart timeframes and symbols
Customizable colors, fonts, and display options
Hide/show individual data fields for personalized dashboard views
How to Use
Set Account Parameters: Configure your account size, maximum risk percentage per trade, and trading fees in the "Account Settings" section.
Define Trade Setup: Use the "Entry" time picker to select your entry point on the chart, then input your entry price and stop-loss level.
Configure Take Profits: Set your desired risk-reward ratios and portion allocations for each take-profit level. The script supports 1-3 take-profit targets.
Analyze Results: The dashboard will automatically calculate and display position size, number of shares, potential profits/losses, fees, and break-even levels.
Visual Confirmation: Colored boxes on the chart show profit zones (green) and loss zones (red), with lines extending to current price levels.
Reset Entry and SL:
You can easily reset the entry and stop-loss by clicking the "Reset points..." button from the script's "More" menu.
This is useful if you want to quickly clear your current trade setup and start fresh without manually adjusting the points on the chart.
Calculations
The script performs sophisticated calculations including:
Position size based on risk amount and price difference between entry and stop-loss
Leverage requirements and position amount calculations
Fee-adjusted risk-reward ratios for realistic profit expectations
Break-even price including all trading costs
Individual profit calculations for partial position closures
Detailed Take-Profit Calculation Formula:
The take-profit prices are calculated using the following mathematical formula:
// Core variables:
// risk_amount = account_size * (risk_percentage / 100)
// total_risk_per_share = |entry_price - sl_price| + (entry_price * fee%) + (sl_price * fee%)
// shares = risk_amount / total_risk_per_share
// direction_factor = 1 for long positions, -1 for short positions
// Take-profit calculation:
net_win = total_risk_per_share * shares * RR_ratio
tp_price = (net_win + (direction_factor * entry_price * shares) + (entry_price * fee% * shares)) / (direction_factor * shares - fee% * shares)
Step-by-step example for a long position (based on screenshot):
Account Size: 2,000 USDT, Risk: 2% = 40 USDT
Entry: 102,062.9 USDT, Stop Loss: 102,178.4 USDT, Fee: 0.06%
Risk per share: |102,062.9 - 102,178.4| + (102,062.9 × 0.0006) + (102,178.4 × 0.0006) = 115.5 + 61.24 + 61.31 = 238.05 USDT
Shares: 40 ÷ 238.05 = 0.168 shares (rounded to 0.17 in display)
Position Size: 0.17 × 102,062.9 = 17,350.69 USDT
Position Amount (with 9x leverage): 17,350.69 ÷ 9 = 1,927.85 USDT
For 2:1 RR: Net win = 238.05 × 0.17 × 2 = 80.94 USDT
TP1 price = (80.94 + (1 × 102,062.9 × 0.17) + (102,062.9 × 0.0006 × 0.17)) ÷ (1 × 0.17 - 0.0006 × 0.17) = 101,464.7 USDT
For 3:1 RR: TP2 price = 101,226.7 USDT (following same formula with RR=3)
This ensures that after accounting for all fees, the actual risk-reward ratio matches the specified target ratio.
Risk Management Features
Maximum Trade Amount: Optional setting to limit position size regardless of account size
Leverage Limits: Built-in maximum leverage protection
Fee Integration: All calculations include realistic trading fees for accurate expectations
Validation: Automatic checking that take-profit portions sum to 100%
Historical Tracking: Visual indication when stop-loss or take-profit levels are reached (within last 5000 bars)
Understanding Max Trade Amount - Multiple Simultaneous Trades:
The "Max Trade Amount" feature is designed for traders who want to open multiple positions simultaneously while maintaining proper risk management. Here's how it works:
Key Concept:
- Risk percentage (2%) always applies to your full Account Size
- Max Trade Amount limits the capital allocated per individual trade
- This allows multiple trades with full risk on each trade
Example from Screenshot:
Account Size: 2,000 USDT
Max Trade Amount: 500 USDT
Risk per Trade: 2% × 2,000 = 40 USDT per trade
Stop Loss Distance: 0.11% from entry
Result: Position Size = 17,350.69 USDT with 35x leverage
Total Risk (including fees): 40.46 USDT
Multiple Trades Strategy:
With this setup, you can open:
Trade 1: 40 USDT risk, 495.73 USDT position amount (35x leverage)
Trade 2: 40 USDT risk, 495.73 USDT position amount (35x leverage)
Trade 3: 40 USDT risk, 495.73 USDT position amount (35x leverage)
Trade 4: 40 USDT risk, 495.73 USDT position amount (35x leverage)
Total Portfolio Exposure:
- 4 simultaneous trades = 4 × 495.73 = 1,982.92 USDT position amount
- Total risk exposure = 4 × 40 = 160 USDT (8% of account)

NSE Pairs Screener-20 pair This advanced Pine Script screener is designed for pairs trading on the National Stock Exchange (NSE) of India. It simultaneously monitors up to 20 stock pairs, calculates key statistical metrics, and provides real-time trading signals based on mean reversion strategies.
Key Features
1. Multi-Pair Analysis
Monitor up to 20 stock pairs simultaneously
Customizable number of pairs to display (1-20)
Pre-configured with popular NSE stock pairs across various sectors
2. Statistical Calculations
Correlation Analysis: Measures the strength of relationship between paired stocks
Z-Score Calculation: Identifies extreme deviations from the mean spread
Cointegration Score: Validates long-term equilibrium relationships
Dynamic Hedge Ratio: Calculates optimal position sizing between pairs
3. Trading Signals
Long Signal: When spread is oversold (Z-score ≤ -2.0)
Short Signal: When spread is overbought (Z-score ≥ 2.0)
Exit Signal: When spread returns to mean (Z-score ≤ 0.5)
Watch Status: Pairs requiring monitoring
4. Automated Alert System
Single comprehensive alert for all qualifying pairs
Customizable alert thresholds for correlation, Z-score, and cointegration
On-chart visual alerts with detailed information
Notification support via TradingView's alert system
5. Visual Display
Clean, color-coded table interface
Adjustable table position (9 positions available)
Highlighted trading opportunities
Real-time metric updates
Configuration Parameters
Screener Settings
Number of Pairs to Display: 1-20 pairs (default: 20)
Calculation Parameters
Parameter Default Range Description Correlation Lookback Period25220-500Historical period for correlation calculation Z-Score SMA Length205-100Moving average length for spread calculation Hedge Ratio Length205-100Period for hedge ratio smoothing Minimum Correlation0.70.5-1.0Threshold for pair validation
Alert Settings
Parameter Default Range Description Alert Correlation Threshold0.70.5-1.0Minimum correlation for alerts Alert Z-Score Threshold2.01.0-3.0Z-score trigger level Alert Cointegration Threshold90%80-99%Minimum cointegration percentage
Display Settings
Table Position: 9 position options (default: middle_center)
Table Background Color: Customizable
Highlight Opportunities: Toggle visual highlighting of trading signals
Pre-Configured Stock Pairs
The script includes 20 carefully selected NSE pairs across various sectors:
Financial Services
RELIANCE / ONGC
HDFCBANK / ICICIBANK
SBIN / PNB
KOTAKBANK / AXISBANK
BAJFINANCE / BAJAJFINSV
Information Technology
TCS / INFY
WIPRO / HCLTECH
TECHM / LTIM
Consumer Goods
ITC / HINDUNILVR
TITAN / TANLA
ASIANPAINT / BERGEPAINT
Telecommunications
BHARTIARTL / IDEA
Automotive
MARUTI / TATAMOTORS
Infrastructure & Industrials
LT / UBL
POWERGRID / NTPC
Pharmaceuticals
SUNPHARMA / CIPLA
DIVISLAB / DRREDDY
Materials
ULTRACEMCO / ACC
UPL / JSWSTEEL
Energy
ADANIENT / ADANIPOWER
🎨 Color-Coded Metrics
Correlation
🟢 Green: ≥ Minimum threshold (strong relationship)
🔴 Red: < Minimum threshold (weak relationship)
Z-Score
🔴 Red: |Z| ≥ 2.0 (extreme deviation - trading opportunity)
🟡 Yellow: 0.5 < |Z| < 2.0 (normal range - watch)
🟢 Green: |Z| ≤ 0.5 (mean reversion - exit signal)
Cointegration
🟢 Green: ≥ 70% (strong cointegration)
🟡 Yellow: 50-70% (moderate cointegration)
🔴 Red: < 50% (weak cointegration)
Status
🟢 Green: Long (buy spread)
🔴 Red: Short (sell spread)
🔵 Blue: Exit (close positions)
⚪ Gray: Watch (monitor)
Validation
🟢 Green: Pass (meets all criteria)
🔴 Red: Fail (doesn't meet criteria)
How It Works
1. Data Collection
The script fetches real-time closing prices for all 20 stock pairs from NSE.
2. Statistical Analysis
For each pair, the script calculates:
Log Returns: Natural logarithm of price changes
Correlation: Pearson correlation coefficient between returns
Hedge Ratio: Price ratio smoothed over specified period
Spread: Price difference adjusted by hedge ratio
Z-Score: Standardized spread deviation
3. Signal Generation
Based on Z-score thresholds:
Z ≥ 2.0: Short spread (short overvalued, long undervalued)
Z ≤ -2.0: Long spread (long overvalued, short undervalued)
|Z| ≤ 0.5: Exit positions (spread reverted to mean)
4. Validation
Pairs must meet criteria:
Correlation ≥ minimum threshold
Valid trading signal (entry or exit)
5. Alert Triggering
Alerts fire when pairs simultaneously meet:
Correlation ≥ alert threshold
|Z-score| ≥ alert threshold
Cointegration ≥ alert threshold
Alert System
The script features a single comprehensive alert that monitors all pairs:
Consolidated Notifications: One alert for all qualifying pairs
Detailed Information: Includes pair names, signal type, and key metrics
Visual Indicators: Red label on chart with complete details
Customizable Thresholds: Adjust sensitivity based on trading style
Alert Message Format
PAIR TRADING OPPORTUNITIES
Pair X: STOCK1/STOCK2
Signal: LONG/SHORT Spread
Z-Score: X.XX
Correlation: X.XXX
Cointegration: XX.X%
Trading Strategy Guide
Entry Rules
Long Spread (Z-score ≤ -2.0):
Buy Stock Y
Sell Stock X (in ratio of hedge ratio)
Short Spread (Z-score ≥ 2.0):
Sell Stock Y
Buy Stock X (in ratio of hedge ratio)
Exit Rules
Close positions when Z-score returns to ±0.5
Set stop-loss at Z-score ±3.0 (extreme deviations)
Risk Management
Only trade pairs with correlation ≥ 0.7
Prefer cointegration scores ≥ 90%
Monitor hedge ratio changes
Diversify across multiple pairs
Customization Options
Adding New Pairs
Simply modify the stock symbol inputs in the respective pair groups (Pair 1 through Pair 20).
Adjusting Sensitivity
Conservative: Increase Z-score threshold to 2.5-3.0
Aggressive: Decrease Z-score threshold to 1.5-2.0
Long-term: Increase lookback period to 500
Short-term: Decrease lookback period to 50-100
Visual Preferences
Change table position to suit your layout
Adjust background colors for better contrast
Toggle opportunity highlighting on/off
Technical Notes
Calculation Method
Uses logarithmic returns for correlation (better statistical properties)
Z-score normalized by standard deviation
Cointegration approximated using correlation strength
Hedge ratio smoothed using simple moving average
Performance Considerations
Calculations update on every bar close
Table displays only on the last bar
Alert checks occur at bar close
Maximum 500 labels supported (more than sufficient)
Limitations
Does not account for transaction costs
Assumes linear relationships between pairs
Historical correlation doesn't guarantee future behaviour
Requires sufficient liquidity in both stocks
Best Practices
Back test Thoroughly: Test parameters on historical data before live trading
Monitor Regularly: Check pairs daily for validation changes
Diversify: Trade multiple pairs to reduce risk
Stay Informed: Be aware of corporate actions, news affecting pairs
Adjust Parameters: Optimize for current market conditions
Use Stop-Losses: Protect against extreme divergences
Track Performance: Maintain trading journal for continuous improvement
Indicator Information
Version: Pine Script v5
Overlay: False (separate pane)
Max Labels: 500
Update Frequency: Every bar close
Compatible Timeframes: All (works best on daily or higher)
Getting Started
Add to Chart: Apply indicator to any NSE stock
Configure Pairs: Adjust stock symbols as needed
Set Parameters: Customize calculation and alert settings
Create Alert: Set up Trading View alert for notifications
Monitor: Watch the table for trading opportunities
Execute: Trade based on validated signals
📞Support & Updates
This script is designed for educational and research purposes. Always:
Conduct thorough back testing
Use proper risk management
Consider transaction costs
Consult with financial advisors
Trade responsibly
Disclaimer: This indicator is for educational purposes only. Past performance does not guarantee future results. Always conduct your own research and risk assessment before trading.

Smart Structure Pro - Market Structure & Smart Money Concepts═══════════════════════════════════════════════════════════════════════════════
SMART STRUCTURE PRO
═══════════════════════════════════════════════════════════════════════════════
A comprehensive market structure analysis tool that identifies institutional trading
patterns and smart money concepts for improved trade timing and decision-making.
═══════════════════════════════════════════════════════════════════════════════
📊 WHAT IT DOES
═══════════════════════════════════════════════════════════════════════════════
This indicator automatically detects and visualizes key market structure elements:
🔹 BOS (Break of Structure)
- Identifies trend continuation patterns
- Marks when price breaks above previous highs (bullish) or below previous lows (bearish)
- Confirms trend strength and momentum
🔹 CHoCH (Change of Character)
- Detects potential trend reversals
- Alerts when market structure shifts from bullish to bearish or vice versa
- Helps identify early reversal opportunities
🔹 Order Blocks
- Highlights institutional entry zones
- Identifies the last opposite candle before a structure break
- Shows areas where smart money likely entered positions
🔹 Fair Value Gaps (FVG)
- Detects price imbalances and inefficiencies
- Shows areas where price moved rapidly leaving gaps
- Often act as support/resistance when retested
🔹 Liquidity Zones
- Marks swing high and low levels
- Identifies areas where stop losses likely cluster
- Shows potential stop hunt and liquidity grab zones
═══════════════════════════════════════════════════════════════════════════════
🎯 HOW TO USE
═══════════════════════════════════════════════════════════════════════════════
BULLISH SETUP:
1. Wait for Bullish CHoCH (trend reversal signal) or BOS ↑ (continuation)
2. Look for price to pull back into an Order Block or Fair Value Gap
3. Enter long when price bounces from these zones
4. Place stop loss below the Order Block
5. Target the next liquidity zone or resistance level
BEARISH SETUP:
1. Wait for Bearish CHoCH (trend reversal signal) or BOS ↓ (continuation)
2. Look for price to retrace into an Order Block or Fair Value Gap
3. Enter short when price rejects from these zones
4. Place stop loss above the Order Block
5. Target the next liquidity zone or support level
DASHBOARD INTERPRETATION:
• Trend: Current market direction (Bullish/Bearish)
• Volume: Confirmation strength (High volume = stronger signals)
• Signal: Latest structure break detected
• Key High/Low: Critical levels for the current trend
• Position: Price location (Premium = expensive, Discount = cheap)
═══════════════════════════════════════════════════════════════════════════════
⚙️ SETTINGS GUIDE
═══════════════════════════════════════════════════════════════════════════════
STRUCTURE DETECTION:
• Pivot Length (Default: 10)
- Lower values = More signals but potentially weaker
- Higher values = Fewer signals but stronger/more reliable
- Recommended: 8-12 for intraday, 10-15 for higher timeframes
• Structure Line Extension
- Visual preference for how far lines extend
- Does not affect signal detection
SMART MONEY CONCEPTS:
• Order Block Extension: How long OB boxes remain visible
• FVG Extension: How long gap boxes remain visible
• Min FVG Size: Filter out small gaps (0 = show all)
- Set to 10-20% to reduce noise
- Set to 0 to see all gaps
VOLUME FILTER:
• Volume Confirmation (Recommended: ON)
- Filters weak signals without volume support
- Reduces false breakouts
• Volume Multiplier (Default: 1.5)
- Higher = Stricter filtering (fewer but stronger signals)
- Lower = More signals (but may include weak ones)
DISPLAY:
• Dashboard: Toggle information panel
• Trend Background: Subtle color tint showing current trend
• Dashboard Position: Choose corner placement
═══════════════════════════════════════════════════════════════════════════════
🔔 ALERTS
═══════════════════════════════════════════════════════════════════════════════
Available alert conditions:
✓ Bullish BOS - Uptrend continuation confirmed
✓ Bearish BOS - Downtrend continuation confirmed
✓ Bullish CHoCH - Reversal to uptrend detected
✓ Bearish CHoCH - Reversal to downtrend detected
✓ Structure Break - Any significant market structure change
To set up alerts:
1. Click the "⏰" alert icon
2. Select "Smart Structure Pro"
3. Choose your desired condition
4. Configure notification method
5. Click "Create"
═══════════════════════════════════════════════════════════════════════════════
⚠️ IMPORTANT DISCLOSURES
═══════════════════════════════════════════════════════════════════════════════
REPAINTING BEHAVIOR:
• Pivot points WILL repaint until confirmed (this is by design and unavoidable)
• Structure breaks (BOS/CHoCH) use CLOSED candles and do NOT repaint after confirmation
• Order Blocks and FVGs are drawn on confirmed signals and do NOT repaint
• All signals wait for candle close before triggering
BEST PRACTICES:
• Use on higher timeframes (15min+) for more reliable signals
• Combine with other analysis (support/resistance, volume profile, etc.)
• Wait for candle close confirmation before acting on signals
• Use proper risk management - this is not a standalone trading system
• Backtest on your preferred instrument and timeframe
PERFORMANCE:
• Limited to 100 boxes, 100 lines, 100 labels for optimal performance
• Older objects automatically removed as new ones appear
• Works on all markets (Forex, Crypto, Stocks, Indices, Commodities)
═══════════════════════════════════════════════════════════════════════════════
📚 CONCEPTS EXPLAINED
═══════════════════════════════════════════════════════════════════════════════
MARKET STRUCTURE:
Market structure refers to the pattern of price movements creating swing highs
and lows. Understanding structure helps identify trend direction and potential
reversal points.
SMART MONEY CONCEPTS:
These are trading techniques based on tracking institutional order flow and
understanding where large players (banks, funds, institutions) enter and exit
positions.
ORDER BLOCKS:
The last opposing candle before a strong directional move. Institutions often
leave unfilled orders in these zones, which can act as support/resistance when
price returns.
FAIR VALUE GAPS:
Areas where price moved so quickly that it left an imbalance. These gaps often
get "filled" as price returns to find equilibrium, creating trading opportunities.
═══════════════════════════════════════════════════════════════════════════════
🎓 EDUCATIONAL VALUE
═══════════════════════════════════════════════════════════════════════════════
This indicator helps traders:
✓ Understand market structure mechanics
✓ Identify institutional trading patterns
✓ Improve trade timing and entry precision
✓ Recognize trend continuation vs reversal
✓ Learn smart money concepts through visualization
═══════════════════════════════════════════════════════════════════════════════
📋 TECHNICAL DETAILS
═══════════════════════════════════════════════════════════════════════════════
• Version: 1.0.0
• Pine Script Version: 5
• Indicator Type: Overlay
• No Repainting: Structure breaks use confirmed candles
• Performance Optimized: Limited drawing objects
• Works On: All markets and timeframes
• Alerts: Yes, fully customizable
═══════════════════════════════════════════════════════════════════════════════
👤 AUTHOR
═══════════════════════════════════════════════════════════════════════════════
Created by: Zakaria Safri
Original Work: All code and concepts are original implementations
Based On: ICT (Inner Circle Trader) educational concepts
License: © 2024 Zakaria Safri - Personal Use Only
═══════════════════════════════════════════════════════════════════════════════
⚖️ DISCLAIMER
═══════════════════════════════════════════════════════════════════════════════
This indicator is for educational and informational purposes only. It does not
constitute financial advice. Trading involves substantial risk of loss. Past
performance does not guarantee future results. Always conduct your own research
and consult with a licensed financial advisor before making trading decisions.
The author is not responsible for any losses incurred from using this indicator.
═══════════════════════════════════════════════════════════════════════════════
If you find this indicator helpful, please:
👍 Like and favorite
⭐ Leave a review
📢 Share with other traders
💬 Comment with feedback or suggestions
Happy Trading! 📈

Yuki Leverage RR Calculator**YUKI LEVERAGE RR CALCULATOR**
A professional-grade risk/reward calculator for leveraged crypto or forex trades.
Instantly visualizes entry, stop loss, targets, leverage, and risk-to-reward ratios — helping you plan precise positions with confidence.
──────────────────────────────
**WHAT IT DOES**
Calculates position value, quantity, stop-loss price, liquidation estimate, and per-target profit.
Displays everything in an on-chart table with optional price tags and alerts.
──────────────────────────────
**KEY FEATURES**
• Long / Short toggle (only one active at a time)
• Leverage-aware position sizing based on Position Cost ($) and Leverage
• Dynamic Stop Loss: input % → auto price + $ risk
• Up to 3 Take-Profit Targets with scaling logic
• Instant R:R ratios per target
• Liquidation estimate (approximation only)
• ENTRY / SL / T1 / T2 / T3 / LIQ visual tags
• Dark/Light mode, adjustable table and tag size
• Built-in alerts for Targets and Stop Loss
──────────────────────────────
**INPUTS**
• Long or Short selection
• Entry Price, Stop Loss %
• Target 1 / Target 2 / Target 3 + Take Profit %
• Position Cost ($), Leverage
• Visual preferences: show/hide table, table corner, font size, tag offset, text size
──────────────────────────────
**TABLE OUTPUTS**
Position Info: Type, Entry, Position Cost, Leverage, Value
Risk Section: Stop Loss %, Stop Loss Price, Total Risk ($), Liquidation % & Price
Targets 1–3: Profit ($), R:R, Take Profit ($), Runner % or PnL
──────────────────────────────
**ALERTS**
• Target 1 Hit – when price crosses T1
• Target 2 Hit – when price crosses T2
• Target 3 Hit – when price crosses T3
• Stop Loss Hit – triggers based on direction
(Use TradingView Alerts → Condition → Indicator → select desired alert)
──────────────────────────────
**HOW TO USE**
1. Choose Long or Short
2. Enter Entry Price, Stop Loss %, Position Cost, and Leverage
3. Add Targets 1–3 with optional Take Profit %
4. Adjust visuals as desired
5. Monitor table + alerts for live trade planning
──────────────────────────────
**NOTES**
• Liquidation values are estimates only
• Fees, slippage, and funding not included
• Designed for educational and planning purposes
──────────────────────────────
⚠️ **DISCLAIMER**
For educational use only — not financial advice.
Trading leveraged products involves high risk of loss.
Always confirm calculations with your exchange and trade responsibly.
RSI Bollinger Bands [DCAUT]█ RSI Bollinger Bands
📊 ORIGINALITY & INNOVATION
The RSI Bollinger Bands indicator represents a meaningful advancement in momentum analysis by combining two proven technical tools: the Relative Strength Index (RSI) and Bollinger Bands. This combination addresses a significant limitation in traditional RSI analysis - the use of fixed overbought/oversold thresholds (typically 70/30) that fail to adapt to changing market volatility conditions.
Core Innovation:
Rather than relying on static threshold levels, this indicator applies Bollinger Bands statistical analysis directly to RSI values, creating dynamic zones that automatically adjust based on recent momentum volatility. This approach helps reduce false signals during low volatility periods while remaining sensitive to genuine extremes during high volatility conditions.
Key Enhancements Over Traditional RSI:
Dynamic Thresholds: Overbought/oversold zones adapt to market conditions automatically, eliminating the need for manual threshold adjustments across different instruments and timeframes
Volatility Context: Band width provides immediate visual feedback about momentum volatility, helping traders distinguish between stable trends and erratic movements
Reduced False Signals: During ranging markets, narrower bands filter out minor RSI fluctuations that would trigger traditional fixed-threshold signals
Breakout Preparation: Band squeeze patterns (similar to price-based BB) signal potential momentum regime changes before they occur
Self-Referencing Analysis: By measuring RSI against its own statistical behavior rather than arbitrary levels, the indicator provides more relevant context
📐 MATHEMATICAL FOUNDATION
Two-Stage Calculation Process:
Stage 1: RSI Calculation
RSI = 100 - (100 / (1 + RS))
where RS = Average Gain / Average Loss over specified period
The RSI normalizes price momentum into a bounded 0-100 scale, making it ideal for statistical band analysis.
Stage 2: Bollinger Bands on RSI
Basis = MA(RSI, BB Length)
Upper Band = Basis + (StdDev(RSI, BB Length) × Multiplier)
Lower Band = Basis - (StdDev(RSI, BB Length) × Multiplier)
Band Width = Upper Band - Lower Band
The Bollinger Bands measure RSI's standard deviation from its own moving average, creating statistically-derived dynamic zones.
Statistical Interpretation:
Under normal distribution assumptions with default 2.0 multiplier, approximately 95% of RSI values should fall within the bands
Band touches represent statistically significant momentum extremes relative to recent behavior
Band width expansion indicates increasing momentum volatility (strengthening trend or increasing uncertainty)
Band width contraction signals momentum consolidation and potential regime change preparation
📊 COMPREHENSIVE SIGNAL ANALYSIS
Visual Color Signals:
This indicator features dynamic color fills that highlight extreme momentum conditions:
Green Fill (Above Upper Band):
Appears when RSI breaks above the upper band, indicating exceptionally strong bullish momentum
Represents dynamic overbought zone - not necessarily a reversal signal but a warning of extreme conditions
In strong uptrends, green fills can persist as RSI "rides the band" - this indicates sustained momentum strength
Exit of green zone (RSI falling back below upper band) often signals initial momentum weakening
Red Fill (Below Lower Band):
Appears when RSI breaks below the lower band, indicating exceptionally weak bearish momentum
Represents dynamic oversold zone - potential reversal or continuation signal depending on trend context
In strong downtrends, red fills can persist as RSI "rides the band" - this indicates sustained selling pressure
Exit of red zone (RSI rising back above lower band) often signals initial momentum recovery
Position-Based Signals:
Upper Band Interactions:
RSI Touching Upper Band: Dynamic overbought condition - momentum is extremely strong relative to recent volatility, potential exhaustion or continuation depending on trend context
RSI Riding Upper Band: Sustained strong momentum, often seen in powerful trends, not necessarily an immediate reversal signal but warrants monitoring for exhaustion
RSI Crossing Below Upper Band: Initial momentum weakening signal, particularly significant if accompanied by price divergence
Lower Band Interactions:
RSI Touching Lower Band: Dynamic oversold condition - momentum is extremely weak relative to recent volatility, potential reversal or continuation of downtrend
RSI Riding Lower Band: Sustained weak momentum, common in strong downtrends, monitor for potential exhaustion
RSI Crossing Above Lower Band: Initial momentum strengthening signal, early indication of potential reversal or consolidation
Basis Line Signals:
RSI Above Basis: Bullish momentum regime - upward pressure dominant
RSI Below Basis: Bearish momentum regime - downward pressure dominant
Basis Crossovers: Momentum regime shifts, more significant when accompanied by band width changes
RSI Oscillating Around Basis: Balanced momentum, often indicates ranging market conditions
Volatility-Based Signals:
Band Width Patterns:
Narrow Bands (Squeeze): Momentum volatility compression, often precedes significant directional moves, similar to price coiling patterns
Expanding Bands: Increasing momentum volatility, indicates trend acceleration or growing uncertainty
Narrowest Band in 100 Bars: Extreme compression alert, high probability of upcoming volatility expansion
Advanced Pattern Recognition:
Divergence Analysis:
Bullish Divergence: Price makes lower lows while RSI touches or stays above previous lower band touch, suggests downward momentum weakening
Bearish Divergence: Price makes higher highs while RSI touches or stays below previous upper band touch, suggests upward momentum weakening
Hidden Bullish: Price makes higher lows while RSI makes lower lows at the lower band, indicates strong underlying bullish momentum
Hidden Bearish: Price makes lower highs while RSI makes higher highs at the upper band, indicates strong underlying bearish momentum
Band Walk Patterns:
Upper Band Walk: RSI consistently touching or staying near upper band indicates exceptionally strong trend, wait for clear break below basis before considering reversal
Lower Band Walk: RSI consistently at lower band signals very weak momentum, requires break above basis for reversal confirmation
🎯 STRATEGIC APPLICATIONS
Strategy 1: Mean Reversion Trading
Setup Conditions:
Market Type: Ranging or choppy markets with no clear directional trend
Timeframe: Works best on lower timeframes (5m-1H) or during consolidation phases
Band Characteristic: Normal to narrow band width
Entry Rules:
Long Entry: RSI touches or crosses below lower band, wait for RSI to start rising back toward basis before entry
Short Entry: RSI touches or crosses above upper band, wait for RSI to start falling back toward basis before entry
Confirmation: Use price action confirmation (candlestick reversal patterns) at band touches
Exit Rules:
Target: RSI returns to basis line or opposite band
Stop Loss: Fixed percentage or below recent swing low/high
Time Stop: Exit if position not profitable within expected timeframe
Strategy 2: Trend Continuation Trading
Setup Conditions:
Market Type: Clear trending market with higher highs/lower lows
Timeframe: Medium to higher timeframes (1H-Daily)
Band Characteristic: Expanding or wide bands indicating strong momentum
Entry Rules:
Long Entry in Uptrend: Wait for RSI to pull back to basis line or slightly below, enter when RSI starts rising again
Short Entry in Downtrend: Wait for RSI to rally to basis line or slightly above, enter when RSI starts falling again
Avoid Counter-Trend: Do not fade RSI at bands during strong trends (band walk patterns)
Exit Rules:
Trailing Stop: Move stop to break-even when RSI reaches opposite band
Trend Break: Exit when RSI crosses basis against trend direction with conviction
Band Squeeze: Reduce position size when bands start narrowing significantly
Strategy 3: Breakout Preparation
Setup Conditions:
Market Type: Consolidating market after significant move or at key technical levels
Timeframe: Any timeframe, but longer timeframes provide more reliable breakouts
Band Characteristic: Narrowest band width in recent 100 bars (squeeze alert)
Preparation Phase:
Identify band squeeze condition (bands at multi-period narrowest point)
Monitor price action for consolidation patterns (triangles, rectangles, flags)
Prepare bracket orders for both directions
Wait for band expansion to begin
Entry Execution:
Breakout Confirmation: Enter in direction of RSI band breakout (RSI breaks above upper band or below lower band)
Price Confirmation: Ensure price also breaks corresponding technical level
Volume Confirmation: Look for volume expansion supporting the breakout
Risk Management:
Stop Loss: Place beyond consolidation pattern opposite extreme
Position Sizing: Use smaller size due to false breakout risk
Quick Exit: Exit immediately if RSI returns inside bands within 1-3 bars
Strategy 4: Multi-Timeframe Analysis
Timeframe Selection:
Higher Timeframe: Daily or 4H for trend context
Trading Timeframe: 1H or 15m for entry signals
Confirmation Timeframe: 5m or 1m for precise entry timing
Analysis Process:
Trend Identification: Check higher timeframe RSI position relative to bands, trade only in direction of higher timeframe momentum
Setup Formation: Wait for trading timeframe RSI to show pullback to basis in trending direction
Entry Timing: Use confirmation timeframe RSI band touch or crossover for precise entry
Alignment Confirmation: All timeframes should show RSI moving in same direction for highest probability setups
📋 DETAILED PARAMETER CONFIGURATION
RSI Source:
Close (Default): Standard price point, balances responsiveness and reliability
HL2: Reduces noise from intrabar volatility, provides smoother RSI values
HLC3 or OHLC4: Further smoothing for very choppy markets, slower to respond but more stable
Volume-Weighted: Consider using VWAP or volume-weighted prices for additional liquidity context
RSI Length Parameter:
Shorter Periods (5-10): More responsive but generates more signals, suitable for scalping or very active trading, higher noise level
Standard (14): Default and most widely used setting, proven balance between responsiveness and reliability, recommended starting point
Longer Periods (21-30): Smoother momentum measurement, fewer but potentially more reliable signals, better for swing trading or position trading
Optimization Note: Test across different market regimes, optimal length often varies by instrument volatility characteristics
RSI MA Type Parameter:
RMA (Default): Wilder's original smoothing method, provides traditional RSI behavior with balanced lag, most widely recognized and tested, recommended for standard technical analysis
EMA: Exponential smoothing gives more weight to recent values, faster response to momentum changes, suitable for active trading and trending markets, reduces lag compared to RMA
SMA: Simple average treats all periods equally, smoothest output with highest lag, best for filtering noise in choppy markets, useful for long-term position analysis
WMA: Weighted average emphasizes recent data less aggressively than EMA, middle ground between SMA and EMA characteristics, balanced responsiveness for swing trading
Advanced Options: Full access to 25+ moving average types including HMA (reduced lag), DEMA/TEMA (enhanced responsiveness), KAMA/FRAMA (adaptive behavior), T3 (smoothness), Kalman Filter (optimal estimation)
Selection Guide: RMA for traditional analysis and backtesting consistency, EMA for faster signals in trending markets, SMA for stability in ranging markets, adaptive types (KAMA/FRAMA) for varying volatility regimes
BB Length Parameter:
Short Length (10-15): Tighter bands that react quickly to RSI changes, more frequent band touches, suitable for active trading styles
Standard (20): Balanced approach providing meaningful statistical context without excessive lag
Long Length (30-50): Smoother bands that filter minor RSI fluctuations, captures only significant momentum extremes, fewer but higher quality signals
Relationship to RSI Length: Consider BB Length greater than RSI Length for cleaner signals
BB MA Type Parameter:
SMA (Default): Standard Bollinger Bands calculation using simple moving average for basis line, treats all periods equally, widely recognized and tested approach
EMA: Exponential smoothing for basis line gives more weight to recent RSI values, creates more responsive bands that adapt faster to momentum changes, suitable for trending markets
RMA: Wilder's smoothing provides consistent behavior aligned with traditional RSI when using RMA for both RSI and BB calculations
WMA: Weighted average for basis line balances recent emphasis with historical context, middle ground between SMA and EMA responsiveness
Advanced Options: Full access to 25+ moving average types for basis calculation, including HMA (reduced lag), DEMA/TEMA (enhanced responsiveness), KAMA/FRAMA (adaptive to volatility changes)
Selection Guide: SMA for standard Bollinger Bands behavior and backtesting consistency, EMA for faster band adaptation in dynamic markets, matching RSI MA type creates unified smoothing behavior
BB Multiplier Parameter:
Conservative (1.5-1.8): Tighter bands resulting in more frequent touches, useful in low volatility environments, higher signal frequency but potentially more false signals
Standard (2.0): Default setting representing approximately 95% confidence interval under normal distribution, widely accepted statistical threshold
Aggressive (2.5-3.0): Wider bands capturing only extreme momentum conditions, fewer but potentially more significant signals, reduces false signals in high volatility
Adaptive Approach: Consider adjusting multiplier based on instrument characteristics, lower multiplier for stable instruments, higher for volatile instruments
Parameter Optimization Workflow:
Start with default parameters (RSI:14, BB:20, Mult:2.0)
Test across representative sample period including different market regimes
Adjust RSI length based on desired responsiveness vs stability tradeoff
Tune BB length to match your typical holding period
Modify multiplier to achieve desired signal frequency
Validate on out-of-sample data to avoid overfitting
Document optimal parameters for different instruments and timeframes
Reference Levels Display:
Enabled (Default): Shows traditional 30/50/70 levels for comparison with dynamic bands, helps visualize the adaptive advantage
Disabled: Cleaner chart focusing purely on dynamic zones, reduces visual clutter for experienced users
Educational Value: Keeping reference levels visible helps understand how dynamic bands differ from fixed thresholds across varying market conditions
📈 PERFORMANCE ANALYSIS & COMPETITIVE ADVANTAGES
Comparison with Traditional RSI:
Fixed Threshold RSI Limitations:
In ranging low-volatility markets: RSI rarely reaches 70/30, missing tradable extremes
In trending high-volatility markets: RSI frequently breaks through 70/30, generating excessive false reversal signals
Across different instruments: Same thresholds applied to volatile crypto and stable forex pairs produce inconsistent results
Threshold Adjustment Problem: Manually changing thresholds for different conditions is subjective and lagging
RSI Bollinger Bands Advantages:
Automatic Adaptation: Bands adjust to current volatility regime without manual intervention
Consistent Logic: Same statistical approach works across different instruments and timeframes
Reduced False Signals: Band width filtering helps distinguish meaningful extremes from noise
Additional Information: Band width provides volatility context missing in standard RSI
Objective Extremes: Statistical basis (standard deviations) provides objective extreme definition
Comparison with Price-Based Bollinger Bands:
Price BB Characteristics:
Measures absolute price volatility
Affected by large price gaps and outliers
Band position relative to price not normalized
Difficult to compare across different price scales
RSI BB Advantages:
Normalized Scale: RSI's 0-100 bounds make band interpretation consistent across all instruments
Momentum Focus: Directly measures momentum extremes rather than price extremes
Reduced Gap Impact: RSI calculation smooths price gaps impact on band calculations
Comparable Analysis: Same RSI BB appearance across stocks, forex, crypto enables consistent strategy application
Performance Characteristics:
Signal Quality:
Higher Signal-to-Noise Ratio: Dynamic bands help filter RSI oscillations that don't represent meaningful extremes
Context-Aware Alerts: Band width provides volatility context helping traders adjust position sizing and stop placement
Reduced Whipsaws: During consolidations, narrower bands prevent premature signals from minor RSI movements
Responsiveness:
Adaptive Lag: Band calculation introduces some lag, but this lag is adaptive to current conditions rather than fixed
Faster Than Manual Adjustment: Automatic band adjustment is faster than trader's ability to manually modify thresholds
Balanced Approach: Combines RSI's inherent momentum lag with BB's statistical smoothing for stable yet responsive signals
Versatility:
Multi-Strategy Application: Supports both mean reversion (ranging markets) and trend continuation (trending markets) approaches
Universal Instrument Coverage: Works effectively across equities, forex, commodities, cryptocurrencies without parameter changes
Timeframe Agnostic: Same interpretation applies from 1-minute charts to monthly charts
Limitations and Considerations:
Known Limitations:
Dual Lag Effect: Combines RSI's momentum lag with BB's statistical lag, making it less suitable for very short-term scalping
Requires Volatility History: Needs sufficient bars for BB calculation, less effective immediately after major regime changes
Statistical Assumptions: Assumes RSI values are somewhat normally distributed, extreme trending conditions may violate this
Not a Standalone System: Like all indicators, should be combined with price action analysis and risk management
Optimal Use Cases:
Best for swing trading and position trading timeframes
Most effective in markets with alternating volatility regimes
Ideal for traders who use multiple instruments and timeframes
Suitable for systematic trading approaches requiring consistent logic
Suboptimal Conditions:
Very low timeframes (< 5 minutes) where lag becomes problematic
Instruments with extreme volatility spikes (gap-prone markets)
Markets in strong persistent trends where mean reversion rarely occurs
Periods immediately following major structural changes (new trading regime)
USAGE NOTES
This indicator is designed for technical analysis and educational purposes to help traders understand the interaction between momentum measurement and statistical volatility bands. The RSI Bollinger Bands has limitations and should not be used as the sole basis for trading decisions.
Important Considerations:
No Predictive Guarantee: Past band touches and patterns do not guarantee future price behavior
Market Regime Dependency: Indicator performance varies significantly between trending and ranging market conditions
Complementary Analysis Required: Should be used alongside price action, support/resistance levels, and fundamental analysis
Risk Management Essential: Always use proper position sizing, stop losses, and risk controls regardless of signal quality
Parameter Sensitivity: Different instruments and timeframes may require parameter optimization for optimal results
Continuous Monitoring: Band characteristics change with market conditions, requiring ongoing assessment
Recommended Supporting Analysis:
Price structure analysis (support/resistance, trend lines)
Volume confirmation for breakout signals
Multiple timeframe alignment
Market context awareness (news events, session times)
Correlation analysis with related instruments
The indicator aims to provide adaptive momentum analysis that adjusts to changing market volatility, but traders must apply sound judgment, proper risk management, and comprehensive market analysis in their decision-making process.

Strong Economic Events Indicator (mtbr)This indicator is designed to help traders anticipate market reactions to key economic events and visualize trade levels directly on their TradingView charts. It is highly customizable, allowing precise planning for entries, take-profits, and stop-losses.
Key Features:
Multi-Event Support:
Supports dozens of economic events including ISM Services PMI, CPI, Core CPI, PPI, Non-Farm Payrolls, Unemployment Rate, Retail Sales, GDP, and major central bank rate decisions (Fed, ECB, BOE, BOJ, Australia, Brazil, Canada, China).
Custom Event Date and Time:
Manually set the year, month, day, hour, and minute of the event to match your chart and timezone, ensuring accurate alignment.
Forecast vs Actual Analysis:
Input the forecast and actual values. The indicator calculates the likely market direction (Buy/Sell/Neutral) according to historical market reactions for each event.
Dynamic Trade Levels:
Automatically plots:
Entry price
TP1, TP2, TP3 in pips relative to the entry
Stop Loss in pips relative to the entry
Levels are automatically adjusted based on the event's Buy/Sell direction.
Visual Chart Representation:
Entry: Blue line and label
TP1/TP2/TP3: Green lines and labels
Stop Loss: Red line and label
Event occurrence: Orange dashed vertical line
Informative Table Panel:
Displays at the bottom-right of the chart:
Event name
Entry price
TP1, TP2, TP3 values
Current market direction (Buy/Sell/Neutral)
Customizable Line Extension:
Extend the lines for visibility across multiple bars on the chart.
How to Use the Indicator:
Select the Asset:
Set the Asset to Trade input to the symbol you want to analyze (e.g., XAUUSD, EURUSD).
Choose the Economic Event:
Use the drop-down menu to select the event you want to track.
Set the Event Date and Time:
Input the year, month, day, hour, and minute of the event. This ensures the event lines and labels appear at the correct time on your chart.
Input Forecast and Actual Values:
Enter the forecasted value and the actual result of the event. The script will determine market direction based on historically observed reactions for that event.
Configure Entry and Pip Levels:
Set your Entry Price
Set pip distances for TP1, TP2, TP3, and Stop Loss
The script automatically adjusts the levels according to Buy or Sell direction.
View Levels and Status:
Once the event occurs (or on backtesting), the indicator will plot:
Entry, Take Profits, Stop Loss on the chart
Vertical line for event occurrence
Table summarizing levels and Buy/Sell status
Adjust Line Extension:
Use the Line Extension (bars) input to control how far the horizontal levels extend on the chart.
Example Scenario:
Event: PPI MoM
Forecast: 0.2
Actual: 0.9
The indicator identifies the correct market reaction (Sell for EURUSD) and plots the Entry, TP1, TP2, TP3, and Stop Loss accordingly.
Important Notes:
The indicator does not execute trades automatically; it is for analysis and visualization only.
Always combine the signals with your own risk management and analysis.
Ensure your chart is set to the correct timezone corresponding to the event’s time.
This description fully explains how to use the indicator, what it displays, and step-by-step guidance for beginners and experienced traders

Institutional Analyst LLM📊 Institutional Analyst Board LLM – Smart Money Confluence Scanner for XAUUSD, Forex, Crypto 🔍 Overview The Institutional Analyst Board is a complete multi-timeframe smart money toolkit designed for traders who demand clarity, confluence, and precision. It brings together institutional-grade metrics—Order Blocks (OB), Fair Value Gaps (FVG), Liquidity Sweeps, MACD/RSI...
PTS Ultimate Analysis Board (Flexible Position + Ticker)
GoldenTradeClub
GoldenTradeClub
Updated
Jul 15
PTS Ultimate Analysis Board (Flexible Position + Ticker) Version: Pine v5 Description: This indicator builds a fully customizable, multi-timeframe dashboard table that surfaces 19 key metrics for any ticker (current chart TF, 1 h, 4 h). You can position the table at the top-right or bottom-right of your chart and toggle each metric on or off. Key...
Trading Engine AI Light
GoldenTradeClub
GoldenTradeClub
Jul 14
The Trading Engine includes the best and most effective technical analysis tools. It has 27 different Buy Signal parameters and 26 different Sell Signal parameters. Furthermore, it also has 9 Stop Loss triggers for Long Positions and 8 Stop Loss triggers for Short Positions. Many of the Buy or Sell Signal parameters function as Take Profit and Stop Loss signals...
Elliott Wave Complete
GoldenTradeClub
GoldenTradeClub
Jul 4
1. Indicator Presentation Name: Elliott Wave Complete Type: Pine Script v5 overlay dashboard for TradingView Purpose: Automates Elliott Wave motive (1-5) and corrective (A-B-C) pattern detection on any timeframe, enriches it with classic ZigZag pivots, dynamic Fibonacci projection levels, optional wave-count info box, and real-time alerts—all in one...
💀⚡ PTS WIZARD 666™ ULTIMATE SUPREME V5.0 - COMPLETE FIXED ⚡💀
GoldenTradeClub
GoldenTradeClub
Jul 4
1. Indicator Presentation Name: 💀⚡ PTS WIZARD 666™ ULTIMATE SUPREME V5.0 – COMPLETE FIXED Short ID: PTS-666-SUPREME Type: Pine Script v5 overlay dashboard for TradingView Purpose: An all-in-one trading overlay that integrates advanced WaveTrend momentum, RSI/MFI analysis, POC volume profiling, multiple Fibonacci golden/ultimate zones, volume footprint & imbalance...
🔥 PTS TRADE 666™ ULTIMATE BOOKMAP + QUANTUM ENGINE
GoldenTradeClub
GoldenTradeClub
Jul 4
1. Indicator Presentation Name: 🔥 PTS TRADE 666™ ULTIMATE BOOKMAP + QUANTUM ENGINE Short ID: PTS666_QUANTUM_FINAL Type: Pine Script v5 overlay dashboard for TradingView Purpose: A cutting-edge, institutional-grade suite that unifies bookmap-style footprint volume profiling, dynamic heatmap liquidity analysis, AI-driven pattern recognition, smart-money protocols,...
🔥 PTS TRADE 666™ - ULTIMATE INSTITUTIONAL TOOL 🔥
GoldenTradeClub
GoldenTradeClub
Jul 4
1. Indicator Presentation Name: 🔥 PTS TRADE 666™ – ULTIMATE INSTITUTIONAL TOOL V2.0 Short ID: PTS666_UIT_V2 Type: Pine Script v5 overlay dashboard for TradingView Purpose: Combines institutional-grade footprint volume analysis, smart-money structure detection, statistical anomaly checks, multi-timeframe divergence, Ichimoku insights, pattern recognition, and an...
PTS Wizard
GoldenTradeClub
GoldenTradeClub
Jul 4
1. Indicator Presentation Name: PTS Wizard Short Title: PTS Wizard Type: Pine Script v5 overlay dashboard for TradingView Purpose: A unified multi-strategy toolkit that overlays key market insights—liquidity zones, smart-money structure, footprint-style volume profile, consolidation ranges, statistical deviation bands, price forecasts, and session analysis—into a...
🔥 PTS.TRADE 666™ ULTIMATE HYBRID + MTF V3
GoldenTradeClub
GoldenTradeClub
Jul 4
1. Indicator Presentation Name: 🔥 PTS.TRADE 666™ ULTIMATE HYBRID + MTF V3 Short ID: PTS666_ULTIMATE_MTF_V3 Type: Overlay dashboard for TradingView Purpose: A next-level hybrid trading suite that merges institutional-grade order-flow analysis, smart-money concepts, AI-driven insights, classic momentum oscillators (WaveTrend, divergence, “Gold” signals),...
🧙♂ PTS WIZARD V3.0 - FINAL EDITION
GoldenTradeClub
GoldenTradeClub
Jul 4
1. Indicator Presentation Name: 🧙♂ PTS WIZARD V3.0 – FINAL EDITION Short Title: PTS-WIZARD-V3-FINAL Type: Overlay trading dashboard for TradingView Purpose: A comprehensive multi-module indicator that blends classic cipher momentum signals, Elliott Wave pattern detection, advanced statistical analyses (Z-Score, Benford’s Law, Ehlers SNR), footprint-style volume...
🧙♂ PTS WIZARD V3.0 + FOOTPRINT ULTIMATE
GoldenTradeClub
GoldenTradeClub
Jul 4
Name: PTS WIZARD V3.0 + FOOTPRINT ULTIMATE Type: Overlay trading dashboard for TradingView Purpose: Combines classic cipher-style momentum signals with an advanced footprint volume profile, multi-timeframe bias, statistical filters, and a fusion-score system—displayed in a customizable on-chart dashboard. Core Modules Cipher Momentum Signals WaveTrend...
🧙♂ PTS WIZARD V3.0 - BASIC
GoldenTradeClub
GoldenTradeClub
Jul 1
PTS WIZARD V3.0 Basic – Ultimate Multi-Tool Trading Dashboard An all-in-one overlay combining classic cipher signals, Elliott Wave pattern detection, volume analytics, divergence spotting, and smart-entry timing—backed by advanced statistical filters and a live dashboard. Key Features Cipher Signals WaveTrend with overbought/oversold zones & cross signals RSI...
Trading Engine vCD AI
GoldenTradeClub
GoldenTradeClub
Jun 15
The Trading Engine includes the best and most effective technical analysis tools. It has 27 different Buy Signal parameters and 26 different Sell Signal parameters. Furthermore, it also has 9 Stop Loss triggers for Long Positions and 8 Stop Loss triggers for Short Positions. Many of the Buy or Sell Signal parameters function as Take Profit and Stop Loss signals...
Trading Engine vCD
GoldenTradeClub
GoldenTradeClub
Updated
Mar 21
The Trading Engine includes the best and most effective technical analysis tools. It has 27 different Buy Signal parameters and 26 different Sell Signal parameters. Furthermore, it also has 9 Stop Loss triggers for Long Positions and 8 Stop Loss triggers for Short Positions. Many of the Buy or Sell Signal parameters function as Take Profit and Stop Loss signals...
TE CLIENT v13
GoldenTradeClub
GoldenTradeClub
Updated
Mar 15
The Trading Engine includes the best and most effective technical analysis tools. It has 27 different Buy Signal parameters and 26 different Sell Signal parameters. Furthermore, it also has 9 Stop Loss triggers for Long Positions and 8 Stop Loss triggers for Short Positions. Many of the Buy or Sell Signal parameters function as Take Profit and Stop Loss signals...
Trading Engine v13
GoldenTradeClub
GoldenTradeClub
Updated
Mar 15
The Trading Engine includes the best and most effective technical analysis tools. It has 27 different Buy Signal parameters and 26 different Sell Signal parameters. Furthermore, it also has 9 Stop Loss triggers for Long Positions and 8 Stop Loss triggers for Short Positions. Many of the Buy or Sell Signal parameters function as Take Profit and Stop Loss signals...
Trading Engine B2B
GoldenTradeClub
GoldenTradeClub
Updated
Jan 14
The Trading Engine includes the best and most effective technical analysis tools. It has 25 different Buy Signal parameters and 24 different Sell Signal parameters. Furthermore, it also has 9 Stop Loss triggers for Long Positions and 8 Stop Loss triggers for Short Positions. Many of the Buy or Sell Signal parameters function as Take Profit and Stop Loss signals...
Trading Engine B2B FX V9
GoldenTradeClub
GoldenTradeClub
Updated
Jan 14
The VFLOW Trading Engine includes the best and most effective technical analysis tools. It has 20 different Buy Signal parameters and 18 different Sell Signal parameters. Furthermore, it also has 7 Stop Loss triggers for Long Positions and 5 Stop Loss triggers for Short Positions. Many of the Buy or Sell Signal parameters function as Take Profit and Stop Loss...
English
Select market data provided by ICE Data services.
Select reference data provided by FactSet. Copyright © 2025 FactSet Research Systems Inc.
© 2025 TradingView, Inc.
More than a product
Supercharts
Screeners
Stocks
ETFs
Bonds
Crypto coins
CEX pairs
DEX pairs
Pine
Heatmaps
Stocks
ETFs
Crypto
Calendars
Economic
Earnings
Dividends
More products
Yield Curves
Options
News Flow
Pine Script®
Apps
Mobile
Desktop
Tools & subscriptions
Features
Pricing
Market data
Trading
Overview
Brokers
Special offers
CME Group futures
Eurex futures
US stocks bundle
About company
Who we are
Athletes
Blog
Careers
Media kit
Merch
TradingView store
Tarot cards for traders
The C63 TradeTime
Policies & security
Terms of Use
Disclaimer
Privacy Policy
Cookies Policy
Accessibility Statement
Security tips
Bug Bounty program
Status page
Community
Social network
Wall of Love
Refer a friend
House Rules
Moderators
Ideas
Trading
Education
Editors' picks
Pine Script
Indicators & strategies
Wizards
Freelancers
Business solutions
Widgets
Charting libraries
Lightweight Charts™
Advanced Charts
Trading Platform
Growth opportunities
Advertising
Brokerage integration
Partner program
Education program
Look First
Close
Updated 3 hours ago
Institutional Analyst Board
Manage access
Remove from favorites
Use on chart
0
11
Jul 19
📊 Institutional Analyst Board – Smart Money Confluence Scanner for XAUUSD, Forex, Crypto
🔍 Overview
The Institutional Analyst Board is a complete multi-timeframe smart money toolkit designed for traders who demand clarity, confluence, and precision. It brings together institutional-grade metrics—Order Blocks (OB), Fair Value Gaps (FVG), Liquidity Sweeps, MACD/RSI bias, VWAP positioning, and Break of Structure (BoS)—into a single powerful visual dashboard.
This indicator is especially optimized for Gold (XAUUSD) but is also compatible with Crypto and Forex assets.
🧠 Key Features
✅ Multi-Timeframe Dashboard (5M / 15M / 1H)
✅ Order Block Detection with dynamic zones that extend until broken
✅ Fair Value Gap Detection with clear zone shading and border distinction
✅ MACD + RSI Confluence for momentum and bias alignment
✅ VWAP Positioning to identify premium/discount zones
✅ Liquidity Sweeps (internal/external range breaks)
✅ Killzone Highlighting (Asia / London / New York)
✅ Break of Structure (BoS) with advanced confluence filters
✅ Gold Bias Flags across timeframes (BUY / SELL / NEUTRAL)
✅ Dynamic Price Watermark with real-time data
✅ Fully customizable colors, transparencies, and text labels
🧠 How It Works
The Board uses institutional logic to analyze the chart in real time:
Metric Purpose
OB Zones Highlight potential smart money footprints where price is likely to react.
FVG Zones Identify imbalance areas between buyers and sellers—ideal for mean reversion entries.
MACD/RSI Confirm momentum direction and relative strength confluence.
VWAP Determine whether price is trading at a premium or discount.
Liquidity Sweeps Detect manipulative moves before major reversals.
BoS Mark potential trend reversals, filtered by institutional confluence.
Each signal is computed across 3 timeframes and visualized in a clean board that updates live. You’ll also see labels, alerts, and session overlays for maximum clarity.
📌 Ideal Use Case
This tool is perfect for:
Funded Challenge Traders (FTMO, MyForexFunds, etc.)
Gold scalpers and intraday traders
Crypto price action traders using BTC, ETH, SOL, etc.
Smart Money Concept (SMC) and ICT followers
⚙️ Customization Options
Toggle each module (OB, FVG, VWAP, MACD/RSI, etc.)
Set transparency and color for each zone type
Adjust Killzone timing (Asia, London, NY)
Control board position (Top/Bottom) and metric visibility
📈 Compatible Assets
✅ XAUUSD (optimized)
✅ Forex majors/minors
✅ Crypto pairs (BTC, ETH, SOL, etc.)
✅ Indices (GER40, NASDAQ, SPX with minor adaptation)
🛠️ Requirements
Use on TradingView v5
Set chart time to UTC+0 or UTC+3 for optimal Killzone accuracy
For crypto, redefine Killzone hours if needed (24/7 market)
🧠 Pro Tip
Pair this indicator with volume profile tools, CVD/Delta Flow, or Footprint overlays to build high-confidence trade setups with clear institutional confluence.

Pineify Signals and OverlaysIndicator Theoretical Basis
Pineify Signals and Overlays is an invite-only trend-following and reversal-detection toolkit that fuses four well-known concepts— Dow-Theory trend phases , a multi-pair EMA cloud, QQE momentum, and ATR-based risk management—into a single, weight-balanced engine. An optional multi-time-frame (MTF) filter aligns lower-time-frame signals with higher-time-frame structure, helping traders avoid counter-trend setups. All components can be toggled from the settings panel, and a beginner “One-Click” preset loads a conservative profile out of the box.
Why it’s a single script: The algorithm scores every bar on three orthogonal axes—trend, momentum, and volatility—then issues context-aware arrows and coloured clouds only when the axes agree within user-defined tolerances. This inter-locking logic cannot be reproduced by simply stacking independent indicators on a chart, hence the need for an integrated implementation.
Trend Confirmation
Trend Confirmation: This indicator presents two types of market trends: the primary trend and the secondary trend. The primary trend is the long - term direction of the market and can last for days or months; the secondary trend is the adjustment phase within the primary trend.
This indicator uses the EMA (Exponential Moving Average) and visualizes the trend phases through color filling. The judgment of the trend is that blue plus green indicates a bullish trend, and yellow plus red indicates a bearish trend.
The primary trend of this indicator is visualized by two sets of moving averages through color filling. These two sets of moving averages are used to describe the short - term and long - term trends in the market.
The short - period moving averages and the long - period moving averages each consist of 4 moving averages, with a total of 8 moving averages, representing the short - term fluctuations and trends of the market.
Trend Persistence: Once the primary trend is formed, it will persist for a period of time. This indicator judges based on the Dow Theory. Short - term market fluctuations do not necessarily reflect changes in the primary trend. Therefore, the judgment direction of the primary trend is visualized through color.
The Signals of Buying, Selling and Closing
In the primary trend, we can see signals of trend reversal. This indicator incorporates the "Consecutive Candles". The indicator mainly identifies the overbought or oversold state of the market through a series of consecutive conditions, so as to predict the reversal point. The core of this indicator is to identify a series of consecutive price movements in the market trend and determine whether the market is about to reverse based on this sequence. We visualize the turning points through buy and sell signals.
The trend confirmation system utilizes four pairs of Exponential Moving Averages (EMAs) creating dynamic cloud formations that visualize market direction. Short-period EMAs (5, 8, 20, 34) interact with longer-period EMAs (9, 13, 21, 50) to generate color-coded trend clouds . Blue and green clouds indicate bullish conditions, while yellow and red clouds signal bearish trends, providing immediate visual trend identification.
The presentation of buying and selling points, namely "Quantitative Qualitative Estimation", is a technical indicator that combines the concepts of the Relative Strength Index (RSI) and moving averages. It is used to evaluate market trends, overbought and oversold conditions, as well as potential trend reversal points. The oscillator has a relatively long smoothing period, making the indicator relatively stable, thus enabling the visualization of buy + and sell + signals for trading.
ATR Stop - Loss Line
ATR (Average True Range) is an indicator for measuring market volatility. By using the ATR value to set the stop - loss distance, the stop - loss level can be automatically adjusted according to market volatility, making the stop - loss more flexible.
Core principle
Trend-Cloud Engine
EMA Pairs (5, 8, 20, 34 vs 9, 13, 21, 50)—Two four-EMA sets form “fast” and “slow” envelopes. When the volume-weighted mean of the fast set sits above the slow set and both slopes are positive, the bar is tagged primary bullish; the inverse tags primary bearish. Cloud colours (blue/green vs yellow/red) mirror Dow Theory’s primary/secondary trend hierarchy.
Momentum & Exhaustion Layer
QQE Oscillator (RSI 14, factor 4.238) detects momentum extremes and smooths noise more than a raw RSI, making it better suited for multi-time-frame use.
Consecutive-Candle Counter (default 8) highlights potential exhaustion after extended unidirectional moves; reversal symbols appear only if QQE divergence also exists.
Volatility-Adjusted Risk Line
ATR Trailing Stop (ATR 21, dynamic multiplier) expands in high volatility and tightens in low volatility, offering an adaptive exit reference rather than a fixed-tick stop.
Multi-Time-Frame Confirmation
The script automatically chooses a higher aggregation (e.g., 4 × the chart timeframe) and requires primary-trend agreement before issuing “Long ▲+” or “Short ▼+” confirmations. This guards against false signals during counter-trend rebounds.
Recommended parameters
RSI Length: 14 (QQE calculation base)
QQE Factor: 4.238 (Fibonacci-based multiplier)
ATR Period: 21 (volatility measurement)
EMA Lengths: Configurable short (5,8,20,34) and long (9,13,21,50) periods
Consecutive Candles: Selectable count (8)
Multi-timeframe Filter: Filter is enabled by default, resulting in more accurate signals.
Filters
The multi-timeframe filter enhances signal reliability by confirming trends across higher timeframes. This prevents counter-trend trades by ensuring alignment between current chart timeframe and broader market direction. The filter automatically calculates appropriate higher timeframes for trend confirmation.
Signals & Alerts
The indicator system exports multiple alert signals, and you can easily alert for any signal.
Up Trend : Primary long signal appears
Long - ▲ : Buy signal appears
Long - ▲+ : Confirmation buy signal appears
Long - ● : Primary reversal signal appears
Long - ☓ : Secondary reversal signal appears
Down Trend : Primary short signal appears
Short - ▼ : Sell signal appears
Short - ▼+ : Confirmation sell signal appears
Short - ● : Primary reversal signal appears
Short - ☓ : Secondary reversal signal appears
Originality & Value for Traders
Integrated scoring logic ensures signals fire only when trend, momentum, and volatility metrics corroborate, reducing “indicator conflict”.
Auto-computed MTF pairs mean no manual timeframe juggling.
Weight-balanced QQE/EMA blend creates smoother trend clouds than standard MA crosses, yet remains more responsive than Keltner or Donchian approaches.
One-click beginner profile plus full parameter access supports both novice and advanced users.
Risk Disclaimer
Use with Caution: This indicator is provided for educational and informational purposes only and should not be considered as financial advice. Users should exercise caution and perform their own analysis before making trading decisions based on the indicator's signals.
Not Financial Advice: The information provided by this indicator does not constitute financial advice, and the creator (Pineify) shall not be held responsible for any trading losses incurred as a result of using this indicator.
Backtesting Recommended: Traders are encouraged to backtest the indicator thoroughly on historical data before using it in live trading to assess its performance and suitability for their trading strategies.
Risk Management: Trading involves inherent risks, and users should implement proper risk management strategies, including but not limited to stop-loss orders and position sizing, to mitigate potential losses.
No Guarantees: The accuracy and reliability of the indicator's signals cannot be guaranteed, as they are based on historical price data and past performance may not be indicative of future results.

Palgo Trading - Palgo🎯THE PALGO INDICATOR
The "Palgo Trading - Palgo" indicator, developed by PALGOTRADING is a sophisticated technical analysis tool designed to identify potential buy and sell signals by combining trend analysis with momentum and optional AI-driven sentiment assessment. This indicator provides a clear visual representation of potential trading opportunities directly on the price chart.
At its core, the Palgo indicator synthesizes information from well-established technical analysis concepts with statistical functions, and has optional AI Integration for social analysis of the asset using external data :
Supertrend: This indicator identifies the prevailing trend direction. A positive Supertrend value suggests an upward trend, while a negative value indicates a downward trend. The Palgo indicator utilizes a Supertrend with a customizable multiplier and a user-configurable Average True Range (ATR) length (defaulting to 21).
🛜Signal Generation Logic
The indicator generates buy and sell signals based on a calculated "final direction" value. This value is derived by combining the Supertrend direction and a modified RSI. The modification involves scaling the RSI output to a range of -0.5 to 0.5 and then further adjusting it.
The buy and sell conditions are as follows:
Buy Signal: A buy signal is triggered when the "final direction" crosses above a positive activation threshold while the current signal is not already bullish. Upon signal generation, a "Buy" label (colored green) appears below the bar, and initial Take Profit (TP) and Stop Loss (SL) levels are calculated and stored.
Sell Signal: Conversely, a sell signal is triggered when the "final direction" crosses below a negative activation threshold while the current signal is not already bearish. A "Sell" label (colored red) is plotted above the bar, and corresponding TP and SL levels are determined.
✅ Optimized Take-Profit / Stop-Loss
The Take-Profit (TP) & Stop-Loss (SL) signals are optimized with Kernel Density Estimation (KDE), the script uses KDE activated by gaussian function on previous pivot points and trains the model, then tries to estimate new pivot points early, to determine new TP / SL levels for the current signal. Kernel Density Estimation takes values of the previous confirmed pivots' RSI values, body size & more factors to determine their role. This indicator can generate up to 5 TP signals per signal.
📈 Signal Trail
Palgo also includes a "Signal Trail" that visually shows the market's momentum. This trail is like a dynamic line that follows the price.
When the market is in an uptrend and looking strong, you'll see a green trail.
When it's in a downtrend and looking weak, you'll see a red trail.
This trail helps you see if the market is currently aligned with Palgo's bullish (buy) or bearish (sell) signal. It also acts as a visual guide for potential support or resistance levels.
📊Backtesting Dashboard
The Palgo indicator includes an optional Backtesting Dashboard to help you understand its historical performance. This dashboard appears directly on your chart and provides a quick summary of how the indicator's signals have performed in the past.
Here's what you'll see on the dashboard:
Sensitivity: This shows the specific "Sensitivity" setting you've chosen for the indicator. This setting influences how often signals are generated.
Wins: This number tells you how many trades initiated by the Palgo indicator historically ended in profit (reached a Take-Profit target or closed profitably when the signal reversed).
Loss: This number indicates how many trades historically ended in a loss (hit the Stop-Loss).
Winrate: This is a very important metric, displayed as a percentage. It shows you the proportion of winning trades compared to the total number of trades (Wins / (Wins + Loss)). A higher winrate generally suggests a more effective strategy.
This dashboard is a valuable tool for reviewing the indicator's effectiveness with different settings and helping you make informed decisions about its use in your trading.
🤖AI Integration (Optional):
A unique feature of the Palgo indicator is the optional integration of Artificial Intelligence (AI) sentiment analysis. When the "Use AI" input is enabled, the indicator incorporates two additional user-defined inputs:
Impression Change %: This input represents the percentage change in overall market sentiment as assessed by an external AI.
Positivity Change: This input reflects the change in positive sentiment, also provided by an AI.
These AI inputs are combined to create an "AI Score," which then influences the "final direction" calculation. A positive AI Score amplifies the bullish signals and dampens bearish signals, while a negative AI Score has the opposite effect.
❓Why PALGO ?
All-in-One Analysis: Palgo combines trend, momentum, and advanced statistical analysis into one easy-to-use tool, giving you a complete picture without needing multiple indicators.
Dynamic Profit & Loss Management: Unlike many tools with fixed targets, Palgo's smart profit and stop-loss system adapts to the market using KDE. This helps you potentially capture more gains and limit losses effectively.
Optional AI Insights: For an extra edge, Palgo can tap into Artificial Intelligence (AI) to gauge overall market mood. If the AI sees a lot of positive buzz, it can strengthen buy signals; if it's negative, it can reinforce sell signals. This helps you trade with a better understanding of the market's pulse.
Clear and Customizable: Palgo is designed to be very visual. It changes the color of the price bars, adds clear "Buy" or "Sell" labels, and marks your profit and stop-loss points. You can also change the colors to suit your preference.
Palgo aims to be a comprehensive and adaptable trading tool, giving you clearer insights.
⚙️Visualizations and Customization
The Palgo indicator offers several visual cues to aid traders:
Bar Coloring: The price bars are colored green when the indicator identifies a bullish signal and red during a bearish signal.
Signal Labels: Clear "Buy" and "Sell" labels are plotted at the signal generation points.
Take Profit and Stop Loss Markers: Distinct shapes and labels indicate when the price reaches the calculated TP and SL levels.
Style Options: Users can customize the colors for bullish and bearish bars, text, and TP/SL markers within the indicator's settings.
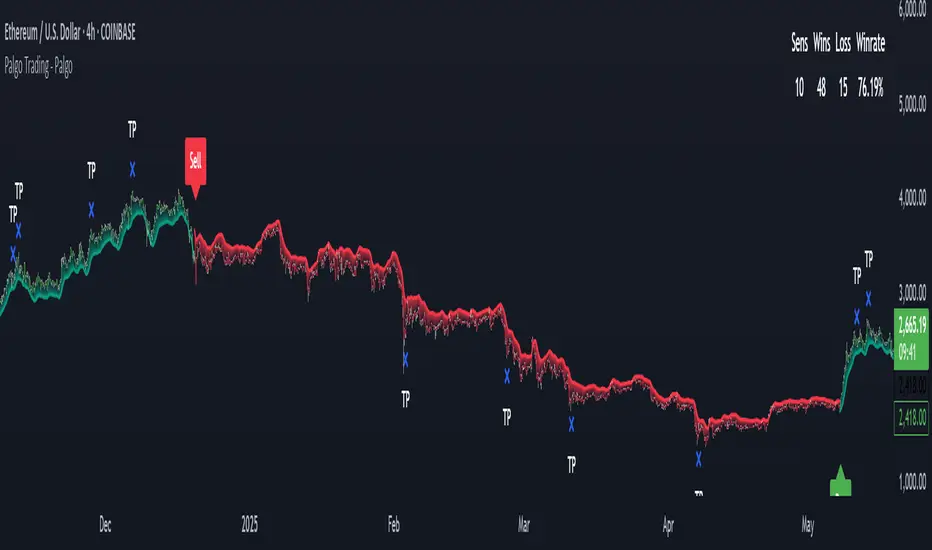
Quantum State Superposition Indicator (QSSI)Quantum State Superposition Indicator (QSSI) - Where Physics Meets Finance
The Quantum Revolution in Market Analysis
After months of research into quantum mechanics and its applications to financial markets, I'm thrilled to present the Quantum State Superposition Indicator (QSSI) - a groundbreaking approach that models price action through the lens of quantum physics. This isn't just another technical indicator; it's a paradigm shift in how we understand market behavior.
The Theoretical Foundation
Quantum Superposition in Markets
In quantum mechanics, particles exist in multiple states simultaneously until observed. Similarly, markets exist in a superposition of potential states (bullish, bearish, neutral) until a significant volume event "collapses" the wave function into a definitive direction.
The mathematical framework:
Wave Function (Ψ): Represents the market's quantum state as a weighted sum of all possible states:
Ψ = Σ(αᵢ × Sᵢ)
Where αᵢ are probability amplitudes and Sᵢ are individual quantum states.
Probability Amplitudes: Calculated using the Born rule, normalized so Σ|αᵢ|² = 1
Observation Operator: Volume/Average Volume ratio determines observation strength
The Five Quantum States
Momentum State: Short-term price velocity (EMA of returns)
Mean Reversion State: Deviation from equilibrium (normalized z-score)
Volatility Expansion State: ATR relative to historical average
Trend Continuation State: Long-term price positioning
Chaos State: Volatility of volatility (market uncertainty)
Each state contributes to the overall wave function based on current market conditions.
Wave Function Collapse
When volume exceeds the observation threshold (default 1.5x average), the wave function "collapses," committing the market to a direction. This models how institutional volume forces markets out of uncertainty into trending states.
Collapse Detection Formula:
Collapse = Volume > (Threshold × Average Volume)
Direction = Sign(Ψ) at collapse moment
Advanced Quantum Concepts
Heisenberg Uncertainty Principle
The indicator calculates market uncertainty as the product of price and momentum
uncertainties:
ΔP × ΔM = ℏ (market uncertainty constant)
This manifests as dynamic uncertainty bands that widen during unstable periods.
Quantum Tunneling
Calculates the probability of price "tunneling" through resistance/support barriers:
P(tunnel) = e^(-2×|barrier_height|×√coherence_length)
Unlike classical technical analysis, this gives probability of breakouts before they occur.
Entanglement
Measures the quantum correlation between price and volume:
Entanglement = |Correlation(Price, Volume, lookback)|
High entanglement suggests coordinated institutional activity.
Decoherence
When market states lose quantum properties and behave classically:
Decoherence = 1 - Σ(amplitude²)
Indicates trend emergence from quantum uncertainty.
Visual Innovation
Probability Clouds
Three-tier probability distributions visualize market uncertainty:
Inner Cloud (68%): One standard deviation - most likely price range
Middle Cloud (95%): Two standard deviations - probable extremes
Outer Cloud (99.7%): Three standard deviations - tail risk zones
Cloud width directly represents market uncertainty - wider clouds signal higher entropy states.
Quantum State Visualization
Colored dots represent individual quantum states:
Green: Momentum state strength
Red: Mean reversion state strength
Yellow: Volatility state strength
Dot brightness indicates amplitude (influence) of each state.
Collapse Events
Aqua Diamonds (Above): Bullish collapse - upward commitment
Pink Diamonds (Below): Bearish collapse - downward commitment
These mark precise moments when markets exit superposition.
Implementation Details
Core Calculations
Feature Extraction: Normalize price returns, volume ratios, and volatility measures
State Calculation: Compute each quantum state's value
Amplitude Assignment: Weight states by market conditions and observation strength
Wave Function: Sum weighted states for final market quantum state
Visualization: Transform quantum values to price space for display
Performance Optimization
- Efficient array operations for state calculations
- Single-pass normalization algorithms
- Optimized correlation calculations for entanglement
- Smart label management to prevent visual clutter
Trading Applications:
Signal Generation
Bullish Signals:
- Positive wave function during collapse
- High tunneling probability at support
- Coherent market state with bullish bias
Bearish Signals:
- Negative wave function during collapse
- High tunneling probability at resistance
- Decoherent state transitioning bearish
Risk Management
Uncertainty-Based Position Sizing:
Narrow clouds: Normal position size
Wide clouds: Reduced position size
Extreme uncertainty: Stay flat
Quantum Stop Losses:
- Place stops outside probability clouds
- Adjust for Heisenberg uncertainty
- Respect quantum tunneling levels
Market Regime Recognition
Quantum Coherent (Superposed):
- Market in multiple states
- Avoid directional trades
- Prepare for collapse
Quantum Decoherent (Classical):
-Clear trend emergence
- Follow directional signals
- Traditional analysis applies
Advanced Features
Adaptive Dashboards
Quantum State Panel: Real-time wave function, dominant state, and coherence status
Performance Metrics: Win rate, signal frequency, and regime analysis
Information Guide: Comprehensive explanation of all quantum concepts
- All dashboards feature adjustable sizing for different screen resolutions.
Multi-Timeframe Quantum Analysis
The indicator adapts to any timeframe:
Scalping (1-5m): Short coherence length, sensitive thresholds
Day Trading (15m-1H): Balanced parameters
Swing Trading (4H-1D): Long coherence, stable states
Alert System
Sophisticated alerts for:
- Wave function collapse events
- Decoherence transitions
- High tunneling probability
- Strong entanglement detection
Originality & Innovation
This indicator introduces several firsts:
Quantum Superposition: First to model markets as quantum systems
Wave Function Collapse: Original volume-triggered state commitment
Tunneling Probability: Novel breakout prediction method
Entanglement Metrics: Unique price-volume quantum correlation
Probability Clouds: Revolutionary uncertainty visualization
Development Journey
Creating QSSI required:
- Deep study of quantum mechanics principles
- Translation of physics equations to market context
- Extensive backtesting across multiple markets
- UI/UX optimization for trader accessibility
- Performance optimization for real-time calculation
- The result bridges cutting-edge physics with practical trading.
Best Practices
Parameter Optimization
Quantum States (2-5):
- 2-3 for simple markets (forex majors)
- 4-5 for complex markets (indices, crypto)
Coherence Length (10-50):
- Lower for fast markets
- Higher for stable markets
Observation Threshold (1.0-3.0):
- Lower for active markets
- Higher for thin markets
Signal Confirmation
Always confirm quantum signals with:
- Market structure (support/resistance)
- Volume patterns
- Correlated assets
- Fundamental context
Risk Guidelines
- Never risk more than 2% per trade
- Respect probability cloud boundaries
- Exit on decoherence shifts
- Scale with confidence levels
Educational Value
QSSI teaches advanced concepts:
- Quantum mechanics applications
- Probability theory
- Non-linear dynamics
- Risk management
- Market microstructure
Perfect for traders seeking deeper market understanding.
Disclaimer
This indicator is for educational and research purposes only. While quantum mechanics provides a fascinating framework for market analysis, no indicator can predict future prices with certainty. The probabilistic nature of both quantum mechanics and markets means outcomes are inherently uncertain.
Always use proper risk management, conduct thorough analysis, and never risk more than you can afford to lose. Past performance does not guarantee future results.
Conclusion
The Quantum State Superposition Indicator represents a revolutionary approach to market analysis, bringing institutional-grade quantum modeling to retail traders. By viewing markets through the lens of quantum mechanics, we gain unique insights into uncertainty, probability, and state transitions that classical indicators miss.
Whether you're a physicist interested in finance or a trader seeking cutting-edge tools, QSSI opens new dimensions in market analysis.
"The market, like Schrödinger's cat, exists in multiple states until observed through volume."
* As you may have noticed, the past two indicators I've released (Lorentzian Classification and Quantum State Superposition) are designed with strategy implementation in mind. I'm currently developing a stable execution platform that's completely unique and moves away from traditional ATR-based position sizing and stop loss systems. I've found ATR-based approaches to be unreliable in volatile markets and regime transitions - they often lag behind actual market conditions and can lead to premature exits or oversized positions during volatility spikes.
The goal is to create something that adapts to market conditions in real-time using the quantum and relativistic principles we've been exploring. Hopefully I'll have something groundbreaking to share soon. Stay tuned!
Trade with quantum insight. Trade with QSSI .
— Dskyz , for DAFE Trading Systems

Bullish and Bearish Breakout Alert for Gold Futures PullbackBelow is a Pine Script (version 6) for TradingView that includes both bullish and bearish breakout conditions for my intraday trading strategy on micro gold futures (MGC). The strategy focuses on scalping two-legged pullbacks to the 20 EMA or key levels with breakout confirmation, tailored for the Apex Trader Funding $300K challenge. The script accounts for the Daily Sentiment Index (DSI) at 87 (overbought, favoring pullbacks). It generates alerts for placing stop-limit orders for 175 MGC contracts, ensuring compliance with Apex’s rules ($7,500 trailing threshold, $20,000 profit target, 4:59 PM ET close).
Script Requirements
Version: Pine Script v6 (latest for TradingView, April 2025).
Purpose:
Bullish: Alert when price breaks above a rejection candle’s high after a two-legged pullback to the 20 EMA in a bullish trend (price above 20 EMA, VWAP, higher highs/lows).
Bearish: Alert when price breaks below a rejection candle’s low after a two-legged pullback to the 20 EMA in a bearish trend (price below 20 EMA, VWAP, lower highs/lows).
Context: 5-minute MGC chart, U.S. session (8:30 AM–12:00 PM ET), avoiding overbought breakouts above $3,450 (DSI 87).
Output: Alerts for stop-limit orders (e.g., “Buy: Stop=$3,377, Limit=$3,377.10” or “Sell: Stop=$3,447, Limit=$3,446.90”), quantity 175 MGC.
Apex Compliance: 175-contract limit, stop-losses, one-directional news trading, close by 4:59 PM ET.
How to Use the Script in TradingView
1. Add Script:
Open TradingView (tradingview.com).
Go to “Pine Editor” (bottom panel).
Copy the script from the content.
Click “Add to Chart” to apply to your MGC 5-minute chart .
2. Configure Chart:
Symbol: MGC (Micro Gold Futures, CME, via Tradovate/Apex data feed).
Timeframe: 5-minute (entries), 15-minute (trend confirmation, manually check).
Indicators: Script plots 20 EMA and VWAP; add RSI (14) and volume manually if needed .
3. Set Alerts:
Click the “Alert” icon (bell).
Add two alerts:
Bullish Breakout: Condition = “Bullish Breakout Alert for Gold Futures Pullback,” trigger = “Once Per Bar Close.”
Bearish Breakout: Condition = “Bearish Breakout Alert for Gold Futures Pullback,” trigger = “Once Per Bar Close.”
Customize messages (default provided) and set notifications (e.g., TradingView app, SMS).
Example: Bullish alert at $3,377 prompts “Stop=$3,377, Limit=$3,377.10, Quantity=175 MGC” .
4. Execute Orders:
Bullish:
Alert triggers (e.g., stop $3,377, limit $3,377.10).
In TradingView’s “Order Panel,” select “Stop-Limit,” set:
Stop Price: $3,377.
Limit Price: $3,377.10.
Quantity: 175 MGC.
Direction: Buy.
Confirm via Tradovate.
Add bracket order (OCO):
Stop-loss: Sell 175 at $3,376.20 (8 ticks, $1,400 risk).
Take-profit: Sell 87 at $3,378 (1:1), 88 at $3,379 (2:1) .
Bearish:
Alert triggers (e.g., stop $3,447, limit $3,446.90).
Select “Stop-Limit,” set:
Stop Price: $3,447.
Limit Price: $3,446.90.
Quantity: 175 MGC.
Direction: Sell.
Confirm via Tradovate.
Add bracket order:
Stop-loss: Buy 175 at $3,447.80 (8 ticks, $1,400 risk).
Take-profit: Buy 87 at $3,446 (1:1), 88 at $3,445 (2:1) .
5. Monitor:
Green triangles (bullish) or red triangles (bearish) confirm signals.
Avoid bullish entries above $3,450 (DSI 87, overbought) or bearish entries below $3,296 (support) .
Close trades by 4:59 PM ET (set 4:50 PM alert) .

Multi-Factor Reversal AnalyzerMulti-Factor Reversal Analyzer – Quantitative Reversal Signal System
OVERVIEW
Multi-Factor Reversal Analyzer is a comprehensive technical analysis toolkit designed to detect market tops and bottoms with high precision. It combines trend momentum analysis, price action behavior, wave oscillation structure, and volatility breakout potential into one unified indicator.
This indicator is not a random mix of tools — each module is carefully selected for a specific purpose. When combined, they form a multi-dimensional view of the market, merging trend analysis, momentum divergence, and volatility compression to produce high-confidence signals.
Why Combine These Modules?
Module Combination Ideas & How to Use Them
Factor A: Trend Detector + Gold Zone
Concept:
• The Trend Detector (light yellow histogram) evaluates market strength:
• Histogram trending downward or staying below 50 → bearish conditions;
• Trending upward or staying above 50 → bullish conditions.
• The Gold Zone identifies areas of volatility compression — typically a prelude to explosive market moves.
Practical Application:
• When the Gold Zone appears and the Trend Detector is bearish → likely downside move;
• When the Gold Zone appears and the Trend Detector is bullish → likely upside breakout.
• Note: The Gold Zone does not mean the bottom is in. It is not a buy signal on its own — always combine it with other modules for directional bias.
Factor B: PAI + Wave Trend
Concept:
• PAI (Price Action Index) is a custom oscillator that combines price momentum with volatility dispersion, displaying strength zones:
• Green area → bullish dominance;
• Red area → bearish pressure.
• Wave Trend offers smoothed crossover signals via the main and signal lines.
Practical Application:
• When PAI is in the green zone and Wave Trend makes a bullish crossover → potential reversal to the upside;
• When PAI is in the red zone and Wave Trend shows a bearish crossover → potential start of a downtrend.
Factor C: Trend Detector + PAI
Concept:
• Combines directional trend strength with price action strength to confirm setups via confluence.
Practical Application:
• Trend Detector histogram bottoms out + PAI enters the green zone → high chance of upward reversal;
• Histogram tops out + PAI in the red zone → increased likelihood of downside continuation.
Multi-Factor Confluence (Advanced Use)
• When Trend Detector, PAI, and Wave Trend all align in the same direction (bullish or bearish), the directional signal becomes significantly more reliable.
• This setup is especially useful for trend-following or swing trade entries.
KEY FEATURES
1. Multi-Layer Reversal Logic
• Combines trend scoring, oscillator divergence, and volatility squeezes for triangulated reversal detection.
• Helps traders distinguish between trend pullbacks and true reversals.
2. Advanced Divergence Detection
• Detects both regular and hidden divergences using pivot-based confirmation logic.
• Customizable lookback ranges and pivot sensitivity provide flexible tuning for different market styles.
3. Gold Zone Volatility Compression
• Highlights pre-breakout zones using custom oscillation models (RSI, harmonic, Karobein, etc.).
• Improves anticipation of breakout opportunities following low-volatility compressions.
4. Trend Direction Context
• PAI and Trend Score components provide top-down insight into prevailing bias.
• Built-in “Straddle Area” highlights consolidation zones; breakouts from this area often signal new trend phases.
5. Flexible Visualization
• Color-coded trend bars, reversal markers, normalized oscillator plots, and trend strength labels.
• Designed for both visual discretionary traders and data-driven system developers.
USAGE GUIDELINES
1. Applicable Markets
• Suitable for stocks, crypto, futures, and forex
• Supports reversal, mean-reversion, and breakout trading styles
2. Recommended Timeframes
• Short-term traders: 5m / 15m / 1H — use Wave Trend divergence + Gold Zone
• Swing traders: 4H / Daily — rely on Price Action Index and Trend Detector
• Macro trend context: use PAI HTF mode for higher timeframe overlays
3. Reversal Strategy Flow
• Watch for divergence (WT/PAI) + Gold Zone compression
• Confirm with Trend Score weakening or flipping
• Use Straddle Area breakout for final trigger
• Optional: enable bar coloring or labels for visual reinforcement
• The indicator performs optimally when used in conjunction with a harmonic pattern recognition tool
4. Additional Note on the Gold Zone
The “Gold Zone” does not directly indicate a market bottom. Since it is displayed at the bottom of the chart, it may be misunderstood as a bullish signal. In reality, the Gold Zone represents a compression of price momentum and volatility, suggesting that a significant directional move is about to occur. The direction of that move—upward or downward—should be determined by analyzing the histogram:
• If histogram momentum is weakening, the Gold Zone may precede a downward move.
• If histogram momentum is strengthening, it may signal an upcoming rebound or rally.
Treat the Gold Zone as a warning of impending volatility, and always combine it with trend indicators for accurate directional judgment.
RISK DISCLAIMER
• This indicator calculates trend direction based on historical data and cannot guarantee future market performance. When using this indicator for trading, always combine it with other technical analysis tools, fundamental analysis, and personal trading experience for comprehensive decision-making.
• Market conditions are uncertain, and trend signals may result in false positives or lag. Traders should avoid over-reliance on indicator signals and implement stop-loss strategies and risk management techniques to reduce potential losses.
• Leverage trading carries high risks and may result in rapid capital loss. If using this indicator in leveraged markets (such as futures, forex, or cryptocurrency derivatives), exercise caution, manage risks properly, and set reasonable stop-loss/take-profit levels to protect funds.
• All trading decisions are the sole responsibility of the trader. The developer is not liable for any trading losses. This indicator is for technical analysis reference only and does not constitute investment advice.
• Before live trading, it is recommended to use a demo account for testing to fully understand how to use the indicator and apply proper risk management strategies.
CHANGELOG
v1.0: Initial release featuring integrated Price Action Index, Trend Strength Scoring, Wave Trend Oscillator, Gold Zone Compression Detection, and dual-type divergence recognition. Supports higher timeframe (HTF) synchronization, visual signal markers, and diversified parameter configurations.

Head & Shoulders Pattern (Zeiierman)█ Overview
The Head & Shoulders Pattern (Zeiierman) is an advanced pattern recognition tool that automatically detects and visualizes one of the most powerful reversal patterns in technical analysis — the classic Head & Shoulders and Inverse Head & Shoulders formations .
This indicator brings structure clarity directly onto the price chart, allowing traders to instantly spot potential major reversal zones without manually drawing or searching for patterns.
It doesn't just draw lines — it intelligently scans price action for symmetry, pivot behavior, and neckline structures — then projects realistic price targets based on the pattern's height.
⚪ In simple terms:
▸ Standard Head & Shoulders → Bearish Reversal Pattern
▸ Inverse Head & Shoulders → Bullish Reversal Pattern
▸ Target Projection → Estimated Move from Neckline Break
▸ Labels → Clear annotation of Left Shoulder, Head, and Right Shoulder
█ How It Works
The indicator combines multiple technical detection layers into a clean visual model:
⚪ Dynamic Pivot Engine
Automatically detects pivot highs and lows based on user-defined Period.
Longer Period = Broader, higher-confidence patterns
Shorter Period = Smaller, more frequent patterns
⚪ Pattern Detection Logic
Scans pivot structures in real-time to identify valid:
Bearish Head & Shoulders (H&S)
Bullish Inverse Head & Shoulders (iH&S)
Conditions include:
▸ Symmetry validation
▸ Head above (or below) Shoulders
▸ Neckline structure
▸ Minimum price conditions met
█ How to Use
⚪ Reversal Trading
Look for Head & Shoulders at the top of an uptrend
Look for Inverse Head & Shoulders at the bottom of a downtrend
⚪ What makes our tool truly unique is that it goes beyond the traditional textbook definition.
Our custom Head & Shoulders algorithm is built with flexibility and adaptability in mind. It dynamically responds to real-time price action, allowing it to detect valid patterns not only at major trend reversals — but also within trending environments.
That means you can spot Head & Shoulders formations at:
Consolidation zones
Trend continuation areas
Corrective phases within established trends
It doesn’t have to be the absolute top or bottom of a move — and that’s the real power of this tool. It adapts. It evolves. It finds structure where most indicators stay blind.
█ Common Real-World Stop Loss Strategies with Head & Shoulders Patterns
Not all Head & Shoulders patterns are created equal — and neither are the stop loss strategies used to trade them.
Depending on your trading style, risk tolerance, and market context — here are the 3 most common ways traders manage stop placement when trading Head & Shoulders (H&S) or Inverse Head & Shoulders (iH&S) patterns:
⚪ Conservative Stop Placement
Maximum Safety — Minimum Chance of Being Stopped Prematurely
Stop Placement:
Above the Head (Bearish H&S)
Below the Head (Bullish iH&S)
Pros: Safest approach. Provides maximum protection against false breakouts and noise.
Cons: Often results in very large stop losses, especially on bigger patterns or higher timeframes. Risk-to-Reward (RR) can be poor unless the target is far.
⚪ Aggressive Stop Placement
Tighter Risk — Faster Invalidations
Stop Placement:
Above the Right Shoulder (Bearish H&S)
Below the Right Shoulder (Bullish iH&S)
Pros: Smaller stop losses. Improved RR. Ideal for traders who want tighter control over risk.
Cons: Higher chance of getting stopped on retests or minor volatility around the neckline zone.
⚪ Neckline Reclaim Invalidation
Dynamic & Price-Action Based Exit
Stop Placement:
Exit the trade if price closes back above (bearish) or below (bullish) the neckline after breaking it.
Pros: Dynamic approach based on market behavior rather than static levels. Allows more flexibility.
Cons: Requires active trade management. Not suitable for fully automated or set-and-forget trading styles.
█ Why It's Useful
This is not a basic pattern drawing tool — it's a complete detection system built for traders who want to:
Automatically detect powerful reversal patterns
Avoid the subjectivity of manually drawing H&S structures
Trade with clear target projections
Identify high-probability reversal zones
Visually map structure shifts in real-time
█ Settings
Pivot Detection
Period → Number of bars used to scan for pivots (Higher = Bigger patterns)
Pattern Detection
Enable Bullish Head & Shoulders
Enable Bearish Head & Shoulders
Visualization
Customize Colors (Lines, Fills, Labels)
Enable/Disable Labels
Pattern Style: Closed / Open
Custom Label Colors
Target Projection
Enable/Disable Target Projection
Customize Target Colors
-----------------
Disclaimer
The content provided in my scripts, indicators, ideas, algorithms, and systems is for educational and informational purposes only. It does not constitute financial advice, investment recommendations, or a solicitation to buy or sell any financial instruments. I will not accept liability for any loss or damage, including without limitation any loss of profit, which may arise directly or indirectly from the use of or reliance on such information.
All investments involve risk, and the past performance of a security, industry, sector, market, financial product, trading strategy, backtest, or individual's trading does not guarantee future results or returns. Investors are fully responsible for any investment decisions they make. Such decisions should be based solely on an evaluation of their financial circumstances, investment objectives, risk tolerance, and liquidity needs.
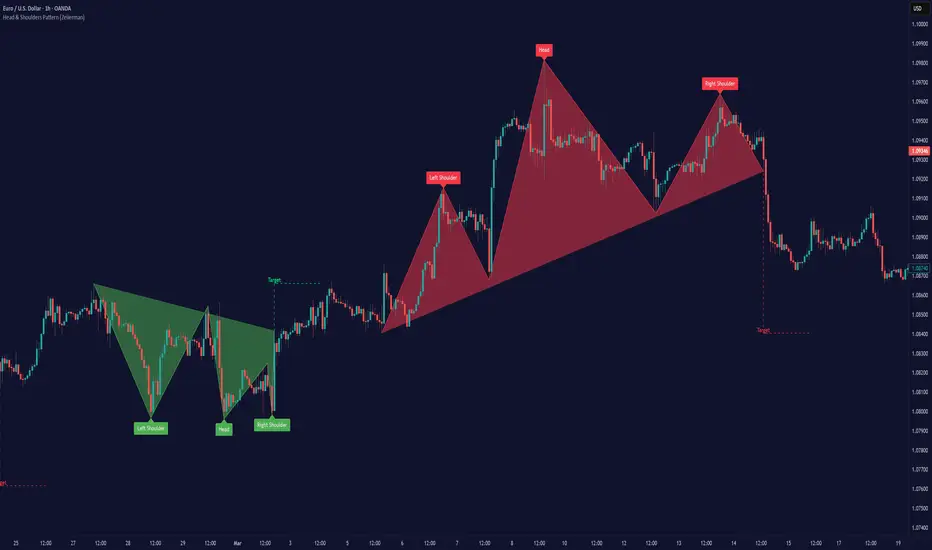
Multi-Timeframe Liquidity Zones V6 (Table)Multi-Timeframe Liquidity Zones V6 (Table) Indicator: Functionality and Uses
Overview: The Multi-Timeframe Liquidity Zones V6 (Table) indicator is a technical analysis tool that highlights key volume-based support and resistance levels across multiple timeframes. It leverages volume profile concepts – specifically the Point of Control (POC) and Value Area High/Low (VAH/VAL) – to identify “liquidity zones” where trading activity was heaviest . Unlike a standard single-timeframe volume profile, this indicator compiles data from several timeframes (e.g. monthly, weekly, daily, intraday) and displays the results in a convenient table format on the chart. The goal is to give traders a consolidated view of important price levels (derived from volume concentrations) across different horizons, helping them plan trades with a broader market perspective.
Purpose and Functionality of the Indicator
Multi-Timeframe Analysis: The primary objective of this indicator is to simplify multi-timeframe analysis of volume distribution. Rather than manually checking volume profiles on separate charts for each timeframe, the tool automatically calculates the key levels for each selected timeframe and presents them together. This includes higher-level perspectives (like monthly or weekly volume hotspots) alongside shorter-term levels (daily or hourly), ensuring that traders don’t miss significant zones from any timeframe . By offering a broader perspective on support and resistance levels, multi-timeframe tools help improve risk management and signal confirmation , and this indicator is designed to provide that volume-based perspective at a glance.
Table Format Display: Multi-Timeframe Liquidity Zones V6 (Table) specifically presents the information as a table (as opposed to plotting lines on the chart). Each row in the table typically corresponds to a timeframe (for example, Monthly, Weekly, Daily, 4H, 1H, 30M, 15M), and the columns list the calculated POC, VAH, VAL, and possibly the average volume for that timeframe’s look-back period. By structuring the data in a table, traders can quickly read off the exact price levels of these liquidity zones without having to visually trace lines. This format makes it easy to compare levels across timeframes or note where multiple timeframes’ levels cluster near the same price – a sign of especially strong support/resistance. The indicator uses a user-defined number of bars or length of history for each timeframe to calculate these values (so you can adjust how far back it looks to define the volume profile for each period).
Objective: In summary, the functionality is geared toward identifying high-liquidity price zones across multiple time scales and presenting them clearly. These high-liquidity zones often coincide with areas where price reacts (stalls, reverses, or accelerates) because a lot of trading activity (hence, orders and volume) took place there in the past. The indicator’s objective is to alert the trader to those areas in advance. It effectively answers questions like: “Where are the major volume concentration levels on the 1-hour, daily, and weekly charts right now?” and “Are there overlapping volume-based support/resistance levels from different timeframes around the current price?” By compiling this information, the indicator helps traders incorporate context from multiple timeframes in their decision-making, without needing to flip through numerous charts.
Identifying Liquidity Zones with POC, VAH, and VAL
Liquidity Zones Defined: In market terms, a “liquidity zone” is an area of the chart where a significant amount of trading occurred, meaning high liquidity (many buyers and sellers exchanged volume there). These zones often act as support or resistance because past heavy trading indicates consensus or interest around those price levels. This indicator identifies liquidity zones through volume profile analysis on each timeframe’s recent price action. Essentially, it looks at the distribution of trading volume at different prices over the specified period and finds the value area – the range of prices that encompassed the majority of that volume (commonly around 70% of the total volume ). Within that value area, it pinpoints the Point of Control (POC), which is the single price level that had the highest traded volume (the peak of the volume profile) . The upper and lower boundaries of that high-volume range are marked as Value Area High (VAH) and Value Area Low (VAL) respectively . Together, the VAH and VAL define the liquidity zone where the market spent most of its time and volume, and POC highlights the most traded price in that zone.
• Point of Control (POC): The POC is the price level with the greatest volume traded for the given period. It represents the price at which the most liquidity was exchanged – effectively the market’s “center of gravity” for that timeframe’s trading activity . The indicator calculates the POC for each selected timeframe by scanning the volume at each price; the price with maximum volume is flagged as that timeframe’s POC. In the table, the POC might be highlighted or listed as a key level (sometimes traders color-code it or mark it for emphasis). Because so many positions were opened or closed at the POC, it often serves as a strong support/resistance. For example, if price falls to a major POC from above, traders expect buyers may step in there (since it was a popular buy/sell level historically), potentially causing a bounce. Conversely, if price breaks through a POC decisively, it may signal a significant shift in market acceptance.
• Value Area High (VAH) and Low (VAL): The VAH and VAL are the price boundaries of the value area, which is typically defined to contain about 70% of the total traded volume for the period . In other words, between VAH and VAL is where the “bulk” of trading occurred, and outside this range is where relatively less volume traded. The indicator derives VAH/VAL by accumulating volume from the highest-volume price (POC) outward until ~70% of volume is covered (this is a common method for volume profile value area). VAH is the top of this high-volume region and VAL is the bottom. These levels are important because they often act like support/resistance boundaries: when price is inside the value area, it’s in a high-liquidity zone and tends to oscillate between VAH and VAL; when price moves above VAH or below VAL, it’s leaving the high-volume zone, which can indicate a potential trend or imbalance (price entering a lower-liquidity area where it might move faster until finding the next liquidity zone). Traders watch VAH/VAL for signs of rejection or acceptance: for instance, a price rally that falters at VAH suggests that level is acting as resistance (sellers defending that high-volume area), whereas if price pushes above VAH, it may continue until the next timeframe’s zone or until it finds new interest. The Multi-Timeframe Liquidity Zones V6 indicator gives the VAH and VAL for each timeframe, essentially mapping out the upper and lower bounds of key liquidity zones at those scales.
How the Indicator Identifies These: Under the hood, the indicator likely uses historical price and volume data for each timeframe’s lookback window. For each timeframe (say the last 20 weekly bars for a weekly profile, last 100 daily bars for a daily profile, etc.), it constructs a volume profile (a histogram of volume at each price). From that distribution, it finds the POC (highest volume bin) and calculates VAH/VAL around it. The output is a set of numbers (price levels) that mark where those zones lie. In practice, if using the Lines version of this indicator, those levels are drawn as horizontal lines on the chart and labeled by timeframe (e.g., a line at 1.2345 labeled “D POC” for Daily POC) . In the Table version, those values are instead listed in text form. Either way, the identification process is the same – it’s finding the high-volume price regions on each timeframe and calling them out. By doing this for multiple timeframes concurrently, the indicator reveals how these liquidity zones from different periods relate to each other. For example, you might discover that a daily-chart value area overlaps with a weekly-chart POC, creating a particularly strong zone of interest. This kind of insight is hard to get from a single timeframe analysis alone.
Volume Profile Data Across Multiple Timeframes
Multiple Timeframes in One View: One of the biggest advantages of this indicator is the ability to see volume profile information from various timeframes side by side. Traders often perform multiple timeframe analysis to get a fuller picture — for instance, checking monthly or weekly levels for long-term context while planning a trade on a 4-hour chart. This indicator automates that process for volume-based levels. The table will typically list each chosen timeframe (which could be preset or user-selected). For each timeframe, you get the POC, VAH, VAL, and possibly an average volume metric. The “average volume” likely refers to the average volume per bar or the average volume traded over the profile’s duration for that timeframe, which gives a sense of how significant that period’s activity is. For example, a weekly profile might show an average volume of say 500k per week, versus a daily profile average of 80k per day – indicating the scale of trading on weekly vs daily. High average volume on a timeframe means its liquidity zones were formed with a lot of participation, possibly making them more reliable support/resistance. By comparing these, traders can gauge which timeframes had unusually high or low activity recently. The table format makes such comparisons straightforward.
Identification of Confluence: Because all the data is presented together, traders can quickly spot confluence or overlaps between timeframes. If two different timeframes show liquidity zones at similar price levels, that price becomes extremely noteworthy. For instance, suppose the indicator shows: a 1-hour POC at 1.1300, a 4-hour VAL at 1.1280, and a daily VAL at 1.1290. These are all in a tight range – effectively indicating a multi-timeframe liquidity zone around 1.1280–1.1300. A trader seeing this cluster in the table will recognize that as a strong support area, since multiple profiles from intraday to daily all suggest heavy trading interest there. Similarly, overlaps of VAH (resistance zone) from different timeframes could signal a strong ceiling. The multi-timeframe view prevents a trader from, say, going long into a major weekly POC above, or shorting when there’s a huge monthly value-area low just below – situations where awareness of higher timeframe volume structure can make the difference between a good and bad trade.
User Customization: The indicator is flexible in that you can typically adjust which timeframes to include and how many bars to use for each timeframe’s calculation. For example, one might configure it to calculate monthly levels using the past 12 monthly bars (1 year of data), weekly levels using the past 20 weeks, daily using 100 days, etc., depending on preference. By tuning the “bars count” or period length , the trader can focus on recent liquidity zones or incorporate more history if desired. Shorter lookback might catch more recent shifts in volume distribution (important if the market structure changed recently), while longer lookback gives more established levels. This customization ensures the indicator’s output can be tailored to different trading styles (short-term vs swing vs long-term investing). Regardless of settings, the multi-timeframe table allows simultaneous visibility of the chosen timeframes’ volume landscape. This comprehensive view is the core strength: it consolidates data that normally requires flipping through multiple charts.
Using the Liquidity Zones Data for Trading Decisions
Traders can use the information from the MTF Liquidity Zones V6 (Table) indicator in several practical ways to enhance their decision-making:
• Identify Support and Resistance: Each liquidity zone acts as a potential support or resistance area. For example, if the table shows a daily VAH at a certain level above the current price, that level might serve as resistance if the price rallies up to it (since it marks the top of a high-volume region where sellers might step in). Conversely, a weekly VAL below current price could act as support on a dip. By noting these levels in the table, a trader planning an entry or exit can anticipate where the price might stall or reverse. Essentially, you get a map of high-interest price levels from different timeframes, which you can mark on your trading chart for guidance.
• Plan Entries and Exits Around Key Levels: Many traders incorporate volume profile levels into their strategies, for instance: buying near VAL (betting that the value area will hold and price will revert upward), or selling/shorting near VAH (expecting the top of value to hold as resistance), or trading breakouts when price moves outside the value area. With the multi-timeframe table, one can refine these tactics by also considering higher timeframe levels. Suppose you see that on the 1-hour chart the price is just above its 1H POC, but the table indicates that just slightly above, there’s also the daily POC. You might delay a long entry until price clears that daily POC, because that could be a stronger intraday barrier. Or if you intend to take profit on a long trade, you might choose a target just below a weekly VAH since price may struggle to climb past that on the first attempt. The indicator thus acts as a guide for precision in entry/exit decisions, aligning them with where liquidity is high.
• Gauge Trend Strength and Directional Bias: By observing where current price is relative to these volume zones, traders can infer certain market conditions. For instance, if price is trading above the VAH of multiple timeframes’ value areas, it suggests the market is in a more bullish or overextended territory (price accepted above prior value), whereas if price is below multiple VALs, it’s in bearish or undervalued territory relative to recent history. If the price stays around a POC, it indicates consolidation or equilibrium (market comfortable at that price). Traders can use this context for bias – e.g., if price is above the weekly VAH, you might lean bullish but watch for potential pullbacks to that VAH level (now a support). If price is below the monthly VAL, you might avoid longs until it re-enters that value area. In essence, the liquidity zones provide context of value vs. price: is price trading within the high-volume areas (implying range-bound behavior) or outside them (implying a breakout or trending move)? This can prevent chasing trades at poor locations.
• Combine with Other Indicators/Analysis: It’s generally advised to not use any single indicator in isolation, and this holds true here. The liquidity zones from this indicator are best used alongside price action or other technical signals for confirmation . For example, if a bullish candlestick reversal pattern forms right at a confluence of a 4H VAL and Daily POC, that’s a stronger buy signal than the pattern alone. Or if an oscillator shows overbought exactly as price hits a weekly VAH, it adds conviction to a possible short. The indicator’s table basically gives you a shortlist of critical price levels; you can then watch how price behaves at those levels (via candlesticks, order flow, etc.) to make the final trade decision. Traders might set alerts for when price approaches one of the listed levels, or they might drop down to a lower timeframe to fine-tune an entry once a key zone is reached. By integrating this volume-based insight with trend analysis, chart patterns, or momentum indicators, one can make more informed and high-probability decisions rather than trading in the dark.
• Risk Management and Stop Placement: High-liquidity zones can also inform stop-loss placement. Ideally, you want your stop on the other side of a strong support/resistance. If you go long near a VAL, you might place your stop just below the VAL (since a move beyond that suggests the high-volume zone didn’t hold). If you short near a VAH, a stop just above the VAH or POC could be logical. Moreover, if multiple timeframes show overlapping zones, a stop beyond all of them could be even safer (albeit at the cost of a wider stop). The indicator helps identify those spots. It also warns you of where not to put a stop – for example, placing a stop-loss right at a POC might be unwise because price could gravitate to that POC repeatedly (due to its magnetic effect as a high-volume price). Instead, a trader might choose a stop beyond the far side of the value area. By using the table’s information, you can align your risk management with areas of high liquidity, reducing the chance of being whipsawed by normal volatility around heavily traded levels .
Benefits of the Multi-Timeframe Liquidity Zones Indicator
Using the Multi-Timeframe Liquidity Zones V6 (Table) indicator offers several key benefits for traders, ultimately aiming to streamline analysis and improve decision quality:
• Consolidated Key Levels: It provides a clear, consolidated view of crucial volume-driven levels from multiple timeframes all at once . This saves time and ensures you always account for major support/resistance zones that come from higher or lower timeframe volume clusters. You won’t accidentally overlook a significant weekly level while focused on a 15-minute chart, for example.
• Enhanced Multi-Timeframe Insight: By aligning information from long-term and short-term periods, the indicator helps traders see the “bigger picture” while still operating on their preferred timeframe. This multi-scale awareness can improve trade timing and confidence. You’re effectively doing multi-timeframe analysis with volume profiles in an efficient manner, which can confirm or caution your trade ideas (e.g., a trend looks strong on the 1H, but the table shows a huge monthly VAH just overhead – a reason to be cautious or take profit early).
• Improved Decision Making and Precision: Knowing where liquidity zones lie allows for more precise entries, exits, and stop placements. Traders can make informed decisions such as waiting for a pullback to a value area before entering, or taking profits before price hits a major POC from a higher timeframe. These decisions are grounded in objectively important price levels, potentially leading to higher probability trades and better risk-reward setups. It essentially enhances your strategy by adding a layer of volume context – you’re trading with an awareness of where the market’s interest is heaviest.
• Volume-Based Confirmation: Price alone can sometimes be deceptive, but volume tells the true story of participation. The liquidity zones indicator provides volume-based confirmation of support/resistance. If a price level is identified by this tool, it’s because significant volume happened there – adding weight to that level’s importance. This can help filter out false support/resistance levels that aren’t backed by volume. In other words, it highlights high-quality levels that many traders (and possibly institutions) have shown interest in.
• Adaptable to Different Trading Styles: Whether one is a scalper looking at intraday (15M, 5M charts) or a swing trader focusing on daily/weekly, the indicator can be configured to those needs. You choose which timeframes and how much data to consider. This means the concept of liquidity zones can be applied universally – from spotting intraday pivot levels with volume, to seeing long-term value zones on an investment. The consistent methodology of POC/VAH/VAL across scales provides a common framework to analyze any market and timeframe.
• Informed Risk Management: As discussed, the knowledge of multi-timeframe volume zones aids in risk management. By placing stops beyond major liquidity areas or avoiding trades that run into strong volume walls, traders can reduce the likelihood of whipsaw losses. It’s an extra layer of defense to ensure your trade plan accounts for where the market has historically found lots of interest (hence likely friction). This level of informed planning can be the difference between a well-managed trade and an avoidable loss.
In conclusion, the Multi-Timeframe Liquidity Zones V6 (Table) indicator serves as a powerful analytical aid, giving traders a structured view of where price is likely to encounter support or resistance based on volume concentrations across timeframes. Its functionality centers on identifying those liquidity zones (via POC, VAH, VAL) and presenting them in an easy-to-read format, while its ultimate purpose is to help traders make more informed decisions. By integrating this tool into their workflow, traders can more confidently navigate price action, knowing the objective volume-based landmarks that lie ahead. Remember that while these volume levels often coincide with strong S/R zones, it’s best to use them in conjunction with other technical or fundamental analysis for confirmation . When used appropriately, the indicator can streamline multi-timeframe analysis and enhance your overall trading strategy , giving you an edge in identifying where the market’s liquidity (and opportunity) resides.
Supertrend ProSupertrend Pro - Multi-Trend Analysis and Trading Signal Filtering
OVERVIEW
This indicator calculates trend direction based on the Supertrend indicator and integrates dual-trend analysis, upper and lower trend bands, trading signal alerts, moving average filtering, and the EMA 200 bull-bear division line to provide traders with more precise trend identification and trading signals.
It is suitable for trend trading, short-term trading, and swing trading, effectively filtering market noise and improving trade accuracy.
IMPLEMENTATION PRINCIPLES
1. Primary Trend: Uses the Supertrend indicator to calculate major trend direction, suitable for long-term trend assessment.
2. Secondary Trend: Detects short-term trend changes, capturing finer market movements.
3. Upper and Lower Trend Bands: Utilizes ATR (Average True Range) to calculate dynamic trend channels, assisting in trend strength assessment.
4. Trading Signal Alerts: Provides buy/sell signals when trends reverse, with optional moving average filtering to reduce false signals.
5. Moving Average Filtering: Supports multiple MA types, such as EMA, SMA, HMA, McGinley, helping to filter market noise.
6. EMA 200 Bull-Bear Division Line: Combines ATR-based trend buffer zones to distinguish between long-term bull and bear markets, enhancing trend accuracy.
KEY FEATURES
1. Dual-Trend Analysis
• Primary trend is suitable for long-term trend tracking, reducing interference from short-term fluctuations.
• Secondary trend is ideal for short-term trading opportunities, allowing faster identification of market turning points.
• By combining both, traders can follow the major trend direction while using the secondary trend for optimized entry points, improving trade success rates.
2. Upper and Lower Trend Bands
• ATR-based dynamic bands adjust to market volatility, avoiding the limitations of fixed support and resistance levels.
• Trend confirmation: When the price reaches the upper or lower band, traders can determine whether the market is overheated or oversold, aiding trading decisions.
• Combining primary and secondary trend bands provides clearer trend validation, reducing false signals.
3. Trading Signal Alerts
• Automatic buy/sell signal alerts when the trend reverses, eliminating the need for manual trend assessment.
• Moving average filtering improves signal reliability, reducing false signals.
• Supports various signal markers (circles/arrows/labels) to help traders clearly visualize entry points.
4. Moving Average Filtering
• Supports multiple moving average types (SMA, EMA, HMA, WMA, McGinley, etc.), adapting to different trading styles.
• Prevents counter-trend trading:
· Long entries only when the price is above the MA filter.
· Short entries only when the price is below the MA filter.
• Customizable MA periods to suit different market conditions and prevent excessive signal noise.
5. Trading Reference Lines
• Short-term trend: HMA 25 serves as an entry reference line. Waiting for MA color changes before placing trades can improve stability.
• Long-term trend: EMA 200 as the bull-bear division line helps traders distinguish between long-term bullish and bearish trends, avoiding counter-trend trades.
• Dynamic buffer adjustment: Uses ATR-based volatility buffers to reduce false signals and enhance trend detection accuracy.
• Color-coded trend identification:
· Aqua (Bull Market): Price is above the buffer zone.
· Fuchsia (Bear Market): Price is below the buffer zone.
· White: Price is within the buffer zone, indicating an unclear market direction.
USAGE GUIDELINES
1. Applicable Markets
• Suitable for stocks, futures, cryptocurrencies, and forex
• Supports short-term trading, trend trading, and swing trading
2. Recommended Timeframes
• Short-term traders can use 5m, 15m, and 1H timeframes, leveraging secondary trend signals for quick market entries.
• Trend traders can use 4H and daily timeframes, relying on primary trend signals to assess major trends.
• Long-term investors can use the EMA 200 bull-bear division line to determine macro trend direction and avoid counter-trend trades.
3. Trading Strategy
• Long Entry:
The primary trend is bullish (Green).
The secondary trend triggers a buy signal (Long).
• Short Entry:
· The primary trend is bearish (Red).
· The secondary trend triggers a sell signal (Short).
• Enable Moving Average Filtering:
· Only enter long trades when the price is above the MA filter.
· Only enter short trades when the price is below the MA filter.
• Use EMA 200 for Market Direction:
· If the price is above EMA 200 + buffer, the market is in a bullish trend → favor long trades.
· If the price is below EMA 200 - buffer, the market is in a bearish trend → favor short trades.
• Market Volatility Considerations:
· Short timeframes (1m, 5m) may produce more noise, reducing signal reliability.
· Higher timeframes (1H, 4H, Daily) provide more stable trend signals but may miss some short-term trade opportunities.
RISK DISCLAIMER
• This indicator calculates trend direction based on historical data and cannot guarantee future market performance. When using this indicator for trading, always combine it with other technical analysis tools, fundamental analysis, and personal trading experience for comprehensive decision-making.
• Market conditions are uncertain, and trend signals may result in false positives or lag. Traders should avoid over-reliance on indicator signals and implement stop-loss strategies and risk management techniques to reduce potential losses.
• Leverage trading carries high risks and may result in rapid capital loss. If using this indicator in leveraged markets (such as futures, forex, or cryptocurrency derivatives), exercise caution, manage risks properly, and set reasonable stop-loss/take-profit levels to protect funds.
• All trading decisions are the sole responsibility of the trader. The developer is not liable for any trading losses. This indicator is for technical analysis reference only and does not constitute investment advice.
• Before live trading, it is recommended to use a demo account for testing to fully understand how to use the indicator and apply proper risk management strategies.
CHANGELOG
• v1.0: Initial release with a dual-trend system, dynamic upper and lower trend bands, trading signal alerts, moving average filtering, HMA trading reference line, and EMA 200 bull-bear division.

Wick Size in USD with 10-Bar AverageWick Size in USD with 10-Bar Average
Version: 1.0
Author: QCodeTrader
🔍 Overview
This indicator converts the price wicks of your candlestick chart into USD values based on ticks, providing both raw and smoothed data via a 10-bar simple moving average. It helps traders visualize the monetary impact of price extremes, making it easier to assess volatility, potential risk, and plan appropriate stop loss levels.
⚙️ Key Features
Tick-Based Calculation:
Converts wick sizes into ticks (using a fixed tick size of 0.01, typical for stocks) and then into USD using a customizable tick value.
10-Bar Moving Average:
Smooths out the wick values over the last 10 bars, giving you a clearer view of average wick behavior.
Bullish/Bearish Visual Cues:
The chart background automatically highlights bullish candles in green and bearish candles in red for quick visual assessment.
Stop Loss Optimization:
The indicator highlights long wick sizes, which can help you set more accurate stop loss levels. Even when the price moves in your favor, long wicks may indicate potential reversals—allowing you to account for this risk when planning your stop losses.
User-Friendly Customization:
Easily adjust the USD value per tick through the settings to tailor the indicator to your specific instrument.
📊 How It Works
Wick Calculation:
The indicator calculates the upper and lower wicks by measuring the distance between the candle’s high/low and its body (open/close).
Conversion to Ticks & USD:
These wick sizes are first converted from price points to ticks (dividing by a fixed tick size of 0.01) and then multiplied by the user-defined tick value to convert the measurement into USD.
Smoothing Data:
A 10-bar simple moving average is computed for both the upper and lower wick values, providing smoothed data that helps identify trends and deviations.
Visual Representation:
Columns display the raw wick sizes in USD.
Lines indicate the 10-bar moving averages.
Background Color shifts between green (bullish) and red (bearish) based on candle type.
⚡ How to Use
Add the Indicator:
Apply it to your chart to begin visualizing wick sizes in monetary terms.
Customize Settings:
Adjust the Tick Value in USD in the settings to match your instrument’s tick value.
(Note: The tick size is fixed at 0.01, which is standard for many stocks.)
Optimize Your Stop Loss:
Analyze the raw and averaged wick values to understand volatility. Long wicks—even when the price moves in your favor—may indicate potential reversals. This insight can help you set more accurate stop loss levels to protect your gains.
Analyze:
Use the indicator’s data to gauge market volatility and assess the significance of price movements, aiding in more informed trading decisions.
This indicator is perfect for traders looking to understand the impact of extreme price movements in monetary terms, optimize stop loss levels, and effectively manage risk across stocks and other instruments with similar tick structures.

Supertrend pro+ (Adaptive ATR) Supertrend Pro+ (Adaptive ATR) - Param Approach
By SKP
Overview
This advanced Supertrend Pro+ strategy improves on the classic Supertrend indicator by integrating an Adaptive ATR, ensuring dynamic volatility adjustments for more accurate trend detection. This strategy filters out false signals using ADX trend strength validation and volume confirmation, making it a powerful tool for trend-following traders.
Key Features
✔ Adaptive ATR Calculation - Dynamically adjusts to market volatility for more reliable Supertrend signals.
✔ ADX Trend Filter - Ensures trades occur only in strong trending markets, avoiding false breakouts.
✔ Volume Confirmation - Prevents trading in low-liquidity conditions by verifying volume strength.
✔ Multi-Timeframe Analysis - Displays Supertrend trends from different timeframes for enhanced trade confidence.
✔ Trailing Stop & Take Profit Options - Allows flexible risk management with stop-loss and profit-targeting mechanisms.
✔ Custom Alerts for Trade Signals - Alerts trigger on confirmed Supertrend buy/sell signals and potential trend shifts.
✔ Max Drawdown Protection - Automatically closes trades if equity drops beyond a set percentage, preventing excessive losses.
How It Works
Adaptive ATR Calculation
Instead of using a fixed ATR, this strategy calculates an adaptive ATR based on a longer-term ATR baseline.
If volatility increases, the ATR expands dynamically, ensuring stop-losses and Supertrend calculations adjust accordingly.
Supertrend Confirmation
Uses an enhanced Supertrend algorithm with adaptive ATR to determine trend direction.
If price crosses above the trendline, it signals a bullish reversal (Buy Signal).
If price crosses below the trendline, it signals a bearish reversal (Sell Signal).
ADX Trend Strength Filter
Trades are only taken when ADX is above the threshold, ensuring entry in strong trending markets.
Volume Confirmation
Uses a relative volume filter to ensure sufficient liquidity before entering trades.
Helps avoid false breakouts in low-volume conditions.
Risk Management
Trailing Stop Loss - Automatically moves the stop as price moves in favor of the trade.
Manual Stop Loss & Take Profit - Allows precise percentage-based exit points.
Max Drawdown Protection - Closes all trades if equity falls below a set threshold, reducing risk.
Multi-Timeframe Supertrend Table
Displays Supertrend signals across different timeframes (1 min, 5 min, 15 min, 1 hour, Daily)
Helps traders align their entries with higher timeframe trends for better accuracy.
Custom Alerts
Alerts notify when a new buy/sell signal appears.
Extra early warning alerts indicate potential trade setups before confirmation.
How to Use
📌 For trend-following traders:
Focus on entries in the direction of the higher timeframes.
Only enter when ADX is trending and volume confirms liquidity.
📌 For scalpers:
Use shorter timeframes (1m, 5m, 15m) for quick trades.
Adjust the ATR multiplier and Adaptive ATR sensitivity for tighter stops.
📌 For swing traders:
Use longer timeframes (1H, Daily) for more stable trends.
Enable trailing stop loss to lock in profits as the trend progresses.
Inputs & Customization
ATR Period & Adaptive ATR Sensitivity
Supertrend Multiplier
ADX Filter & Threshold
Volume Confirmation Settings
Stop Loss & Take Profit Options
Multi-Timeframe Supertrend Display
Custom Alerts

[3Commas] HA & MAHA & MA
🔷What it does: This tool is designed to test a trend-following strategy using Heikin Ashi candles and moving averages. It enters trades after pullbacks, aiming to let profits run once the risk-to-reward ratio reaches 1:1 while securing the position.
🔷Who is it for: It is ideal for traders looking to compare final results using fixed versus dynamic take profits by adjusting parameters and trade direction—a concept applicable to most trading strategies.
🔷How does it work: We use moving averages to define the market trend, then wait for opposite Heikin Ashi candles to form against it. Once these candles reverse in favor of the trend, we enter the trade, using the last swing created by the pullback as the stop loss. By applying the breakeven ratio, we protect the trade and let it run, using the slower moving average as a trailing stop.
A buy signal is generated when:
The previous candle is bearish (ha_bear ), indicating a pullback.
The fast moving average (ma1) is above the slow moving average (ma2), confirming an uptrend.
The current candle is bullish (ha_bull), showing trend continuation.
The Heikin Ashi close is above the fast moving average (ma1), reinforcing the bullish bias.
The real price close is above the open (close > open), ensuring bullish momentum in actual price data.
The signal is confirmed on the closed candle (barstate.isconfirmed) to avoid premature signals.
dir is undefined (na(dir)), preventing repeated signals in the same direction.
A sell signal is generated when:
The previous candle is bullish (ha_bull ), indicating a temporary upward move before a potential reversal.
The fast moving average (ma1) is below the slow moving average (ma2), confirming a downtrend.
The current candle is bearish (ha_bear), showing trend continuation to the downside.
The Heikin Ashi close is below the fast moving average (ma1), reinforcing bearish pressure.
The real price close is below the open (close < open), confirming bearish momentum in actual price data.
The signal is confirmed after the candle closes (barstate.isconfirmed), avoiding premature entries.
dir is undefined (na(dir)), preventing consecutive signals in the same direction.
In simple terms, this setup looks for trend continuation after a pullback, confirming entries with both Heikin Ashi and real price action, supported by moving average alignment to avoid false signals.
If the price reaches a 1:1 risk-to-reward ratio, the stop will be moved to the entry point. However, if the slow moving average surpasses this level, it will become the new exit point, acting as a trailing stop
🔷Why It’s Unique
Easily visualizes the benefits of using risk-to-reward ratios when trading instead of fixed percentages.
Provides a simple and straightforward approach to trading, embracing the "keep it simple" concept.
Offers clear visualization of DCA Bot entry and exit points based on user preferences.
Includes an option to review the message format before sending signals to bots, with compatibility for multi-pair and futures contract pairs.
🔷 Considerations Before Using the Indicator
⚠️Very important: The indicator must be used on charts with real price data, such as Japanese candlesticks, line charts, etc. Do not use it on Heikin Ashi charts, as this may lead to unrealistic results.
🔸Since this is a trend-following strategy, use it on timeframes above 4 hours, where market noise is reduced and trends are clearer. Also, carefully review the statistics before using it, focusing on pairs that tend to have long periods of well-defined trends.
🔸Disadvantages:
False Signals in Ranges: Consolidating markets can generate unreliable signals.
Lagging Indicator: Being based on moving averages, it may react late to sudden price movements.
🔸Advantages:
Trend Focused: Simplifies the identification of trending markets.
Noise Reduction: Uses Heikin Ashi candles to identify trend continuation after pullbacks.
Broad Applicability: Suitable for forex, crypto, stocks, and commodities.
🔸The strategy provides a systematic way to analyze markets but does not guarantee successful outcomes. Use it as an additional tool rather than relying solely on an automated system.
Trading results depend on various factors, including market conditions, trader discipline, and risk management. Past performance does not ensure future success, so always approach the market cautiously.
🔸Risk Management: Define stop-loss levels, position sizes, and profit targets before entering any trade. Be prepared for potential losses and ensure your approach aligns with your overall trading plan.
🔷 STRATEGY PROPERTIES
Symbol: BINANCE:BTCUSDT (Spot).
Timeframe: 4h.
Test Period: All historical data available.
Initial Capital: 10000 USDT.
Order Size per Trade: 1% of Capital, you can use a higher value e.g. 5%, be cautious that the Max Drawdown does not exceed 10%, as it would indicate a very risky trading approach.
Commission: Binance commission 0.1%, adjust according to the exchange being used, lower numbers will generate unrealistic results. By using low values e.g. 5%, it allows us to adapt over time and check the functioning of the strategy.
Slippage: 5 ticks, for pairs with low liquidity or very large orders, this number should be increased as the order may not be filled at the desired level.
Margin for Long and Short Positions: 100%.
Indicator Settings: Default Configuration.
MA1 Length: 9.
MA2 Length: 18.
MA Calculations: EMA.
Take Profit Ratio: Disable. Ratio 1:4.
Breakeven Ratio: Enable, Ratio 1:1.
Strategy: Long & Short.
🔷 STRATEGY RESULTS
⚠️Remember, past results do not guarantee future performance.
Net Profit: +324.88 USDT (+3.25%).
Max Drawdown: -81.18 USDT (-0.78%).
Total Closed Trades: 672.
Percent Profitable: 35.57%.
Profit Factor: 1.347.
Average Trade: +0.48 USDT (+0.48%).
Average # Bars in Trades: 13.
🔷 HOW TO USE
🔸 Adjust Settings:
The default values—MA1 (9) and MA2 (18) with EMA calculation—generally work well. However, you can increase these values, such as 20 and 40, to better identify stronger trends.
🔸 Choose a Symbol that Typically Trends:
Select an asset that tends to form clear trends. Keep in mind that the Strategy Tester results may show poor performance for certain assets, making them less suitable for sending signals to bots.
🔸 Experiment with Ratios:
Test different take profit and breakeven ratios to compare various scenarios—especially to observe how the strategy performs when only the trade is protected.
🔸This is an example of how protecting the trade works: once the price moves in favor of the position with a 1:1 risk-to-reward ratio, the stop loss is moved to the entry price. If the Slow MA surpasses this level, it will act as a trailing stop, aiming to follow the trend and maximize potential gains.
🔸In contrast, in this example, for the same trade, if we set a take profit at a 1:3 risk-to-reward ratio—which is generally considered a good risk-reward relationship—we can see how a significant portion of the upward move is left on the table.
🔸Results Review:
It is important to check the Max Drawdown. This value should ideally not exceed 10% of your capital. Consider adjusting the trade size to ensure this threshold is not surpassed.
Remember to include the correct values for commission and slippage according to the symbol and exchange where you are conducting the tests. Otherwise, the results will not be realistic.
If you are satisfied with the results, you may consider automating your trades. However, it is strongly recommended to use a small amount of capital or a demo account to test proper execution before committing real funds.
🔸Create alerts to trigger the DCA Bot:
Verify Messages: Ensure the message matches the one specified by the DCA Bot.
Multi-Pair Configuration: For multi-pair setups, enable the option to add the symbol in the correct format.
Signal Settings: Enable whether you want to receive long or short signals (Entry | TP | SL), copy and paste the the messages for the DCA Bots configured.
Alert Setup:
When creating an alert, set the condition to the indicator and choose "alert() function call only.
Enter any desired Alert Name.
Open the Notifications tab, enable Webhook URL, and paste the Webhook URL.
For more details, refer to the section: "How to use TradingView Custom Signals".
Finalize Alerts: Click Create, you're done! Alerts will now be sent automatically in the correct format.
🔷 INDICATOR SETTINGS
MA 1: Fast MA Length
MA 2: Slow MA Length
MA Calc: MA's Calculations (SMA,EMA, RMA,WMA)
TP Ratio: This is the take profit ratio relative to the stop loss, where the trade will be closed in profit.
BE Ratio: This is the breakeven ratio relative to the stop loss, where the stop loss will be updated to breakeven or if the MA2 is greater than this level.
Strategy: Order Type direction in which trades are executed.
Use Custom Test Period: When enabled signals only works in the selected time window. If disabled it will use all historical data available on the chart.
Test Start and End: Once the Custom Test Period is enabled, here you select the start and end date that you want to analyze.
Check Messages: Enable the table to review the messages to be sent to the bot.
Entry | TP | SL: Enable this options to send Buy Entry, Take Profit (TP), and Stop Loss (SL) signals.
Deal Entry and Deal Exit : Copy and paste the message for the deal start signal and close order at Market Price of the DCA Bot. This is the message that will be sent with the alert to the Bot, you must verify that it is the same as the bot so that it can process properly so that it executes and starts the trade.
DCA Bot Multi-Pair: You must activate it if you want to use the signals in a DCA Bot Multi-pair in the text box you must enter (using the correct format) the symbol in which you are creating the alert, you can check the format of each symbol when you create the bot.
👨🏻💻💭 We hope this tool helps enhance your trading. Your feedback is invaluable, so feel free to share any suggestions for improvements or new features you'd like to see implemented.
__
The information and publications within the 3Commas TradingView account are not meant to be and do not constitute financial, investment, trading, or other types of advice or recommendations supplied or endorsed by 3Commas and any of the parties acting on behalf of 3Commas, including its employees, contractors, ambassadors, etc.

Enhanced Bollinger Bands Strategy with SL/TP// Title: Enhanced Bollinger Bands Strategy with SL/TP
// Description:
// This strategy is based on the classic Bollinger Bands indicator and incorporates Stop Loss (SL) and Take Profit (TP) levels for automated trading. It identifies potential long and short entry points based on price crossing the lower and upper Bollinger Bands, respectively. The strategy allows users to customize several parameters to suit different market conditions and risk tolerances.
// Key Features:
// * **Bollinger Bands:** Uses Simple Moving Average (SMA) as the basis and calculates upper and lower bands based on a user-defined standard deviation multiplier.
// * **Customizable Parameters:** Offers extensive customization, including SMA length, standard deviation multiplier, Stop Loss (SL) in pips, and Take Profit (TP) in pips.
// * **Long/Short Position Control:** Allows users to independently enable or disable long and short positions.
// * **Stop Loss and Take Profit:** Implements Stop Loss and Take Profit levels based on pip values to manage risk and secure profits. Entry prices are set to the band levels on signals.
// * **Visualizations:** Provides options to display Bollinger Bands and entry signals on the chart for easy analysis.
// Strategy Logic:
// 1. **Bollinger Bands Calculation:** The strategy calculates the Bollinger Bands using the specified SMA length and standard deviation multiplier.
// 2. **Entry Conditions:**
// * **Long Entry:** Enters a long position when the closing price crosses above the lower Bollinger Band and the `Enable Long Positions` setting is enabled.
// * **Short Entry:** Enters a short position when the closing price crosses below the upper Bollinger Band and the `Enable Short Positions` setting is enabled.
// 3. **Exit Conditions:**
// * **Stop Loss:** Exits the position if the price reaches the Stop Loss level, calculated based on the input `Stop Loss (Pips)`.
// * **Take Profit:** Exits the position if the price reaches the Take Profit level, calculated based on the input `Take Profit (Pips)`.
// Input Parameters:
// * **SMA Length (length):** The length of the Simple Moving Average used to calculate the Bollinger Bands (default: 20).
// * **Standard Deviation Multiplier (mult):** The multiplier applied to the standard deviation to determine the width of the Bollinger Bands (default: 2.0).
// * **Enable Long Positions (enableLong):** A boolean value to enable or disable long positions (default: true).
// * **Enable Short Positions (enableShort):** A boolean value to enable or disable short positions (default: true).
// * **Pip Value (pipValue):** The value of a pip for the traded instrument. This is crucial for accurate Stop Loss and Take Profit calculations (default: 0.0001 for most currency pairs). **Important: Adjust this value to match the specific instrument you are trading.**
// * **Stop Loss (Pips) (slPips):** The Stop Loss level in pips (default: 10).
// * **Take Profit (Pips) (tpPips):** The Take Profit level in pips (default: 20).
// * **Show Bollinger Bands (showBands):** A boolean value to show or hide the Bollinger Bands on the chart (default: true).
// * **Show Entry Signals (showSignals):** A boolean value to show or hide entry signals on the chart (default: true).
// How to Use:
// 1. Add the strategy to your TradingView chart.
// 2. Adjust the input parameters to optimize the strategy for your chosen instrument and timeframe. Pay close attention to the `Pip Value`.
// 3. Backtest the strategy over different periods to evaluate its performance.
// 4. Use the `Enable Long Positions` and `Enable Short Positions` settings to customize the strategy for specific market conditions (e.g., only long positions in an uptrend).
// Important Notes and Disclaimers:
// * **Backtesting Results:** Past performance is not indicative of future results. Backtesting results can be affected by various factors, including market volatility, slippage, and transaction costs.
// * **Risk Management:** This strategy is provided for informational and educational purposes only and should not be considered financial advice. Always use proper risk management techniques when trading. Adjust Stop Loss and Take Profit levels according to your risk tolerance.
// * **Slippage:** The strategy takes into account slippage by specifying a slippage parameter on the `strategy` declaration. However, real-world slippage may vary.
// * **Market Conditions:** The performance of this strategy can vary significantly depending on market conditions. It may perform well in trending markets but poorly in ranging or choppy markets.
// * **Pip Value Accuracy:** **Ensure the `Pip Value` is correctly set for the specific instrument you are trading. Incorrect pip value will result in incorrect stop loss and take profit placement.** This is critical.
// * **Broker Compatibility:** The strategy's performance may vary depending on your broker's execution policies and fees.
// * **Disclaimer:** I am not a financial advisor, and this script is not financial advice. Use this strategy at your own risk. I am not responsible for any losses incurred while using this strategy.

Briss Thorn XtremeStrategy Description: Briss Thorn Xtreme
The Briss Thorn Xtreme is an innovative trading strategy designed to identify and capitalize on opportunities in the forex market through advanced technical analysis and dynamic risk management. This strategy combines calculations based on RSI and ATR with time and day filters, providing customized signals and real-time alerts via Discord. Ideal for traders seeking a structured and highly customizable methodology, Briss Thorn Xtreme integrates enhanced visual tools for efficient trade management.
Key Features:
RSI and ATR-Based Signals: Utilizes smoothed RSI and ATR calculations to identify trends and measure volatility, allowing for more precise detection of buy and sell opportunities.
Dynamic Stop-Loss (SL) and Take-Profit (TP) Levels: Automatically calculates SL and TP levels based on market volatility, dynamically adjusting to optimize risk management.
Advanced Discord Integration: Sends detailed alerts to your Discord channel, including information such as the asset, signal time, entry price, and SL/TP levels, facilitating real-time decision-making.
Complete Customization: Allows users to adjust key parameters such as RSI periods, smoothing factors, liquidity thresholds, trading schedules, and operation days, adapting to different trading styles and market conditions.
Enhanced Chart Visualization: Includes visual elements like candle color changes based on trend, colored boxes for SL and TP, and a summary table of recent trades, enabling quick market interpretation.
Day and Time Operation Filters: Enables selection of specific days of the week and time slots during which signals are generated, optimizing market exposure and avoiding periods of low liquidity or unwanted high volatility.
Trade Summary: Displays a summary of the last three trades directly on the chart, indicating whether TP or SL was reached, aiding in strategy performance evaluation.
Customizable Alert Messages: Allows customization of messages sent to Discord for buy and sell signals, tailoring them to your specific preferences and requirements.
Additional Visual Tools: Highlights the operational range on the chart during permitted trading hours and colors candles based on the current trend (bullish, bearish, or neutral), enhancing visibility and decision-making.
How the Strategy Works:
Technical Indicators Calculation:
- RSI (Relative Strength Index) : Calculates RSI with a defined period and smooths it using an Exponential Moving Average (EMA) to obtain a more stable and reliable signal.
- ATR (Average True Range) : Calculates ATR adjusted by a rapid liquidity factor to measure the current market volatility, thereby determining the strength of the trend.
Generating Buy and Sell Signals:
- Buy Signal: A buy signal is generated when the liquidity index surpasses the short liquidity level, indicating potential accumulation and an upward trend.
- Sell Signal: A sell signal is generated when the liquidity index falls below the long liquidity level, indicating potential distribution and a downward trend.
- Operation Conditions: Signals are only generated on selected days and times, avoiding periods of low liquidity or unwanted high volatility.
Dynamic SL and TP Levels Calculation:
- Stop-Loss (SL) and Take-Profit (TP): SL and TP levels are calculated based on the entry price and a defined number of ticks, automatically adjusting to market volatility to optimize risk management.
- SL and TP Visualization: Colored boxes are drawn on the chart for a clear visual reference of SL and TP levels, facilitating trade management.
Automatic Execution and Alerts:
- Order Execution: Upon signal generation, the strategy automatically executes a market order (buy or sell).
- Discord Alerts: Detailed alerts are sent to the configured Discord channel, providing essential information for swift decision-making, including asset, signal time, entry price, current volatility (ATR), and trend direction.
Trade Management and Monitoring:
- Trade Summary: A table on the chart displays a summary of the last three trades (Today, Yesterday, Day Before Yesterday), indicating whether TP or SL was reached, allowing real-time performance evaluation.
- Automatic Trade Closure: The strategy automatically closes trades upon reaching the established SL or TP levels, ensuring efficient risk management and preventing excessive losses.
Additional Visualization:
- Candle Coloring by Trend: Candles are colored based on the current trend (bullish, bearish, or neutral), facilitating quick identification of market direction.
- Operational Range Highlighting: The chart background is colored during permitted trading hours, highlighting active periods of the strategy and enhancing trade visibility.
---
Strategy Properties (Important)
This backtest is conducted on M17 EURUSD using the following backtesting properties:
Initial Capital: $1000
Order Size: 1% of capital
Commission: $0.20 per order
Slippage: 1 tick
Pyramiding: 1 order
Price Verification for Limit Orders: 0 ticks
Recalculate on Order Execution: Enabled
Recalculate on Every Tick: Enabled
Recalculate After Order Execution: Enabled
Bar Magnifier for Backtesting Precision: Enabled
These properties ensure a realistic preview of the backtesting system. Note that default properties may vary for different reasons:
Order Size: It is essential to calculate the contract size according to the traded asset and desired risk level.
Commission and Slippage: These costs may vary depending on the market and instrument; there is no default value that guarantees realistic results.
All users are strongly recommended to adjust the properties within the script settings to align them with their trading accounts and platforms, ensuring that strategy results are realistic.
---
Backtesting Results:
- Net Profit: $327.90 (32.79%)
- Total Closed Trades: 162
- Profit Percentage: 35.80%
- Profit Factor: 1.298
- Maximum Drawdown: $146.70 (10.27%)
- Average per Trade: $2.02 (0.02%)
- Average Bars per Trade: 22
These results were obtained under the mentioned conditions and properties, providing an overview of the strategy's historical performance.
---
Interpretation of Results:
- The strategy has demonstrated profitability over the analyzed period, albeit with a success rate of 32.79%, indicating that success depends on a favorable risk-reward ratio.
- The profit factor of 1.298 suggests that total gains exceed total losses by this proportion.
- It is crucial to consider the maximum drawdown of 10.27% when evaluating the strategy's suitability to your risk tolerance.
---
Risk Warning:
Trading with leveraged financial instruments involves a high level of risk and may not be suitable for all investors. Before deciding to trade, you should carefully consider your investment objectives, level of experience, and risk tolerance. Past performance does not guarantee future results. It is essential to perform additional testing and adjust the strategy according to your needs.
---
What Makes This Strategy Original?
Unique RSI and Liquidity Focus: Unlike conventional strategies, Briss Thorn Xtreme focuses on combining RSI analysis with liquidity parameters to reflect institutional activity and macroeconomic events that may influence the market.
Advanced Technological Integration: The combination of automatic execution and customized alerts via Discord provides an efficient and modern tool for active traders.
Customization and Adaptability: The wide range of adjustable parameters allows the strategy to adapt to different assets, time zones, and trading styles, offering flexibility and complete user control.
Enhanced Visual Tools: Integrated visual elements, such as candle coloring, SL/TP boxes, and summary tables, facilitate quick market interpretation and informed decision-making.
---
Additional Considerations
Continuous Testing and Optimization: Users are advised to perform additional backtests and optimize parameters based on their own observations and requirements.
Complementary Analysis: Use this strategy in conjunction with other indicators and fundamental analysis tools to reinforce decision-making and confirm generated signals.
Rigorous Risk Management: Ensure that SL and TP levels, as well as position sizes, are aligned with your risk management plan to avoid excessive losses.
Updates and Support: I am committed to providing updates and improvements based on community feedback. For inquiries or suggestions, feel free to contact me.
---
Example Configuration
Assuming you want to use the strategy with the following parameters:
Discord Webhook: Your unique Discord Webhook
RSI Period: 6
RSI Smoothing Factor: 5
Rapid Liquidity Factor: 5
Liquidity Threshold: 5
SL Ticks: 100
TP Ticks: 250
SL/TP Box Width: 25 bars
Trading Days: Monday, Tuesday, Wednesday, Thursday, Friday
Trading Hours: Start at 8:00, End at 11:00
Simulated Initial Capital: $1000
Risk per Trade in Simulation: 1% of capital
Slippage and Commissions in Simulation: 1 tick slippage and $0.20 commission per trade
---
Conclusion
The Briss Thorn Xtreme strategy offers an innovative approach by combining advanced technical analysis with dynamic risk management and modern technological tools. Its original and adaptable design makes it a valuable tool for traders looking to diversify their methods and capitalize on opportunities based on less conventional patterns. Ready for immediate implementation in TradingView, this strategy can enhance your trading arsenal and contribute to a more informed and structured approach in your operations.
---
Final Disclaimer:
Financial markets are volatile and can present significant risks. This strategy should be used as part of a comprehensive trading approach and does not guarantee positive results. It is always advisable to consult with a professional financial advisor before making investment decisions.
