OA - PowerZones Support And ResistancePowerZones - Dynamic Support/Resistance Identifier
Overview
PowerZones is an advanced technical analysis tool that automatically detects significant support and resistance zones using volume data and pivot points. This indicator pulls data from higher timeframes (weekly by default) to help you identify strong and meaningful levels that are filtered from short-term "noise."
Features
Multi-Timeframe Analysis: Create support/resistance levels from daily, weekly, or monthly data
Volume Filtering: Detect high-volume pivot points to identify more reliable levels
Dynamic Threshold: Volume filter that automatically adjusts to market conditions
Visual Clarity: Support/resistance zones are displayed as boxes with adjustable transparency
Optimal Level Selection: Filter out close levels to focus on the most significant support/resistance points
Use Cases
Entry/Exit Points: Identify trading opportunities at important support and resistance levels
Stop-Loss Placement: Use natural support levels to set more effective stop-losses
Target Setting: Use potential resistance levels as profit-taking targets
Understanding Market Structure: Detect long-term support/resistance zones to better interpret price movement
Input Parameters
Lookback Period: The period used to determine pivot points
Box Width : Adjusts the width of support/resistance zones
Relative Volume Period: The period used for relative volume calculation
Maximum Number of Boxes: Maximum number of support/resistance zones to display on the chart
Box Transparency: Transparency value for the boxes
Timeframe: Timeframe to use for support/resistance detection (Daily, Weekly, Monthly)
How It Works
PowerZones identifies pivot highs and lows in the selected timeframe. It filters these points using volume data to show only meaningful and strong levels. The indicator also consolidates nearby levels, allowing you to focus only on the most important zones on the chart.
Best Practices
Weekly timeframe setting is ideal for identifying long-term important support/resistance levels
Working with weekly levels on a daily chart allows you to combine long-term levels with short-term trades
ATR-based box width creates support/resistance zones that adapt to market volatility
Use the indicator along with other technical indicators such as RSI, MACD, or moving averages to confirm trading signals
Note: Like all technical indicators, this indicator does not guarantee 100% accuracy. Always apply risk management principles and use it in conjunction with other analysis methods to achieve the best results.
If you like the PowerZones indicator, please show your support by giving it a star and leaving a comment!
Search in scripts for "stop loss"

Market Push Meter - CoffeeStyleMarket Push Meter - CoffeeKiller Indicator Guide
Welcome traders! This guide will walk you through the Market Push Meter indicator, a sophisticated volume analysis tool developed by CoffeeKiller with the help and assistance of FindBetterTrades that measures and visualizes the ongoing battle between buyers and sellers through volume pressure analysis.
🔔 **Warning: This Is Not a Standard Volume Indicator** 🔔 This indicator analyzes volume pressure in a unique way, combining directional volume with price action to identify market imbalances between buyers and sellers. All credit for the core logic for this indicator goes to FindBetterTrades and his/hers Volume Pressure Histogram (Normalized) (this is my adaptation and style added to that core logic, thus the CoffeeStyle name was added).
Core Concept: Volume Pressure Analysis
The foundation of this indicator lies in measuring the imbalance between buying and selling volume, providing insights into which market participants are exerting more pressure on price movements.
Volume Pressure Columns: Buying vs Selling Force
- Positive Green Columns: Net buying pressure
- Negative Red Columns: Net selling pressure
- Color intensity varies based on pressure strength
- Special coloring for new high/low boundaries
Marker Lines: Dynamic Support/Resistance
- High Marker Line (Magenta): Tracks the highest point reached during buying phases
- Low Marker Line (Cyan): Tracks the lowest point reached during selling phases
- Creates visual boundaries showing pressure extremes
Peak Detection System:
- Triangular markers identify significant local maxima and minima
- Background highlighting shows important pressure peaks
- Helps identify potential reversal points and pressure exhaustion
Reference Lines:
- Overbought Level: Threshold for extreme selling pressure
- Oversold Level: Threshold for extreme buying pressure
- Used to identify potential reversal zones
Core Components
1. Volume Pressure Calculation
- Separation of up-volume and down-volume
- Calculation of net volume pressure
- Smoothing for consistent visualization
- Normalization against total volume for percentage scaling
2. Boundary Tracking System
- Automatic detection of highest values in buying phases
- Automatic detection of lowest values in selling phases
- Step-line visualization of boundaries
- Color-coded for easy identification
3. Peak Detection System
- Identification of local maxima and minima
- Background highlighting of significant peaks
- Triangle markers for peak visualization
- Zero-line cross detection for trend changes
4. Threshold Settings
- Extreme threshold multiplier for identifying significant pressure
- Overbought/oversold levels for potential reversals
- Dynamic color coding based on pressure intensity
- Alert conditions for key pressure levels
Main Features
Volume Analysis Settings
- Customizable volume MA length
- Signal smoothing for clearer readings
- Optional log scale for handling wide range variations
- Adjustable threshold multiplier for sensitivity
Visual Elements
- Color-coded columns showing pressure direction and strength
- Dynamic marker lines for pressure boundaries
- Peak triangles for significant turning points
- Background highlighting for peak identification
- Overbought/oversold reference lines
Signal Generation
- Zero-line crosses for trend change signals
- Boundary breaks for pressure strength
- Peak formation for potential reversals
- Color changes for pressure direction and intensity
- Alert conditions for extreme pressure levels
Customization Options
- Volume analysis parameters
- Marker line visibility and colors
- Peak marker display options
- Log scale toggle for handling various markets
- Overbought/oversold threshold adjustments
Trading Applications
1. Trend Identification
- Volume pressure crossing above zero: buying pressure emerging
- Volume pressure crossing below zero: selling pressure emerging
- Column color: indicates pressure direction
- Column height: indicates pressure strength
- Signal line: confirms overall trend direction
2. Reversal Detection
- Peak triangles after extended trend: potential exhaustion
- Background highlighting: significant reversal points
- Volume pressure approaching marker lines: potential trend change
- Color shifts from bright to muted: decreasing pressure
- Readings beyond overbought/oversold levels: potential reversal zones
3. Pressure Analysis
- Breaking above previous high boundary: accelerating buying pressure
- Breaking below previous low boundary: accelerating selling pressure
- Special coloring (magenta/cyan): boundary breaks indicating strength
- Extreme readings: potential climactic buying/selling
4. Market Structure Assessment
- Consecutive higher peaks: strengthening buying structure
- Consecutive lower troughs: strengthening selling structure
- Peak comparisons: relative strength of pressure phases
- Boundary line steps: market structure levels
Optimization Guide
1. Volume Analysis Settings
- Volume MA Length: Default 25 provides balanced signals
- Lower values (10-15): More responsive, potentially noisier
- Higher values (30-50): Smoother, fewer false signals
- Signal Smoothing Length: Default 8 provides good balance
- Lower values: More responsive to pressure changes
- Higher values: Smoother trend identification
2. Threshold Settings
- Extreme Threshold Multiplier: Default 20.0
- Lower values: More signals, potentially more noise
- Higher values: Fewer signals, but more significant
- Overbought/Oversold Levels: Defaults at 20/-20
- Adjust based on instrument volatility
- Wider settings for more volatile instruments
3. Visual Customization
- Marker Line Colors: Adjust for visibility on your chart
- Peak Marker Color: Default yellow provides good contrast
- Enable/disable background highlights based on preference
- Consider log scale for instruments with wide volume ranges
4. Alert Settings
- Configure alerts for high buying pressure
- Configure alerts for high selling pressure
- Set additional alerts for zero-line crosses
- Consider timeframe when setting alert sensitivity
Best Practices
1. Signal Confirmation
- Wait for zero-line crosses to confirm pressure changes
- Look for peak formations to identify potential reversals
- Check for boundary breaks to confirm strong pressure
- Use with price action for entry/exit precision
- Consider extreme threshold crossings as significant signals
2. Timeframe Selection
- Lower timeframes: more signals, potential noise
- Higher timeframes: cleaner signals, less frequent
- Multiple timeframes: confirm signals across time horizons
- Match to your trading style and holding period
3. Market Context
- Strong buying phase: positive columns breaking above marker line
- Strong selling phase: negative columns breaking below marker line
- Columns approaching zero: potential pressure shift
- Columns beyond overbought/oversold: extreme conditions, potential reversal
4. Combining with Other Indicators
- Use with trend indicators for confirmation
- Pair with price action oscillators for divergence detection
- Combine with traditional volume indicators for validation
- Consider support/resistance levels with boundary lines
Advanced Trading Strategies
1. Boundary Break Strategy
- Enter long when volume pressure breaks above previous high marker line
- Enter short when volume pressure breaks below previous low marker line
- Use zero-line as initial stop-loss reference
- Take profits at formation of opposing peaks
2. Peak Trading Strategy
- Identify significant peaks with triangular markers
- Look for consecutive lower peaks in buying phases for shorting opportunities
- Look for consecutive higher troughs in selling phases for buying opportunities
- Use zero-line crosses as confirmation
3. Extreme Reading Strategy
- Look for volume pressure beyond overbought/oversold levels
- Watch for color changes and peak formations
- Enter counter-trend positions after confirmed peaks
- Use tight stops due to extreme market conditions
4. Volume Color Strategy
- Enter long when columns turn bright green (increasing buying pressure)
- Enter short when columns turn bright red (increasing selling pressure)
- Exit when color intensity fades (decreasing pressure)
- Use marker lines as dynamic support/resistance
Practical Analysis Examples
Bullish Market Scenario
- Volume pressure crosses above zero line
- Green columns grow in height and intensity
- High marker line forms steps upward
- Peak triangles appear at local maxima
- Background highlights appear at significant buying pressure peaks
Bearish Market Scenario
- Volume pressure crosses below zero line
- Red columns grow in depth and intensity
- Low marker line forms steps downward
- Peak triangles appear at local minima
- Background highlights appear at significant selling pressure troughs
Consolidation Scenario
- Volume pressure oscillates around zero line
- Column colors alternate frequently
- Marker lines remain relatively flat
- Few or no new peak highlights appear
- Pressure values remain small
Understanding Market Dynamics Through Market Push Meter
At its core, this indicator provides a unique lens to visualize market pressure through volume analysis:
1. Volume Imbalance: By separating and comparing buying volume (up candles) from selling volume (down candles), the indicator provides insights into which side is exerting more pressure in the market.
2. Normalized Pressure: The indicator normalizes volume pressure as a percentage of total volume, making it more comparable across different market conditions and instruments.
3. Dynamic Boundaries: The marker lines create a visual representation of the "high water marks" of pressure in both directions, helping to identify when markets are making new pressure extremes.
4. Exhaustion Signals: The peak detection system highlights moments where pressure has reached a local maximum or minimum, often precursors to reversals or consolidations.
Remember:
- Combine signals from volume pressure, marker lines, and peak formations
- Use appropriate timeframe settings for your trading style
- Customize the indicator to match your visual preferences and market
- Consider overall market conditions and correlate with price action
This indicator works best when:
- Used as part of a comprehensive trading system
- Combined with proper risk management
- Applied with an understanding of current market conditions
- Signals are confirmed by price action and other indicators
DISCLAIMER: This indicator and its signals are intended solely for educational and informational purposes. They do not constitute financial advice. Trading involves significant risk of loss. Always conduct your own analysis and consult with financial professionals before making trading decisions.

RSI + MFI Momentum Mapper - CoffeeKillerRSI + MFI Momentum Mapper - CoffeeKiller Indicator Guide
Welcome traders! This guide will walk you through the RSI + MFI Momentum Mapper indicator, an innovative market analysis tool developed by CoffeeKiller that combines two powerful oscillators to create a comprehensive momentum visualization system.
🔔 **Warning: This Is Not a Standard RSI or MFI Indicator** 🔔 This indicator combines and normalizes RSI and MFI data to create a unified momentum representation with boundary detection and peak signaling features.
Core Concept: Combined Momentum Analysis
The foundation of this indicator lies in merging the strengths of two complementary oscillators - Relative Strength Index (RSI) and Money Flow Index (MFI) - to provide a more robust momentum signal that accounts for both price action and volume.
Directional Columns: Momentum Strength
- Positive Green Columns: Bullish momentum
- Negative Red Columns: Bearish momentum
- Color intensity varies based on momentum strength
- Special coloring for new high/low boundaries
Marker Lines: Dynamic Support/Resistance
- High Marker Line (Magenta): Tracks the highest point reached during a bullish phase
- Low Marker Line (Cyan): Tracks the lowest point reached during a bearish phase
- Creates visual boundaries showing momentum extremes
Peak Detection System:
- Triangular markers identify significant local maxima and minima
- Background highlighting shows important momentum peaks
- Helps identify potential reversal points and momentum exhaustion
Reference Lines:
- Zero Line (Gray): Divides bullish from bearish momentum
- High Line (+1): Upper threshold for extremely bullish conditions
- Low Line (-1): Lower threshold for extremely bearish conditions
Core Components
1. Oscillator Normalization
- RSI and MFI values centered around zero
- Values scaled to create consistent visualization
- Normalized range typically between -1 and +1
- Combination of indicators for signal reliability
2. Boundary Tracking System
- Automatic detection of highest values in bullish phases
- Automatic detection of lowest values in bearish phases
- Step-line visualization of boundaries
- Color-coded for easy identification
3. Peak Detection System
- Identification of local maxima and minima
- Background highlighting of significant peaks
- Triangle markers for peak visualization
- Zero-line cross detection for trend changes
4. Signal Smoothing
- Signal line calculation via SMA
- Helps filter noise and identify trends
- Provides confirmation of momentum direction
Main Features
Oscillator Settings
- Customizable RSI length for sensitivity control
- Customizable MFI length for sensitivity control
- Normalized display for consistent visualization
- Signal smoothing for clearer readings
Visual Elements
- Color-coded columns showing momentum direction and strength
- Dynamic marker lines for momentum boundaries
- Peak triangles for significant turning points
- Background highlighting for peak identification
- Reference lines for momentum threshold levels
Signal Generation
- Zero-line crosses for trend change signals
- Boundary breaks for momentum strength
- Peak formation for potential reversals
- Color changes for momentum direction and acceleration
Customization Options
- RSI and MFI length parameters
- Marker line visibility and colors
- Peak marker color selection
- Peak background display options
Trading Applications
1. Trend Identification
- Directional line crossing above zero: bullish trend beginning
- Directional line crossing below zero: bearish trend beginning
- Column color: indicates momentum direction
- Column height: indicates momentum strength
2. Reversal Detection
- Peak triangles after extended trend: potential exhaustion
- Background highlighting: significant reversal points
- Directional line approaching marker lines: potential trend change
- Color shifts from bright to muted: decreasing momentum
3. Momentum Analysis
- Breaking above previous high boundary: accelerating bullish momentum
- Breaking below previous low boundary: accelerating bearish momentum
- Special coloring (magenta/cyan): boundary breaks indicating strength
- Approaching +1/-1 lines: extreme momentum conditions
4. Market Structure Assessment
- Consecutive higher peaks: strengthening bullish structure
- Consecutive lower troughs: strengthening bearish structure
- Peak comparisons: relative strength of momentum phases
- Boundary line steps: market structure levels
Optimization Guide
1. Oscillator Settings
- RSI Length: Default 14 provides balanced signals
- Lower values (7-10): More responsive, potentially noisier
- Higher values (20-30): Smoother, fewer false signals
- MFI Length: Default 14 provides balanced signals
- Lower values: More responsive to volume changes
- Higher values: Less sensitive to short-term volume spikes
2. Visual Customization
- Marker Line Colors: Adjust for visibility on your chart
- Peak Marker Color: Default yellow provides good contrast
- Enable/disable background highlights based on preference
- Consider chart background when selecting colors
3. Signal Interpretation
- Stronger signals: When directional line approaches +1/-1
- Confirmation: When peaks form after extended momentum
- Early warnings: When color intensity changes before direction
- Trend strength: Distance between zero line and current reading
4. Reference Line Usage
- Zero line: Primary trend divider
- +1/-1 lines: Extreme momentum thresholds
- Marker lines: Dynamic support/resistance levels
- Distance from reference: Momentum strength measure
Best Practices
1. Signal Confirmation
- Wait for zero-line crosses to confirm trend changes
- Look for peak formations to identify potential reversals
- Check for boundary breaks to confirm strong momentum
- Use with price action for entry/exit precision
2. Timeframe Selection
- Lower timeframes: more signals, potential noise
- Higher timeframes: cleaner signals, less frequent
- Multiple timeframes: confirm signals across time horizons
- Match to your trading style and holding period
3. Market Context
- Strong bullish phase: positive columns breaking above marker line
- Strong bearish phase: negative columns breaking below marker line
- Columns approaching zero: potential trend change
- Columns approaching +1/-1: extreme conditions, potential reversal
4. Combining with Other Indicators
- Use with trend indicators for confirmation
- Pair with other oscillators for divergence detection
- Combine with volume analysis for validation
- Consider support/resistance levels with boundary lines
Advanced Trading Strategies
1. Boundary Break Strategy
- Enter long when directional line breaks above previous high marker line
- Enter short when directional line breaks below previous low marker line
- Use zero-line as initial stop-loss reference
- Take profits at formation of opposing peaks
2. Peak Trading Strategy
- Identify significant peaks with triangular markers
- Look for consecutive lower peaks in bullish phases for shorting opportunities
- Look for consecutive higher troughs in bearish phases for buying opportunities
- Use zero-line crosses as confirmation
3. Extreme Reading Strategy
- Look for directional line approaching +1/-1 lines
- Watch for color changes and peak formations
- Enter counter-trend positions after confirmed peaks
- Use tight stops due to extreme momentum conditions
4. Column Color Strategy
- Enter long when columns turn bright green (increasing momentum)
- Enter short when columns turn bright red (increasing momentum)
- Exit when color intensity fades (decreasing momentum)
- Use marker lines as dynamic support/resistance
Practical Analysis Examples
Bullish Market Scenario
- Directional line crosses above zero line
- Green columns grow in height and intensity
- High marker line forms steps upward
- Peak triangles appear at local maxima
- Background highlights appear at significant momentum peaks
Bearish Market Scenario
- Directional line crosses below zero line
- Red columns grow in depth and intensity
- Low marker line forms steps downward
- Peak triangles appear at local minima
- Background highlights appear at significant momentum troughs
Consolidation Scenario
- Directional line oscillates around zero line
- Column colors alternate frequently
- Marker lines remain relatively flat
- Few or no new peak highlights appear
- Directional values remain small
Understanding Market Dynamics Through RSI + MFI Momentum Mapper
At its core, this indicator provides a unique lens to visualize market momentum by combining two complementary oscillators:
1. Combined Strength: By averaging RSI (price-based) and MFI (volume-based), the indicator provides a more comprehensive view of market momentum that considers both price action and buying/selling pressure.
2. Normalized Scale: The indicator normalizes values around zero, making it easier to identify bullish vs bearish conditions and the relative strength of momentum in either direction.
3. Dynamic Boundaries: The marker lines create a visual representation of the "high water marks" of momentum in both directions, helping to identify when markets are making new momentum extremes.
4. Exhaustion Signals: The peak detection system highlights moments where momentum has reached a local maximum or minimum, often precursors to reversals or consolidations.
Remember:
- Combine signals from directional line, marker lines, and peak formations
- Use appropriate timeframe settings for your trading style
- Customize the indicator to match your visual preferences
- Consider market conditions and correlate with price action
This indicator works best when:
- Used as part of a comprehensive trading system
- Combined with proper risk management
- Applied with an understanding of current market conditions
- Signals are confirmed by price action and other indicators
DISCLAIMER: This indicator and its signals are intended solely for educational and informational purposes. They do not constitute financial advice. Trading involves significant risk of loss. Always conduct your own analysis and consult with financial professionals before making trading decisions.

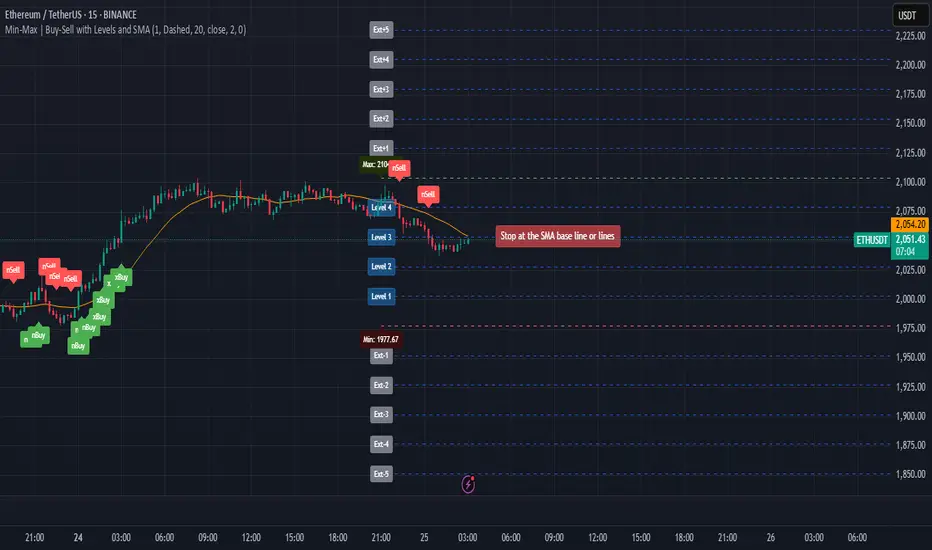
Min-Max | Buy-Sell Alert with LevelsMin-Max | Buy-Sell Alert with Levels
Description:
The Min-Max | Buy-Sell Alert with Levels indicator is a powerful tool designed to help traders identify key levels of support and resistance based on the previous day's high and low prices. It plots horizontal lines for the previous day's minimum (Min) and maximum (Max) prices, along with four intermediate levels (Stop Loss 1 to Stop Loss 4) calculated as equal percentage steps between the Min and Max.
This indicator is perfect for traders who want to:
Identify potential entry points when the price returns within the Min-Max range.
Set stop-loss levels based on the calculated intermediate levels.
Receive alerts for buy, sell, and stop-loss conditions.
Key Features:
Previous Day's Min and Max Lines:
Automatically plots the Min (red line) and Max (green line) of the previous day.
These levels act as dynamic support and resistance zones.
Intermediate Stop Loss Levels:
Calculates and plots four intermediate levels (Stop Loss 1 to Stop Loss 4) between the Min and Max.
Each level is equally spaced, representing potential stop-loss or take-profit zones.
Customizable Alerts:
Buy Alert: Triggered when the price returns within the Min-Max range after breaking below the Min.
Sell Alert: Triggered when the price returns within the Min-Max range after breaking above the Max.
Stop Loss Alerts: Triggered when the price reaches any of the four intermediate levels (Stop Loss 1 to Stop Loss 4).
Customizable Appearance:
Adjust the thickness, color, and style (solid, dashed, dotted) of the lines.
Customize the colors of the Stop Loss labels for better visualization.
Labels on the Chart:
Displays "Buy" and "Sell" labels on the chart when the respective conditions are met.
Labels for Stop Loss levels are also displayed for easy reference.
How to Use:
Add the indicator to your chart.
Customize the settings (line colors, thickness, and alert preferences) in the indicator's settings panel.
Use the Min and Max lines as dynamic support and resistance levels.
Monitor the intermediate levels (Stop Loss 1 to Stop Loss 4) for potential stop-loss or take-profit zones.
Set up alerts for Buy, Sell, and Stop Loss conditions to stay informed about key price movements.
Why Use This Indicator?
Simple and Effective: Focuses on the most important levels from the previous day.
Customizable: Tailor the indicator to match your trading style and preferences.
Alerts: Never miss a trading opportunity with customizable alerts for key conditions.
Settings:
Line Thickness: Adjust the thickness of the Min, Max, and intermediate lines.
Line Colors: Customize the colors of the Min, Max, and intermediate lines.
Line Style: Choose between solid, dashed, or dotted lines.
Stop Loss Label Colors: Customize the colors of the Stop Loss labels.
Alerts: Enable or disable alerts for Buy, Sell, and Stop Loss conditions.
Ideal For:
Day traders and swing traders.
Traders who rely on support and resistance levels.
Anyone looking for a clear and customizable tool to identify key price levels.
Disclaimer:
This indicator is for educational and informational purposes only. It does not constitute financial advice. Always conduct your own analysis and trade responsibly.
Get Started Today!
Add the Min-Max | Buy-Sell Alert with Levels indicator to your chart and take your trading to the next level. Customize it to fit your strategy and never miss a key trading opportunity again!
XGBoost Approximation Indicator with HTF Filter Ver. 3.2XGBoost Approx Indicator with Higher Timeframe Filter Ver. 3.2
What It Is
The XGBoost Approx Indicator is a technical analysis tool designed to generate trading signals based on a composite of multiple indicators. It combines Simple Moving Average (SMA), Relative Strength Index (RSI), MACD, Rate of Change (ROC), and Volume to create a composite indicator score. Additionally, it incorporates a higher timeframe filter (HTF) to enhance trend confirmation and reduce false signals.
This indicator helps traders identify long (buy) and short (sell) opportunities based on a weighted combination of trend-following and momentum indicators.
How to Use It Properly
Setup and Configuration:
Add the indicator to your TradingView chart.
Customize input settings based on your trading strategy. Key configurable inputs include:
HTF filter (default: 1-hour)
SMA, RSI, MACD, and ROC lengths
Custom weightings for each component
Thresholds for buy and sell signals
Understanding the Signals:
Green "Long" Label: Appears when the composite indicator crosses above the buy threshold, signaling a potential buy opportunity.
Red "Short" Label: Appears when the composite indicator crosses below the sell threshold, signaling a potential sell opportunity.
These signals are filtered by a higher timeframe SMA trend to improve accuracy.
Alerts:
The indicator provides alert conditions for long and short entries.
Traders can enable alerts in TradingView to receive real-time notifications when a new signal is triggered.
Safety and Best Practices
Use in Conjunction with Other Analysis: Do not rely solely on this indicator. Combine it with price action, support/resistance levels, and fundamental analysis for better decision-making.
Adjust Settings for Your Strategy: The default settings may not suit all markets or timeframes. Test different configurations before trading live.
Backtest Before Using in Live Trading: Evaluate the indicator’s past performance on historical data to assess its effectiveness in different market conditions.
Avoid Overtrading: False signals can occur, especially in low volatility or choppy markets. Use additional confirmation (e.g., trendlines or moving averages).
Risk Management: Always set stop-loss levels and position sizes to limit potential losses.

CandelaCharts - Liquidity Key Zones (LKZ)📝 Overview
The Liquidity Key Zones indicator displays the previous high and low levels for daily, weekly, monthly, quarterly, and yearly timeframes. These levels serve as crucial price zones for trading any market or instrument. They are also high-probability reaction zones, ideal for trading using straightforward confirmation patterns.
Each of these levels plays a significant role in determining whether the market continues its momentum or reverses its bias. I like to think of these levels as dual magnets—they simultaneously attract and repel price. You might wonder how having opposing views can be useful. The key is to remain neutral about direction and establish your own rules to identify when these zones are likely to attract or repel price. I have my own set of rules, and you can develop yours.
📦 Features
MTF
Styling
⚙️ Settings
Day: Shows previous day levels
Week: Shows previous week levels
Month: Shows previous month levels
Quarter: Shows previous quarter levels
Year: Shows previous year levels
Show Average: Shows previous level average price
Show Open: Shows previous level open price
⚡️ Showcase
Daily
Weekly
Monthly
Quarterly
Yearly
Average
Open
📒 Usage
When the price breaks through a significant level, such as a daily, weekly, or monthly high or low, it often signals a potential reversal in market direction. This occurs because these levels represent key areas of support or resistance, where traders anticipate heightened activity, including profit-taking, stop-loss orders, or new positions being initiated.
Once the price breaches these levels, it may trigger a sharp reaction as market participants adjust their strategies, leading to a reversal. Monitoring price action and volume around these levels can provide valuable confirmation of such reversals.
Another effective approach to utilizing these pivot points is by incorporating them into a structured trading strategy, such as the X Model, which leverages multiple timeframes and technical tools to refine trade entries and exits.
X Model conditions:
(D1) Previous Day High (ERL)
(H1) Bullish FVG/IFVG/OB (IRL)
(m15) MSS / SMT
Only Short Above 00:00
By combining these elements, the X Model offers a comprehensive framework for leveraging pivot levels effectively, emphasizing confluence between liquidity zones, time-based rules, and multi-timeframe analysis to enhance trading accuracy and consistency.
🚨 Alerts
This script provides alert options for all signals.
Bearish Signal
A bearish signal is generated when the price breaks below the previous low level.
Bullish Signal
A bullish signal is generated when the price breaks above the previous low level.
⚠️ Disclaimer
Trading involves significant risk, and many participants may incur losses. The content on this site is not intended as financial advice and should not be interpreted as such. Decisions to buy, sell, hold, or trade securities, commodities, or other financial instruments carry inherent risks and are best made with guidance from qualified financial professionals. Past performance is not indicative of future results.

Discount/Premium OTE LevelsThis indicator is created to identify discount/premium areas to provide additional confluence to trades taken. The underlying theory is that the trades taken in discounted areas are likely to have less risk due to a smaller stop loss and a higher reward/risk ratio.
The indicator operates by first identifying a zone between the last major swing high and low. These highs and lows are determined as price points that at the extremes within the number of bars to the left, as defined by the "Swing Sensitivity" setting.
Once a price zone is established, the indicator verifies that the zone meets the minimum size in points as configured via the "Minimum size" setting to be considered tradable. Zones that are too small may not provide a sufficient range even for scalping. The default value is 42 points based on Nasdaq, which means that the distance between inner most OTE levels (0.382 and 0.618) is at least 10 points.
When a valid zone is identified, it is then subdivided into areas of interest based on OTE levels, which can be configured/adjusted via the "Levels to Draw" setting. These levels represent the midpoint (50%), which distinguishes between premium and discount, and the three OTE levels 0.79, 0.705, 0.618, above the 50% for discount and below the 50% for premium.
For example, if a zone is formed initially by a swing low followed by a swing high with the assumption that the draw is higher, the indicator can be used to formulate long positions from below the 50% level starting at 0.38 OTE level, or ideally at 0.295 OTE level using 0 as a stop loss. Alternatively, if the 50% level is not yet tapped, short scalp positions can be made from 0.79-0.618 OTE levels with 50% as a partial or TP target.
See for long/short example
Typically, the indicator will show only a single zone. However, there may be cases with two zones: one larger parent zone containing a smaller, valid price zone within itself.
The indicator will automatically invalidate and remove the zone once the high/low of the zone is invalidated.
Configuration:
The indicator provides several visualization options for customization, including:
Color settings for OTE levels, with separate settings for edge/50% color, premium, and discount levels.
Settings for line style for OTE levels.
Settings to determine whether to show prices on level labels.
Settings to decide if lines should be extended to the right.

ICT Concepts: MML, Order Blocks, FVG, OTECore ICT Trading Concepts
These strategies are designed to identify high-probability trading opportunities by analyzing institutional order flow and market psychology.
1. Market Maker Liquidity (MML) / Liquidity Pools
Idea: Institutional traders ("market makers") place orders around key price levels where retail traders’ stop losses cluster (e.g., above swing highs or below swing lows).
Application: Look for "liquidity grabs" where price briefly spikes to these levels before reversing.
Example: If price breaks a recent high but reverses sharply, it may indicate a liquidity grab to trigger retail stops before a trend reversal.
2. Order Blocks (OB)
Idea: Institutional orders are often concentrated in specific price zones ("order blocks") where large buy/sell decisions occurred.
Application: Identify bullish order blocks (strong buying zones) or bearish order blocks (strong selling zones) on higher timeframes (e.g., 1H/4H charts).
Example: A bullish order block forms after a strong rally; price often retests this zone later as support.
3. Fair Value Gap (FVG)
Idea: A price imbalance occurs when candles gap without overlapping, creating an area of "unfair" price that the market often revisits.
Application: Trade the retracement to fill the FVG. A bullish FVG acts as support, and a bearish FVG acts as resistance.
Example: Three consecutive candles create a gap; price later returns to fill this gap, offering a entry point.
4. Time-Based Analysis (NY Session, London Kill Zones)
Idea: Institutional activity peaks during specific times (e.g., 7 AM – 11 AM New York time).
Application: Focus on trades during high-liquidity periods when banks and hedge funds are active.
Example: The "London Kill Zone" (2 AM – 5 AM EST) often sees volatility due to European market openings.
5. Optimal Trade Entry (OTE)
Idea: A retracement level (similar to Fibonacci retracement) where institutions re-enter trends after a pullback.
Application: Look for 62–79% retracements in a trend to align with institutional accumulation/distribution zones.
Example: In an uptrend, price retraces 70% before resuming upward—enter long here.
6. Stop Hunts
Idea: Institutions manipulate price to trigger retail stop losses before reversing direction.
Application: Avoid placing stops at obvious levels (e.g., above/below recent swings). Instead, use wider stops or wait for confirmation.

Uptrick: Zero Lag HMA Trend Suite1. Name and Purpose
Uptrick: Zero Lag HMA Trend Suite is a Pine Version 6 script that builds upon the Hull Moving Average (HMA) to offer an advanced trend analysis tool. Its purpose is to help traders identify trend direction, potential reversals, and overall market momentum with reduced lag compared to traditional moving averages. By combining the HMA with Average True Range (ATR) thresholds, slope-dependent coloring, Volume Weighted Average Price (VWAP) ribbons, and optional reversal signals, the script aims to give a detailed view of price activity in various market environments.
2. Overview
This script begins with the calculation of a Hull Moving Average, a method that blends Weighted Moving Averages in a way designed to cut down on lag while still smoothing out price fluctuations. Next, several enhancements are applied. The script compares current HMA values to previous ones for slope-based coloring, which highlights uptrends and downtrends at a glance. It also plots buy and sell signals when price moves beyond or below thresholds determined by the ATR and the user’s chosen signal multiplier. An optional VWAP ribbon can be shown to confirm bullish or bearish conditions relative to a volume-weighted benchmark. Additionally, the script can plot reversal signals (labeled with B) at points where price crosses back toward the HMA from above or below. Taken together, these elements allow traders to visualize both the short-term momentum and the broader context of how price interacts with volatility and overall market direction.
3. Why These Indicators Have Been Linked Together
The reason the Hull Moving Average, the Average True Range, and the VWAP have been integrated into one script is to tackle multiple facets of market analysis in a single tool. The Zero Lag Hull Moving Average provides a responsive trend line, the ATR offers a measure of volatility that helps distinguish significant price shifts from typical fluctuations, and the VWAP acts as a reference for fair value based on traded volume. By layering all three, the script helps traders avoid the need to juggle multiple separate indicators and offers a holistic perspective. The slope-based coloring focuses on trend direction, the ATR-based thresholds refine possible buy and sell zones, and the VWAP ribbons provide insight into how price stands relative to an important volume-weighted level. The inclusion of up and down signals and reversal B labels further refines entries and exits.
4. Why Use Uptrick: Zero Lag HMA Trend Suite
The Hull Moving Average is already known for reacting more quickly to price changes compared to other moving averages while retaining a degree of smoothness. This suite enhances the basic HMA by showing colored gradients that make it easy to spot trend direction changes, highlighting potential entry or exit points based on volatility-driven thresholds, and optionally layering a volume-based measure of bullish or bearish market sentiment. By relying on a zero lag approach and additional data points, the script caters to those wanting a more responsive method of identifying shifts in market dynamics. The added reversal signals and up or down alerts give traders extra confirmation for potential turning points.
5. How This Extension Improves on the Basic HMA
This extension not only plots the Hull Moving Average but also includes data-driven alerts and visual cues that traditional HMA lines do not provide. First, it offers multi-layered slope coloring, making up or down trends quickly apparent. Second, it uses ATR-based thresholds to pinpoint moments when price may be extending beyond normal volatility, thus generating buy or sell signals. Third, the script introduces an optional VWAP ribbon to indicate whether the market is trading above or below this pivotal volume-weighted benchmark, adding a further confirmation step for bullish or bearish conditions. Finally, it incorporates optional reversal signals labeled with B, indicating points where price might swing back toward the main HMA line.
6. Core Components
The script can be broken down into several primary functions and features.
a. Zero Lag HMA Calculation
Uses two Weighted Moving Averages (half-length and full-length) combined through a smoothing step based on the square root of the chosen length. This approach is designed to reduce lag significantly compared to other moving averages.
b. Slope Detection
Compares current and prior HMA values to determine if the trend is up or down. The slope-based coloring changes between turquoise shades for upward movement and magenta shades for downward movement, making trend direction immediately visible.
c. ATR-Based Thresholding for Up and Down Signals
The script calculates an Average True Range over a user-defined period, then multiplies it by a signal factor to form two bands around the HMA. When price crosses below the lower band, an up (buy) signal appears; when it crosses above the upper band, a down (sell) signal is shown.
d. Reversal Signals (B Labels)
Tracks when price transitions back toward the main HMA from an extreme zone. When enabled, these reversal points are labeled with a B and can help traders see potential turning points or mean-reversion setups.
e. VWAP Bands
An optional Volume Weighted Average Price ribbon that plots above or below the HMA, indicating bullish or bearish conditions relative to a volume-weighted price benchmark. This can also act as a kind of support/ resistance.
7. User Inputs
a. HMA Length
Controls how quickly the moving average responds to price changes. Shorter lengths react faster but can lead to more frequent signals, whereas longer lengths produce smoother lines.
b. Source
Specifies the price input, such as close or an alternative source, for the calculation. This can help align the HMA with specific trading strategies.
c. ATR Length and Signal Multiplier
Defines how the script calculates average volatility and sets thresholds for buy or sell alerts. Adjusting these values can help filter out noise or highlight more aggressive signals.
d. Slope Index
Determines how many bars to look back for detecting slope direction, influencing how sensitive the slope coloring is to small fluctuations.
e. Show Buy and Sell Signals, Reversal Signals, and VWAP
Lets users toggle the display of these features. Turning off certain elements can reduce chart clutter if traders prefer a simpler layout.
8. Calculation Process
The script’s calculation follows a step-by-step approach. It first computes two Weighted Moving Averages of the selected price source, one over half the specified length and one over the full length. It then combines these using 2*wma1 minus wma2 to reduce lag, followed by applying another weighted average using the square root of the length. Simultaneously, it computes the ATR for a user-defined period. By multiplying ATR by the signal multiplier, it establishes upper and lower bands around the HMA, where crossovers generate buy (up) or sell (down) signals. The script can also plot reversal signals (B labels) when price crosses back from these bands in the opposite direction. For the optional VWAP feature, Pine Script’s ta.vwap function is used, and differences between the HMA and VWAP levels determine the color and opacity of the ribbon.
9. Signal Generation and Filtering
The ATR-based thresholds reduce the influence of small, inconsequential price swings. When price falls below the lower band, the script issues an up (buy) signal. If price breaks above the upper band, a down (sell) signal appears. These signals are visible through labels placed near the bars. Reversal signals, labeled with B, can be turned on to help detect when price retraces from an extended area back toward the main HMA line. Traders can disable or enable these signals to match their preferred level of chart detail or risk tolerance.
10. Visualization on the Chart
The Zero HMA Lag Trend Suite aims for visual clarity. The HMA line is plotted multiple times with increasing transparency to create a gradient effect. Turquoise gradients indicate upward slopes, and magenta gradients signify downward slopes. Bar coloring can be configured to align with the slope direction, providing quick insight into current momentum. When enabled, buy or sell labels are placed under or above the bars as price crosses the ATR-defined boundaries. If the reversal option is active, B labels appear around areas where price changes direction. The optional VWAP ribbons form background bands, using distinct coloration to signal whether price is above or below the volume-weighted metric.
11. Market Adaptability
Because the script’s parameters (HMA length, ATR length, signal multiplier, and slope index) are user-configurable, it can adapt to a wide range of markets and timeframes. Intraday traders may prefer a shorter HMA length for quick signals, while swing or position traders might use a longer HMA length to filter out short-lived price changes. The source setting can also be adjusted, allowing for specialized data inputs beyond just close or open values.
12. Risk Management Considerations
The script’s signals and labels are based on past price data and volatility readings, and they do not guarantee profitable outcomes. Sharp market reversals or unforeseen fundamental events can produce false signals. Traders should combine this tool with broader risk management strategies, including stop-loss placement, position sizing, and independent market analyses. The Zero HMA Lag Trend Suite can help highlight potential opportunities, but it should not be relied upon as the sole basis for trade decisions.
13. Combining with Other Tools
Many traders choose to verify signals from the Zero HMA Lag Trend Suite using popular indicators like the Relative Strength Index (RSI), Moving Average Convergence Divergence (MACD), or even simple volume-based metrics to confirm whether a price movement has sufficient momentum. Conventional techniques such as support and resistance levels, chart patterns, or candlestick analysis can also supplement signals generated by the script’s up, down, or reversal B labels.
14. Parameter Customization and Examples
a. Short-Term Day Trading
Using a shorter HMA length (for instance, 9 or 14) and a slightly higher ATR multiplier might provide timely buy and sell signals, though it may also produce more whipsaws in choppy markets.
b. Swing or Position Trading
Selecting a longer HMA length (such as 50 or 100) with a moderate ATR multiplier can help users track more significant and sustained market moves, potentially reducing the effect of minor fluctuations.
c. Multiple Timeframe Blends
Some traders load two versions of the indicator on the same chart, one for short-term signals (with frequent B label reversals) and another for the broader trend direction, aligning entry and exit decisions with the bigger picture.
15. Realistic Expectations
Even though the Hull Moving Average helps minimize lag and the script incorporates volatility-based filters and optional VWAP overlays, it cannot predict future market behavior with complete accuracy. Periods of low liquidity or sudden market shocks can still lead to signals that do not reflect longer-term trends. Frequent parameter review and manual confirmation are advised before executing trades based solely on the script’s outputs.
16. Theoretical Background
The Hull Moving Average formula aims to balance smoothness with reactivity, accomplished by combining Weighted Moving Averages at varying lengths. By subtracting a slower average from a faster one and then applying another smoothing step with the square root of the original length, the HMA is designed to respond more promptly to price changes than typical exponential or simple moving averages. The ATR component, introduced by J. Welles Wilder, calculates the average range of price movement over a user-defined period, allowing the script to assess volatility and adapt signals accordingly. VWAP provides a volume-weighted benchmark that many institutional traders track to gauge fair intraday value.
17. Originality and Uniqueness
Although multiple HMA-based indicators can be found, Uptrick: Zero Lag HMA Trend Suite sets itself apart by merging slope-based coloring, ATR thresholds, VWAP ribbons, up or down labels, and optional reversal signals all in one cohesive platform. This synergy aims to reduce chart clutter while still giving traders a comprehensive look at trend direction, volatility, and volume-based sentiment.
18. Summary
Uptrick: Zero Lag HMA Trend Suite is a specialized trading script designed to highlight potential market trends and reversals with minimal delay. It leverages the Hull Moving Average for an adaptive yet smooth price line, pairs ATR-based thresholds for detecting possible breakouts or dips, and provides VWAP-based ribbons for added volume-weighted context. Traders can further refine their entries and exits by enabling up or down signals and reversal labels (B) where price may revert toward the HMA. Suitable for a wide range of timeframes and instrument types, the script encourages a disciplined approach to trade management and risk control.
19. Disclaimer
This script is provided for informational and educational purposes only. Trading and investing involve significant financial risk, and no indicator can guarantee success under all conditions. Users should practice robust risk management, including the placement of stop losses and position sizing, and should confirm signals with additional analysis tools. The developer of this script assumes no liability for any trading decisions or outcomes resulting from its use.

RSI + ADX + ATR 18-01-25Combining RSI (Relative Strength Index), ADX (Average Directional Index), and ATR (Average True Range) creates a synergistic approach to technical analysis. This powerful trio covers momentum, trend strength, and volatility, providing comprehensive insights into market conditions. Here's a deeper exploration of their combined results:
1. Momentum Assessment with RSI
Purpose: RSI measures the speed and magnitude of recent price changes to determine overbought or oversold levels.
Benefit in Combination:
When RSI indicates overbought (above 70) or oversold (below 30) levels, it signals a potential reversal or correction.
However, these signals can be false in strongly trending markets, which is why ADX is used alongside it.
2. Trend Strength Confirmation with ADX
Purpose: ADX confirms the presence and strength of a trend.
Benefit in Combination:
If RSI shows a potential reversal but ADX indicates a strong trend (above 25), the trend is likely to continue, and RSI signals may need to be approached with caution.
Conversely, if ADX is below 20 (weak trend), RSI signals are more likely to indicate genuine reversals, as the market lacks a strong directional push.
3. Volatility Analysis with ATR
Purpose: ATR evaluates the level of price volatility.
Benefit in Combination:
High ATR values indicate volatile conditions where prices can move significantly; this helps in setting wider stop-loss levels to avoid premature exits.
Low ATR values suggest quieter markets, where tighter stop-losses and profit targets are more suitable.

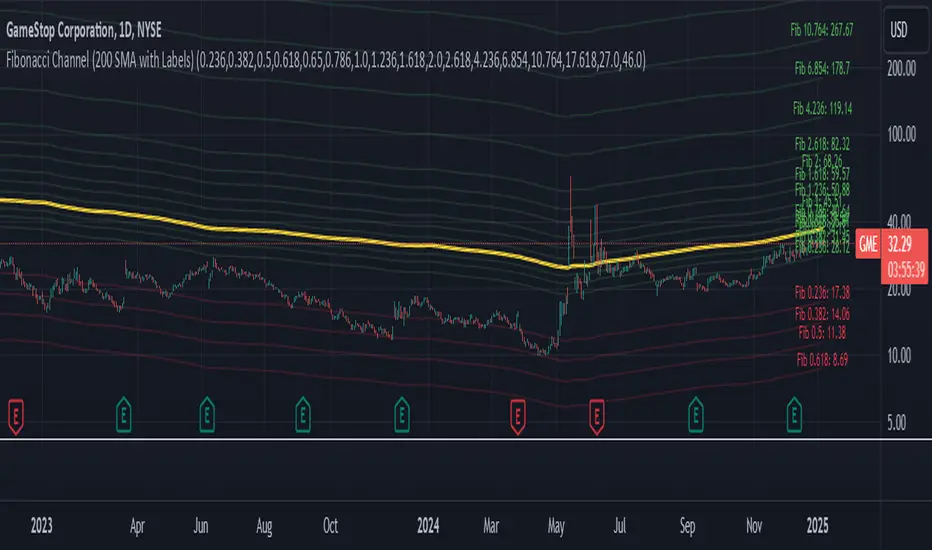
Fibonacci Channel Standard Deviation levels based off 200MAThis script dynamically combines Fibonacci levels with the 200-period simple moving average (SMA), offering a powerful tool for identifying high-probability support and resistance zones. By adjusting to the changing 200 SMA, the script remains relevant across different market phases.
Key Features:
Dynamic Fibonacci Levels:
The script automatically calculates Fibonacci retracements and extensions relative to the 200 SMA.
These levels adapt to market trends, offering more relevant zones compared to static Fibonacci tools.
Support and Resistance Zones:
In uptrends, price often respects retracement levels above the 200 SMA (e.g., 38.2%, 50%, 61.8%).
In downtrends, price may interact with retracements and extensions below the 200 SMA (e.g., 23.6%, 1.618).
Customizable Confluence Zones:
Key levels such as the golden pocket (61.8%–65%) are highlighted as high-probability zones for reversals or continuations.
Extensions (e.g., 1.618) can serve as profit targets or bearish continuation points.
Practical Applications:
Identifying Reversal Zones:
Look for confluence between Fibonacci levels and the 200 SMA to identify potential reversal points.
Example: A pullback to the 61.8%–65% golden pocket near the 200 SMA often signals a bullish reversal.
Trend Confirmation:
In uptrends, price respecting Fibonacci retracements above the 200 SMA (e.g., 38.2%, 50%) confirms strength.
Use Fibonacci extensions (e.g., 1.618) as profit targets during strong trends.
Dynamic Risk Management:
Place stop-losses just below key Fibonacci retracement levels near the 200 SMA to minimize risk.
Bearish Scenarios:
Below the 200 SMA, Fibonacci retracements and extensions act as resistance levels and bearish targets.
How to Use:
Volume Confirmation: Watch for volume spikes near Fibonacci levels to confirm support or resistance.
Price Action: Combine with candlestick patterns (e.g., engulfing candles, pin bars) for precise entries.
Trend Indicators: Use in conjunction with shorter moving averages or RSI to confirm market direction.
Example Setup:
Scenario: Price retraces to the 61.8% Fibonacci level while holding above the 200 SMA.
Confirmation: Volume spikes, and a bullish engulfing candle forms.
Action: Enter long with a stop-loss just below the 200 SMA and target extensions like 1.618.
Key Takeaways:
The 200 SMA serves as a reliable long-term trend anchor.
Fibonacci retracements and extensions provide dynamic zones for trade entries, exits, and risk management.
Combining this tool with volume, price action, or other indicators enhances its effectiveness.
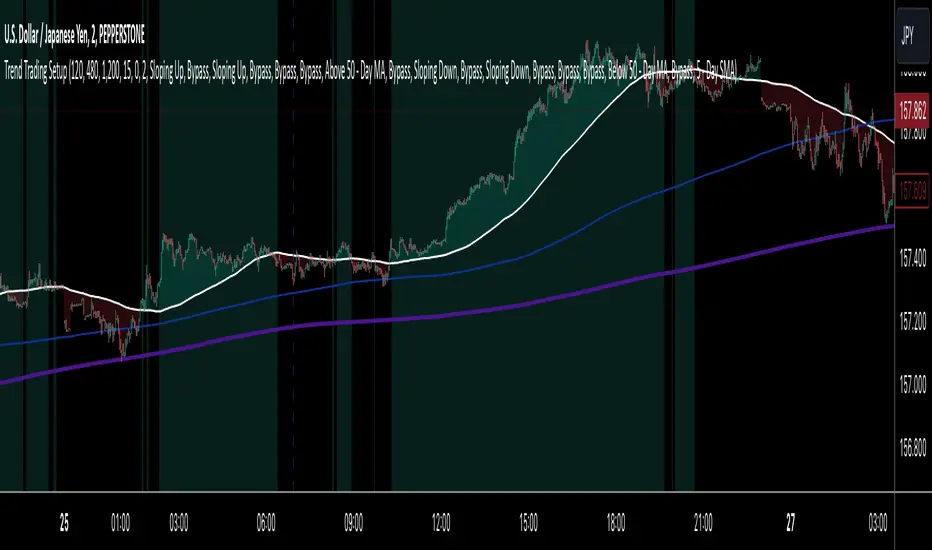
Trend Trading SetupTrend Trading Setup is an indicator that is designed to assist with trend trading by indicating when the basic conditions for a trade in either direction are met.
Note: Default values assume the 1-hour chart
The idea is that this will allow a trader to know for the first glance if a market is worthy of closer inspection or not.
Indicator Features:
1. Simple Moving Averages - defining the basic trade conditions
5 - Day Moving Average
20 - Day Moving Average
50 - Day Moving Average
2. Visualisation of The Price Location In Relation To The 5 - Day Moving Average
If price is above the 5-day Moving Average, the space between them is green. If price is below the 5-day Moving Average, the space between them is red.
3. Risk Management Section - calculates an ATR-based stop loss.
4. Indication When The Conditions Are Met
If the conditions for a bullish bias are met, the chart background is green. If the conditions for a bearish bias are met, the chart background is red. If none of the conditions are met, the chart background is left as is.
A user can adjust the length of any of the Moving Averages as well as the length of the ATR and the ATR Multiplier for the stop loss size. Default values assume the 1-hour chart, but surprisingly the settings seem to show logical results also on other time frames.
The Setup:
Bullish - 5-day Moving Average is above the 50-day Moving Average. The slope of both of the Moving Averages is positive and the price has to be above the 5-day Moving Average.
Bearish - Exactly the same as for the bullish bias, but opposite.
I do not recommend to take this Trend Trading Setup indicator as the only reason for a position. However, I believe it can be very useful to show when the overall conditions are in favour of a long position or in favour of a short position.
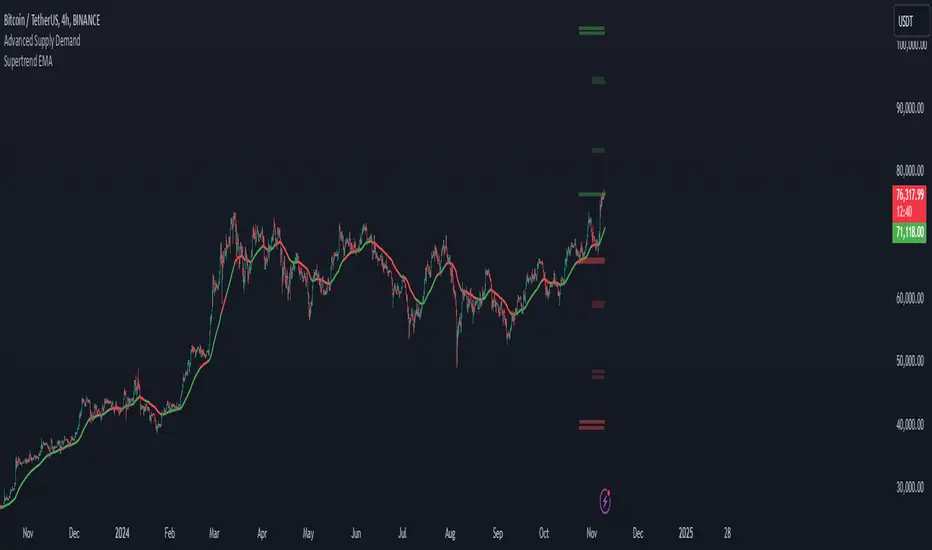
Supertrend EMA & KNNSupertrend EMA & KNN
The Supertrend EMA indicator cuts through the noise to deliver clear trend signals.
This tool is built using the good old Exponential Moving Averages (EMAs) with a novel of machine learning; KNN (K Nearest Neighbors) breakout detection method.
Key Features:
Effortless Trend Identification: Supertrend EMA simplifies trend analysis by automatically displaying a color-coded EMA. Green indicates an uptrend, red signifies a downtrend, and the absence of color suggests a potential range.
Dynamic Breakout Detection: Unlike traditional EMAs, Supertrend EMA incorporates a KNN-based approach to identify breakouts. This allows for faster color changes compared to standard EMAs, offering a more dynamic picture of the trend.
Customizable Parameters: Fine-tune the indicator to your trading style. Adjust the EMA length for trend smoothing, KNN lookback window for breakout sensitivity, and breakout threshold for filtering noise.
A Glimpse Under the Hood:
Dual EMA Power: The indicator utilizes two EMAs. A longer EMA (controlled by the "EMA Length" parameter) provides a smooth trend direction, while a shorter EMA (controlled by the "Short EMA Length" parameter) triggers color changes, aiming for faster response to breakouts.
KNN Breakout Detection: This innovative feature analyzes price action over a user-defined lookback period (controlled by the "KNN Lookback Length" parameter) to identify potential breakouts. If the price surpasses a user-defined threshold (controlled by the "Breakout Threshold" parameter) above the recent highs, a green color is triggered, signaling a potential uptrend. Conversely, a breakdown below the recent lows triggers a red color, indicating a potential downtrend.
Trading with Supertrend EMA:
Ride the Trend: When the indicator displays green, look for long (buy) opportunities, especially when confirmed by bullish price action patterns on lower timeframes. Conversely, red suggests potential shorting (sell) opportunities, again confirmed by bearish price action on lower timeframes.
Embrace Clarity: The color-coded EMA provides a clear visual representation of the trend, allowing you to focus on price action and refine your entry and exit strategies.
A Word of Caution:
While Supertrend EMA offers faster color changes than traditional EMAs, it's important to acknowledge a slight inherent lag. Breakout detection relies on historical data, and there may be a brief delay before the color reflects a new trend.
To achieve optimal results, consider:
Complementary Tools: Combine Supertrend EMA with other indicators or price action analysis for additional confirmation before entering trades.
Solid Risk Management: Always practice sound risk management strategies such as using stop-loss orders to limit potential losses.
Supertrend EMA is a powerful tool designed to simplify trend identification and enhance your trading experience. However, remember, no single indicator guarantees success. Use it with a comprehensive trading strategy and disciplined risk management for optimal results.
Disclaimer:
While the Supertrend EMA indicator can be a valuable tool for identifying potential trend changes, it's important to note that it's not infallible. Market conditions can be highly dynamic, and indicators may sometimes provide false signals. Therefore, it's crucial to use this indicator in conjunction with other technical analysis tools and sound risk management practices. Always conduct thorough research and consider consulting with a financial advisor before making any investment decisions.
Futures Beta Overview with Different BenchmarksBeta Trading and Its Implementation with Futures
Understanding Beta
Beta is a measure of a security's volatility in relation to the overall market. It represents the sensitivity of the asset's returns to movements in the market, typically benchmarked against an index like the S&P 500. A beta of 1 indicates that the asset moves in line with the market, while a beta greater than 1 suggests higher volatility and potential risk, and a beta less than 1 indicates lower volatility.
The Beta Trading Strategy
Beta trading involves creating positions that exploit the discrepancies between the theoretical (or expected) beta of an asset and its actual market performance. The strategy often includes:
Long Positions on High Beta Assets: Investors might take long positions in assets with high beta when they expect market conditions to improve, as these assets have the potential to generate higher returns.
Short Positions on Low Beta Assets: Conversely, shorting low beta assets can be a strategy when the market is expected to decline, as these assets tend to perform better in down markets compared to high beta assets.
Betting Against (Bad) Beta
The paper "Betting Against Beta" by Frazzini and Pedersen (2014) provides insights into a trading strategy that involves betting against high beta stocks in favor of low beta stocks. The authors argue that high beta stocks do not provide the expected return premium over time, and that low beta stocks can yield higher risk-adjusted returns.
Key Points from the Paper:
Risk Premium: The authors assert that investors irrationally demand a higher risk premium for holding high beta stocks, leading to an overpricing of these assets. Conversely, low beta stocks are often undervalued.
Empirical Evidence: The paper presents empirical evidence showing that portfolios of low beta stocks outperform portfolios of high beta stocks over long periods. The performance difference is attributed to the irrational behavior of investors who overvalue riskier assets.
Market Conditions: The paper suggests that the underperformance of high beta stocks is particularly pronounced during market downturns, making low beta stocks a more attractive investment during volatile periods.
Implementation of the Strategy with Futures
Futures contracts can be used to implement the betting against beta strategy due to their ability to provide leveraged exposure to various asset classes. Here’s how the strategy can be executed using futures:
Identify High and Low Beta Futures: The first step involves identifying futures contracts that have high beta characteristics (more sensitive to market movements) and those with low beta characteristics (less sensitive). For example, commodity futures like crude oil or agricultural products might exhibit high beta due to their price volatility, while Treasury bond futures might show lower beta.
Construct a Portfolio: Investors can construct a portfolio that goes long on low beta futures and short on high beta futures. This can involve trading contracts on stock indices for high beta stocks and bonds for low beta exposures.
Leverage and Risk Management: Futures allow for leverage, which means that a small movement in the underlying asset can lead to significant gains or losses. Proper risk management is essential, using stop-loss orders and position sizing to mitigate the inherent risks associated with leveraged trading.
Adjusting Positions: The positions may need to be adjusted based on market conditions and the ongoing performance of the futures contracts. Continuous monitoring and rebalancing of the portfolio are essential to maintain the desired risk profile.
Performance Evaluation: Finally, investors should regularly evaluate the performance of the portfolio to ensure it aligns with the expected outcomes of the betting against beta strategy. Metrics like the Sharpe ratio can be used to assess the risk-adjusted returns of the portfolio.
Conclusion
Beta trading, particularly the strategy of betting against high beta assets, presents a compelling approach to capitalizing on market inefficiencies. The research by Frazzini and Pedersen emphasizes the benefits of focusing on low beta assets, which can yield more favorable risk-adjusted returns over time. When implemented using futures, this strategy can provide a flexible and efficient means to execute trades while managing risks effectively.
References
Frazzini, A., & Pedersen, L. H. (2014). Betting against beta. Journal of Financial Economics, 111(1), 1-25.
Fama, E. F., & French, K. R. (1992). The cross-section of expected stock returns. Journal of Finance, 47(2), 427-465.
Black, F. (1972). Capital Market Equilibrium with Restricted Borrowing. Journal of Business, 45(3), 444-454.
Ang, A., & Chen, J. (2010). Asymmetric volatility: Evidence from the stock and bond markets. Journal of Financial Economics, 99(1), 60-80.
By utilizing the insights from academic literature and implementing a disciplined trading strategy, investors can effectively navigate the complexities of beta trading in the futures market.

Demand and Supply Conditions with SignalsIntroduction:
This document outlines a trading strategy that utilizes price action analysis and color signals to make informed trading decisions. The strategy focuses on identifying demand and supply conditions, curve patterns, and generating signals based on historical price data. The colors associated with each condition and signal serve as visual indicators to assist in decision-making.
I. Strategy Overview:
Objective:
The objective of this trading strategy is to identify potential trading opportunities based on price action analysis and color signals.
Key Components:
Demand Condition: A green upward-facing triangle indicates a potential demand condition.
Supply Condition: A red downward-facing triangle indicates a potential supply condition.
Curve Pattern Condition: A blue upward-facing triangle indicates a potential curve pattern condition.
Signal Condition: A yellow upward-facing triangle indicates a potential buy signal.
II. Understanding the Colors:
* Green: Represents the demand condition, which suggests potential buying pressure in the market. A green upward-facing triangle is plotted on the chart when the demand condition is met at a specific candle or bar.
* Red: Represents the supply condition, which suggests potential selling pressure in the market. A red downward-facing triangle is plotted on the chart when the supply condition is met at a specific candle or bar.
* Blue: Represents the curve pattern condition, which suggests the presence of a specific pattern based on price action analysis. A blue upward-facing triangle is plotted on the chart when the curve pattern condition is met at a specific candle or bar.
* Yellow: Represents the signal condition, which is a combination of the demand condition and the curve pattern condition. A yellow upward-facing triangle is plotted on the chart when the signal condition is met at a specific candle or bar, indicating a potential buy signal.
III. Decision-Making Process:
* Demand and Supply Conditions: Identify potential buying opportunities when a green demand condition is present. Consider potential selling opportunities when a red supply condition is present. Use these conditions to assess the overall market sentiment and potential price reversals.
* Curve Patterns: Analyze the presence of blue curve pattern conditions to identify specific price patterns. These patterns can provide additional confirmation for potential trading decisions.
* Signal Condition: Pay attention to the yellow signal condition, which indicates a potential buy signal. Evaluate the overall market context and consider entering a buy position when the signal condition is met.
* Risk Management: Implement proper risk management techniques such as setting stop-loss orders and position sizing to protect against potential losses.
IV. Conclusion:
This trading strategy leverages price action analysis and color signals to identify potential trading opportunities. The colors associated with each condition and signal serve as visual aids to highlight specific points on the chart. It's important to thoroughly backtest and validate the strategy before applying it to real-world trading scenarios. Additionally, always consider market conditions, risk management, and individual trading preferences when making trading decisions.
Disclaimer: Trading involves risks, and this document does not guarantee profitable outcomes. Traders should exercise caution and perform their own due diligence before engaging in any trading activity.
Remember to continually review and adapt your trading strategy based on market conditions and personal experiences to enhance its effectiveness.

Parabolic SAR Crosses_AITIndicator Name: Parabolic SAR Crosses_AIT
Purpose:
This indicator utilizes the Parabolic SAR to track price trends and generate buy (long) and sell (short) signals when the price crosses the Parabolic SAR line. The indicator is designed to help traders identify trend direction and potential trend reversals on the price chart.
Indicator Overview:
Indicator Parameters:
Parabolic SAR: The default settings for the Parabolic SAR are:
Step: 0.02
Maximum: 0.2 These values can be adjusted by the user to control the sensitivity of the SAR.
Signal Conditions:
Buy Signal (Long): A buy signal is generated when the price crosses above the Parabolic SAR line.
Sell Signal (Short): A sell signal is generated when the price crosses below the Parabolic SAR line.
How It Works:
Buy Signal:
When the price crosses above the Parabolic SAR line, it indicates a potential upward trend. A yellow triangle (L) will appear below the price bar, signaling a possible long entry.
Sell Signal:
When the price crosses below the Parabolic SAR line, it indicates a potential downward trend. A fuchsia triangle (S) will appear above the price bar, signaling a possible short entry.
Trend Detection:
Green Line: Indicates that the Parabolic SAR is below the price, suggesting an uptrend.
Red Line: Indicates that the Parabolic SAR is above the price, suggesting a downtrend.
Trend Reversal:
A trend reversal occurs when the Parabolic SAR switches positions relative to the price. This can be used to exit positions or enter positions in the opposite direction.
Customization:
Step Size: The step parameter controls how sensitive the Parabolic SAR is to price changes. A smaller step value (e.g., 0.01) makes the SAR less sensitive, while a larger step value (e.g., 0.05) makes it more sensitive.
Maximum: The maximum value defines the upper limit for the acceleration factor in the SAR calculation. A higher value allows the SAR to track the price more closely, while a lower value smooths the trend.
Visual Representation:
The Parabolic SAR line is plotted directly on the price chart as a solid line, using the appropriate colors (green or red) depending on the trend direction.
Long signals are indicated by small yellow triangles (L) below the price.
Short signals are indicated by small fuchsia triangles (S) above the price.
Usage Tips:
Combining with Other Indicators: While Parabolic SAR is a great tool for identifying trend direction, it may produce false signals in ranging or sideways markets. Combining this indicator with other trend confirmation tools, such as moving averages or the MACD, can improve its reliability.
Adjusting the Step and Maximum Values: In highly volatile markets, it might be useful to reduce the step value to avoid false signals. In more stable, trending markets, increasing the step value can make the SAR more responsive.
Position Management: Parabolic SAR can be used not only to enter trades but also to manage existing positions by acting as a trailing stop-loss. You can use the SAR value as a dynamic stop-loss level, adjusting it as the trend progresses.
Conclusion:
The Parabolic SAR Crosses_AIT indicator helps traders visually identify trend directions and possible trend reversals by plotting the Parabolic SAR directly on the price chart. With customizable settings for sensitivity and signals that indicate long or short positions, this indicator provides a clear and effective method to manage trades based on trend-following strategies.

Position Sizer by VolatilityDescription :
The **Position Sizer by Volatility (PSV)** is an indicator that helps traders determine what percentage of their deposit a position will occupy, taking into account the current market volatility. PSV calculates the range of price movements over recent periods and shows how large this movement is compared to historical data. The lower the value, the lower the volatility, and the smaller the stop-loss required relative to the current price.
Explanation of PSV Parameters:
- ` len ` (Period Length):** This parameter sets the number of candles (bars) on the chart that will be used to calculate volatility. For example, if `len` is set to 250, the indicator will analyze price movements over the last 250 bars. The larger the value, the longer the period used for volatility assessment.
- ` percent ` (Percentile):** This parameter determines how strong price fluctuations you want to account for. For instance, if you set `percent` to 95, the indicator will focus on the 5% of instances where the price range was the largest over the specified period. This helps evaluate volatility during periods of sharp price movements, which may require a larger stop-loss. A higher percentile accounts for rarer but stronger movements, and vice versa.
Heartbeat Momentum Strategy BetaHeartbeat Momentum Strategy Beta
Overview
The Heartbeat Momentum Strategy is an innovative approach to market analysis that draws inspiration from the rhythmic patterns of a heartbeat. This strategy aims to identify significant momentum shifts in the market by comparing short-term and long-term moving averages, analogous to detecting irregularities in a heartbeat.
Key Concepts
Market Heartbeat: The difference between short-term and long-term moving averages, representing the market's current 'pulse'.
Heartbeat Volatility: Measured by the standard deviation of the market heartbeat.
Momentum Signals: Generated when the heartbeat deviates significantly from its normal range.
How It Works
Calculates a short-term moving average (default 5 periods) and a long-term moving average (default 20 periods) of the closing price.
Computes the 'heartbeat' by subtracting the long-term MA from the short-term MA.
Measures the volatility of the heartbeat using its standard deviation over the long-term period.
Generates buy signals when the heartbeat exceeds 2 standard deviations above its mean.
Generates sell signals when the heartbeat falls 2 standard deviations below its mean.
Indicator Components
Blue Line: Short-term moving average
Red Line: Long-term moving average
Green Triangles: Buy signals
Red Triangles: Sell signals
Background Color: Light green during buy signals, light red during sell signals
Strategy Parameters
Short MA Window: The period for the short-term moving average (default: 5)
Long MA Window: The period for the long-term moving average (default: 20)
Standard Deviation Threshold: The number of standard deviations to trigger a signal (default: 2.0)
Interpretation
Buy Signal: Indicates a potential strong upward momentum shift. Consider opening long positions or closing short positions.
Sell Signal: Suggests a potential strong downward momentum shift. Consider opening short positions or closing long positions.
No Signal: The market is moving within its normal rhythm. Maintain current positions or look for other entry opportunities.
Customization
Users can adjust the strategy parameters to suit different assets, timeframes, or trading styles:
Decrease the MA windows for more frequent signals (more suitable for shorter timeframes).
Increase the MA windows for fewer, potentially more significant signals (better for longer timeframes).
Adjust the Standard Deviation Threshold to fine-tune sensitivity (lower for more signals, higher for fewer but potentially stronger signals).
Risk Management
While this strategy can provide valuable insights into market momentum, it should not be used in isolation:
Always use stop-loss orders to manage potential losses.
Consider the overall market context and other technical/fundamental factors.
Be aware of potential false signals, especially in ranging or highly volatile markets.
Backtest and forward-test the strategy with different parameters before live trading.
Conclusion
The Heartbeat Momentum Strategy offers a unique perspective on market movements by treating price action like a heartbeat. By identifying significant deviations from the normal market rhythm, it aims to capture strong momentum shifts while filtering out market noise. As with any trading strategy, use it as part of a comprehensive trading plan and always practice sound risk management.
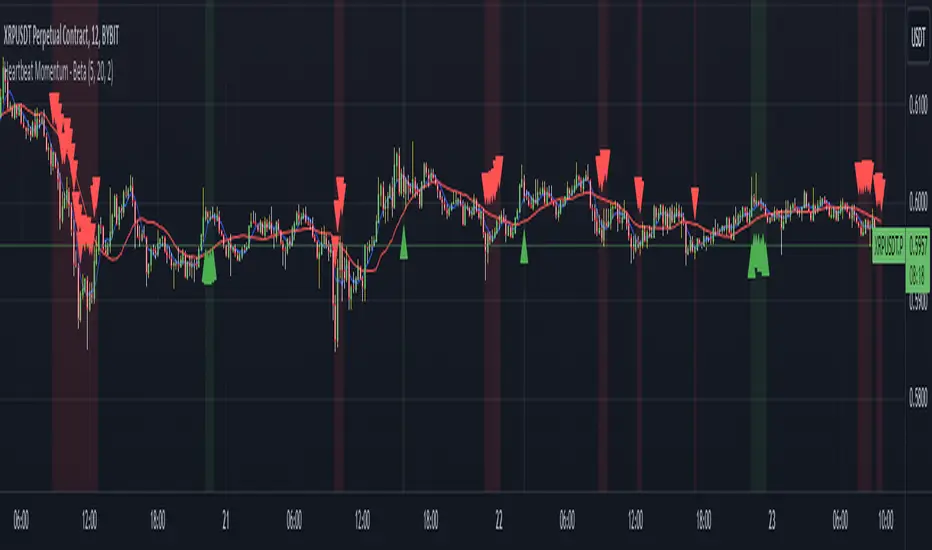
Three Drive Pattern Detector [LuxAlgo]The Three Drives Pattern Detector indicator focuses on detecting and displaying completed Three Drives patterns on the user chart. This harmonic pattern is characterized by successive higher highs / lower lows following specific ratios.
The script uses a multi-length swing detection approach, as well as adjusting ratios to ensure flexibility and a maximum number of visible Three Drives patterns.
🔶 USAGE
The bullish/bearish Three Drives pattern is commonly interpreted as a reversal pattern and is characterized by three extensions (drives) and two intermediary retracements creating consecutive higher lows (for a bullish case) or lower highs (for a bearish case).
The multi-length swing detection approach taken by the indicator allows for detecting shorter-term alongside medium/longer-term patterns simultaneously, allowing to increase in the amount of detected patterns.
Users can set a Minimum Swing length (for example 2) and a Maximum Swing length (for example 100) which defines the range of the swing point detection length, higher values for these settings will detect longer-term Three-Drives patterns, while a larger range will allow for the detection of a larger number of patterns.
Sometimes multiple dashed lines as the last segment can be observed. This means multiple Three Drives patterns sharing multiple swing points have formed, with only the last segment being different.
🔹 Retracement/Extension Ratios
The Three Drives pattern often associates the retracement/extension to Fibonacci ratios of respectively 0.618/1.272.
Some sources specify a maximum retracement/extension level of 0.786/1.618, which means the retracement should be within the 0.618-0.786 range and the extension between 1.272-1.618.
Since finding a pattern where the retracement/extension is precisely at the 0.618/1.272 levels, or even between 0.618-0.786/1.272-1.618 is rare, the script allows users to adjust those ratios, which ensures more flexibility. Depending on the widening/tightening of the ratios, allowing users to find more patterns (but potentially less valid) or more valid (but fewer patterns).
In the example above, " Show Ratios " is set to " Ratios With Margin ", showing the ideal retracement/extension level together with the margin, while in the example below, " Show Ratios " is set to " Ratios ", which shows only a line where the price should ideally reverse.
While setting the ratios wider will result in more frequent but less valid patterns, it can also create good trading opportunities.
🔹 Best Practices
The indicator doesn't include Stop Loss (SL) or Take Profit (TP) levels, however, the 1.618 Fibonacci Extension level of the last leg can commonly be used as stop loss.
Typical Take Profit areas include:
Starting point of the pattern
Each retracement level (2x)
The 0.618 retracement level of the complete pattern
In the above bullish examples, the price was lower than the lowest point of the pattern. The price reversed and attained all TP levels without hitting the SL level.
In the above bearish example, the price went above the highest point of the pattern but did not hit the SL level, after which two TP levels were hit. Then, the price quickly went up, just missing the SL level before it came back down again, hitting the last 2 TP levels.
This example shows that other Fibonacci levels an also be effective when combined with the Three Drives pattern, even in the longer term.
🔶 DETAILS
🔹 Multi Length
The core of this publication is the multi-length swing detection. To ensure the maximum amount of Three Drives patterns are found, up to 99 different swing length periods can be used to detect swing points which are then tested for valid patterns.
Using a wider variety of swing points also ensures that patterns visible only with specific Swing settings can be found on the same chart without the user needing to constantly adjust the Swing settings to find other patterns.
The user only needs to set the desired minimum and maximum Swing Length.
In this case, swing detection using swing Lengths from 3 to 100 (97 different) are computed and evaluated for patterns. Three different patterns were found on the same chart, with swing lengths 3, 4, and 6.
Note: The Maximum Swing length should be equal to or higher than the Minimum Swing Length . If the maximum value is lower than the minimum, the script will automatically take the minimum value as the maximum to prevent errors.
🔹 Width Margin %
Users can filter out patterns based on the duration of each extension/retracement segment. When the users want segments of the detected patterns to be of a similar duration, the width percentage should be set lower. When the focus is on detecting more patterns the width percentage can be set higher.
🔹 Retracement/Extension Settings
Show Ratios , set to Ratios , show the ideal Fibonacci retracement/extension level, while Ratios With Margin (example below) show the additional margins for retracement/extension.
The upper and lower limits can be visualized while hovering over the calculated ratio label.
The dashed line shows an older pattern, where the last leg has been updated.
🔹 Last Known Pattern
The included dashboard highlights the date of the most recently detected pattern; the text will show " None " if no pattern is found.
🔹 Calculated Bars
The "Calculated Bars" setting makes use of the recently introduced calc_bars_count parameter, making it possible to effectively reduce the number of historical bars during the computation of the script, which significantly improves the loading speed of the script.
Users wishing to see the most recent patterns can set this setting to 1000 for example, where only the most recent 1000 bars are used to find patterns. If every bar must be used for pattern detection, set " Calculated bars " at 0.
🔶 SETTINGS
Minimum Swing Length: Minimum length used for the swing detection.
Maximum Swing Length: Maximum length used for the swing detection.
Retracement: Range of required ratios used for testing retracements.
Extension: Range of required ratios used for testing extensions.
Width Margin: Influences the symmetry of the pattern; with a higher number allowing for less symmetry.
🔹 Style
Text Size: Text size of the ratio labels.
Show Ratios: Show the ideal ratio, upper/lower limit of ratios, or none.
🔹 Dashboard
Show Dashboard: Toggle dashboard which shows the date of the last found pattern.
Location: Location of the dashboard on the chart.
Size: Text size.
🔹 Calculation
Calculated Bars: Allows the usage of fewer bars for performance/speed improvement.

ADR (Log Scale) with MTF LabelsHere's a detailed presentation of the Average Daily Range (ADR) indicator, with a focus on its advantages compared to the classic ADR, its unique features, utility, and interpretation:
Advantages Compared to Classic ADR
1. Logarithmic Scale: Unlike the classic ADR, which uses a linear scale, this version uses a logarithmic scale for calculations. This approach provides a more accurate representation of relative price movements, especially for assets with large price ranges.
2. Multi-Timeframe Analysis: This enhanced ADR indicator allows traders to view daily, weekly, and monthly ADRs simultaneously. This multi-timeframe capability helps traders understand volatility trends over different periods, offering a more comprehensive market analysis.
3. Optional Smoothing: The inclusion of an optional smoothing feature (using Exponential Moving Average, EMA) helps reduce noise in the data. This makes the indicator more reliable by filtering out short-term fluctuations and highlighting the underlying volatility trend.
4. Information Display Labels: The indicator includes labels that display precise ADR values for each timeframe directly on the chart. This feature provides immediate, clear insights without requiring additional calculations or references.
Utility of the Indicator
1. Volatility Analysis: The ADR indicator is essential for assessing market volatility. By showing the average daily price range, it helps traders gauge how much an asset typically moves within a day, week, or month.
2. Risk Management: ADR levels can be used to set stop-loss points, improving risk management strategies. Knowing the average range helps traders avoid setting stops too close to the current price, which might otherwise be triggered by normal market fluctuations.
3. Setting Realistic Targets: By understanding the average daily range, traders can set more realistic profit targets. This helps in avoiding over-ambitious goals that are unlikely to be reached within the typical market movement.
4. Identifying Entry and Exit Points: The ADR can signal potential entry and exit points. For example, if the price approaches the upper or lower ADR boundary, it might indicate an overbought or oversold condition, respectively.
Interpretation and Examples
1. Increasing Volatility: If the ADR is increasing, it indicates rising market volatility. Traders might adjust their strategies accordingly, such as widening their stop-losses to accommodate larger price swings.
2. Range Breakout: If the price significantly exceeds the daily ADR, it may signal a strong trend or exceptional market movement. Traders can use this information to stay in the trade longer or to anticipate a potential reversal.
3. Mean Reversion: Prices often revert to the ADR mean. A trader might consider mean reversion trades when the price approaches the extremes of the ADR range, expecting it to move back towards the average.
4. Multi-Timeframe Comparison: If the daily ADR is higher than the weekly ADR, it may indicate unusually high short-term volatility. This can be a signal for traders to be cautious or to capitalize on the increased movement.
While the ADR indicator provides valuable insights into market volatility and can significantly enhance trading strategies, it is essential to remember that no indicator is foolproof. Market conditions can change rapidly, and past performance is not always indicative of future results. Traders should use the ADR indicator in conjunction with other tools and follow sound risk management practices to protect their capital.

Prometheus Polarized Fractal Efficiency (PFE)This indicator uses market data to calculate Polarized Fractal Efficiency (PFE) on an asset, so traders can have a better idea of which direction it may go.
Users can control the lookback length for the fractal calculation, the lookback length for the Exponential Moving Average (EMA), and whether or not to display lines at the -50 and 50 level, or -25 and 25 level.
Polarized Fractal Efficiency:
The Polarized Fractal Efficiency (PFE) indicator is a value between -100 and 100 with 0 as a midpoint.
A PFE above 0 indicates the asset may trend higher, a PFE below 0 indicates the asset may trend lower.
There are many ways to trade with PFE, the intuitive trend riding as described above, or reversals.
Even when the PFE is above 0, if it gets high enough, it may also be an indication of a reversal. A PFE of 90 - 100, or -100 - -90, may indicate price is ready to revert the other direction. Furthermore, traders already in a position may look to breaks of other levels to be their take profit or stop out spot.
Calculation:
Pi = 100 x (Price - Price )2 + N2 / Summation, j= 0, to N-2 (Price - Price )2 + 1
If Close < Close Pi = -Pi
PFEi = EMA(Pi, M)
Where:
N = period of indicator
M = smoothing period
Citation: www.investopedia.com
Scenarios:
Inputs are (9, 5) and every display option is on.
Trend example
Step 1: A short trade appears as PFE crosses below -25. We reach a safe take profit as PFE crosses below -50. Traders can use these levels to exit as well as enter.
Step 2: On the cross above 25 there is a safe long. As the PFE value breaks 0 a safe, early take profit could be appropriate for this trade. No guarantee we would see 50.
Step 3: Long scenario at break of 25, straight to 50. Simple, straightforward setup.
Step 4: This long results in a stop loss. Once again entry as PFE crosses 25, but as we cross the 0 line it is for a loss.
Step 5: The last trade in this example is reminiscent of step 3. This is a short trade entry at break of 25 and exit at break of 50.
Traders have liberty to use the PFE value to determine spots to enter and exit trades, long or short. 25 and 50 were chosen arbitrarily, values like 10 and 60 may work as well, we encourage traders to use their own discretion along with tools.
Reversal example
Step 1: PFE is around -100, crossing below it at one point! Strong zone for a potential reversal.
Step 2: PFE crosses above 25 adding conviction.
Step 3: Option to exit at 70.
Step 4: Option to exit at 90.
There is no “one size fits all method”, this approach may be more intuitive for some users and is just as feasible as the first.
Longer trend example
Step 1: Using -50 and 50 this time instead of -25 and 25 to be safer on our entries we see a short here. Was a good entry and as the value gets closer to -70 we can safely close.
Step 2: On this candle we see a long for the break of 50. On the next candle we break the 0 line, but because of our safe entry at 50, we could hold this and only stop out at a break of -25. We get close but stay in it and close at 70.
Step 3: Break of 50 for a long once again. This time the break of 0 line occurs as we are in profit, not letting a green trade go red is a golden rule of trading, so an early exit here.
Step 4: Same at step 2, break of 50 to long and stay in it, not stopping out at break of 0 line. The PFE value eventually reaches 70 and there is a good exit.
Quicker Reversal example
Step 1: Notice a close with PFE below -90, enter long for the reversal. Then close for profit when the PFE crosses above 70.
Step 2: When the PFE breaks above 90 we have a short entry. Like the long closing it when it crosses below -70.
Step 3: This step is the same setup as step 2. As PFE breaks above 90 we have a short entry. Closing it when it crosses below -70.
Recap:
Described above are 4 different examples with many different trades. Both trend and reversal trades. The PFE value is an indicator that can be used by traders in many different ways and Prometheus encourages traders to use their own discretion along with tools and not follow indicators blindly.
Options:
Users can control the input for the lookback of the indicator. The default is 9.
The smoothing factor for the EMA is also changeable, default is 5.
Users have options to display lines at -50, -25, 25, and 50.

Relative Strength Index(RSI)- Range (60-40)Custom RSI Indicator:
The Custom RSI Indicator is a technical analysis tool designed to assess the momentum of a financial instrument's price movements within a specified range. Unlike the traditional RSI, which typically operates within a range of 0 to 100, this customized version focuses on a narrower spectrum between 40 and 60, providing clearer signals for traders.
Key Features:
Bullish and Bearish Zones: The indicator delineates between bullish and bearish sentiment. When the RSI value climbs above 60, it signals bullish momentum, indicating potential uptrends in the price. Conversely, when the RSI dips below 40, it suggests bearish sentiment, signaling potential downtrends.
Overbought and Oversold Conditions: Additionally, the Custom RSI Indicator identifies extreme market conditions. When the RSI surpasses 80 , it denotes overbought territory, suggesting that the asset may be overvalued and prone to a reversal or correction. Conversely, when the RSI falls below 30 , it indicates oversold conditions, suggesting that the asset may be undervalued and ripe for a potential rebound.
Default RSI Comparison: The Custom RSI Indicator can be compared against the traditional RSI for added context. While the customized range provides more precise signals within the 60-40 spectrum, referencing the default RSI can offer broader insights into market dynamics.
Usage:
Trend Identification: Traders can utilize the Custom RSI Indicator to identify potential trend reversals or continuations based on shifts in momentum within the specified range.
Confirmation Tool: It can serve as a confirmation tool alongside other technical indicators or price action analysis, enhancing the overall reliability of trading decisions.
Risk Management: By recognizing overbought and oversold conditions, traders can implement risk management strategies such as setting stop-loss orders or adjusting position sizes to mitigate potential losses.
Conclusion:
The Custom RSI Indicator offers traders a focused perspective on market momentum within the 60-40 range, facilitating more accurate assessments of bullish and bearish sentiment as well as identifying extreme market conditions. By incorporating this tool into their analysis, traders can make informed decisions and potentially improve their trading outcomes.

Order Blocks Indicator [TradingFinder] Lightning|CHOCH |OB | BOS🔵 Introduction
In "Price Action," an "Order Block" is essentially an area on the price chart where significant players such as institutional traders have executed their moves by placing noteworthy orders. These points often indicate areas where price either attempts to break through (resistance) or returns when it reaches there (support).
Therefore, when discussing the identification of order blocks, we typically refer to finding points where the price has stalled for a while and has accumulated strength before making a significant move in one direction.
Essentially, order blocks assist traders in understanding where large players with "smart money" have likely placed their bulk orders in the market. Traders use these order blocks as part of their overall analysis to identify probable levels where price may change direction.
This version of the order block indicator is designed for traders, adding many indicators to their charts. The minimal design helps minimize disruptions to user focus.
🔵 Identification of Order Blocks
To identify order blocks, first, a "Level Break" must occur. To identify a "Demand Zone," a "High Level Break" is required, and to identify a "Supply Zone," a "Low Level Break" is needed.
Demand Zone :
Supply Zone :
🔵 "Change of Character" or "Market Shift Structure"
"ChoCh" or "MSS" is the "Break Level" that is contrary to the previous trend. For example, if a "Bearish Level" is established in the market and consecutive "Low Levels" are being broken, the price turns upward, breaking a "High Level." This break is called "ChoCh" or "MSS."
🔵 "Break of Structure"
"Break of Structure," or "BoS" for short, is the "Break Level" in the direction of the current trend. For example, if a "Bullish Level" is established in the market, when the price breaks a "High Level," a "BoS" has occurred.
🔵 Features
🟣 Major Level
This feature helps you easily identify major levels. These levels form when the price breaks another major level.
🟣 Refine Order Block
The "Refinement" feature allows you to adjust the width of the order block based on your strategy. There are two modes, "Aggressive" and "Defensive," in Order Block Refine. The difference between "Aggressive" and "Defensive" lies in the width of the order block. For "Risk Averse" traders, the "Defensive" mode is suitable because it provides smaller stop losses and larger reward-to-risk ratios. For "Risk Taker" traders, the "Aggressive" mode is more suitable. These traders prefer to enter trades at higher prices and this mode, where the width of the order block is greater, is more suitable for this group of individuals.
🔵 How to Use
After adding the indicator to your chart, you will see a visual similar to the image below. Green order blocks are "Demand Zones" and red order blocks are "Supply Zones." The midpoint of the order blocks also indicates 50% of it.
Refine Order Block is defaulted to On and refines the order blocks. If you want the order blocks to remain original, you should set it to Off.
Refine is defaulted to "Defensive" mode. If you want it to be in "Aggressive" mode, you should change its mode through Refine Type.
Displaying "Major Levels" is turned off by default and to display them, you should set "Show High Level" and "Show Low Level" to "Yes." You can use these lines to identify liquidity or determine stop loss and take profit levels.
