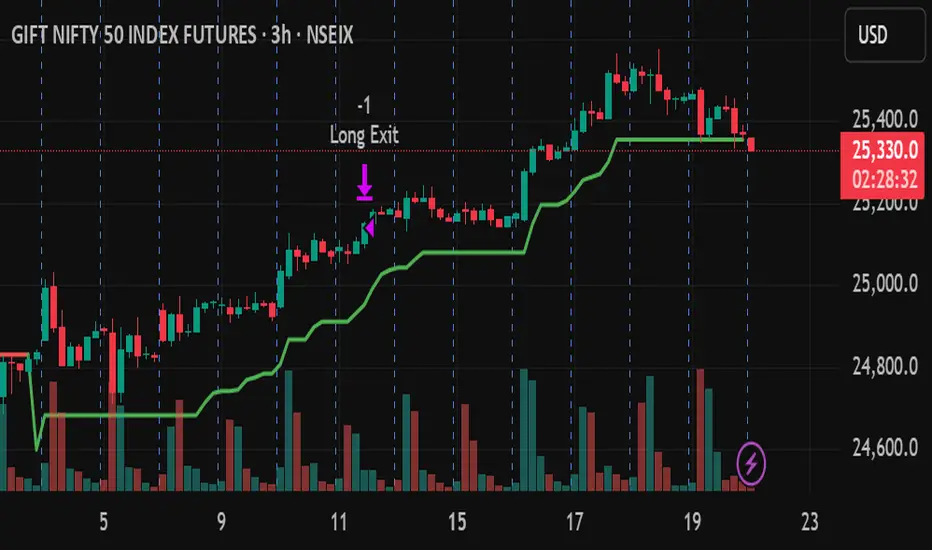
Supertrend 3H Strategy VinaySupertrend 3H Strategy Vinay- Buy or sell using Supertrend, 200 points SL and 400 points targetPine Script® strategyby sailivinay30
Supertrend Trend Change Signals + Covered Points Only (v5)[NR]Supertrend with Buy/Sell Signals + Covered Points (v5) Description This indicator is a custom version of the Supertrend that provides: Buy/Sell signals whenever the trend flips (Up → Buy, Down → Sell). Covered points label at the end of each trend, showing the total price movement captured from entry to exit. Optional colored candles based on trend direction. Visual markers (triangle up/down) for quick identification of flips. Built-in alert conditions for Buy and Sell flips. Use case: Designed for traders who want not only entry/exit alerts but also a quick view of how many points the previous run covered. Especially useful for index futures (e.g., NIFTY, BankNIFTY) or instruments where point movement matters. ⚠ Note: This is a study/indicator, not a strategy. It does not auto-trade and should be combined with your own analysis and risk management.Pine Script® indicatorby Nandakumar33911118
SuperTrend+ UpdatedSuperTrend+ with SL/TP is a technical analysis tool designed to identify market trends and potential trading opportunities. Based on the SuperTrend indicator, it incorporates additional features including stop loss and take profit level calculations. The indicator visually displays uptrends and downtrends through colored lines and background highlighting, making trend direction easy to identify. It generates buy and sell signals when trend reversals are detected, with optional volume filtering to reduce false signals. Key features include customizable ATR parameters, multiple calculation methods for stop loss and take profit levels (ATR-based or fixed percentage), and clear visual markers for entry points and target levels. Ideal for traders looking to identify trend directions and manage risk with predefined exit levels, this indicator works across various timeframes and financial instruments.Pine Script® indicatorby hanliang42650
Multi-timeframe 24 moving averages + BB+SAR+Supertrend+VWAP █ OVERVIEW The script allows to display up to 24 moving averages ("MA"'s) across 5 timeframes plus two bands (Bollinger Bands or Supertrend or Parabolic SAR or VWAP bands) each from its own timeframe. The main difference of this script from many similar ones is the flexibility of its settings: - Bulk enable/disable and/or change properties of several MAs at once. - Save 3 of your frequently used templates as presets using CSV text configurations. █ HOW TO USE Some use examples: In order to "show 31, 50, 200 EMAs and 20, 100, 200 SMAs for each of 1H, 4H, D, W, M timeframes using blue for short MA, yellow for mid MA and red for long MA" use the settings as shown on a screenshot below. In order to "Show a band of chart timeframe MA's of lengths 5, 8, 13, 21, 34, 55, 100 and 200 plus some 1H, 4H, D and W MAs. Be able to quickly switch off the band of chart tf's MAs. For chart timeframe MA's only show labels for 21, 100 and 200 EMAs". You can set TF1 and TF2 to chart's TF and set you fib MAs there and configure fixed higher timeframe MAs using TF3, TF4 and TF5 (e.g. using 1H, D and W timeframes and using 1H 800 in place of 4H 200 MA). However, quicker way may be using CSV - the syntax is very simple and intuitive, see Preset 2 as it comes in the script. You can easily switch chart tf's band of MAs by toggling on/off your chart timeframe TF's (in our example, TF1 and TF2). The settings are either obvious or explained in tooltips. Note 1: When using group settings and CSV presets do not forget that individual setting affected will no have any effect. So, if some setting does not work, check whether it is overridden with some group setting or a CSV preset. Note 2: Sometimes you can notice parts of MA's hanging in the air, not lasting up to the last bar. This is not a bug as explained on this screenshot: █ FOR DEVELOPERS The script is a use case of my CSVParser library, which in turn uses Autotable library, both of which I hope will be quite helpful. Autotable is so powerful and comprehensive that you will hardly ever wish to use normal table functions again for complex tables. The indicator was inspired by Pablo Limonetti's url=https://www.tradingview.com/script/nFs56VUZ/]Multi Timeframe Moving Averages and Raging @RagingRocketBull's # Multi SMA EMA WMA HMA BB (5x8 MAs Bollinger Bands) MAX MTF - RRB Pine Script® indicatorby moebius1977Updated 11223
Profitable Supertrend v0.1 - AlphaThis a script to try detect the best combination of supertrend parameters in a space of time. Sadly the script is slow. Evaluate all possibilities params is hard for a pinescript and my knowledge too. In some cases, when you want evaluate many time could be the script fails for timeout. Perhaps with time I could enhance. For this problem of speed the calculate of combinatios it's not complete: In factor use a increment of 0.2 in each param (0.1, 0.3, 0.5 ...) in period the increment for each value is 3. The range for factor it's from 3.0 to 12.0. The range of period it's from 10 to 43 My knowledge don't let me go more far. Perhaps with time I can enhance the script. Pine Script® indicatorby gnalis66366
Multi Supertrend with no-repaint HTF option strategyThis is the strategy version of the multi supertrend indicator. The RoMDD looks good :) Checked in ETHUSDT 1hour with auto HTF ON. Have a look :)Pine Script® strategyby ramki_simple1414812
Divit Multi SuperTrendthese are all supertrend lines with different settings. green lines indicate uptrend. red line indicates down trend. when all lines are green its very good uptrend - you can buy. when all lines are red its very good downtrend - you can sell. when few lines are red and few are green its not confirmed buy or sell. in this situation you may confirm buy or sell with the help of other indicators. its an easy to use indicator. Pine Script® indicatorby divit250919Updated 1818484
Williams Vix Fix paired with Supertrend HeatmapThis script shows my mod of the powerful Williams' Vix Fix indicator paired with a modified Supertrend Heatmap, originally created by Daveatt. Pine Script® indicatorby capissimoUpdated 1010283
Chiku + SuperTrendTrend-following indicator combining SuperTrend with Chiku breakout from IchimokuPine Script® indicatorby emohilUpdated 22254
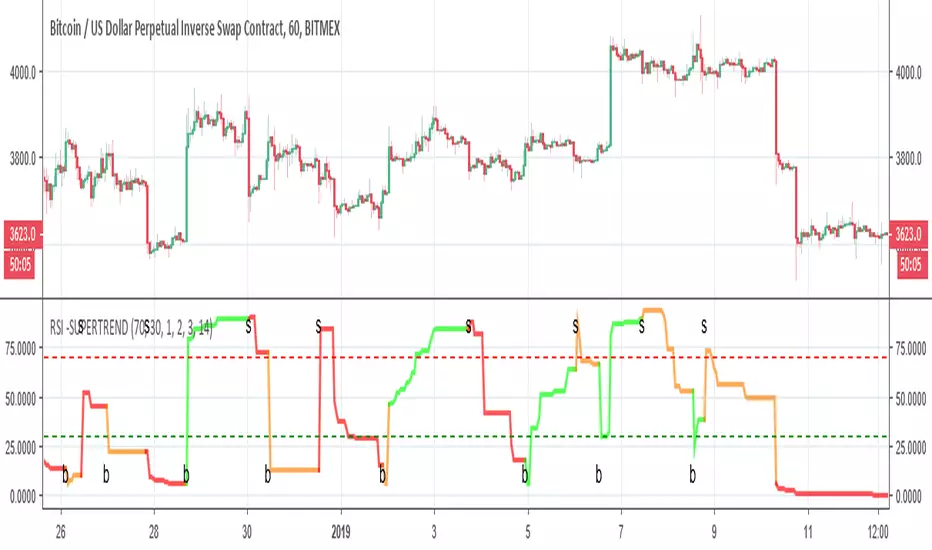
RSI -SUPERTRENDThis is hybrid of Super trend and RSI the green and red zones are by the supertrend so it seems the two indicator can compleemnt each other Pine Script® indicatorby RafaelZioniUpdated 66386
Supertrend Dual Strategy + Rising ADX- supertrend dual strategy fast & slow - check ADX risingPine Script® strategyby bugpigg26
Supertrend + DEMA Strategy ( customised & Switchable, Fixed TP)Supertrend line – a moving line that follows the price and shows whether the market is trending up or down. If the price goes above this line, it usually means the market is going up. If the price goes below, it usually means the market is going down. DEMA (Double Exponential Moving Average) – another line that smooths out price movements to spot trends more clearly. It calculates an average of prices but reacts faster than a normal moving average. Pine Script® strategyby drsawhneyG52
Supertrend + EMA50 — Signal (no labels) chpolSupertrend + EMA50, best for 15 minutes, Forex, Crypto, XAUUSD.Pine Script® indicatorby chpol6
Supertrend adapted to strategy Supertrend from KivancOzbilgic adapted to strategy so people can accurately maximise its profit regardless the asset and time-frame. Hope it helps Pine Script® strategyby rgomescryptoUpdated 1010416
Supertrend/Moving Average IndicatorSupertrend + Moving Average Strategy comboPine Script® indicatorby Zen_Quant227
supertrendLibrary "supertrend" supertrend : Library dedicated to different variations of supertrend supertrend_atr(length, multiplier, atrMaType, source, highSource, lowSource, waitForClose, delayed) supertrend_atr: Simple supertrend based on atr but also takes into consideration of custom MA Type, sources Parameters: length (simple int) : : ATR Length multiplier (simple float) : : ATR Multiplier atrMaType (simple string) : : Moving Average type for ATR calculation. This can be sma, ema, hma, rma, wma, vwma, swma source (float) : : Default is close. Can Chose custom source highSource (float) : : Default is high. Can also use close price for both high and low source lowSource (float) : : Default is low. Can also use close price for both high and low source waitForClose (simple bool) : : Considers source for direction change crossover if checked. Else, uses highSource and lowSource. delayed (simple bool) : : if set to true lags supertrend atr stop based on target levels. Returns: dir : Supertrend direction supertrend : BuyStop if direction is 1 else SellStop supertrend_bands(bandType, maType, length, multiplier, source, highSource, lowSource, waitForClose, useTrueRange, useAlternateSource, alternateSource, sticky) supertrend_bands: Simple supertrend based on atr but also takes into consideration of custom MA Type, sources Parameters: bandType (simple string) : : Type of band used - can be bb, kc or dc maType (simple string) : : Moving Average type for Bands. This can be sma, ema, hma, rma, wma, vwma, swma length (simple int) : : Band Length multiplier (float) : : Std deviation or ATR multiplier for Bollinger Bands and Keltner Channel source (float) : : Default is close. Can Chose custom source highSource (float) : : Default is high. Can also use close price for both high and low source lowSource (float) : : Default is low. Can also use close price for both high and low source waitForClose (simple bool) : : Considers source for direction change crossover if checked. Else, uses highSource and lowSource. useTrueRange (simple bool) : : Used for Keltner channel. If set to false, then high-low is used as range instead of true range useAlternateSource (simple bool) : - Custom source is used for Donchian Chanbel only if useAlternateSource is set to true alternateSource (float) : - Custom source for Donchian channel sticky (simple bool) : : if set to true borders change only when price is beyond borders. Returns: dir : Supertrend direction supertrend : BuyStop if direction is 1 else SellStop supertrend_zigzag(length, history, useAlternativeSource, alternativeSource, source, highSource, lowSource, waitForClose, atrlength, multiplier, atrMaType) supertrend_zigzag: Zigzag pivot based supertrend Parameters: length (simple int) : : Zigzag Length history (simple int) : : number of historical pivots to consider useAlternativeSource (simple bool) alternativeSource (float) source (float) : : Default is close. Can Chose custom source highSource (float) : : Default is high. Can also use close price for both high and low source lowSource (float) : : Default is low. Can also use close price for both high and low source waitForClose (simple bool) : : Considers source for direction change crossover if checked. Else, uses highSource and lowSource. atrlength (simple int) : : ATR Length multiplier (simple float) : : ATR Multiplier atrMaType (simple string) : : Moving Average type for ATR calculation. This can be sma, ema, hma, rma, wma, vwma, swma Returns: dir : Supertrend direction supertrend : BuyStop if direction is 1 else SellStop zupertrend(length, history, useAlternativeSource, alternativeSource, source, highSource, lowSource, waitForClose, atrlength, multiplier, atrMaType) zupertrend: Zigzag pivot based supertrend Parameters: length (simple int) : : Zigzag Length history (simple int) : : number of historical pivots to consider useAlternativeSource (simple bool) alternativeSource (float) source (float) : : Default is close. Can Chose custom source highSource (float) : : Default is high. Can also use close price for both high and low source lowSource (float) : : Default is low. Can also use close price for both high and low source waitForClose (simple bool) : : Considers source for direction change crossover if checked. Else, uses highSource and lowSource. atrlength (simple int) : : ATR Length multiplier (simple float) : : ATR Multiplier atrMaType (simple string) : : Moving Average type for ATR calculation. This can be sma, ema, hma, rma, wma, vwma, swma Returns: dir : Supertrend direction supertrend : BuyStop if direction is 1 else SellStop zsupertrend(zigzagpivots, history, source, highSource, lowSource, waitForClose, atrMaType, atrlength, multiplier) zsupertrend: Same as zigzag supertrend. But, works on already calculated array rather than Calculating fresh zigzag Parameters: zigzagpivots (array) : : Precalculated zigzag pivots history (simple int) : : number of historical pivots to consider source (float) : : Default is close. Can Chose custom source highSource (float) : : Default is high. Can also use close price for both high and low source lowSource (float) : : Default is low. Can also use close price for both high and low source waitForClose (simple bool) : : Considers source for direction change crossover if checked. Else, uses highSource and lowSource. atrMaType (simple string) : : Moving Average type for ATR calculation. This can be sma, ema, hma, rma, wma, vwma, swma atrlength (simple int) : : ATR Length multiplier (simple float) : : ATR Multiplier Returns: dir : Supertrend direction supertrend : BuyStop if direction is 1 else SellStopPine Script® libraryby Trendoscope23
SuperTrendSAP1212This indicator combines Supertrend, VWAP with bands, and an optional RSI filter to generate Buy/Sell signals. How it works Supertrend Flip (ATR-based): Detects when trend direction changes (from bearish to bullish, or bullish to bearish). VWAP Band Filter: Signals only trigger if the candle close is beyond the VWAP bands: Buy = Supertrend flips up AND close > VWAP Upper Band Sell = Supertrend flips down AND close < VWAP Lower Band Optional RSI Filter: Buy requires RSI < 20 Sell requires RSI > 80 Can be enabled/disabled in settings. Features Choice of VWAP band calculation mode: Standard Deviation or ATR. Adjustable ATR/StDev length and multiplier for VWAP bands. Toggle Supertrend, VWAP lines, and Buy/Sell labels. Alerts included: add alerts on BUY or SELL conditions (use Once Per Bar Close to avoid intrabar signals). Use Works best on intraday or higher timeframes where VWAP is relevant. Use the RSI filter for more selective signals. Can be combined with your own stop-loss and risk management rules. ⚠️ Disclaimer: This script is for educational and research purposes only. It is not financial advice. Always test thoroughly and trade at your own risk.Pine Script® indicatorby InvestingIsBoring57
Supertrend0913This Pine Script (`@version=6`) combines **two Supertrend indicators** and a set of **moving averages (EMA & MA)** into one overlay chart tool for TradingView. **Key features:** * **Supertrend \ & \ :** * Each has independent ATR period, multiplier, and ATR calculation method. * Plots trend lines (green/red for \ , blue/yellow for \ ). * Generates **buy/sell signals** when trend direction changes. * Includes **alert conditions** for buy, sell, and trend reversals. * **Moving Averages:** * 6 EMAs (lengths 21, 55, 100, 200, 300, 400). * 5 SMAs (lengths 11, 23, 25, 39, 200). * Each plotted in different colors for trend visualization. 👉 In short: it’s a **combined trading tool** that overlays two configurable Supertrend systems with alerts plus multiple EMAs/SMAs to help identify trend direction, signals, and potential entry/exit points. Pine Script® indicatorby zxin05215
Supertrend3n1it combines the 3 super trend indicator values to save space for more indicators in the chart , and it works perfectly with the stochastic RSI indicator Pine Script® indicatorby SultanHakeem44852
MTF Dual Supertrend with Bands and PivotSUPERTREND WITH UPPER AND LOWER BANDS + PIVOT POINTS + MULTI-TIMEFRAME - INDICATOR DESCRIPTION OVERVIEW: This Pine Script indicator combines the SuperTrend technical analysis tool with visible upper and lower bands, standard daily pivot points, AND a second SuperTrend from a different timeframe. SuperTrend is a trend-following indicator that helps traders identify the current market direction and potential entry/exit points, while pivot points provide key support and resistance levels. The multi-timeframe feature allows you to see trends from different time perspectives simultaneously. HOW IT WORKS: The indicator uses the Average True Range (ATR) to calculate dynamic support and resistance bands around the price: 1. BASIC BANDS CALCULATION: - Upper Band = HL2 + (ATR × Multiplier) - Lower Band = HL2 - (ATR × Multiplier) - HL2 = (High + Low) / 2 2. FINAL BANDS ADJUSTMENT: - Bands are adjusted based on price movement to create a trailing stop mechanism - Upper band only moves down or stays flat when price is above it - Lower band only moves up or stays flat when price is below it 3. SUPERTREND LINE: - Switches between upper and lower bands based on price crossovers - When price is above the SuperTrend line = UPTREND (green) - When price is below the SuperTrend line = DOWNTREND (red) 4. STANDARD PIVOT POINTS: - Calculated based on previous day's High, Low, and Close - Pivot Point (PP) = (High + Low + Close) / 3 - Resistance levels: R1, R2, R3 (calculated above PP) - Support levels: S1, S2, S3 (calculated below PP) - These levels act as potential support/resistance zones 5. SECOND SUPERTREND (MULTI-TIMEFRAME): - Displays a second SuperTrend from a different timeframe (default: 60 minutes/1 hour) - Customizable timeframe - choose from 1min, 5min, 15min, 30min, 60min, 240min, Daily, Weekly, etc. - Independent ATR period and multiplier settings - Shows its own upper and lower bands (purple color) - Color-coded SuperTrend line (lime for uptrend, orange for downtrend) - Helps identify alignment between different timeframes - Can be enabled/disabled via settings - Bands can be toggled separately KEY FEATURES: ✓ Visual upper and lower bands showing the ATR-based zones (blue) ✓ Color-coded SuperTrend line (green for uptrend, red for downtrend) ✓ Second SuperTrend from custom timeframe with its own bands (purple) ✓ Second SuperTrend line (lime/orange colors) ✓ Buy/Sell signals when trend changes ✓ Optional signals for second SuperTrend (small triangles) ✓ Daily Pivot Points with 3 resistance and 3 support levels ✓ Customizable ATR period and multiplier for both SuperTrends ✓ Background color indication of current trend ✓ Built-in alerts for both SuperTrend trend changes ✓ Toggle options for all bands, signals, pivot lines, and second SuperTrend DEFAULT PARAMETERS: - ATR Period: 10 - ATR Multiplier: 3.0 - Second SuperTrend: Enabled - Second SuperTrend Timeframe: 60 minutes (1 hour) - Second SuperTrend ATR Period: 10 - Second SuperTrend ATR Multiplier: 3.0 USAGE: - Lower multiplier (1.5-2.5) = More sensitive, more signals, more noise - Higher multiplier (3.5-5.0) = Less sensitive, fewer signals, filters noise - Use pivot points as additional confirmation for entries/exits - When price approaches R1/R2/R3, expect potential resistance - When price approaches S1/S2/S3, expect potential support - MULTI-TIMEFRAME STRATEGY: Best signals occur when both SuperTrends align * Both green (uptrend) = Strong bullish confirmation * Both red (downtrend) = Strong bearish confirmation * Conflicting trends = Caution, potential consolidation or reversal - Combine SuperTrend signals with pivot levels for high-probability trades - Best suited for trending markets TRADING SIGNALS: - BUY: When price closes above the upper band (trend changes from down to up) * Extra confirmation if near a support level (S1, S2, S3) * STRONGEST SIGNAL: When both SuperTrends are green AND price is above PP - SELL: When price closes below the lower band (trend changes from up to down) * Extra confirmation if near a resistance level (R1, R2, R3) * STRONGEST SIGNAL: When both SuperTrends are red AND price is below PP MULTI-TIMEFRAME EXAMPLES: - Chart timeframe: 5min, Second SuperTrend: 1 hour * Enter long when 5min shows buy signal AND 1hr is already in uptrend * This filters out counter-trend trades - Chart timeframe: 15min, Second SuperTrend: 4 hour * Higher timeframe provides overall trend direction * Lower timeframe provides precise entry timing - Recommended combinations: * Scalping: 1min chart + 15min second ST * Day trading: 5min chart + 1hr second ST * Swing trading: 1hr chart + Daily second ST PIVOT POINT STRATEGY: - PP (Pivot Point) = Main level, acts as support in uptrend, resistance in downtrend - Price above PP = Bullish bias, look for longs near S1/S2 - Price below PP = Bearish bias, look for shorts near R1/R2 - Breakout of R3 or S3 indicates strong momentum Note: This indicator is based on the classic SuperTrend algorithm and should be used as part of a comprehensive trading strategy, not as a standalone signal.Pine Script® indicatorby maravinthkumar11119
Supertrend with Correct Y-axis Scaling OLEG_SLSThe functionality of the script: 1. Supertrend Calculation: -The trend (Supertrend line) is updated dynamically: -If the price is above the previous trend, the line follows the upper limit. -If the price is lower, the line follows the lower boundary. 2. Calculation of the Supertrend for the higher timeframe: -The function is used to calculate the Supertrend for the hourly, regardless of the current timeframe on the chart. 3. Buy and Sell Signals: -Buy signal: When the price crosses the Supertrend line up and is above the Supertrend line. -A sales signal: When the price crosses the Supertrend line down and is below the Supertrend line. 4. Display on the chart -The Supertrend line is displayed: -Green if the price is above the Supertrend line. -Red if the price is below the Supertrend line. -The Supertrend line for the hourly timeframe is displayed in blue. 5. Alerts Two types of alerts are created: -Buy Alert: When there is a buy signal. -Sell Alert: When there is a sell signal. Features and recommendations: -Supertrend works best in trending markets. In a sideways movement, it can give false signals. -Check the signals on multiple timeframes for confirmation. -Add additional indicators (for example, RSI or MACD) to filter the signals. -Test the strategy on historical data before using it in real trading. _________________________________________________________________________________ Функционал скрипта: 1. Расчет Supertrend: -Тренд (линия Supertrend) обновляется динамически: -Если цена выше предыдущего тренда, линия следует за верхней границей. -Если цена ниже, линия следует за нижней границей. 2. Расчет Supertrend для старшего таймфрейма: -Используется функция чтобы рассчитать Supertrend для часового,независимо от текущего таймфрейма на графике. 3. Сигналы покупки и продажи: -Сигнал покупки: Когда цена пересекает линию Supertrend вверх и находится выше линии Supertrend. -Сигнал продажи: Когда цена пересекает линию Supertrend вниз и находится ниже линии Supertrend. 4. Отображение на графике -Линия Supertrend отображается: -Зеленым, если цена выше линии Supertrend. -Красным, если цена ниже линии Supertrend. -Линия Supertrend для часового таймфрейма отображается синим цветом. 5. Оповещения Создаются два типа оповещений: -Buy Alert: Когда возникает сигнал на покупку. -Sell Alert: Когда возникает сигнал на продажу. Особенности и рекомендации: -Supertrend лучше всего работает в трендовых рынках. В боковом движении может давать ложные сигналы. -Проверяйте сигналы на нескольких таймфреймах для подтверждения. -Добавьте дополнительные индикаторы (например, RSI или MACD) для фильтрации сигналов. -Тестируйте стратегию на исторических данных перед использованием в реальной торговле. Pine Script® indicatorby AiGidUpdated 60
Supertrend + MACD CrossoverKey Elements of the Template: Supertrend Settings: supertrendFactor: Adjustable to control the sensitivity of the Supertrend. supertrendATRLength: ATR length used for Supertrend calculation. MACD Settings: macdFastLength, macdSlowLength, macdSignalSmoothing: These settings allow you to fine-tune the MACD for better results. Risk Management: Stop-Loss: The stop-loss is based on the ATR (Average True Range), a volatility-based indicator. Take-Profit: The take-profit is based on the risk-reward ratio (set to 3x by default). Both stop-loss and take-profit are dynamic, based on ATR, which adjusts according to market volatility. Buy and Sell Signals: Buy Signal: Supertrend is bullish, and MACD line crosses above the Signal line. Sell Signal: Supertrend is bearish, and MACD line crosses below the Signal line. Visual Elements: The Supertrend line is plotted in green (bullish) and red (bearish). Buy and Sell signals are shown with green and red triangles on the chart. Next Steps for Optimization: Backtesting: Run backtests on BTC in the 5-minute timeframe and adjust parameters (Supertrend factor, MACD settings, risk-reward ratio) to find the optimal configuration for the 60% win ratio. Fine-Tuning Parameters: Adjust supertrendFactor and macdFastLength to find more optimal values based on BTC's market behavior. Tweak the risk-reward ratio to maximize profitability while maintaining a good win ratio. Evaluate Market Conditions: The performance of the strategy can vary based on market volatility. It may be helpful to evaluate performance in different market conditions or pair it with a filter like RSI or volume. Let me know if you'd like further tweaks or explanations!Pine Script® strategyby rk135972239