ES OHLC BASED ON 9:301. RTH Price Levels
YC (Yesterday's Close): Previous day's RTH closing price at 4:00 PM ET
0DTE-O (Today's Open): Current day's RTH opening price at 9:30 AM ET
T-E-M (Today's Europe-Asia Midpoint): Midpoint of overnight session high/low
T-E-R (Today's Europe-Asia Resistance): Overnight session high
T-E-S (Today's Europe-Asia Support): Overnight session low
Y-T-M (Yesterday-Today Midpoint): Midpoint between YC and 0DTE-O
2. Previous Bar Percentage Levels
Displays 50% retracement level for all bars
Shows 70% level for bullish bars (close > open)
Shows 30% level for bearish bars (close < open)
Lines automatically update with each new bar
3. Custom Support/Resistance Lines
Up to 4 customizable horizontal levels (2 resistance, 2 support)
Useful for marking key psychological levels or pivot points
4. VIX-Based Options Strategy Suggestions
Real-time VIX value display
Time Zone Handling
The indicator is configured for Central Time (CT) as Pine Script's default:
RTH Open: 8:30 AM CT (9:30 AM ET)
RTH Close: 3:00 PM CT (4:00 PM ET)
Overnight session: 7:00 PM CT to 8:30 AM CT next day
Usage Notes
Chart Requirement: This indicator only works on 5-minute timeframe charts
Auto-refresh: All lines and labels automatically refresh at each new trading day's RTH open
24-hour Market: Designed for ES futures which trade nearly 24 hours
Visual Clarity: Different line styles and colors for easy identification
Ideal For
Day traders focusing on ES futures
0DTE options traders needing key reference levels
Traders using overnight gaps and previous day's levels
Those incorporating VIX-based strategies in their trading
Search in scripts for "support resistance"

Ultimate Scalping Tool[BullByte]Overview
The Ultimate Scalping Tool is an open-source TradingView indicator built for scalpers and short-term traders released under the Mozilla Public License 2.0. It uses a custom Quantum Flux Candle (QFC) oscillator to combine multiple market forces into one visual signal. In plain terms, the script reads momentum, trend strength, volatility, and volume together and plots a special “candlestick” each bar (the QFC) that reflects the overall market bias. This unified view makes it easier to spot entries and exits: the tool labels signals as Strong Buy/Sell, Pullback (a brief retracement in a trend), Early Entry, or Exit Warning . It also provides color-coded alerts and a small dashboard of metrics. In practice, traders see green/red oscillator bars and symbols on the chart when conditions align, helping them scalp or trend-follow without reading multiple separate indicators.
Core Components
Quantum Flux Candle (QFC) Construction
The QFC is the heart of the indicator. Rather than using raw price, it creates a candlestick-like bar from the underlying oscillator values. Each QFC bar has an “open,” “high/low,” and “close” derived from calculated momentum and volatility inputs for that period . In effect, this turns the oscillator into intuitive candle patterns so traders can recognize momentum shifts visually. (For comparison, note that Heikin-Ashi candles “have a smoother look because take an average of the movement”. The QFC instead represents exact oscillator readings, so it reflects true momentum changes without hiding price action.) Colors of QFC bars change dynamically (e.g. green for bullish momentum, red for bearish) to highlight shifts. This is the first open-source QFC oscillator that dynamically weights four non-correlated indicators with moving thresholds, which makes it a unique indicator on its own.
Oscillator Normalization & Adaptive Weights
The script normalizes its oscillator to a fixed scale (for example, a 0–100 range much like the RSI) so that various inputs can be compared fairly. It then applies adaptive weighting: the relative influence of trend, momentum, volatility or volume signals is automatically adjusted based on current market conditions. For instance, in very volatile markets the script might weight volatility more heavily, or in a strong trend it might give extra weight to trend direction. Normalizing data and adjusting weights helps keep the QFC sensitive but stable (normalization ensures all inputs fit a common scale).
Trend/Momentum/Volume/Volatility Fusion
Unlike a typical single-factor oscillator, the QFC oscillator fuses four aspects at once. It may compute, for example, a trend indicator (such as an ADX or moving average slope), a momentum measure (like RSI or Rate-of-Change), a volume-based pressure (similar to MFI/OBV), and a volatility measure (like ATR) . These different values are combined into one composite oscillator. This “multi-dimensional” approach follows best practices of using non-correlated indicators (trend, momentum, volume, volatility) for confirmation. By encoding all these signals in one line, a high QFC reading means that trend, momentum, and volume are all aligned, whereas a neutral reading might mean mixed conditions. This gives traders a comprehensive picture of market strength.
Signal Classification
The script interprets the QFC oscillator to label trades. For example:
• Strong Buy/Sell : Triggered when the oscillator crosses a high-confidence threshold (e.g. breaks clearly above zero with strong slope), indicating a well-confirmed move. This is like seeing a big green/red QFC candle aligned with the trend.
• Pullbacks : Identified when the trend is up but momentum dips briefly. A Pullback Buy appears if the overall trend is bullish but the oscillator has a short retracement – a typical buying opportunity in an uptrend. (A pullback is “a brief decline or pause in a generally upward price trend”.)
• Early Buy/Sell : Marks an initial swing in the oscillator suggesting a possible new trend, before it is fully confirmed. It’s a hint of momentum building (an early-warning signal), not as strong as the confirmed “Strong” signal.
• Exit Warnings : Issued when momentum peaks or reverses. For instance, if the QFC bars reach a high and start turning red/green opposite, the indicator warns that the move may be ending. In other words, a Momentum Peak is the point of maximum strength after which weakness may follow.
These categories correspond to typical trading concepts: Pullback (temporary reversal in an uptrend), Early Buy (an initial bullish cross), Strong Buy (confirmed bullish momentum), and Momentum Peak (peak oscillator value suggesting exhaustion).
Filters (DI Reversal, Dynamic Thresholds, HTF EMA/ADX)
Extra filters help avoid bad trades. A DI Reversal filter uses the +DI/–DI lines (from the ADX system) to require that the trend direction confirms the signal . For example, it might ignore a buy signal if the +DI is still below –DI. Dynamic Thresholds adjust signal levels on-the-fly: rather than fixed “overbought” lines, they move with volatility so signals happen under appropriate market stress. An optional High-Timeframe EMA or ADX filter adds a check against a larger timeframe trend: for instance, only taking a trade if price is above the weekly EMA or if weekly ADX shows a strong trend. (Notably, the ADX is “a technical indicator used by traders to determine the strength of a price trend”, so requiring a high-timeframe ADX avoids trading against the bigger trend.)
Dashboard Metrics & Color Logic
The Dashboard in the Ultimate Scalping Tool (UST) serves as a centralized information hub, providing traders with real-time insights into market conditions, trend strength, momentum, volume pressure, and trade signals. It is highly customizable, allowing users to adjust its appearance and content based on their preferences.
1. Dashboard Layout & Customization
Short vs. Extended Mode : Users can toggle between a compact view (9 rows) and an extended view (13 rows) via the `Short Dashboard` input.
Text Size Options : The dashboard supports three text sizes— Tiny, Small, and Normal —adjustable via the `Dashboard Text Size` input.
Positioning : The dashboard is positioned in the top-right corner by default but can be moved if modified in the script.
2. Key Metrics Displayed
The dashboard presents critical trading metrics in a structured table format:
Trend (TF) : Indicates the current trend direction (Strong Bullish, Moderate Bullish, Sideways, Moderate Bearish, Strong Bearish) based on normalized trend strength (normTrend) .
Momentum (TF) : Displays momentum status (Strong Bullish/Bearish or Neutral) derived from the oscillator's position relative to dynamic thresholds.
Volume (CMF) : Shows buying/selling pressure levels (Very High Buying, High Selling, Neutral, etc.) based on the Chaikin Money Flow (CMF) indicator.
Basic & Advanced Signals:
Basic Signal : Provides simple trade signals (Strong Buy, Strong Sell, Pullback Buy, Pullback Sell, No Trade).
Advanced Signal : Offers nuanced signals (Early Buy/Sell, Momentum Peak, Weakening Momentum, etc.) with color-coded alerts.
RSI : Displays the Relative Strength Index (RSI) value, colored based on overbought (>70), oversold (<30), or neutral conditions.
HTF Filter : Indicates the higher timeframe trend status (Bullish, Bearish, Neutral) when using the Leading HTF Filter.
VWAP : Shows the V olume-Weighted Average Price and whether the current price is above (bullish) or below (bearish) it.
ADX : Displays the Average Directional Index (ADX) value, with color highlighting whether it is rising (green) or falling (red).
Market Mode : Shows the selected market type (Crypto, Stocks, Options, Forex, Custom).
Regime : Indicates volatility conditions (High, Low, Moderate) based on the **ATR ratio**.
3. Filters Status Panel
A secondary panel displays the status of active filters, helping traders quickly assess which conditions are influencing signals:
- DI Reversal Filter: On/Off (confirms reversals before generating signals).
- Dynamic Thresholds: On/Off (adjusts buy/sell thresholds based on volatility).
- Adaptive Weighting: On/Off (auto-adjusts oscillator weights for trend/momentum/volatility).
- Early Signal: On/Off (enables early momentum-based signals).
- Leading HTF Filter: On/Off (applies higher timeframe trend confirmation).
4. Visual Enhancements
Color-Coded Cells : Each metric is color-coded (green for bullish, red for bearish, gray for neutral) for quick interpretation.
Dynamic Background : The dashboard background adapts to market conditions (bullish/bearish/neutral) based on ADX and DI trends.
Customizable Reference Lines : Users can enable/disable fixed reference lines for the oscillator.
How It(QFC) Differs from Traditional Indicators
Quantum Flux Candle (QFC) Versus Heikin-Ashi
Heikin-Ashi candles smooth price by averaging (HA’s open/close use averages) so they show trend clearly but hide true price (the current HA bar’s close is not the real price). QFC candles are different: they are oscillator values, not price averages . A Heikin-Ashi chart “has a smoother look because it is essentially taking an average of the movement”, which can cause lag. The QFC instead shows the raw combined momentum each bar, allowing faster recognition of shifts. In short, HA is a smoothed price chart; QFC is a momentum-based chart.
Versus Standard Oscillators
Common oscillators like RSI or MACD use fixed formulas on price (or price+volume). For example, RSI “compares gains and losses and normalizes this value on a scale from 0 to 100”, reflecting pure price momentum. MFI is similar but adds volume. These indicators each show one dimension: momentum or volume. The Ultimate Scalping Tool’s QFC goes further by integrating trend strength and volatility too. In practice, this means a move that looks strong on RSI might be downplayed by low volume or weak trend in QFC. As one source notes, using multiple non-correlated indicators (trend, momentum, volume, volatility) provides a more complete market picture. The QFC’s multi-factor fusion is unique – it is effectively a multi-dimensional oscillator rather than a traditional single-input one.
Signal Style
Traditional oscillators often use crossovers (RSI crossing 50) or fixed zones (MACD above zero) for signals. The Ultimate Scalping Tool’s signals are custom-classified: it explicitly labels pullbacks, early entries, and strong moves. These terms go beyond a typical indicator’s generic “buy”/“sell.” In other words, it packages a strategy around the oscillator, which traders can backtest or observe without reading code.
Key Term Definitions
• Pullback : A short-term dip or consolidation in an uptrend. In this script, a Pullback Buy appears when price is generally rising but shows a brief retracement. (As defined by Investopedia, a pullback is “a brief decline or pause in a generally upward price trend”.)
• Early Buy/Sell : An initial or tentative entry signal. It means the oscillator first starts turning positive (or negative) before a full trend has developed. It’s an early indication that a trend might be starting.
• Strong Buy/Sell : A confident entry signal when multiple conditions align. This label is used when momentum is already strong and confirmed by trend/volume filters, offering a higher-probability trade.
• Momentum Peak : The point where bullish (or bearish) momentum reaches its maximum before weakening. When the oscillator value stops rising (or falling) and begins to reverse, the script flags it as a peak – signaling that the current move could be overextended.
What is the Flux MA?
The Flux MA (Moving Average) is an Exponential Moving Average (EMA) applied to a normalized oscillator, referred to as FM . Its purpose is to smooth out the fluctuations of the oscillator, providing a clearer picture of the underlying trend direction and strength. Think of it as a dynamic baseline that the oscillator moves above or below, helping you determine whether the market is trending bullish or bearish.
How it’s calculated (Flux MA):
1.The oscillator is normalized (scaled to a range, typically between 0 and 1, using a default scale factor of 100.0).
2.An EMA is applied to this normalized value (FM) over a user-defined period (default is 10 periods).
3.The result is rescaled back to the oscillator’s original range for plotting.
Why it matters : The Flux MA acts like a support or resistance level for the oscillator, making it easier to spot trend shifts.
Color of the Flux Candle
The Quantum Flux Candle visualizes the normalized oscillator (FM) as candlesticks, with colors that indicate specific market conditions based on the relationship between the FM and the Flux MA. Here’s what each color means:
• Green : The FM is above the Flux MA, signaling bullish momentum. This suggests the market is trending upward.
• Red : The FM is below the Flux MA, signaling bearish momentum. This suggests the market is trending downward.
• Yellow : Indicates strong buy conditions (e.g., a "Strong Buy" signal combined with a positive trend). This is a high-confidence signal to go long.
• Purple : Indicates strong sell conditions (e.g., a "Strong Sell" signal combined with a negative trend). This is a high-confidence signal to go short.
The candle mode shows the oscillator’s open, high, low, and close values for each period, similar to price candlesticks, but it’s the color that provides the quick visual cue for trading decisions.
How to Trade the Flux MA with Respect to the Candle
Trading with the Flux MA and Quantum Flux Candle involves using the MA as a trend indicator and the candle colors as entry and exit signals. Here’s a step-by-step guide:
1. Identify the Trend Direction
• Bullish Trend : The Flux Candle is green and positioned above the Flux MA. This indicates upward momentum.
• Bearish Trend : The Flux Candle is red and positioned below the Flux MA. This indicates downward momentum.
The Flux MA serves as the reference line—candles above it suggest buying pressure, while candles below it suggest selling pressure.
2. Interpret Candle Colors for Trade Signals
• Green Candle : General bullish momentum. Consider entering or holding a long position.
• Red Candle : General bearish momentum. Consider entering or holding a short position.
• Yellow Candle : A strong buy signal. This is an ideal time to enter a long trade.
• Purple Candle : A strong sell signal. This is an ideal time to enter a short trade.
3. Enter Trades Based on Crossovers and Colors
• Long Entry : Enter a buy position when the Flux Candle turns green and crosses above the Flux MA. If it turns yellow, this is an even stronger signal to go long.
• Short Entry : Enter a sell position when the Flux Candle turns red and crosses below the Flux MA. If it turns purple, this is an even stronger signal to go short.
4. Exit Trades
• Exit Long : Close your buy position when the Flux Candle turns red or crosses below the Flux MA, indicating the bullish trend may be reversing.
• Exit Short : Close your sell position when the Flux Candle turns green or crosses above the Flux MA, indicating the bearish trend may be reversing.
•You might also exit a long trade if the candle changes from yellow to green (weakening strong buy signal) or a short trade from purple to red (weakening strong sell signal).
5. Use Additional Confirmation
To avoid false signals, combine the Flux MA and candle signals with other indicators or dashboard metrics (e.g., trend strength, momentum, or volume pressure). For example:
•A yellow candle with a " Strong Bullish " trend and high buying volume is a robust long signal.
•A red candle with a " Moderate Bearish " trend and neutral momentum might need more confirmation before shorting.
Practical Example
Imagine you’re scalping a cryptocurrency:
• Long Trade : The Flux Candle turns yellow and is above the Flux MA, with the dashboard showing "Strong Buy" and high buying volume. You enter a long position. You exit when the candle turns red and dips below the Flux MA.
• Short Trade : The Flux Candle turns purple and crosses below the Flux MA, with a "Strong Sell" signal on the dashboard. You enter a short position. You exit when the candle turns green and crosses above the Flux MA.
Market Presets and Adaptation
This indicator is designed to work on any market with candlestick price data (stocks, crypto, forex, indices, etc.). To handle different behavior, it provides presets for major asset classes. Selecting a “Stocks,” “Crypto,” “Forex,” or “Options” preset automatically loads a set of parameter values optimized for that market . For example, a crypto preset might use a shorter lookback or higher sensitivity to account for crypto’s high volatility, while a stocks preset might use slightly longer smoothing since stocks often trend more slowly. In practice, this means the same core QFC logic applies across markets, but the thresholds and smoothing adjust so signals remain relevant for each asset type.
Usage Guidelines
• Recommended Timeframes : Optimized for 1 minute to 15 minute intraday charts. Can also be used on higher timeframes for short term swings.
• Market Types : Select “Crypto,” “Stocks,” “Forex,” or “Options” to auto tune periods, thresholds and weights. Use “Custom” to manually adjust all inputs.
• Interpreting Signals : Always confirm a signal by checking that trend, volume, and VWAP agree on the dashboard. A green “Strong Buy” arrow with green trend, green volume, and price > VWAP is highest probability.
• Adjusting Sensitivity : To reduce false signals in fast markets, enable DI Reversal Confirmation and Dynamic Thresholds. For more frequent entries in trending environments, enable Early Entry Trigger.
• Risk Management : This tool does not plot stop loss or take profit levels. Users should define their own risk parameters based on support/resistance or volatility bands.
Background Shading
To give you an at-a-glance sense of market regime without reading numbers, the indicator automatically tints the chart background in three modes—neutral, bullish and bearish—with two levels of intensity (light vs. dark):
Neutral (Gray)
When ADX is below 20 the market is considered “no trend” or too weak to trade. The background fills with a light gray (high transparency) so you know to sit on your hands.
Bullish (Green)
As soon as ADX rises above 20 and +DI exceeds –DI, the background turns a semi-transparent green, signaling an emerging uptrend. When ADX climbs above 30 (strong trend), the green becomes more opaque—reminding you that trend-following signals (Strong Buy, Pullback) carry extra weight.
Bearish (Red)
Similarly, if –DI exceeds +DI with ADX >20, you get a light red tint for a developing downtrend, and a darker, more solid red once ADX surpasses 30.
By dynamically varying both hue (green vs. red vs. gray) and opacity (light vs. dark), the background instantly communicates trend strength and direction—so you always know whether to favor breakout-style entries (in a strong trend) or stay flat during choppy, low-ADX conditions.
The setup shown in the above chart snapshot is BTCUSD 15 min chart : Binance for reference.
Disclaimer
No indicator guarantees profits. Backtest or paper trade this tool to understand its behavior in your market. Always use proper position sizing and stop loss orders.
Good luck!
- BullByte

RTH Session Highs & LowsA Pine Script indicator designed to track and plot the Regular Trading Hours (RTH) session highs and lows on a chart, typically for U.S. equity markets (e.g., S&P 500, Nasdaq, etc.), which operate from 9:30 AM to 4:00 PM Eastern Time.
Session High & Low Lines:
During the RTH session, the indicator draws green and red horizontal lines that represent the highest and lowest price seen so far within that trading session.
These levels help traders identify intraday support (low) and resistance (high) levels.
New High/Low Markers:
Small triangle markers are placed:
Above the bar when a new intraday high is made (green triangle).
Below the bar when a new intraday low is made (red triangle).
This visually flags when momentum may be building or reversing.
Intraday Strategy Support:
Use the session high/low as dynamic support/resistance for scalping or breakout strategies.
For example:
Breakouts above session highs may indicate bullish strength.
Breakdowns below session lows may suggest bearish momentum.
Mean Reversion Tactics:
Prices approaching these lines and then rejecting can be used for mean reversion setups.
Combine with volume or candlestick patterns for confirmation.
Risk Management:
Set stops or targets relative to session highs/lows.
For instance, use session high as a stop-loss level in a short position.
Volatility Gauge:
Tracking how frequently new highs/lows are formed can help assess intraday volatility or range expansion.
Complement with Indicators:
Combine this with our "McGinley Dynamic Channel with Directional Shading" indicator or our "EMA Crossover with Shading" indicator to add context to breakouts or rejections.

[blackcat] L2 Angle Trend TrackerOVERVIEW
The " L2 Angle Trend Tracker" is a sophisticated technical analysis tool designed to monitor trend direction and momentum using multiple Exponential Moving Averages (EMAs) with different periods. 📈 This script calculates the angles of 5 EMAs (5, 8, 10, 12, and 15 periods) and displays them with gradient colors, providing a comprehensive view of market momentum. When all EMAs cross above or below specified threshold levels, it generates Buy or Sell signals with visual alerts. The indicator helps traders identify trend reversals, potential entry/exit points, and market sentiment shifts with precision. 🚀 This powerful tool is particularly useful for traders who want to combine multiple timeframe analysis with angle-based momentum confirmation.
FEATURES
Calculates angles for 5 EMAs with customizable periods (5, 8, 10, 12, and 15)
Displays angle values with distinct colors for each EMA (Green, Blue, Purple, Orange, and Red)
Generates Buy signals when all EMAs cross above the lower threshold
Generates Sell signals when all EMAs cross below the upper threshold
Shows a zero line and threshold lines for easy reference
Customizable threshold levels for Buy/Sell signals
Visual alerts with "Buy" and "Sell" labels at the point of signal generation
The script uses a mathematical formula to calculate the angle of each EMA relative to its position 11 bars ago
Angle values are converted from radians to degrees for easier interpretation
The zero line represents no change in the EMA angle
The indicator is not overlayed on the price chart by default, but can be adjusted in the script settings 📊
HOW TO USE
Adjust the EMA periods to match your trading strategy 🛠️
Shorter periods (5, 8) are more sensitive to price changes
Longer periods (10, 12, 15) provide smoother trend confirmation
Set appropriate threshold values for Buy/Sell signals based on your risk tolerance
Default thresholds are 70 for upper threshold and -70 for lower threshold
Consider adjusting thresholds based on market volatility
Watch for Buy signals when all EMAs cross above the lower threshold (default: -70)
The signal appears as a green "Buy" label on the chart
This indicates a potential trend reversal to the upside
Watch for Sell signals when all EMAs cross below the upper threshold (default: 70)
The signal appears as a red "Sell" label on the chart
This indicates a potential trend reversal to the downside
Combine with other indicators for confirmation before making trading decisions 🧠
Consider using volume confirmation, support/resistance levels, or other oscillators
The angle tracker works well with trend-following strategies
Use the angle values to gauge momentum strength
Steeper angles indicate stronger momentum
Flatter angles suggest weakening momentum or consolidation
CONFIGURATION
EMA Periods: The script uses five different EMA periods that can be customized:
EMA Period 5: Short-term trend indicator
EMA Period 8: Medium-short term trend indicator
EMA Period 10: Medium-term trend indicator
EMA Period 12: Medium-long term trend indicator
EMA Period 15: Long-term trend indicator
Threshold Settings:
Threshold Top: Sets the upper boundary for Sell signals (default: 70)
Threshold Bot: Sets the lower boundary for Buy signals (default: -70)
These thresholds can be adjusted based on market conditions and trading style
LIMITATIONS
The script may generate false signals in ranging markets or during periods of high volatility
All EMAs must cross the threshold for a signal to appear, which may filter some valid signals
The angle calculation uses a 11-bar lookback period, which may not be suitable for all timeframes
Works best in trending markets and may produce whipsaws in choppy conditions ⚠️
The indicator is more effective on higher timeframes (4H, 1D) than on very short timeframes (1M, 5M)
Signal generation requires confirmation from multiple EMAs, which may delay entry/exit points
The angle calculation method may not be suitable for all financial instruments
ADVANCED TIPS
Use multiple instances of this indicator with different EMA settings for multi-timeframe analysis
Combine with volume analysis to confirm the strength of signals
Look for confluence with support and resistance levels for more reliable signals
Consider using the angle values as a filter for other trading strategies
The indicator can be used to identify momentum exhaustion points when angles flatten
For swing trading, consider using the Buy and Sell signals as potential entry/exit points
For day trading, you may want to use shorter EMA periods and adjust threshold values accordingly
NOTES
The script uses a mathematical formula to calculate the angle of each EMA relative to its position 11 bars ago
The angle values are converted from radians to degrees for easier interpretation
The zero line represents no change in the EMA angle
The indicator is not overlayed on the price chart by default, but can be adjusted in the script settings 📊
The angle calculation provides a dynamic view of momentum that traditional moving averages don't offer
The threshold values are based on empirical testing and can be fine-tuned for specific instruments
THANKS
Special thanks to the TradingView community for their support and feedback on this indicator. If you find this script helpful, please consider leaving a comment or sharing your experiences with it. Your feedback helps improve the tool for everyone. 🙏
Also, a nod to the original concept developers who pioneered angle-based trend analysis. This script builds upon those foundational ideas to provide a more comprehensive view of market momentum. 🌟

Bober XM v2.0# ₿ober XM v2.0 Trading Bot Documentation
**Developer's Note**: While our previous Bot 1.3.1 was removed due to guideline violations, this setback only fueled our determination to create something even better. Rising from this challenge, Bober XM 2.0 emerges not just as an update, but as a complete reimagining with multi-timeframe analysis, enhanced filters, and superior adaptability. This adversity pushed us to innovate further and deliver a strategy that's smarter, more agile, and more powerful than ever before. Challenges create opportunity - welcome to Cryptobeat's finest work yet.
## !!!!You need to tune it for your own pair and timeframe and retune it periodicaly!!!!!
## Overview
The ₿ober XM v2.0 is an advanced dual-channel trading bot with multi-timeframe analysis capabilities. It integrates multiple technical indicators, customizable risk management, and advanced order execution via webhook for automated trading. The bot's distinctive feature is its separate channel systems for long and short positions, allowing for asymmetric trade strategies that adapt to different market conditions across multiple timeframes.
### Key Features
- **Multi-Timeframe Analysis**: Analyze price data across multiple timeframes simultaneously
- **Dual Channel System**: Separate parameter sets for long and short positions
- **Advanced Entry Filters**: RSI, Volatility, Volume, Bollinger Bands, and KEMAD filters
- **Machine Learning Moving Average**: Adaptive prediction-based channels
- **Multiple Entry Strategies**: Breakout, Pullback, and Mean Reversion modes
- **Risk Management**: Customizable stop-loss, take-profit, and trailing stop settings
- **Webhook Integration**: Compatible with external trading bots and platforms
### Strategy Components
| Component | Description |
|---------|-------------|
| **Dual Channel Trading** | Uses either Keltner Channels or Machine Learning Moving Average (MLMA) with separate settings for long and short positions |
| **MLMA Implementation** | Machine learning algorithm that predicts future price movements and creates adaptive bands |
| **Pivot Point SuperTrend** | Trend identification and confirmation system based on pivot points |
| **Three Entry Strategies** | Choose between Breakout, Pullback, or Mean Reversion approaches |
| **Advanced Filter System** | Multiple customizable filters with multi-timeframe support to avoid false signals |
| **Custom Exit Logic** | Exits based on OBV crossover of its moving average combined with pivot trend changes |
### Note for Novice Users
This is a fully featured real trading bot and can be tweaked for any ticker — SOL is just an example. It follows this structure:
1. **Indicator** – gives the initial signal
2. **Entry strategy** – decides when to open a trade
3. **Exit strategy** – defines when to close it
4. **Trend confirmation** – ensures the trade follows the market direction
5. **Filters** – cuts out noise and avoids weak setups
6. **Risk management** – controls losses and protects your capital
To tune it for a different pair, you'll need to start from scratch:
1. Select the timeframe (candle size)
2. Turn off all filters and trend entry/exit confirmations
3. Choose a channel type, channel source and entry strategy
4. Adjust risk parameters
5. Tune long and short settings for the channel
6. Fine-tune the Pivot Point Supertrend and Main Exit condition OBV
This will generate a lot of signals and activity on the chart. Your next task is to find the right combination of filters and settings to reduce noise and tune it for profitability.
### Default Strategy values
Default values are tuned for: Symbol BITGET:SOLUSDT.P 5min candle
Filters are off by default: Try to play with it to understand how it works
## Configuration Guide
### General Settings
| Setting | Description | Default Value |
|---------|-------------|---------------|
| **Long Positions** | Enable or disable long trades | Enabled |
| **Short Positions** | Enable or disable short trades | Enabled |
| **Risk/Reward Area** | Visual display of stop-loss and take-profit zones | Enabled |
| **Long Entry Source** | Price data used for long entry signals | hl2 (High+Low/2) |
| **Short Entry Source** | Price data used for short entry signals | hl2 (High+Low/2) |
The bot allows you to trade long positions, short positions, or both simultaneously. Each direction has its own set of parameters, allowing for fine-tuned strategies that recognize the asymmetric nature of market movements.
### Multi-Timeframe Settings
1. **Enable Multi-Timeframe Analysis**: Toggle 'Enable Multi-Timeframe Analysis' in the Multi-Timeframe Settings section
2. **Configure Timeframes**: Set appropriate higher timeframes based on your trading style:
- Timeframe 1: Default is now 15 minutes (intraday confirmation)
- Timeframe 2: Default is 4 hours (trend direction)
3. **Select Sources per Indicator**: For each indicator (RSI, KEMAD, Volume, etc.), choose:
- The desired timeframe (current, mtf1, or mtf2)
- The appropriate price type (open, high, low, close, hl2, hlc3, ohlc4)
### Entry Strategies
- **Breakout**: Enter when price breaks above/below the channel
- **Pullback**: Enter when price pulls back to the channel
- **Mean Reversion**: Enter when price is extended from the channel
You can enable different strategies for long and short positions.
### Core Components
### Risk Management
- **Position Size**: Control risk with percentage-based position sizing
- **Stop Loss Options**:
- Fixed: Set a specific price or percentage from entry
- ATR-based: Dynamic stop-loss based on market volatility
- Swing: Uses recent swing high/low points
- **Take Profit**: Multiple targets with percentage allocation
- **Trailing Stop**: Dynamic stop that follows price movement
## Advanced Usage Strategies
### Moving Average Type Selection Guide
- **SMA**: More stable in choppy markets, good for higher timeframes
- **EMA/WMA**: More responsive to recent price changes, better for entry signals
- **VWMA**: Adds volume weighting for stronger trends, use with Volume filter
- **HMA**: Balance between responsiveness and noise reduction, good for volatile markets
### Multi-Timeframe Strategy Approaches
- **Trend Confirmation**: Use higher timeframe RSI (mtf2) for overall trend, current timeframe for entries
- **Entry Precision**: Use KEMAD on current timeframe with volume filter on mtf1
- **False Signal Reduction**: Apply RSI filter on mtf1 with strict KEMAD settings
### Market Condition Optimization
| Market Condition | Recommended Settings |
|------------------|----------------------|
| **Trending** | Use Breakout strategy with KEMAD filter on higher timeframe |
| **Ranging** | Use Mean Reversion with strict RSI filter (mtf1) |
| **Volatile** | Increase ATR multipliers, use HMA for moving averages |
| **Low Volatility** | Decrease noise parameters, use pullback strategy |
## Webhook Integration
The strategy features a professional webhook system that allows direct connectivity to your exchange or trading platform of choice through third-party services like 3commas, Alertatron, or Autoview.
The webhook payload includes all necessary parameters for automated execution:
- Entry price and direction
- Stop loss and take profit levels
- Position size
- Custom identifier for webhook routing
## Performance Optimization Tips
1. **Start with Defaults**: Begin with the default settings for your timeframe before customizing
2. **Adjust One Component at a Time**: Make incremental changes and test the impact
3. **Match MA Types to Market Conditions**: Use appropriate moving average types based on the Market Condition Optimization table
4. **Timeframe Synergy**: Create logical relationships between timeframes (e.g., 5min chart with 15min and 4h higher timeframes)
5. **Periodic Retuning**: Markets evolve - regularly review and adjust parameters
## Common Setups
### Crypto Trend-Following
- MLMA with EMA or HMA
- Higher RSI thresholds (75/25)
- KEMAD filter on mtf1
- Breakout entry strategy
### Stock Swing Trading
- MLMA with SMA for stability
- Volume filter with higher threshold
- KEMAD with increased filter order
- Pullback entry strategy
### Forex Scalping
- MLMA with WMA and lower noise parameter
- RSI filter on current timeframe
- Use highest timeframe for trend direction only
- Mean Reversion strategy
## Webhook Configuration
- **Benefits**:
- Automated trade execution without manual intervention
- Immediate response to market conditions
- Consistent execution of your strategy
- **Implementation Notes**:
- Requires proper webhook configuration on your exchange or platform
- Test thoroughly with small position sizes before full deployment
- Consider latency between signal generation and execution
### Backtesting Period
Define a specific historical period to evaluate the bot's performance:
| Setting | Description | Default Value |
|---------|-------------|---------------|
| **Start Date** | Beginning of backtest period | January 1, 2025 |
| **End Date** | End of backtest period | December 31, 2026 |
- **Best Practice**: Test across different market conditions (bull markets, bear markets, sideways markets)
- **Limitation**: Past performance doesn't guarantee future results
## Entry and Exit Strategies
### Dual-Channel System
A key innovation of the Bober XM is its dual-channel approach:
- **Independent Parameters**: Each trade direction has its own channel settings
- **Asymmetric Trading**: Recognizes that markets often behave differently in uptrends versus downtrends
- **Optimized Performance**: Fine-tune settings for both bullish and bearish conditions
This approach allows the bot to adapt to the natural asymmetry of markets, where uptrends often develop gradually while downtrends can be sharp and sudden.
### Channel Types
#### 1. Keltner Channels
Traditional volatility-based channels using EMA and ATR:
| Setting | Long Default | Short Default |
|---------|--------------|---------------|
| **EMA Length** | 37 | 20 |
| **ATR Length** | 13 | 17 |
| **Multiplier** | 1.4 | 1.9 |
| **Source** | low | high |
- **Strengths**:
- Reliable in trending markets
- Less prone to whipsaws than Bollinger Bands
- Clear visual representation of volatility
- **Weaknesses**:
- Can lag during rapid market changes
- Less effective in choppy, non-trending markets
#### 2. Machine Learning Moving Average (MLMA)
Advanced predictive model using kernel regression (RBF kernel):
| Setting | Description | Options |
|---------|-------------|--------|
| **Source MA** | Price data used for MA calculations | Any price source (low/high/close/etc.) |
| **Moving Average Type** | Type of MA algorithm for calculations | SMA, EMA, WMA, VWMA, RMA, HMA |
| **Trend Source** | Price data used for trend determination | Any price source (close default) |
| **Window Size** | Historical window for MLMA calculations | 5+ (default: 16) |
| **Forecast Length** | Number of bars to forecast ahead | 1+ (default: 3) |
| **Noise Parameter** | Controls smoothness of prediction | 0.01+ (default: ~0.43) |
| **Band Multiplier** | Multiplier for channel width | 0.1+ (default: 0.5-0.6) |
- **Strengths**:
- Predictive rather than reactive
- Adapts quickly to changing market conditions
- Better at identifying trend reversals early
- **Weaknesses**:
- More computationally intensive
- Requires careful parameter tuning
- Can be sensitive to input data quality
### Entry Strategies
| Strategy | Description | Ideal Market Conditions |
|----------|-------------|-------------------------|
| **Breakout** | Enters when price breaks through channel bands, indicating strong momentum | High volatility, emerging trends |
| **Pullback** | Enters when price retraces to the middle band after testing extremes | Established trends with regular pullbacks |
| **Mean Reversion** | Enters at channel extremes, betting on a return to the mean | Range-bound or oscillating markets |
#### Breakout Strategy (Default)
- **Implementation**: Enters long when price crosses above the upper band, short when price crosses below the lower band
- **Strengths**: Captures strong momentum moves, performs well in trending markets
- **Weaknesses**: Can lead to late entries, higher risk of false breakouts
- **Optimization Tips**:
- Increase channel multiplier for fewer but more reliable signals
- Combine with volume confirmation for better accuracy
#### Pullback Strategy
- **Implementation**: Enters long when price pulls back to middle band during uptrend, short during downtrend pullbacks
- **Strengths**: Better entry prices, lower risk, higher probability setups
- **Weaknesses**: Misses some strong moves, requires clear trend identification
- **Optimization Tips**:
- Use with trend filters to confirm overall direction
- Adjust middle band calculation for market volatility
#### Mean Reversion Strategy
- **Implementation**: Enters long at lower band, short at upper band, expecting price to revert to the mean
- **Strengths**: Excellent entry prices, works well in ranging markets
- **Weaknesses**: Dangerous in strong trends, can lead to fighting the trend
- **Optimization Tips**:
- Implement strong trend filters to avoid counter-trend trades
- Use smaller position sizes due to higher risk nature
### Confirmation Indicators
#### Pivot Point SuperTrend
Combines pivot points with ATR-based SuperTrend for trend confirmation:
| Setting | Default Value |
|---------|---------------|
| **Pivot Period** | 25 |
| **ATR Factor** | 2.2 |
| **ATR Period** | 41 |
- **Function**: Identifies significant market turning points and confirms trend direction
- **Implementation**: Requires price to respect the SuperTrend line for trade confirmation
#### Weighted Moving Average (WMA)
Provides additional confirmation layer for entries:
| Setting | Default Value |
|---------|---------------|
| **Period** | 15 |
| **Source** | ohlc4 (average of Open, High, Low, Close) |
- **Function**: Confirms trend direction and filters out low-quality signals
- **Implementation**: Price must be above WMA for longs, below for shorts
### Exit Strategies
#### On-Balance Volume (OBV) Based Exits
Uses volume flow to identify potential reversals:
| Setting | Default Value |
|---------|---------------|
| **Source** | ohlc4 |
| **MA Type** | HMA (Options: SMA, EMA, WMA, RMA, VWMA, HMA) |
| **Period** | 22 |
- **Function**: Identifies divergences between price and volume to exit before reversals
- **Implementation**: Exits when OBV crosses its moving average in the opposite direction
- **Customizable MA Type**: Different MA types provide varying sensitivity to OBV changes:
- **SMA**: Traditional simple average, equal weight to all periods
- **EMA**: More weight to recent data, responds faster to price changes
- **WMA**: Weighted by recency, smoother than EMA
- **RMA**: Similar to EMA but smoother, reduces noise
- **VWMA**: Factors in volume, helpful for OBV confirmation
- **HMA**: Reduces lag while maintaining smoothness (default)
#### ADX Exit Confirmation
Uses Average Directional Index to confirm trend exhaustion:
| Setting | Default Value |
|---------|---------------|
| **ADX Threshold** | 35 |
| **ADX Smoothing** | 60 |
| **DI Length** | 60 |
- **Function**: Confirms trend weakness before exiting positions
- **Implementation**: Requires ADX to drop below threshold or DI lines to cross
## Filter System
### RSI Filter
- **Function**: Controls entries based on momentum conditions
- **Parameters**:
- Period: 15 (default)
- Overbought level: 71
- Oversold level: 23
- Multi-timeframe support: Current, MTF1 (15min), or MTF2 (4h)
- Customizable price source (open, high, low, close, hl2, hlc3, ohlc4)
- **Implementation**: Blocks long entries when RSI > overbought, short entries when RSI < oversold
### Volatility Filter
- **Function**: Prevents trading during excessive market volatility
- **Parameters**:
- Measure: ATR (Average True Range)
- Period: Customizable (default varies by timeframe)
- Threshold: Adjustable multiplier
- Multi-timeframe support
- Customizable price source
- **Implementation**: Blocks trades when current volatility exceeds threshold × average volatility
### Volume Filter
- **Function**: Ensures adequate market liquidity for trades
- **Parameters**:
- Threshold: 0.4× average (default)
- Measurement period: 5 (default)
- Moving average type: Customizable (HMA default)
- Multi-timeframe support
- Customizable price source
- **Implementation**: Requires current volume to exceed threshold × average volume
### Bollinger Bands Filter
- **Function**: Controls entries based on price relative to statistical boundaries
- **Parameters**:
- Period: Customizable
- Standard deviation multiplier: Adjustable
- Moving average type: Customizable
- Multi-timeframe support
- Customizable price source
- **Implementation**: Can require price to be within bands or breaking out of bands depending on strategy
### KEMAD Filter (Kalman EMA Distance)
- **Function**: Advanced trend confirmation using Kalman filter algorithm
- **Parameters**:
- Process Noise: 0.35 (controls smoothness)
- Measurement Noise: 24 (controls reactivity)
- Filter Order: 6 (higher = more smoothing)
- ATR Length: 8 (for bandwidth calculation)
- Upper Multiplier: 2.0 (for long signals)
- Lower Multiplier: 2.7 (for short signals)
- Multi-timeframe support
- Customizable visual indicators
- **Implementation**: Generates signals based on price position relative to Kalman-filtered EMA bands
## Risk Management System
### Position Sizing
Automatically calculates position size based on account equity and risk parameters:
| Setting | Default Value |
|---------|---------------|
| **Risk % of Equity** | 50% |
- **Implementation**:
- Position size = (Account equity × Risk %) ÷ (Entry price × Stop loss distance)
- Adjusts automatically based on volatility and stop placement
- **Best Practices**:
- Start with lower risk percentages (1-2%) until strategy is proven
- Consider reducing risk during high volatility periods
### Stop-Loss Methods
Multiple stop-loss calculation methods with separate configurations for long and short positions:
| Method | Description | Configuration |
|--------|-------------|---------------|
| **ATR-Based** | Dynamic stops based on volatility | ATR Period: 14, Multiplier: 2.0 |
| **Percentage** | Fixed percentage from entry | Long: 1.5%, Short: 1.5% |
| **PIP-Based** | Fixed currency unit distance | 10.0 pips |
- **Implementation Notes**:
- ATR-based stops adapt to changing market volatility
- Percentage stops maintain consistent risk exposure
- PIP-based stops provide precise control in stable markets
### Trailing Stops
Locks in profits by adjusting stop-loss levels as price moves favorably:
| Setting | Default Value |
|---------|---------------|
| **Stop-Loss %** | 1.5% |
| **Activation Threshold** | 2.1% |
| **Trailing Distance** | 1.4% |
- **Implementation**:
- Initial stop remains fixed until profit reaches activation threshold
- Once activated, stop follows price at specified distance
- Locks in profit while allowing room for normal price fluctuations
### Risk-Reward Parameters
Defines the relationship between risk and potential reward:
| Setting | Default Value |
|---------|---------------|
| **Risk-Reward Ratio** | 1.4 |
| **Take Profit %** | 2.4% |
| **Stop-Loss %** | 1.5% |
- **Implementation**:
- Take profit distance = Stop loss distance × Risk-reward ratio
- Higher ratios require fewer winning trades for profitability
- Lower ratios increase win rate but reduce average profit
### Filter Combinations
The strategy allows for simultaneous application of multiple filters:
- **Recommended Combinations**:
- Trending markets: RSI + KEMAD filters
- Ranging markets: Bollinger Bands + Volatility filters
- All markets: Volume filter as minimum requirement
- **Performance Impact**:
- Each additional filter reduces the number of trades
- Quality of remaining trades typically improves
- Optimal combination depends on market conditions and timeframe
### Multi-Timeframe Filter Applications
| Filter Type | Current Timeframe | MTF1 (15min) | MTF2 (4h) |
|-------------|-------------------|-------------|------------|
| RSI | Quick entries/exits | Intraday trend | Overall trend |
| Volume | Immediate liquidity | Sustained support | Market participation |
| Volatility | Entry timing | Short-term risk | Regime changes |
| KEMAD | Precise signals | Trend confirmation | Major reversals |
## Visual Indicators and Chart Analysis
The bot provides comprehensive visual feedback on the chart:
- **Channel Bands**: Keltner or MLMA bands showing potential support/resistance
- **Pivot SuperTrend**: Colored line showing trend direction and potential reversal points
- **Entry/Exit Markers**: Annotations showing actual trade entries and exits
- **Risk/Reward Zones**: Visual representation of stop-loss and take-profit levels
These visual elements allow for:
- Real-time strategy assessment
- Post-trade analysis and optimization
- Educational understanding of the strategy logic
## Implementation Guide
### TradingView Setup
1. Load the script in TradingView Pine Editor
2. Apply to your preferred chart and timeframe
3. Adjust parameters based on your trading preferences
4. Enable alerts for webhook integration
### Webhook Integration
1. Configure webhook URL in TradingView alerts
2. Set up receiving endpoint on your trading platform
3. Define message format matching the bot's output
4. Test with small position sizes before full deployment
### Optimization Process
1. Backtest across different market conditions
2. Identify parameter sensitivity through multiple tests
3. Focus on risk management parameters first
4. Fine-tune entry/exit conditions based on performance metrics
5. Validate with out-of-sample testing
## Performance Considerations
### Strengths
- Adaptability to different market conditions through dual channels
- Multiple layers of confirmation reducing false signals
- Comprehensive risk management protecting capital
- Machine learning integration for predictive edge
### Limitations
- Complex parameter set requiring careful optimization
- Potential over-optimization risk with so many variables
- Computational intensity of MLMA calculations
- Dependency on proper webhook configuration for execution
### Best Practices
- Start with conservative risk settings (1-2% of equity)
- Test thoroughly in demo environment before live trading
- Monitor performance regularly and adjust parameters
- Consider market regime changes when evaluating results
## Conclusion
The ₿ober XM v2.0 represents a significant evolution in trading strategy design, combining traditional technical analysis with machine learning elements and multi-timeframe analysis. The core strength of this system lies in its adaptability and recognition of market asymmetry.
### Market Asymmetry and Adaptive Approach
The strategy acknowledges a fundamental truth about markets: bullish and bearish phases behave differently and should be treated as distinct environments. The dual-channel system with separate parameters for long and short positions directly addresses this asymmetry, allowing for optimized performance regardless of market direction.
### Targeted Backtesting Philosophy
It's counterproductive to run backtests over excessively long periods. Markets evolve continuously, and strategies that worked in previous market regimes may be ineffective in current conditions. Instead:
- Test specific market phases separately (bull markets, bear markets, range-bound periods)
- Regularly re-optimize parameters as market conditions change
- Focus on recent performance with higher weight than historical results
- Test across multiple timeframes to ensure robustness
### Multi-Timeframe Analysis as a Game-Changer
The integration of multi-timeframe analysis fundamentally transforms the strategy's effectiveness:
- **Increased Safety**: Higher timeframe confirmations reduce false signals and improve trade quality
- **Context Awareness**: Decisions made with awareness of larger trends reduce adverse entries
- **Adaptable Precision**: Apply strict filters on lower timeframes while maintaining awareness of broader conditions
- **Reduced Noise**: Higher timeframe data naturally filters market noise that can trigger poor entries
The ₿ober XM v2.0 provides traders with a framework that acknowledges market complexity while offering practical tools to navigate it. With proper setup, realistic expectations, and attention to changing market conditions, it delivers a sophisticated approach to systematic trading that can be continuously refined and optimized.

SuperTrend: Silent Shadow 🕶️ SuperTrend: Silent Shadow — Operate in trend. Vanish in noise.
Overview
SuperTrend: Silent Shadow is an enhanced trend-following system designed for traders who demand clarity in volatile markets and silence during indecision.
It combines classic Supertrend logic with a proprietary ShadowTrail engine and an adaptive Silence Protocol to filter noise and highlight only the cleanest signals.
Key Features
✅ Core Supertrend Logic
Built on Average True Range (ATR), this trend engine identifies directional bias with visual clarity. Lines adjust dynamically with price action and flip when meaningful reversals occur.
✅ ShadowTrail: Stepped Counter-Barrier
ShadowTrail doesn’t predict reversals — it reinforces structure.
When price is trending, ShadowTrail forms a stepped ceiling in downtrends and a stepped floor in uptrends. This visual containment zone helps define the edges of price behavior and offers a clear visual anchor for stop-loss placement and trade containment.
✅ Silence Protocol: Adaptive Noise Filtering
During low-volatility zones, the system enters “stealth mode”:
• Trend lines turn white to indicate reduced signal quality
• Fill disappears to reduce distraction
This helps avoid choppy entries and keeps your focus sharp when the market isn’t.
✅ Visual Support & Stop-Loss Utility
When trendlines flatten or pause, they naturally highlight price memory zones. These flat sections often align with:
• Logical stop-loss levels
• Prior support/resistance areas
• Zones of reduced volatility where price recharges or rejects
✅ Custom Styling
Full control over line colors, width, transparency, fill visibility, and silence behavior. Tailor it to your strategy and visual preferences.
How to Use
• Use Supertrend color to determine bias — flips mark momentum shifts
• ShadowTrail mirrors the primary trend as a structural ceiling/floor
• Use flat segments of both lines to identify consolidation zones or place stops
• White lines = low-quality signal → stand by
• Combine with RSI, volume, divergence, or your favorite tools for confirmation
Recommended For:
• Traders seeking clearer trend signals
• Avoiding false entries in sideways or silent markets
• Identifying key support/resistance visually
• Structuring stops around real market containment levels
• Scalping, swing, or position trading with adaptive clarity
Built by Sherlock Macgyver
Forged for precision. Designed for silence.
When the market speaks, you listen.
When it doesn’t — you wait in the shadows.

Weekly Moving Averages (MAs) to Intraday ChartThis indicator overlays key weekly timeframe moving averages onto your intraday chart, allowing you to visualize important long-term support and resistance levels while trading shorter timeframes. The indicator includes:
330-period Simple Moving Average (white): Ultra long-term trend indicator
200-period Simple Moving Average (fuchsia): Major long-term trend indicator often watched by institutional traders
100-period Simple Moving Average (purple): Medium-to-long term trend indicator
50-period Exponential Moving Average (blue): Medium-term trend indicator, more responsive to recent price action
21-period Exponential Moving Average (teal): Short-to-medium term trend indicator
9-period Exponential Moving Average (aqua): Short-term trend indicator, highly responsive to recent price movements
This multi-timeframe approach helps identify significant support/resistance zones that might not be visible on your current timeframe. When price interacts with these weekly moving averages during intraday trading, it often signals important areas where institutional orders may be placed.
The indicator uses color-coding with increasing line thickness to help you quickly distinguish between different moving averages. Consider areas where multiple MAs cluster together as particularly strong support/resistance zones.
Perfect for day traders and swing traders who want to maintain awareness of the bigger picture while focusing on shorter-term price action.

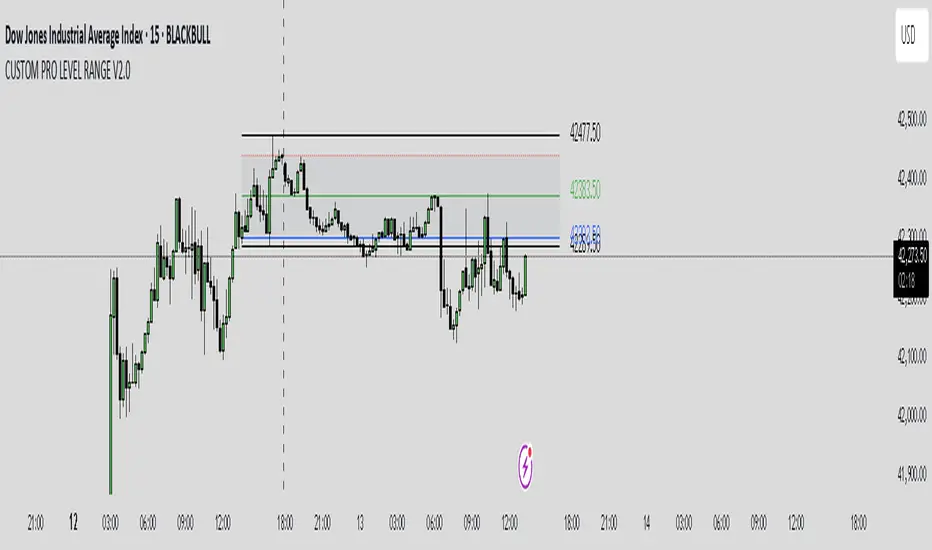
CUSTOM PRO RANGE V2.0 with AlertsCore Functions
Tracks High/Low Ranges
Daily (DR) or Initial (IDR) ranges within custom time windows (e.g., 9:30 AM–4:00 PM).
Optional extended hours (e.g., overnight).
Visual Tools
Draws boxes/lines for range boundaries, midpoints, and opening prices.
Custom colors/styles for clarity.
Smart Alerts
Notifies when price breaks high/low/mid of the range.
Avoids spam with once-per-bar alerts.
Flexible Timeframes
Works for intraday, daily, or even quarterly ranges with minor tweaks.
🎯 Who It Helps
Day Traders: Spot breakouts/reversals.
Swing Traders: Identify key support/resistance.
Analysts: Study price behavior in specific sessions.
Weekly Open Range [BigBeluga]
A precision weekly range tracker that captures early market positioning from the first moments of the trading week.
By dynamically measuring the highest and lowest points from the first three candles after the Sunday 21:00 UTC open, the indicator builds a reactive support and resistance framework for the week ahead.
It also visualizes the active range with a dynamic box and provides live updates of the current price movement against the established range boundaries.
🔵 KEY FEATURES
Automatically marks the weekly open range starting at Sunday 21:00 UTC .
Identify maximum high and minimum low from the first 3 candles after the weekly open.
if isWeeklyOpen or isWeeklyOpen or isWeeklyOpen or isWeeklyOpen
h = math.max(high, range_box.get_top())
l = math.min(low, range_box.get_bottom())
Draws two horizontal lines from the range extremes, acting as dynamic support/resistance zones throughout the week.
Visualizes the range with a semi-transparent box for clear zone identification.
Includes a compact dashboard panel with:
- Symbol and current price with bullish or bearish bar indication with ▲ / ▼
- Current weekly high/low range values
🔵 USAGE
Treat the high and low of the range as support/resistance zones for the week.
Combine with volume analysis or liquidity tools for entry confirmation .
Refresh your key levels every week as the indicator resets each Sunday night .
Works great alongside Smart Money Concepts (ICT) strategies and weekly planning.
Weekly Open Range gives traders a reliable structure to anchor their week. With clear range mapping, breakout signals, and intuitive visuals, it becomes a valuable part of any strategic trading approach—especially when precision timing around liquidity zones is key.

2HH2LL [CCE_Charts]Detects the "Two Higher Highs, Two Lower Lows" (2HH2LL) pattern formation and provides strength analysis with trade signals. The indicator displays visual markers, S/R zones, and clear signals for LONG or SHORT positions.
Pattern Description
The 2HH2LL pattern consists of two consecutive higher highs and two consecutive lower lows. This formation can signal potential trend reversals or continuations depending on market context.
Key Features
• Pattern strength analysis using S/R zone and volume confirmation
• Clear LONG or SHORT trade signals
• Visual markers highlighting pattern components
• Support/Resistance zone visualization
• Customizable alerts for real-time notifications
• Detailed information panel
How to Use This Indicator
1. Add the indicator to your chart
2. Configure settings based on your trading style
3. Look for the "2HH2LL" label when a valid pattern forms
4. Check the pattern strength (STRONG, MEDIUM, WEAK)
5. Note the trade direction signal (LONG or SHORT)
6. Verify the pattern with other technical tools
7. Set up alerts for real-time notifications
Settings Guide
Pattern Settings
• Lookback Period: Controls pivot point detection (5-50)
• Minimum Swing Strength: Required percentage change between highs/lows
Confirmation Settings
• S/R Zone Size: Size of support/resistance zone
• Volume Confirmation Threshold: Volume multiple required for confirmation
• Volume Average Period: Bars used for volume average calculation
Visual Settings
• Show H1/H2/L1/L2 Labels: Toggle pattern component labels
• Show S/R Zone: Toggle support/resistance zone display
Signal Settings
• Trade Direction: How trade direction is determined (SHORT, LONG, AUTO)
Alert Settings
• Alert on All Patterns: Trigger alerts for all valid patterns
• Alert on STRONG Patterns Only: Only alert on strong patterns
• Alert on Direction: Filter alerts by trade direction
Pattern Strength Analysis
The indicator classifies pattern strength into three categories:
• STRONG: Both confirmation factors present (S/R test and volume)
• MEDIUM: One confirmation factor present
• WEAK: No confirmation factors present
For best results, use this indicator in combination with other technical tools and always consider the broader market context.

Easy MA SignalsEasy MA Signals
Overview
Easy MA Signals is a versatile Pine Script indicator designed to help traders visualize moving average (MA) trends, generate buy/sell signals based on crossovers or custom price levels, and enhance chart analysis with volume-based candlestick coloring. Built with flexibility in mind, it supports multiple MA types, crossover options, and customizable signal appearances, making it suitable for traders of all levels. Whether you're a day trader, swing trader, or long-term investor, this indicator provides actionable insights while keeping your charts clean and intuitive.
Configure the Settings
The indicator is divided into three input groups for ease of use:
General Settings:
Candlestick Color Scheme: Choose from 10 volume-based color schemes (e.g., Sapphire Pulse, Emerald Spark) to highlight high/low volume candles. Select “None” for TradingView’s default colors.
Moving Average Length: Set the MA period (default: 20). Adjust for faster (lower values) or slower (higher values) signals.
Moving Average Type: Choose between SMA, EMA, or WMA (default: EMA).
Show Buy/Sell Signals: Enable/disable signal plotting (default: enabled).
Moving Average Crossover: Select a crossover type (e.g., MA vs VWAP, MA vs SMA50) for signals or “None” to disable.
Volume Influence: Adjust how volume impacts candlestick colors (default: 1.2). Higher values make thresholds stricter.
Signal Appearance Settings:
Buy/Sell Signal Shape: Choose shapes like triangles, arrows, or labels for signals.
Buy/Sell Signal Position: Place signals above or below bars.
Buy/Sell Signal Color: Customize colors for better visibility (default: green for buy, red for sell).
Custom Price Alerts:
Custom Buy/Sell Alert Price: Set specific price levels for alerts (default: 0, disabled). Enter a non-zero value to enable.
Set Up Alerts
To receive notifications (e.g., sound, popup, email) when signals or custom price levels are hit:
Click the Alert button (alarm clock icon) in TradingView.
Select Easy MA Signals as the condition and choose one of the four alert types:
MA Crossover Buy Alert: Triggers on MA crossover buy signals.
MA Crossover Sell Alert: Triggers on MA crossover sell signals.
Custom Buy Alert: Triggers when price crosses above the custom buy price.
Custom Sell Alert: Triggers when price crosses below the custom sell price.
Enable Play Sound and select a sound (e.g., “Bell”).
Set the frequency (e.g., Once Per Bar Close for confirmed signals) and create the alert.
Analyze the Chart
Moving Average Line: Displays the selected MA with color changes (green for bullish, red for bearish, gray for neutral) based on price position relative to the MA.
Buy/Sell Signals: Appear as shapes or labels when crossovers or custom price levels are hit.
Candlestick Colors: If a color scheme is selected, candles change color based on volume strength (high, low, or neutral), aiding in trend confirmation.
Why Use Easy MA Signals?
Easy MA Signals is designed to simplify technical analysis while offering advanced customization. It’s ideal for traders who want:
A clear visualization of MA trends and crossovers.
Flexible signal generation based on MA crossovers or custom price levels.
Volume-enhanced candlestick coloring to identify market strength.
Easy-to-use settings with tooltips for beginners and pros alike.
This script is particularly valuable because it combines multiple features into one indicator, reducing chart clutter and providing actionable insights without overwhelming the user.
Benefits of Easy MA Signals
Highly Customizable: Supports SMA, EMA, and WMA with adjustable lengths.
Offers multiple crossover options (VWAP, SMA10, SMA20, etc.) for tailored strategies.
Custom price alerts allow precise targeting of key levels.
Volume-Based Candlestick Coloring: 10 unique color schemes highlight volume strength, helping traders confirm trends.
Adjustable volume influence ensures adaptability to different markets.
Flexible Signal Visualization: Choose from various signal shapes (triangles, arrows, labels) and positions (above/below bars).
Customizable colors improve visibility on any chart background.
Alert Integration: Built-in alert conditions for crossovers and custom prices support sound, email, and app notifications.
Easy setup for real-time trading decisions.
User-Friendly Design: Organized input groups with clear tooltips make configuration intuitive.
Suitable for beginners and advanced traders alike.
Example Use Cases
Swing Trading with MA Crossovers:
Scenario: A trader wants to trade Bitcoin (BTC/USD) on a 4-hour chart using an EMA crossover strategy.
Setup:
Set Moving Average Type to EMA, Length to 20.
Set Moving Average Crossover to “MA vs SMA50”.
Enable Show Buy/Sell Signals and choose “arrowup” for buy, “arrowdown” for sell.
Select “Emerald Spark” for candlestick colors to highlight volume surges.
Usage: Buy when the EMA20 crosses above the SMA50 (green arrow appears) and volume is high (dark green candles). Sell when the EMA20 crosses below the SMA50 (red arrow). Set alerts for real-time notifications.
Scalping with Custom Price Alerts:
Scenario: A day trader monitors Tesla (TSLA) on a 5-minute chart and wants alerts at specific support/resistance levels.
Setup:
Set Custom Buy Alert Price to 150.00 (support) and Custom Sell Alert Price to 160.00 (resistance).
Use “labelup” for buy signals and “labeldown” for sell signals.
Keep Moving Average Crossover as “None” to focus on price alerts.
Usage: Receive a sound alert and label when TSLA crosses 150.00 (buy) or 160.00 (sell). Use volume-colored candles to confirm momentum before entering trades.
When NOT to Use Easy MA Signals
High-Frequency Trading: Reason: The indicator relies on moving averages and volume, which may lag in ultra-fast markets (e.g., sub-second trades). High-frequency traders may need specialized tools with real-time tick data.
Alternative: Use order book or market depth indicators for faster execution.
Low-Volatility or Sideways Markets:
Reason: MA crossovers and custom price alerts can generate false signals in choppy, range-bound markets, leading to whipsaws.
Alternative: Use oscillators like RSI or Bollinger Bands to trade within ranges.
This indicator is tailored more towards less experienced traders. And as always, paper trade until you are comfortable with how this works if you're unfamiliar with trading! We hope you enjoy this and have great success. Thanks for your interested in Easy MA Signals!

SwiftEdge NW EnvelopeSwiftEdge NW Envelope
Overview
The SwiftEdge NW Envelope is a visually striking technical indicator designed for traders seeking to identify high-probability buy and sell opportunities in volatile markets. By combining the Relative Strength Index (RSI), Average True Range (ATR), and Nadaraya-Watson Envelope, this indicator provides a unique blend of momentum, volatility, and non-linear trend analysis. Its futuristic, AI-inspired aesthetic—featuring neon gradients and dynamic colors—enhances chart readability while delivering actionable trading signals.
What It Does
The SwiftEdge NW Envelope generates buy and sell signals based on price interactions with dynamically calculated support and resistance bands, confirmed by RSI conditions. The indicator:
Plots a Nadaraya-Watson Envelope to identify smooth, non-linear price trends and dynamic support/resistance zones.
Uses ATR to scale the envelope’s bands, adapting to market volatility.
Employs RSI to confirm overbought/oversold conditions, ensuring signals align with momentum.
Visualizes signals with neon-colored markers, background zones, and labels for intuitive decision-making.
How It Works
The indicator integrates three key components:
Nadaraya-Watson Envelope:
A kernel-based regression technique that smooths price data to create a central trend line (mean) and dynamic upper/lower bands.
Unlike traditional moving averages, it provides a non-linear, adaptive view of price trends, making it ideal for capturing complex market movements.
The band width is determined by ATR, ensuring responsiveness to volatility.
Average True Range (ATR):
Measures market volatility to scale the envelope’s bands.
A multiplier (default: 0.5) adjusts the sensitivity of the bands, allowing traders to fine-tune the indicator for different assets or market conditions.
Relative Strength Index (RSI):
A momentum oscillator with a shortened period (default: 5) for increased sensitivity.
Confirms buy signals when RSI is oversold (default: <30) and sell signals when RSI is overbought (default: >70).
Signal Logic
Buy Signal: Triggered when the price crosses above the lower band of the Nadaraya-Watson Envelope and RSI is below the oversold threshold. Marked by a green circle and a "BUY" label below the candle.
Sell Signal: Triggered when the price crosses below the upper band and RSI is above the overbought threshold. Marked by a magenta circle and a "SELL" label above the candle.
Background Zones: Green (buy) or red (sell) translucent zones highlight signal areas for quick recognition.
Visual Features
Dynamic Colors: The central trend line shifts between cyan (uptrend), purple (downtrend), or gray (neutral) based on price position relative to the mean.
Neon Gradient Fill: A translucent blue fill between the upper (green) and lower (red) bands creates a glowing, futuristic effect.
Modern Signal Markers: Small, vibrant circles (green for buy, magenta for sell) and clear labels enhance visual clarity.
Why This Combination?
The SwiftEdge NW Envelope combines RSI, ATR, and Nadaraya-Watson Envelope to create a robust trading tool:
RSI provides momentum confirmation, filtering out false signals in choppy markets.
ATR ensures the envelope adapts to changing volatility, making it suitable for both trending and ranging markets.
Nadaraya-Watson Envelope offers a sophisticated, non-linear alternative to traditional bands (e.g., Bollinger Bands), capturing subtle price dynamics. Together, these components deliver a balanced approach to trend-following and mean-reversion strategies, with RSI acting as a gatekeeper to improve signal reliability.
Customize Settings:
RSI Period (5): Adjust for more/less sensitivity to momentum.
RSI Overbought/Oversold (70/30): Modify thresholds to tighten or loosen signal conditions.
ATR Period (14) and Multiplier (0.5): Tune volatility sensitivity.
NW Length (25), Bandwidth (8.0), Multiplier (3.0): Adjust the smoothness and width of the envelope.
Interpret Signals:
Buy: Look for green circles and "BUY" labels when price crosses above the lower band, confirmed by low RSI.
Sell: Look for magenta circles and "SELL" labels when price crosses below the upper band, confirmed by high RSI.
Use background zones to quickly spot active signal areas.
Combine with Other Tools:
Pair with support/resistance levels or volume analysis for additional confirmation.
Test signals on a demo account before live trading.
Originality
The SwiftEdge NW Envelope stands out due to:
Its innovative use of Nadaraya-Watson regression, a less common but powerful tool for non-linear trend analysis.
A unique visual design with neon gradients and dynamic colors, inspired by AI and futuristic interfaces, making it both functional and visually engaging.
A streamlined signal system that balances momentum (RSI), volatility (ATR), and trend (Nadaraya-Watson), reducing noise and enhancing trade precision.
Notes
Best suited for volatile markets (e.g., forex, crypto, stocks) where price swings create clear envelope breakouts.
Adjust input parameters to match your trading style (e.g., shorter RSI period for scalping, wider bands for swing trading).
Always backtest and validate signals in your specific market and timeframe before trading.

Midnight (Daily) OpenMidnight (Daily) Open v1.0
Overview
Plots a real‑time horizontal line at the U.S. session “midnight” open (i.e. the daily candle’s open price) on any intraday chart. Optionally displays a label with the exact price, making it easy to see how price reacts to the session open.
Key Benefits
Immediate Context: See at a glance where today’s session began, helping identify support/resistance.
Consistent Reference: Works on any symbol or intraday timeframe.
Customizable Styling: Tweak colors, line thickness, and label appearance to match your chart theme.
Features
Retrieves the daily open via request.security() (Pine v6).
Draws or updates a single horizontal line that extends into the future.
Optional price label on the last bar, with user‑defined text and background colors.
Zero repainting—always shows the true daily open.

Bounty SeekerBounty Seeker - Advanced Market Structure & Order Block Detection
A sophisticated indicator that identifies high-probability reversal zones through the analysis of market structure, volume patterns, and institutional order blocks. This tool helps traders spot potential reversals and fake-outs with precision.
Core Components:
1. Pivot Detection System
• Smart pivot high/low identification
• Volume-enhanced confirmation
• RSI confluence validation
• Real-time market structure analysis
2. Order Block Detection
• Institutional buying/selling zones
• Historical support/resistance levels
• Smart volume threshold analysis
• Dynamic level adaptation
Signal Types:
1. Bull Pivots (White X)
• Strong volume confirmation
• RSI oversold conditions
• Price action validation
• Order block confluence
2. Bear Pivots (Purple X)
• Volume surge confirmation
• RSI overbought alignment
• Bearish price action
• Resistance zone validation
3. Fake Pivots (Orange X)
• Low volume warning signals
• Trap zone identification
• False breakout detection
• Risk management guide
Visual Elements:
• Dashed Lines: Order block zones
• White/Purple X's: Major pivot points
• Orange X's: Potential fake moves
• Dynamic support/resistance levels
Best Usage Practices:
• Most effective on 1H+ timeframes
• Focus on major market pairs
• Wait for complete signal formation
• Combine with trend direction
• Monitor volume confirmation
• Use proper position sizing
The indicator excels at:
1. Identifying potential reversal zones
2. Detecting institutional order blocks
3. Warning of potential fake moves
4. Providing clear entry/exit levels
5. Highlighting strong volume zones
Risk Management:
• Always wait for signal confirmation
• Use appropriate stop loss levels
• Consider multiple timeframe analysis
• Don't trade against major trends
• Monitor volume for validation
This indicator combines advanced market structure analysis with volume profiling to help traders identify high-probability trading opportunities while warning of potential traps and fake-outs.
Note: Past performance does not guarantee future results. Always use proper risk management techniques.
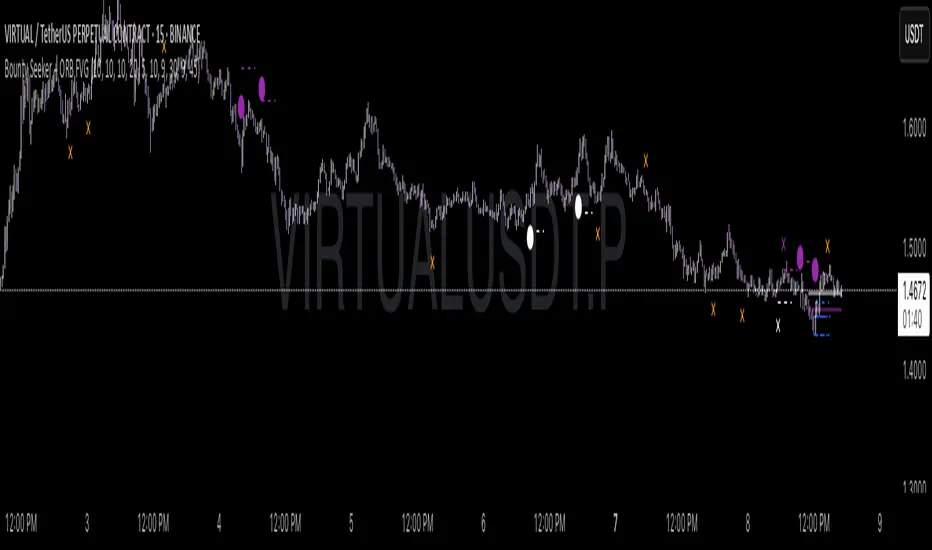
Trading Sessions [BigBeluga]
This indicator brings Smart Money Concept (ICT) session logic to life by plotting key global trading sessions with volume and delta analytics. It not only highlights session ranges but also tracks their midpoints — which often act as intraday support/resistance levels.
🔵 KEY FEATURES
Visual session boxes: Plots boxes for Tokyo, London, New York, and Sydney sessions based on user-defined UTC+0 time ranges.
Volume & delta metrics: Displays total volume and delta volume (buy–sell difference) within each session.
Mid, High & Low Range Extension: Once a session ends, the high, low, and midpoint levels automatically extend — ideal for detecting SR zones.
Session labels: Each box includes a label with session name, time, volume, and delta for quick reference.
Custom session control: Enable or disable sessions individually and configure start/end times.
Clean aesthetics: Transparent shaded boxes with subtle borders make it easy to overlay without clutter.
Sessions Dashboard: Shows the time range of each session and tells you whether the session is currently active.
🔵 USAGE
Enable the sessions you want to monitor (e.g., New York or Tokyo) from the settings.
Use session volume and delta values to gauge the strength and direction of institutional activity.
Watch for price interaction with the extended range — it often acts as dynamic support/resistance after the session ends.
Overlay it with liquidity tools or breaker blocks for intraday strategy alignment.
🔵 EXAMPLES
Extended Future Range acted as resistance/support.
Delta value helped confirm bullish pressure during New York open.
Multiple sessions helped identify kill zone overlaps and high-volume turns.
Trading Sessions is more than just a visual scheduler — it's a precision tool for traders who align with session-based volume dynamics and ICT methodology. Use it to define high-probability zones, confirm volume shifts, and read deeper into the true intent behind market structure.

Dskyz (DAFE) Aurora Divergence - Dskyz (DAFE) Aurora Divergence Indicator
Advanced Divergence Detection for Traders. Unleash the power of divergence trading with this cutting-edge indicator that combines price and volume analysis to spot high-probability reversal signals.
🧠 What Is It?
The Dskyz (DAFE) Aurora Divergence Indicator is designed to identify bullish and bearish divergences between the price trend and the On Balance Volume (OBV) trend. Divergence occurs when the price of an asset and a technical indicator (in this case, OBV) move in opposite directions, signaling a potential reversal. This indicator uses linear regression slopes to calculate the trends of both price and OBV over a specified lookback period, detecting when these two metrics are diverging. When a divergence is detected, it highlights potential reversal points with visually striking aurora bands, orbs, and labels, making it easy for traders to spot key signals.
⚙️ Inputs & How to Use Them
The indicator is highly customizable, with inputs grouped under "⚡ DAFE Aurora Settings" for clarity. Here’s how each input works:
Lookback Period: Determines how many bars are used to calculate the price and OBV slopes. Higher values detect longer-term trends (e.g., 20 for 1H charts), while lower values are more responsive to short-term movements.
Price Slope Threshold: Sets the minimum slope value for the price to be considered in an uptrend or downtrend. A value of 0 allows all slopes to be considered, while higher values filter for stronger trends.
OBV Slope Threshold: Similar to the price slope threshold but for OBV. Helps filter out weak volume trends.
Aurora Band Width: Adjusts the width of the visual bands that highlight divergence areas. Wider bands make the indicator more visible but may clutter the chart.
Divergence Sensitivity: Scales the strength of the divergence signals. Higher values make the indicator more sensitive to smaller divergences.
Minimum Strength: Filters out weak signals by only showing divergences above this strength level. A default of 0.3 is recommended for beginners.
Signal Cooldown (Bars): Prevents multiple signals from appearing too close together. Default is 5 bars, reducing chart clutter and helping traders focus on significant signals.
These inputs allow traders to fine-tune the indicator to match their trading style and timeframe.
🚀 What Makes It Unique?
This indicator stands out with its innovative features:
Price-Volume Divergence: Combines price trend (slope) and OBV trend for more reliable signals than price-only divergences.
Aurora Bands: Dynamic visual bands that highlight divergence zones, making it easier to spot potential reversals at a glance.
Interactive Dashboard: Displays real-time information on trend direction, volume flow, signal type, strength, and recommended actions (e.g., "Consider Buying" or "Consider Selling").
Signal Cooldown: Ensures only the most significant divergences are shown, reducing noise and improving usability.
Alerts: Built-in alerts for both bullish and bearish divergences, allowing traders to stay informed even when not actively monitoring the chart.
Beginner Guide: Explains the indicator’s visuals (e.g., aqua orbs for bullish signals, fuchsia orbs for bearish signals), making it accessible for new users.
🎯 Why It Works
The indicator’s effectiveness lies in its use of price-volume divergence, a well-established concept in technical analysis. When the price trend and OBV trend diverge, it often signals a potential reversal because the underlying volume support (or lack thereof) is not aligning with the price action. For example:
Bullish Divergence: Occurs when the price is making lower lows, but the OBV is making higher lows, indicating weakening selling pressure and potential upward reversal.
Bearish Divergence: Occurs when the price is making higher highs, but the OBV is making lower highs, suggesting weakening buying pressure and potential downward reversal.
The use of linear regression ensures smooth and accurate trend calculations over the specified lookback period. The divergence strength is then normalized and filtered based on user-defined thresholds, ensuring only high-quality signals are displayed. Additionally, the cooldown period prevents signal overload, allowing traders to focus on the most significant opportunities.
🧬 Indicator Recommendation
Best For: Traders looking to identify potential trend reversals in any market, especially those where volume data is reliable (e.g., stocks, futures, forex).
Timeframes: Suitable for all timeframes. Adjust the lookback period accordingly—smaller values for shorter timeframes (e.g., 1H), larger for longer ones (e.g., 4H or daily).
Pair With: Support and resistance levels, trend lines, other oscillators (e.g., RSI, MACD) for confirmation, and volume profile tools for deeper analysis.
Tips:
Look for divergences at key support/resistance levels for higher-probability setups.
Pay attention to signal strength; higher strength divergences are often more reliable.
Use the dashboard to quickly assess market conditions before entering a trade.
Set up alerts to catch divergences even when not actively watching the chart.
🧾 Credit & Acknowledgement
This indicator builds upon the classic concept of price-volume divergence, enhancing it with modern visualization techniques, advanced filtering, and user-friendly features. It is designed to provide traders with a powerful yet intuitive tool for spotting reversals.
📌 Final Thoughts
The Dskyz (DAFE) Aurora Divergence Indicator is more than just a divergence tool; it’s a comprehensive trading assistant that combines advanced calculations, intuitive visualizations, and actionable insights. Whether you’re a seasoned trader or just starting out, this indicator can help you spot high-probability reversal points with confidence.
Use it with discipline. Use it with clarity. Trade smarter.
**I will continue to release incredible strategies and indicators until I turn this into a brand or until someone offers me a contract.
-Dskyz
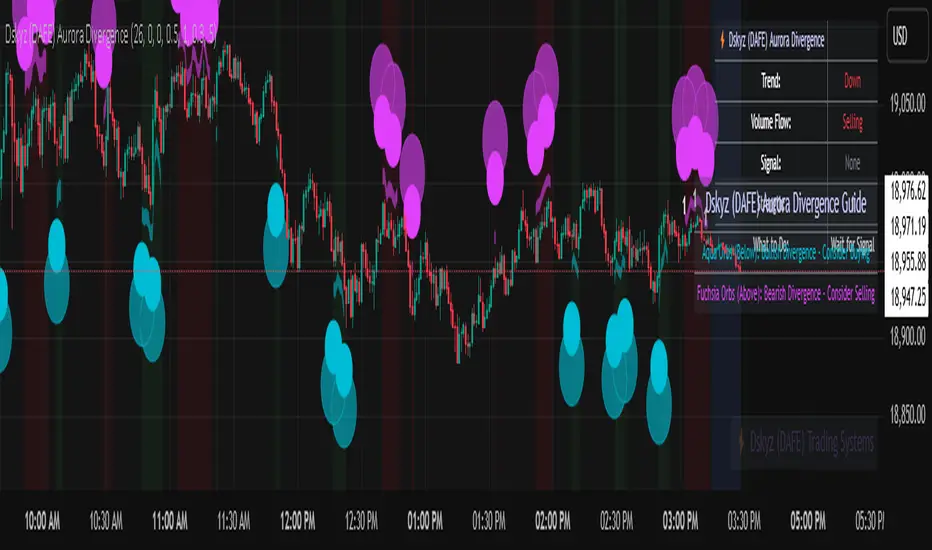
EMA 9/21/50 + VWAP + MACD + RSI Pro [v6]Overview:
A powerful multi-indicator tool combining Exponential Moving Averages (EMA 9, 21, 50), Volume-Weighted Average Price (VWAP), Moving Average Convergence Divergence (MACD), and Relative Strength Index (RSI) into a single, easy-to-read system. Designed for traders who want a clean, all-in-one dashboard for trend analysis, momentum confirmation, and overbought/oversold conditions.
Key Features:
1. Triple EMA System (9, 21, 50)
Identifies short-term and medium-term trends.
Bullish Signal: EMA 9 > EMA 21 > EMA 50 (Green Highlight)
Bearish Signal: EMA 9 < EMA 21 < EMA 50 (Red Highlight)
Helps confirm trend direction and potential reversals.
2. VWAP (Volume-Weighted Average Price)
Tracks intraday fair value price based on volume.
Bullish: Price above VWAP (Green)
Bearish: Price below VWAP (Red)
3. MACD (Standard 12, 26, 9 Settings)
Shows momentum shifts.
Bullish: MACD line > Signal line (Green)
Bearish: MACD line < Signal line (Red)
Histogram confirms strength of momentum.
4. RSI (14-Period Default)
Identifies overbought (>70) and oversold (<30) conditions.
Red: Overbought (Potential Reversal)
Green: Oversold (Potential Bounce)
5. Signal Dashboard (Top-Right Table)
Real-time summary of all indicators in one place.
Color-coded for quick interpretation (Green = Bullish, Red = Bearish).
How to Use This Indicator?
✅ Trend Confirmation:
Trade in the direction of EMA alignment (9 > 21 > 50 for uptrends).
Use VWAP as dynamic support/resistance.
✅ Momentum Entries:
Look for MACD crossovers while RSI is not extreme.
Avoid buying when RSI > 70 or selling when RSI < 30 (unless strong trend).
✅ Mean Reversion:
Fade extreme RSI readings (overbought/oversold) when price is at key levels.
Who Is This For?
✔ Swing Traders – EMA + MACD combo for trend-following.
✔ Day Traders – VWAP + EMA for intraday bias.
✔ RSI Traders – Clear overbought/oversold signals.
Settings Customization:
Adjust EMA lengths, RSI periods, and MACD settings as needed.
Toggle VWAP visibility on/off.
Why Use This Script?
📌 All-in-One: No need for multiple indicators cluttering your chart.
📌 Visual Clarity: Color-coded signals for quick decision-making.
📌 Flexible: Works on any timeframe (1M, 5M, 1H, Daily, etc.).
Install now and enhance your trading strategy with a professional-grade multi-indicator system!
Not a financial advice. Use at your own discretion and always apply risk management

Smarter Money Concepts - OBs [PhenLabs]📊 Smarter Money Concepts - OBs
Version: PineScript™ v6
📌 Description
Smarter Money Concepts - OBs (Order Blocks) is an advanced technical analysis tool designed to identify and visualize institutional order zones on your charts. Order blocks represent significant areas of liquidity where smart money has entered positions before major moves. By tracking these zones, traders can anticipate potential reversals, continuations, and key reaction points in price action.
This indicator incorporates volume filtering technology to identify only the most significant order blocks, eliminating low-quality signals and focusing on areas where institutional participation is likely present. The combination of price structure analysis and volume confirmation provides traders with high-probability zones that may attract future price action for tests, rejections, or breakouts.
🚀 Points of Innovation
Volume-Filtered Block Detection : Identifies only order blocks formed with significant volume, focusing on areas with institutional participation
Advanced Break of Structure Logic : Uses sophisticated price action analysis to detect legitimate market structure breaks preceding order blocks
Dynamic Block Management : Intelligently tracks, extends, and removes order blocks based on price interaction and time-based expiration
Structure Recognition System : Employs technical analysis algorithms to find significant swing points for accurate order block identification
Dual Directional Tracking : Simultaneously monitors both bullish and bearish order blocks for comprehensive market structure analysis
🔧 Core Components
Order Block Detection : Identifies institutional entry zones by analyzing price action before significant breaks of structure, capturing where smart money has likely positioned before moves.
Volume Filtering Algorithm : Calculates relative volume compared to a moving average to qualify only order blocks formed with significant market participation, eliminating noise.
Structure Break Recognition : Uses price action analysis to detect legitimate breaks of market structure, ensuring order blocks are identified only at significant market turning points.
Dynamic Block Management : Continuously monitors price interaction with existing blocks, extending, maintaining, or removing them based on current market behavior.
🔥 Key Features
Volume-Based Filtering : Filter out insignificant blocks by requiring a minimum volume threshold, focusing only on zones with likely institutional activity
Visual Block Highlighting : Color-coded boxes clearly mark bullish and bearish order blocks with customizable appearance
Flexible Mitigation Options : Choose between “Wick” or “Close” methods for determining when a block has been tested or mitigated
Scan Range Adjustment : Customize how far back the indicator looks for structure points to adapt to different market conditions and timeframes
Break Source Selection : Configure which price component (close, open, high, low) is used to determine structure breaks for precise block identification
🎨 Visualization
Bullish Order Blocks : Blue-colored rectangles highlighting zones where bullish institutional orders were likely placed before upward moves, representing potential support areas.
Bearish Order Blocks : Red-colored rectangles highlighting zones where bearish institutional orders were likely placed before downward moves, representing potential resistance areas.
Block Extension : Order blocks extend to the right of the chart, providing clear visualization of these significant zones as price continues to develop.
📖 Usage Guidelines
Order Block Settings
Scan Range : Default: 25. Defines how many bars the indicator scans to determine significant structure points for order block identification.
Bull Break Price Source : Default: Close. Determines which price component is used to detect bullish breaks of structure.
Bear Break Price Source : Default: Close. Determines which price component is used to detect bearish breaks of structure.
Visual Settings
Bullish Blocks Color : Default: Blue with 85% transparency. Controls the appearance of bullish order blocks.
Bearish Blocks Color : Default: Red with 85% transparency. Controls the appearance of bearish order blocks.
General Options
Block Mitigation Method : Default: Wick, Options: Wick, Close. Determines how block mitigation is calculated - “Wick” uses high/low values while “Close” uses close values for more conservative mitigation criteria.
Remove Filled Blocks : Default: Disabled. When enabled, order blocks are removed once they’ve been mitigated by price action.
Volume Filter
Volume Filter Enabled : Default: Enabled. When activated, only shows order blocks formed with significant volume relative to recent average.
Volume SMA Period : Default: 15, Range: 1-50. Number of periods used to calculate the average volume baseline.
Min. Volume Ratio : Default: 1.5, Range: 0.5-10.0. Minimum volume ratio compared to average required to display an order block; higher values filter out more blocks.
✅ Best Use Cases
Identifying high-probability support and resistance zones for trade entries and exits
Finding optimal stop-loss placement behind significant order blocks
Detecting potential reversal areas where price may react after extended moves
Confirming breakout trades when price clears major order blocks
Building a comprehensive market structure map for medium to long-term trading decisions
Pinpointing areas where smart money may have positioned before major market moves
⚠️ Limitations
Most effective on higher timeframes (1H and above) where institutional activity is more clearly defined
Can generate multiple signals in choppy market conditions, requiring additional filtering
Volume filtering relies on accurate volume data, which may be less reliable for some securities
Recent market structure changes may invalidate older order blocks not yet automatically removed
Block identification is based on historical price action and may not predict future behavior with certainty
💡 What Makes This Unique
Volume Intelligence : Unlike basic order block indicators, this script incorporates volume analysis to identify only the most significant institutional zones, focusing on quality over quantity.
Structural Precision : Uses sophisticated break of structure algorithms to identify true market turning points, going beyond simple price pattern recognition.
Dynamic Block Management : Implements automatic block tracking, extension, and cleanup to maintain a clean and relevant chart display without manual intervention.
Institutional Focus : Designed specifically to highlight areas where smart money has likely positioned, helping retail traders align with institutional perspectives rather than retail noise.
🔬 How It Works
1. Structure Identification Process :
The indicator continuously scans price action to identify significant swing points and structure levels within the specified range, establishing a foundation for order block recognition.
2. Break Detection :
When price breaks an established structure level (crossing below a significant low for bearish breaks or above a significant high for bullish breaks), the indicator marks this as a potential zone for order block formation.
3. Volume Qualification :
For each potential order block, the algorithm calculates the relative volume compared to the configured period average. Only blocks formed with volume exceeding the minimum ratio threshold are displayed.
4. Block Creation and Management :
Valid order blocks are created, tracked, and managed as price continues to develop. Blocks extend to the right of the chart until they are either mitigated by price action or expire after the designated timeframe.
5. Continuous Monitoring :
The indicator constantly evaluates price interaction with existing blocks, determining when blocks have been tested, mitigated, or invalidated, and updates the visual representation accordingly.
💡 Note:
Order Blocks represent areas where institutional traders have likely established positions and may defend these zones during future price visits. For optimal results, use this indicator in conjunction with other confluent factors such as key support/resistance levels, trendlines, or additional confirmation indicators. The most reliable signals typically occur on higher timeframes where institutional activity is most prominent. Start with the default settings and adjust parameters gradually to match your specific trading instrument and style.

Multi-Timeframe Price LevelsThis indicator displays key price levels from multiple timeframes on your chart, helping you identify important support and resistance zones.
## Features
- **Multiple Timeframes**: View price levels from 4H, Daily, 3-Day, Weekly, and Monthly charts simultaneously
- **Customizable Price Types**: Choose to display Open, Close, High, and Low prices
- **Color-Coded**: Each timeframe has its own color for easy identification
- **Fully Customizable**: Enable/disable specific timeframes and price types as needed
## How to Use
1. Add the indicator to your chart
2. Use the input options to select which timeframes and price types you want to display
3. Look for areas where multiple price levels converge - these often act as strong support/resistance zones
## Color Guide
- **Red**: 4-Hour timeframe
- **Blue**: Daily timeframe
- **Green**: 3-Day timeframe
- **Purple**: Weekly timeframe
- **Orange**: Monthly timeframe
For each timeframe, the transparency varies by price type:
- Open: 70% transparency
- Close: 50% transparency
- High: 30% transparency
- Low: 10% transparency (most visible)
## Trading Applications
- Identify key support and resistance levels
- Spot multi-timeframe confluences for stronger trade setups
- Plan entries and exits based on historical price reactions
- Set stop losses and take profit targets at significant levels
This indicator works best when combined with your existing trading strategy to confirm important price zones.

Smart Dynamic Levels [ATR-Based]Smart Dynamic Levels
Automated Support & Resistance Levels Based on Market Volatility
Overview:
This advanced indicator automatically plots dynamic support and resistance levels based on the Average True Range (ATR), creating meaningful price zones that adapt to changing market conditions. Unlike static round-number levels, these volatility-adjusted zones provide more relevant technical reference points.
Key Features:
Volatility-Responsive: Levels automatically adjust based on the asset's ATR
Smart Visualization:
Color gradient shows strength of each level (darker = stronger)
Bullish (green) levels below price, bearish (red) levels above
Customizable Settings:
Adjust ATR length (14-period default)
Modify level sensitivity with ATR multiplier (1.5x default)
Choose number of levels to display (5 above/below default)
Toggle labels and line extensions
How It Works:
Calculates the asset's true volatility using ATR
Rounds to significant price intervals based on current volatility
Plots equidistant levels above and below current price
Colors levels based on their position relative to price
Automatically updates as market conditions change
Recommended Use:
Day Trading: Identify intraday support/resistance zones
Swing Trading: Spot potential reversal areas
Breakout Trading: Watch for moves beyond key levels
Works on all markets: Stocks, Forex, Crypto, Futures
Settings Guide:
ATR Length: Higher values for smoother levels (14-20)
Multiplier: Increase for wider levels (1.5-3x)
Levels Count: More levels for higher timeframes (3-10)
Pro Tips:
Combine with trend analysis - levels are more significant when aligned with trend
Watch for price reactions at these levels for confirmation
Use wider levels (higher multiplier) for volatile assets

Multiple MAsHere's a well-written description in English for your "Multiple MAs" indicator that you can use when publishing on TradingView. It’s concise, professional, and highlights the key features of the indicator while explaining its purpose for traders.
---
### Multiple MAs Indicator
#### Overview
The **Multiple MAs** indicator is a versatile and straightforward tool designed to help traders visualize price trends using multiple Simple Moving Averages (SMAs) on a single chart. By plotting six SMAs with customizable lengths (MA5, MA10, MA20, MA50, MA100, and MA200), this indicator provides a clear view of short-term, medium-term, and long-term trends, making it ideal for trend-following strategies, crossover analysis, and identifying potential support/resistance levels.
#### Features
- **Customizable MA Lengths**: Adjust the periods of all six moving averages (MA5, MA10, MA20, MA50, MA100, MA200) to suit your trading style and timeframe.
- **Distinct Visuals**: Each MA is plotted with a unique color and line width for easy identification:
- MA5 (Dodger Blue, 1px)
- MA10 (Green, 1px)
- MA20 (Red, 2px)
- MA50 (Purple, 3px)
- MA100 (Gray, 3px)
- MA200 (White, 3px)
- **Overlay on Price Chart**: The indicator overlays directly on the price chart, allowing for seamless integration with other technical analysis tools.
- **High Precision**: Displays values with 8-decimal precision, ensuring accuracy for assets with small price movements (e.g., forex pairs or cryptocurrencies).
#### How to Use
1. **Trend Identification**: Use the longer MAs (e.g., MA100, MA200) to determine the overall trend direction. If the price is above these MAs, the trend is likely bullish; if below, it’s likely bearish.
2. **Crossover Signals**: Look for crossovers between shorter MAs (e.g., MA5 crossing MA20) for potential entry or exit signals. For example:
- A bullish signal occurs when a shorter MA crosses above a longer MA.
- A bearish signal occurs when a shorter MA crosses below a longer MA.
3. **Support and Resistance**: MAs often act as dynamic support or resistance levels. Watch for price reactions around these lines, especially the MA50, MA100, and MA200.
4. **Divergence Analysis**: Compare the slope of different MAs to identify potential trend reversals or weakening momentum.
#### Settings
- **MA5 Length**: Default is 5 bars.
- **MA10 Length**: Default is 10 bars.
- **MA20 Length**: Default is 20 bars.
- **MA50 Length**: Default is 50 bars.
- **MA100 Length**: Default is 100 bars.
- **MA200 Length**: Default is 200 bars.
#### Best Practices
- **Timeframe**: This indicator works on any timeframe but is particularly effective on daily, 4-hour, and 1-hour charts for swing trading or trend-following strategies.
- **Combine with Other Tools**: Pair the Multiple MAs with other indicators like RSI, MACD, or volume analysis to confirm signals and avoid false breakouts.
- **Adjust for Volatility**: For highly volatile assets, consider increasing the MA lengths to reduce noise and focus on broader trends.
#### Notes
- The indicator is lightweight and optimized for performance, ensuring it runs smoothly even on lower timeframes.
- Colors and line widths are pre-set for clarity but can be customized in the indicator settings if needed.
#### Credits
Created by kosar_v. Feedback and suggestions are welcome to improve this tool for the TradingView community!

Market Push Meter - CoffeeStyleMarket Push Meter - CoffeeKiller Indicator Guide
Welcome traders! This guide will walk you through the Market Push Meter indicator, a sophisticated volume analysis tool developed by CoffeeKiller with the help and assistance of FindBetterTrades that measures and visualizes the ongoing battle between buyers and sellers through volume pressure analysis.
🔔 **Warning: This Is Not a Standard Volume Indicator** 🔔 This indicator analyzes volume pressure in a unique way, combining directional volume with price action to identify market imbalances between buyers and sellers. All credit for the core logic for this indicator goes to FindBetterTrades and his/hers Volume Pressure Histogram (Normalized) (this is my adaptation and style added to that core logic, thus the CoffeeStyle name was added).
Core Concept: Volume Pressure Analysis
The foundation of this indicator lies in measuring the imbalance between buying and selling volume, providing insights into which market participants are exerting more pressure on price movements.
Volume Pressure Columns: Buying vs Selling Force
- Positive Green Columns: Net buying pressure
- Negative Red Columns: Net selling pressure
- Color intensity varies based on pressure strength
- Special coloring for new high/low boundaries
Marker Lines: Dynamic Support/Resistance
- High Marker Line (Magenta): Tracks the highest point reached during buying phases
- Low Marker Line (Cyan): Tracks the lowest point reached during selling phases
- Creates visual boundaries showing pressure extremes
Peak Detection System:
- Triangular markers identify significant local maxima and minima
- Background highlighting shows important pressure peaks
- Helps identify potential reversal points and pressure exhaustion
Reference Lines:
- Overbought Level: Threshold for extreme selling pressure
- Oversold Level: Threshold for extreme buying pressure
- Used to identify potential reversal zones
Core Components
1. Volume Pressure Calculation
- Separation of up-volume and down-volume
- Calculation of net volume pressure
- Smoothing for consistent visualization
- Normalization against total volume for percentage scaling
2. Boundary Tracking System
- Automatic detection of highest values in buying phases
- Automatic detection of lowest values in selling phases
- Step-line visualization of boundaries
- Color-coded for easy identification
3. Peak Detection System
- Identification of local maxima and minima
- Background highlighting of significant peaks
- Triangle markers for peak visualization
- Zero-line cross detection for trend changes
4. Threshold Settings
- Extreme threshold multiplier for identifying significant pressure
- Overbought/oversold levels for potential reversals
- Dynamic color coding based on pressure intensity
- Alert conditions for key pressure levels
Main Features
Volume Analysis Settings
- Customizable volume MA length
- Signal smoothing for clearer readings
- Optional log scale for handling wide range variations
- Adjustable threshold multiplier for sensitivity
Visual Elements
- Color-coded columns showing pressure direction and strength
- Dynamic marker lines for pressure boundaries
- Peak triangles for significant turning points
- Background highlighting for peak identification
- Overbought/oversold reference lines
Signal Generation
- Zero-line crosses for trend change signals
- Boundary breaks for pressure strength
- Peak formation for potential reversals
- Color changes for pressure direction and intensity
- Alert conditions for extreme pressure levels
Customization Options
- Volume analysis parameters
- Marker line visibility and colors
- Peak marker display options
- Log scale toggle for handling various markets
- Overbought/oversold threshold adjustments
Trading Applications
1. Trend Identification
- Volume pressure crossing above zero: buying pressure emerging
- Volume pressure crossing below zero: selling pressure emerging
- Column color: indicates pressure direction
- Column height: indicates pressure strength
- Signal line: confirms overall trend direction
2. Reversal Detection
- Peak triangles after extended trend: potential exhaustion
- Background highlighting: significant reversal points
- Volume pressure approaching marker lines: potential trend change
- Color shifts from bright to muted: decreasing pressure
- Readings beyond overbought/oversold levels: potential reversal zones
3. Pressure Analysis
- Breaking above previous high boundary: accelerating buying pressure
- Breaking below previous low boundary: accelerating selling pressure
- Special coloring (magenta/cyan): boundary breaks indicating strength
- Extreme readings: potential climactic buying/selling
4. Market Structure Assessment
- Consecutive higher peaks: strengthening buying structure
- Consecutive lower troughs: strengthening selling structure
- Peak comparisons: relative strength of pressure phases
- Boundary line steps: market structure levels
Optimization Guide
1. Volume Analysis Settings
- Volume MA Length: Default 25 provides balanced signals
- Lower values (10-15): More responsive, potentially noisier
- Higher values (30-50): Smoother, fewer false signals
- Signal Smoothing Length: Default 8 provides good balance
- Lower values: More responsive to pressure changes
- Higher values: Smoother trend identification
2. Threshold Settings
- Extreme Threshold Multiplier: Default 20.0
- Lower values: More signals, potentially more noise
- Higher values: Fewer signals, but more significant
- Overbought/Oversold Levels: Defaults at 20/-20
- Adjust based on instrument volatility
- Wider settings for more volatile instruments
3. Visual Customization
- Marker Line Colors: Adjust for visibility on your chart
- Peak Marker Color: Default yellow provides good contrast
- Enable/disable background highlights based on preference
- Consider log scale for instruments with wide volume ranges
4. Alert Settings
- Configure alerts for high buying pressure
- Configure alerts for high selling pressure
- Set additional alerts for zero-line crosses
- Consider timeframe when setting alert sensitivity
Best Practices
1. Signal Confirmation
- Wait for zero-line crosses to confirm pressure changes
- Look for peak formations to identify potential reversals
- Check for boundary breaks to confirm strong pressure
- Use with price action for entry/exit precision
- Consider extreme threshold crossings as significant signals
2. Timeframe Selection
- Lower timeframes: more signals, potential noise
- Higher timeframes: cleaner signals, less frequent
- Multiple timeframes: confirm signals across time horizons
- Match to your trading style and holding period
3. Market Context
- Strong buying phase: positive columns breaking above marker line
- Strong selling phase: negative columns breaking below marker line
- Columns approaching zero: potential pressure shift
- Columns beyond overbought/oversold: extreme conditions, potential reversal
4. Combining with Other Indicators
- Use with trend indicators for confirmation
- Pair with price action oscillators for divergence detection
- Combine with traditional volume indicators for validation
- Consider support/resistance levels with boundary lines
Advanced Trading Strategies
1. Boundary Break Strategy
- Enter long when volume pressure breaks above previous high marker line
- Enter short when volume pressure breaks below previous low marker line
- Use zero-line as initial stop-loss reference
- Take profits at formation of opposing peaks
2. Peak Trading Strategy
- Identify significant peaks with triangular markers
- Look for consecutive lower peaks in buying phases for shorting opportunities
- Look for consecutive higher troughs in selling phases for buying opportunities
- Use zero-line crosses as confirmation
3. Extreme Reading Strategy
- Look for volume pressure beyond overbought/oversold levels
- Watch for color changes and peak formations
- Enter counter-trend positions after confirmed peaks
- Use tight stops due to extreme market conditions
4. Volume Color Strategy
- Enter long when columns turn bright green (increasing buying pressure)
- Enter short when columns turn bright red (increasing selling pressure)
- Exit when color intensity fades (decreasing pressure)
- Use marker lines as dynamic support/resistance
Practical Analysis Examples
Bullish Market Scenario
- Volume pressure crosses above zero line
- Green columns grow in height and intensity
- High marker line forms steps upward
- Peak triangles appear at local maxima
- Background highlights appear at significant buying pressure peaks
Bearish Market Scenario
- Volume pressure crosses below zero line
- Red columns grow in depth and intensity
- Low marker line forms steps downward
- Peak triangles appear at local minima
- Background highlights appear at significant selling pressure troughs
Consolidation Scenario
- Volume pressure oscillates around zero line
- Column colors alternate frequently
- Marker lines remain relatively flat
- Few or no new peak highlights appear
- Pressure values remain small
Understanding Market Dynamics Through Market Push Meter
At its core, this indicator provides a unique lens to visualize market pressure through volume analysis:
1. Volume Imbalance: By separating and comparing buying volume (up candles) from selling volume (down candles), the indicator provides insights into which side is exerting more pressure in the market.
2. Normalized Pressure: The indicator normalizes volume pressure as a percentage of total volume, making it more comparable across different market conditions and instruments.
3. Dynamic Boundaries: The marker lines create a visual representation of the "high water marks" of pressure in both directions, helping to identify when markets are making new pressure extremes.
4. Exhaustion Signals: The peak detection system highlights moments where pressure has reached a local maximum or minimum, often precursors to reversals or consolidations.
Remember:
- Combine signals from volume pressure, marker lines, and peak formations
- Use appropriate timeframe settings for your trading style
- Customize the indicator to match your visual preferences and market
- Consider overall market conditions and correlate with price action
This indicator works best when:
- Used as part of a comprehensive trading system
- Combined with proper risk management
- Applied with an understanding of current market conditions
- Signals are confirmed by price action and other indicators
DISCLAIMER: This indicator and its signals are intended solely for educational and informational purposes. They do not constitute financial advice. Trading involves significant risk of loss. Always conduct your own analysis and consult with financial professionals before making trading decisions.

MACD Boundary PSA - CoffeeKillerMACD Boundary PSA - CoffeeKiller Indicator Guide
Welcome traders! This guide will walk you through the MACD Boundary PSA indicator, a powerful market analysis tool developed by CoffeeKiller that enhances the traditional MACD with advanced boundary detection and peak signaling features.
🔔 **Warning: This Indicator Has No Signal Line or MACD Line** 🔔 This indicator is my version of the MACD, that I use in conjunction with the Rev&Line indicator.
Core Concept: Enhanced MACD Analysis
The foundation of this indicator builds upon the classic Moving Average Convergence Divergence (MACD) indicator, adding boundary tracking and peak detection systems to provide clearer signals and market insights.
Histogram Bars: Market Momentum
- Positive Green Bars: Bullish momentum
- Negative Red Bars: Bearish momentum
- Color intensity varies based on momentum strength
- Special coloring for new high/low boundaries
Marker Lines: Dynamic Support/Resistance
- High Marker Line (Magenta): Tracks the highest point reached during a bullish phase
- Low Marker Line (Cyan): Tracks the lowest point reached during a bearish phase
- Acts as dynamic boundaries that help identify strength of current moves
Peak Detection System:
- Triangular markers identify significant local maxima and minima
- Background highlighting shows important momentum peaks
- Helps identify potential reversal points and momentum exhaustion
Core Components
1. MACD Calculation
- Customizable fast and slow moving averages
- Signal line smoothing options
- Flexible MA type selection (SMA or EMA)
- Custom source input options
2. Boundary Tracking System
- Automatic detection of highest values in bullish phases
- Automatic detection of lowest values in bearish phases
- Step-line visualization of boundaries
- Color-coded for easy identification
3. Peak Detection System
- Identification of local maxima and minima
- Background highlighting of significant peaks
- Triangle markers for peak visualization
- Zero-line cross detection for trend changes
4. Time Resolution Control
- Normal mode: calculations based on chart timeframe
- Custom resolution mode: calculations based on specified timeframe
Main Features
Time Resolution Settings
- Normal mode: calculations match your chart's timeframe
- Custom resolution mode: calculations based on specified timeframe
- Helps identify stronger signals from other timeframes
Visual Elements
- Color-coded histogram bars
- Dynamic marker lines for boundaries
- Peak triangles for significant turning points
- Background highlighting for peak identification
Signal Generation
- Zero-line crosses for trend change signals
- Boundary breaks for momentum strength
- Peak formation for potential reversals
- Color changes for momentum direction
Customization Options
- MA types and lengths
- Signal smoothing
- Color schemes
- Marker line visibility
- Peak background display options
Trading Applications
1. Trend Identification
- Histogram crossing above zero: bullish trend beginning
- Histogram crossing below zero: bearish trend beginning
- Histogram color: indicates momentum direction
- Consistent color intensity: trend strength
2. Reversal Detection
- Peak triangles after extended trend: potential exhaustion
- Background highlighting: significant reversal points
- Histogram approaching marker lines: potential trend change
- Color shifts from bright to muted: decreasing momentum
3. Momentum Analysis
- Histogram breaking above previous high boundary: accelerating bullish momentum
- Histogram breaking below previous low boundary: accelerating bearish momentum
- Special coloring (magenta/cyan): boundary breaks indicating strength
- Distance from zero line: overall momentum magnitude
4. Market Structure Assessment
- Consecutive higher peaks: strengthening bullish structure
- Consecutive lower troughs: strengthening bearish structure
- Peak comparisons: relative strength of momentum phases
- Boundary line steps: market structure levels
Optimization Guide
1. MACD Settings
- Fast Length: Shorter values (8-12) for responsiveness, longer values (20+) for smoother signals
- Slow Length: Shorter values (21-34) for more signals, longer values (72+) for major moves
- Default settings (22, 72, 9): balanced approach for most timeframes
- Consider using 8, 21, 5 for shorter timeframes and 34, 144, 5 for longer timeframes
2. MA Type Selection
- EMA: More responsive, follows price more closely
- SMA: Smoother, fewer false signals, potentially more lag
- Mix and match for oscillator and signal lines based on your preference
3. Time Resolution
- Match chart timeframe: for aligned analysis
- Use higher timeframe: for filtering signals
- Lower timeframe: for earlier entries but more noise
4. Color Customization
- Normal bullish/bearish colors: represent standard momentum
- High/low marker line colors: customize visibility
- Peak marker colors: adjust for your visual preference
- Consider chart background when selecting colors
Best Practices
1. Signal Confirmation
- Wait for zero-line crosses to confirm trend changes
- Look for peak formations to identify potential reversals
- Check for boundary breaks to confirm strong momentum
- Use custom timeframe option for higher timeframe confirmation
2. Timeframe Selection
- Lower timeframes: more signals, potential noise
- Higher timeframes: cleaner signals, less frequent
- Custom resolution: allows comparison across timeframes
- Consider using multiple timeframes for confirmation
3. Market Context
- Strong bullish phase: positive histogram breaking above marker line
- Strong bearish phase: negative histogram breaking below marker line
- Histogram approaching zero: potential trend change
- Peak formations: potential exhaustion points
4. Combining with Other Indicators
- Use with trend indicators for confirmation
- Pair with oscillators for overbought/oversold conditions
- Combine with volume analysis for validation
- Consider support/resistance levels with boundary lines
Advanced Trading Strategies
1. Boundary Break Strategy
- Enter long when histogram breaks above previous high marker line
- Enter short when histogram breaks below previous low marker line
- Use zero-line as initial stop-loss reference
- Take profits at formation of opposing peaks
2. Peak Trading Strategy
- Identify significant peaks with triangular markers
- Look for consecutive lower peaks in bullish phases for shorting opportunities
- Look for consecutive higher troughs in bearish phases for buying opportunities
- Use zero-line crosses as confirmation
3. Multi-Timeframe Strategy
- Use custom resolution for higher timeframe MACD trend
- Enter trades when both timeframes align
- Higher timeframe for trend direction
- Chart timeframe for precise entry
4. Histogram Color Strategy
- Enter long when histogram turns bright green (increasing momentum)
- Enter short when histogram turns bright red (increasing momentum)
- Exit when color intensity fades (decreasing momentum)
- Use marker lines as dynamic support/resistance
Practical Analysis Examples
Bullish Market Scenario
- Histogram crosses above zero line
- Green bars grow in height and intensity
- High marker line forms steps upward
- Peak triangles appear at local maxima
- Background highlights appear at significant momentum peaks
Bearish Market Scenario
- Histogram crosses below zero line
- Red bars grow in depth and intensity
- Low marker line forms steps downward
- Peak triangles appear at local minima
- Background highlights appear at significant momentum troughs
Consolidation Scenario
- Histogram oscillates around zero line
- Bar colors alternate frequently
- Marker lines remain relatively flat
- Few or no new peak highlights appear
- Histogram values remain small
Understanding Market Dynamics Through MACD Boundary PSA
At its core, this indicator provides a unique lens to visualize market momentum and boundaries:
1. Momentum Strength: The histogram height/depth shows the strength of current momentum, with color intensity providing additional context about acceleration or deceleration.
2. Dynamic Boundaries: The marker lines create a visual representation of the "high water marks" of momentum in both directions, helping to identify when markets are making new momentum extremes.
3. Exhaustion Signals: The peak detection system highlights moments where momentum has reached a local maximum or minimum, often precursors to reversals or consolidations.
4. Trend Confirmation: The histogram color and intensity provide instant feedback about the current trend direction and strength, with special colors highlighting particularly significant moves.
Remember:
- Combine signals from histogram, marker lines, and peak formations
- Use appropriate timeframe settings for your trading style
- Customize the indicator to match your visual preferences
- Consider market conditions and correlate with price action
This indicator works best when:
- Used as part of a comprehensive trading system
- Combined with proper risk management
- Applied with an understanding of current market conditions
- Signals are confirmed by price action and other indicators
**DISCLAIMER**: This indicator and its signals are intended solely for educational and informational purposes. They do not constitute financial advice. Trading involves significant risk of loss. Always conduct your own analysis and consult with financial professionals before making trading decisions.
